
Submitted:
25 July 2026
Posted:
28 July 2026
You are already at the latest version
Abstract
This study investigates the corrosion behavior of reinforced concrete samples with binary (Slag, SL; Fly Ash, FA) and ternary mixes (T1, T2) using electromigration to accelerate corrosion. Single rebar and three rebar specimens were subjected to 10% NaCl solutions, with corrosion parameters such as corrosion potential (Ecorr), corrosion current (Icorr), and concrete solution resistance (Rs) monitored over a period of 1300 days in a high-humidity laboratory setting. Following this phase, the specimens were moved to a controlled environmental chamber for further observation of corrosion parameters from day 1350 to day 1650. The galvanostatic pulse (GP) testing illustrated notable variations in corrosion activity based on the differing environmental conditions. The Icorr values showed greater fluctuation in the laboratory, indicating heightened corrosion activity, while they remained stable across all mixes in the environmental chamber. Similarly, the Rs and Ecorr measurements followed this pattern, displaying more consistency and positive values in the environmental chamber. The results highlight the crucial impact of stable humidity and temperature on corrosion behavior, emphasizing the importance of controlled environments for reliable long-term corrosion assessments in concrete.
Keywords:
electromigration
; high humidity environment
; controlled environmental chamber
; fly ash
; slag
; silica fume
; corrosion current
1. Introduction
Corrosion of steel in reinforced concrete (RC) structures is a leading cause of their deterioration [1,2,3]. This degradation is typically driven by either carbonation or chloride penetration, with chloride-induced corrosion generally considered more severe [4]. Whether due to chloride or carbonation, the progression of steel corrosion tends to be slow, complicating the process of gathering data that can inform decisions. The challenge is further compounded by the limited research available on the initiation and propagation of natural corrosion [5,6,7,8,9,10,11]. Existing studies suggest that significant damage in RC structures from natural corrosion often necessitates prolonged monitoring, with the rate of damage influenced by factors such as the concrete cover and composition.
Accelerated corrosion tests in RC structures are commonly used to replicate the steel corrosion process and predict related damage, such as bond loss between steel and concrete, cracking, spalling, and reduced stiffness [12,13,14,15,16,17]. This method speeds up the corrosion process compared to natural corrosion, allowing damage to be observed more quickly. These tests help study the initiation of corrosion and its effects on RC structures, including deformation, ductility, bond strength, and failure modes [18,19,20]. Due to the need for faster assessment of corrosion during the service life of RC structures, research is focusing on methods to reduce corrosion initiation time while closely replicating natural corrosion. In the propagation phase, the accumulation of corrosion products can cause cracks and spalling once critical levels are reached. Studies have accelerated this process by adding chlorides to concrete and applying electric currents to speed up corrosion at the reinforcement [21,22,23,24].
The temperature and humidity are critical factors that significantly affect the rate of corrosion in RC structures. In controlled environments, higher temperatures tend to accelerate the corrosion process by increasing the speed of electrochemical reactions involved in the degradation of steel reinforcement. This heightened reaction rate can lead to faster deterioration of the protective passive layer on steel, making it more vulnerable to corrosive agents. When humidity levels rise above 70-80%, the concrete absorbs more moisture, which enhances the formation of an electrolyte on the surface of the embedded steel [25]. This electrolyte plays a key role in facilitating the corrosion process by allowing the transfer of ions, thus creating a conducive environment for the breakdown of the steel’s protective layer. In essence, higher humidity increases the availability of moisture, a crucial element in the electrochemical reactions leading to corrosion.
In particularly humid environments, the abundance of moisture not only accelerates the initiation of corrosion but also accelerate the diffusion of aggressive agents like chlorides. Chlorides can penetrate the concrete and reach the steel reinforcement more quickly, leading to depassivation—the breakdown of the passive oxide layer that normally protects steel from corrosion. Once this layer is compromised, the corrosion process rapidly advances, exacerbating structural damage. As a result, prolonged exposure to high humidity and temperature can intensify various forms of corrosion-induced deterioration in RC structures. These include cracking of the concrete cover, spalling (the flaking or breaking off of concrete), and the reduction of the bond strength between steel and concrete. These effects lead to a significant decline in the structural integrity of the RC structures over time, making them more susceptible to failure under stress or load conditions [26].
In this study, four distinct concrete mixes were prepared. The anode length was adjusted by varying the length of the solution reservoir. For accelerating chloride penetration into the concrete, an electromigration technique was applied, building on insights from previous research [27]. Using this approach, corrosion in the reinforcing steel typically commenced within a few weeks to months. The progression of corrosion was monitored using the galvanostatic pulse (GP) method. Over a period of approximately 1,650 days, the rebar potential, concrete solution resistance, and corrosion current were consistently monitored to assess the corrosion process.
2. Experimental Details
The reinforced concrete samples were produced in two phases. Initially, two sets of binary mixes containing either Fly Ash (FA) or Slag (SL) were prepared. Subsequently, two additional sets comprising ternary mixes (see Table 1) were produced. Among these, three concrete mixes had a water-to-cementitious ratio (w/cm) of 0.41, while the fourth mix had a w/cm ratio of 0.37. The detailed compositions of these concrete mixes are presented in Table 1, with additional information available in reference [28].
The single rebar and three rebar sections had diameters of 0.47 cm (#3 rebars) and 0.63 cm (#4 rebars). Rebar segments were cut, leaving approximately 4 cm exposed outside the concrete. The rebars were wire-brushed and cleaned with hexane to remove grease before casting. The dimensions of the single rebar specimens were 30.5 cm x 12.7 cm x 7.6 cm, while the three rebar specimens measured 30.5 cm x 30.5 cm x 7.6 cm. Two single rebar specimens were made for each mix (SL, FA, T1, T2) with a 0.75 cm concrete cover, and one three rebar specimen per mix with a 1.0 cm concrete cover.
Before casting, the rebar ends were tapped, and stainless-steel screws were inserted to establish electrical contact for corrosion monitoring. Stainless steel or titanium mixed metal oxide (TiMMO) mesh was embedded on the top surface of each specimen (which became the bottom during the experiment), to serve as electrodes for accelerating chloride transport. Mesh lengths ranged from 5 to 15 cm, positioned along the center of the rebars. The samples were made at the Florida Department of Transportation's State Materials Office (SMO), and after a day, the molds were removed, and specimens cured in a fog room for at least 28 days.
Initially, the SL and FA mix samples were transported to FAU SeaTech campus, followed by the T1 and T2 samples. At FAU SeaTech, the specimens were stored in a high-humidity chamber to continue curing until the solution reservoirs were installed. Before reservoir installation, the specimens were transferred to a laboratory environment (65% RH, 21°C) for several days.
For the next phase, a plastic reservoir was adhered to the top surface of each sample using marine-grade adhesives, at least 40 days after casting. A 10% NaCl solution was added to the reservoirs to vary the corroding lengths by limiting the corrosion initiation area to the reservoir’s size. Figure 1 shows several single rebar and three rebar specimens with the reservoirs installed. The samples were kept in high humidity for 3 to 7 days before placing electrodes (stainless steel wire or TiMMO mesh) inside the reservoirs. Each specimen was then partially submerged in a saturated calcium hydroxide solution in transparent plastic containers, with about 1 cm of the concrete immersed. To minimize leaching during electromigration, the samples were placed on white acrylic perforated mesh.
Electrochemical measurements were carried out on selected specimens over approximately 1300 days to evaluate corrosion-related parameters, including corrosion potential, corrosion current, and concrete solution resistance. In a study by Hope and Ip on slag-based samples (50% slag, 50% Portland cement), after the initial corrosion propagation, the specimens underwent a drying process at 105ºC for 14 days, followed by immersion in air-saturated water for 14 days, and then air-drying in laboratory conditions for another 14 days [29]. After these treatments, the corrosion condition improved significantly, with more negative Ecorr values, reduced concrete solution resistance, and notably higher Icorr values compared to the initial measurements [29].
Building on the findings of Hope and Ip, the selected specimens were placed in an environmental chamber under controlled conditions on day 1350, to further analyze corrosion parameters during the extended corrosion propagation phase. Prior to this transfer, the weight and Ecorr values of the specimens were documented for future comparison. Table 2 provides details of the various single rebar and three rebar samples that were moved to the environmental chamber for this phase of the experiment.
Initially, all these specimens were kept in the environmental chamber at a temperature of 35ºC and 30% RH. After 14 days, the selected samples condition was changed to a high humidity environment (a temperature of 27ºC and 85% RH). Electrochemical measurement was carried out at least once a week (first four weeks) on these specimens starting from day 1350, and then at least once in every two/three months in a later period. Later, the humidity in the environmental chamber was increased to about 92% RH on day 1375, in order to improve the corrosion conditions of the selected specimens.
3. Methodology
The electromigration technique involved applying a potential difference using a power supply between the top and bottom mesh of reinforced concrete specimens. This setup created an electric field that drove chlorides in the NaCl solution into the concrete, targeting the embedded rebar. The negative terminal connected to the chloride solution reservoir and the positive terminal to the embedded mesh, with an acrylic mesh preventing direct contact with the concrete. Current levels were monitored across a 100-ohm resistor, and the system was periodically turned off to measure the rebar potential using a saturated calomel reference electrode (SCE). Electromigration continued until the rebar potential indicated corrosion initiation, defined as -0.200 Vsce or more negative. In most instances, the rebar potential after corrosion initiation was more negative than -0.200 Vsce. A potential value of -0.150 Vsce (~ -0.220 V vs. CSE) has been reported [27] as a value at which corrosion initiates on lab specimens not previously corroding. The applied potential was adjusted as needed to mitigate pitting risk, with additional measurements taken after periods of disconnection. Figure 2 shows the experimental setup used for electromigration process.
4. Electrochemical Measurements for Monitoring Corrosion
A SCE and a high-impedance voltmeter were used to regularly monitor the rebar potential during the corrosion propagation phase, following the electromigration process. Electrochemical characterization, employing techniques like LPR and EIS, was conducted in the early monitoring stages, with results detailed in reference [28].
After approximately 300 days of the corrosion propagation phase, GP tests were introduced as an alternative approach for evaluating the concrete solution resistance (Rs) and concrete polarization resistance (Rc) values. These measurements were taken about once a month during the corrosion propagation stage. Initially, a 10 μA galvanostatic pulse was applied, though the current was adjusted when necessary to maintain a polarization of less than 25 mV from the instant-on value (corrosion potential difference between the value after 0.2 seconds and the final on-value). The first set of tests lasted 140 seconds, but this was extended to 300 seconds in the second set, as some rebar slopes continued to change at 140 seconds, requiring a constant slope to calculate Rc. As a compromise, subsequent tests were conducted for 200 seconds.
The GP device first recorded the open circuit potential for several seconds before measuring rebar potential over time in 0.2-millisecond intervals after the pulse was applied. The Rs(GP) was determined using the rebar potential before the GP and the initial on-potential reading with the applied pulse. The Rc(GP) was then calculated using the difference between the initial on-potential and the rebar potential at 200 seconds, along with the applied current. The Rc values obtained from GP measurements were converted into corrosion current (Icorr) values, as the exact corroding area was not known. Faraday’s law was then applied to convert the Icorr values into mass loss estimates. The Icorr was calculated using the Stern-Geary equation: Icorr = B/Rp, where Rp (previously referred to as Rc) represents the polarization resistance, and B is the Stern-Geary constant, which varies between 13 and 52 mV depending on whether the steel is in a passive or active state of corrosion. For concrete, a common practice is to use 26 mV for actively corroding steel and 52 mV for passive steel, based on established research [30,31,32]. In this case, a value of 26 mV was selected.
5. Results and Discussion
The following section represents the evolution of Icorr over time, Rs over time, Icorr vs. Rs, and Ecorr vs. Icorr for the rebars embedded in concrete specimens prepared with different mixes, placed in the laboratory environment (high humidity environment) as well as in the environmental chamber (controlled high humidity environment). While the specimens were placed in the environmental chamber, eight readings (GP) were taken between day 1350 to day 1650. The first reading was taken at an environmental exposure of 35ºC and 30% RH, the next three readings were performed at an environmental exposure of 27ºC and 85% RH, and the last four set of readings were taken at an environmental exposure of 27ºC and 92% RH.
5.1. Evolution of Icorr with Time
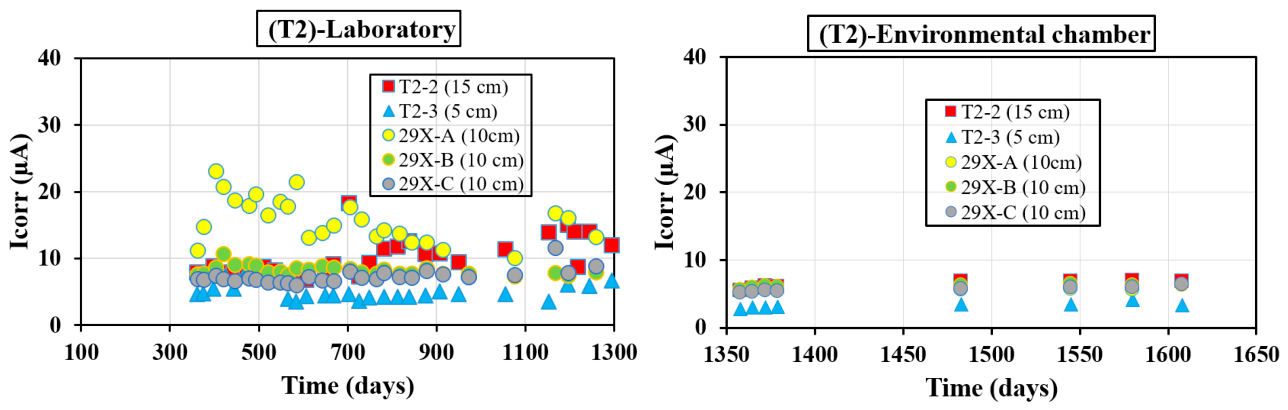
Figure 3 to Figure 6 shows the evolution of Icorr over time obtained from GP measurement for concrete mixes SL, FA, T1, and T2 cast with single rebar as well as three rebar. Figure 3 to Figure 6 contains two plots; the plot on the left indicates the evolution of Icorr over time when the selected specimens were placed in the laboratory environment (high humidity environment), the plot on the right shows the similar observations when the selected specimens were placed in the environmental chamber (controlled high humidity environment). The Icorr plots on the left represent values recorded from day 300 to day 1300, while the plots on the right show values measured from day 1350 to day 1650. In ease of comparison, specimens with similar concrete mixes were compared together.
Figure 3 illustrates the evolution of Icorr over time on selected single rebar and selected three rebar SL samples exposed to laboratory environment as well as on the environmental chamber. The selected single rebar specimens were SL-7 (5 cm solution reservoir), SL-8 (5 cm solution reservoir), and selected three rebar specimen was 15X (10 cm solution reservoir). In the laboratory environment, Icorr fluctuates over time, ranged from 6.2-19.5 μA for SL-7, 8.6-28.7 μA for SL-8, and 5.7-26.9 μA for rebars embedded in 15X specimens. While the samples were placed in the environmental chamber, Icorr values ranged from 7.2-8.2 μA for SL-7, 8.9-12.1 μA for SL-8, and 6.6-13.2 μA for rebars embedded in 15X specimens. Icorr values showed very little fluctuations over time for all these specimens while being in the environmental chamber, except for rebar 15X-C in which Icorr reached a peak value of 35.7 μA on day 1380.
Figure 4 depicts the time-dependent variation of Icorr in selected single rebar and selected three rebar FA specimens exposed to both a laboratory setting and an environmental chamber. The single rebar samples analyzed were FA-4 and FA-6, each containing a 7.5 cm solution reservoir, while the three rebar specimen selected was 21X, featuring a 10 cm solution reservoir. In the laboratory environment, Icorr values fluctuated considerably, ranging from 7.4 to 28.4 μA for FA-4, 6.1 to 39.5 μA for FA-6, and 6.2 to 42.8 μA for the rebars in the 21X specimen. Conversely, when placed in the environmental chamber, the Icorr readings were more stable, with values spanning 10.4 to 30.7 μA for FA-4, 9.2 to 12.5 μA for FA-6, and 6.8 to 13.3 μA for the 21X rebars. Notably, in the controlled chamber, fluctuations were minimal across all specimens, except for FA-4, which exhibited a peak Icorr of 30.7 μA on day 1365.
Figure 5 presents the temporal progression of Icorr for selected single rebar and selected three rebar T1 specimens subjected to both a laboratory environment and an environmental chamber. The single rebar specimens chosen for analysis were T1-7, with a 5 cm solution reservoir, and T1-9, containing a 10 cm solution reservoir. Additionally, the three rebar specimen examined was 27X, also with a 10 cm solution reservoir. In the laboratory environment, Icorr exhibited noticeable fluctuations, with values ranging from 4.3 to 12.4 μA for T1-7, 10.9 to 22.3 μA for T1-9, and 7.5 to 42.8 μA for the rebars embedded in the 27X specimen. However, when these samples were placed in the environmental chamber, a more stable trend was observed across the specimens, with the exception of T1-9, where Icorr showed a continuous upward trend over time. Within the environmental chamber, Icorr values for T1-7 remained within 5.0 to 5.8 μA, T1-9 ranged from 7.0 to 9.9 μA, and the rebars in 27X exhibited readings between 7.8 and 10.5 μA.
Figure 6 highlights the progression of Icorr over time for selected single rebar and selected three rebar T2 specimens exposed to both laboratory conditions and an environmental chamber. The single rebar specimens analyzed were T2-2, featuring a 15 cm solution reservoir, and T2-3, equipped with a 5 cm solution reservoir. Additionally, the selected three rebar specimen was 29X, with a 10 cm solution reservoir. In the laboratory setting, Icorr displayed noticeable fluctuations, ranging between 6.6 and 18.3 μA for T2-2, 3.5 and 8.2 μA for T2-3, and 6.0 to 23.1 μA for the rebars in 29X specimen. When transferred to the environmental chamber, the Icorr values for the 29X rebars stabilized, following a plateau trend. In contrast, both T2-2 and T2-3 exhibited a steadily increasing Icorr over time. Within the chamber, Icorr readings for T2-2 were between 5.5 and 6.9 μA, for T2-3 between 2.8 and 4.1 μA, and for the 29X rebars, the values ranged from 5.1 to 6.5 μA.
From Figure 3 to Figure 6, it has been observed that Icorr fluctuates significantly in the laboratory, with wider ranges, while in the environmental chamber, the values are more consistent, with occasional peaks. Each figure (Figure 3 to Figure 6) compares the time-dependent Icorr values across the two environments for specific concrete mixes and rebar configurations. The observed variations in Icorr measured in the laboratory environment can be attributed to the dynamic nature of the wet-dry cycles that the specimens are subjected to, which can influence the rate of corrosion. In contrast, the more controlled and consistent conditions in the environmental chamber result in less fluctuation in the Icorr measurements [33]. These findings suggest that laboratory testing, while essential for understanding corrosion mechanisms, may not always accurately represent the long-term corrosion behavior of reinforced concrete structures in real-world environments [34].
Figure 3.
Icorr with time on selected single rebar and selected three rebar SL samples exposed to the laboratory environment as well as on the environmental chamber.
Figure 3.
Icorr with time on selected single rebar and selected three rebar SL samples exposed to the laboratory environment as well as on the environmental chamber.
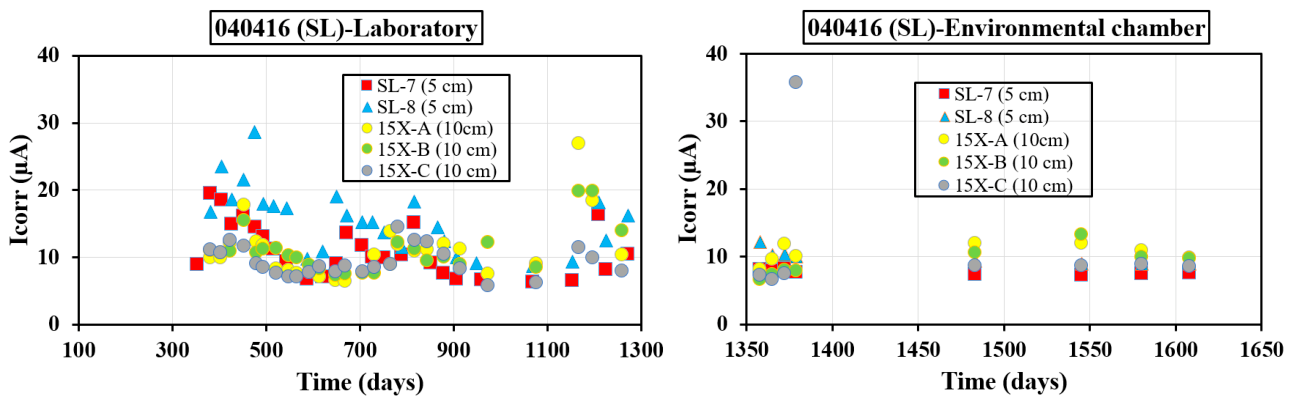
Figure 4.
Icorr with time on selected single rebar and selected three rebar FA samples exposed to the laboratory environment as well as on the environmental chamber.
Figure 4.
Icorr with time on selected single rebar and selected three rebar FA samples exposed to the laboratory environment as well as on the environmental chamber.
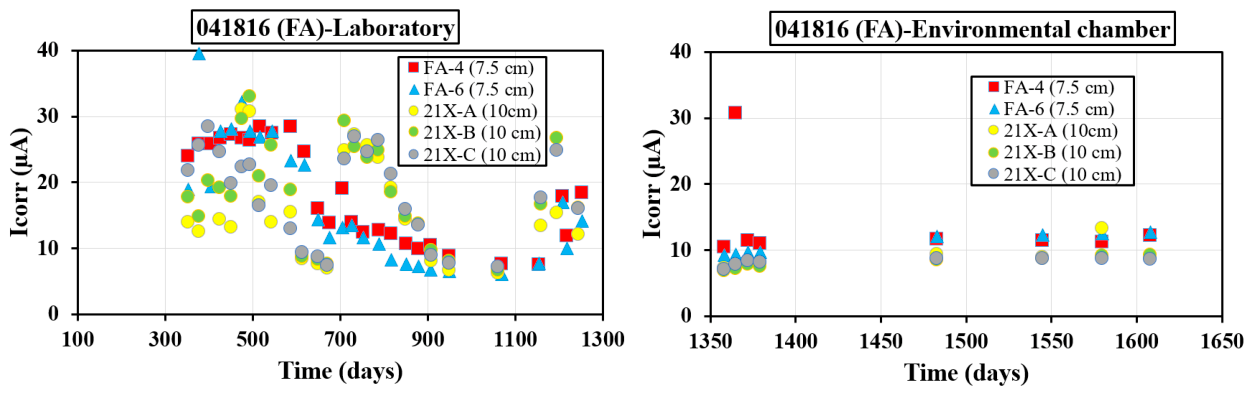
Figure 5.
Icorr with time on selected single rebar and selected three rebar T1 samples exposed to the laboratory environment as well as on the environmental chamber.
Figure 5.
Icorr with time on selected single rebar and selected three rebar T1 samples exposed to the laboratory environment as well as on the environmental chamber.
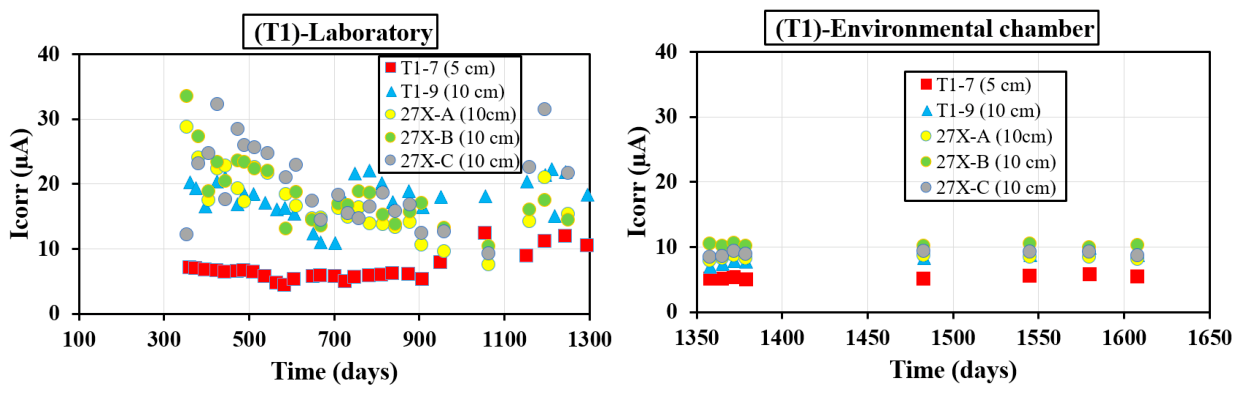
Figure 6.
Icorr with time on selected single rebar and selected three rebar T2 samples exposed to the laboratory environment as well as on the environmental chamber.
Figure 6.
Icorr with time on selected single rebar and selected three rebar T2 samples exposed to the laboratory environment as well as on the environmental chamber.
5.2. Evolution of Rs with Time
Figure 7 through Figure 10 illustrate the temporal evolution of Rs, derived from GP measurements, for concrete mixes SL, FA, T1, and T2, each incorporating both single rebar and three rebar specimens. Figure 7 to Figure 10 comprises two plots: the left-hand plot tracks the changes in Rs over time for specimens placed in a high-humidity laboratory environment, while the right-hand plot captures similar measurements for specimens stored in an environmental chamber with controlled high humidity. The Rs values in the left-hand plots were recorded between days 300 and day 1300, whereas the right-hand plots display data from days 1350 to day 1650. To facilitate comparison, specimens with identical concrete mixes were grouped and analyzed together.
Figure 7 depicts the evolution of Rs over time for selected single rebar and selected three rebar SL samples exposed to both a laboratory environment and an environmental chamber. In the laboratory environment, Rs exhibited noticeable fluctuations for the SL-7 and SL-8 samples, ranging from 3.7 to 12.6 kΩ for SL-7 and 4.6 to 13.4 kΩ for SL-8. Conversely, the Rs values for the rebars in the 15X specimens remained relatively stable, fluctuating only between 0.6 and 1.4 kΩ. When placed in the environmental chamber, Rs values for SL-7 and SL-8 displayed an upward trend over time, ranging from 4.8 to 6.2 kΩ for SL-7 and 5.6 to 8.1 kΩ for SL-8. In contrast, the Rs values for the rebars embedded in the 15X specimens showed a plateau trend, remaining between 1.0 and 1.5 kΩ.
Figure 8 illustrates the progression of Rs over time for selected single rebar and selected three rebar FA specimens exposed to both a laboratory environment and an environmental chamber. In the laboratory setting, Rs exhibited notable fluctuations, with values ranging from 1.7 to 4.5 kΩ for FA-4, 1.5 to 4.4 kΩ for FA-6, and 0.7 to 1.8 kΩ for the rebars embedded in the 21X specimens. However, when these samples were transferred to the environmental chamber, Rs values demonstrated a more stable plateau trend. In the environmental chamber, Rs ranged from 2.7 to 3.1 kΩ for FA-4, 2.6 to 3.0 kΩ for FA-6, and 1.3 to 1.7 kΩ for the rebars embedded in the 21X specimens.
Figure 9 shows the evolution of Rs over time for selected single rebar and selected three rebar T1 specimens exposed to both a laboratory setting and an environmental chamber. In the laboratory environment, Rs showed variability, with values ranging between 5.1 and 10.1 kΩ for T1-7, 2.6 and 4.2 kΩ for T1-9, and 1.3 and 3.7 kΩ for the rebars embedded in 27X specimens. When placed in the environmental chamber, Rs values exhibited minor fluctuations for T1-7 and T1-9, with ranges of 8.1 to 9.2 kΩ for T1-7 and 4.4 to 5.7 kΩ for T1-9. In contrast, Rs for the rebars in 27X specimen followed a plateau pattern, remaining between 3.0 and 3.8 kΩ throughout the monitoring period in the environmental chamber.
Figure 10 highlights the evolution of Rs over time for selected single rebar and selected three rebar T2 specimens subjected to both a laboratory environment and an environmental chamber. In the laboratory setting, Rs exhibited fluctuations, ranging from 3.3 to 5.1 kΩ for T2-2, 7.2 to 13.1 kΩ for T2-3, and 2.3 to 3.6 kΩ for the rebars in the 29X specimen. In the environmental chamber, a notable drop in Rs for T2-3 was recorded on day 1346, where it decreased from 11.6 kΩ to 8.9 kΩ, and the Rs values for T2-3 ranged between 8.9 and 11.6 kΩ. The T2-2 specimen showed a slightly declining Rs trend over time, while the rebars in the 29X specimen followed a plateau pattern. The Rs values for T2-2 ranged from 4.1 to 5.3 kΩ, whereas for the rebars in 29X, Rs remained between 3.0 and 3.8 kΩ.
Figure 7.
Rs with time on selected single rebar and selected three rebar SL samples exposed to the laboratory environment as well as on the environmental chamber.
Figure 7.
Rs with time on selected single rebar and selected three rebar SL samples exposed to the laboratory environment as well as on the environmental chamber.
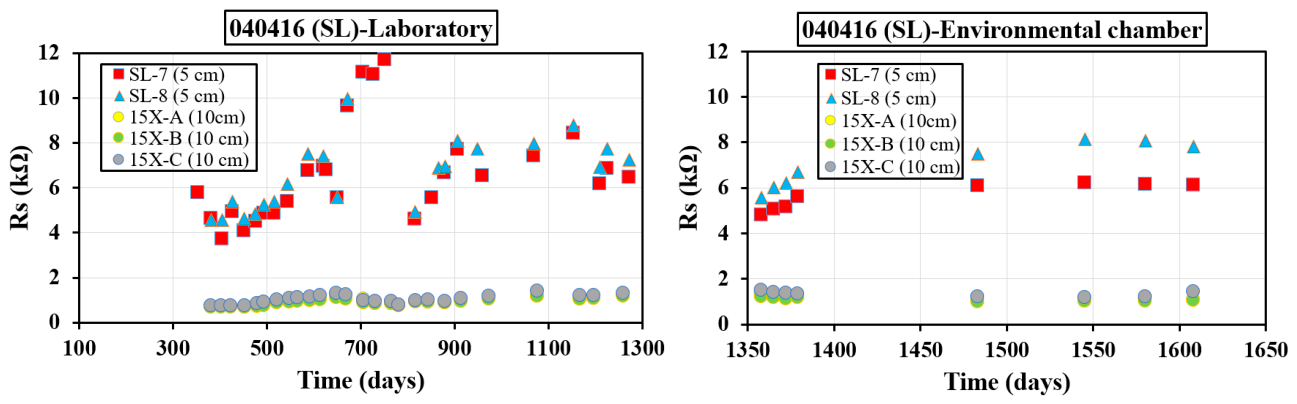
Figure 8.
Rs with time on selected single rebar and selected three rebar FA samples exposed to the laboratory environment as well as on the environmental chamber.
Figure 8.
Rs with time on selected single rebar and selected three rebar FA samples exposed to the laboratory environment as well as on the environmental chamber.
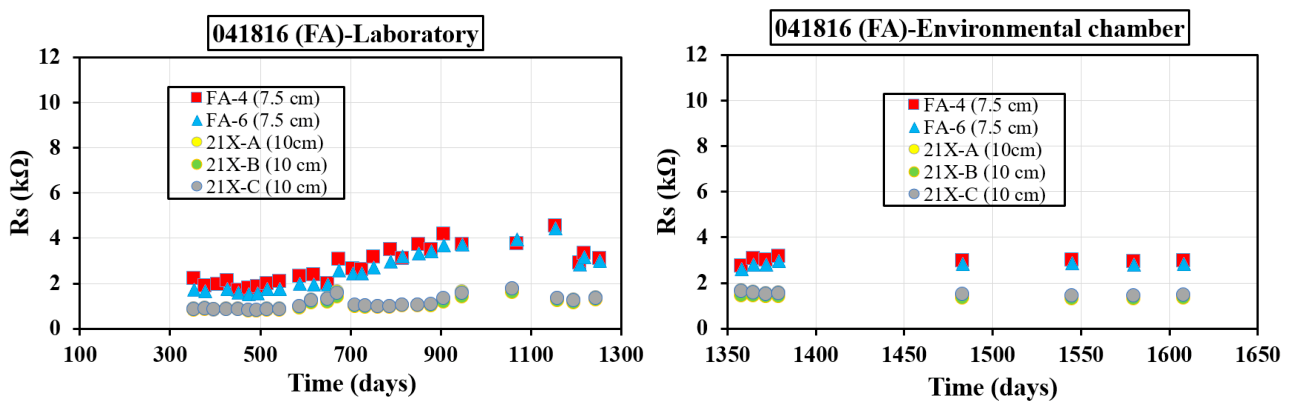
Figure 9.
Rs with time on selected single rebar and selected three rebar T1 samples exposed to the laboratory environment as well as on the environmental chamber.
Figure 9.
Rs with time on selected single rebar and selected three rebar T1 samples exposed to the laboratory environment as well as on the environmental chamber.
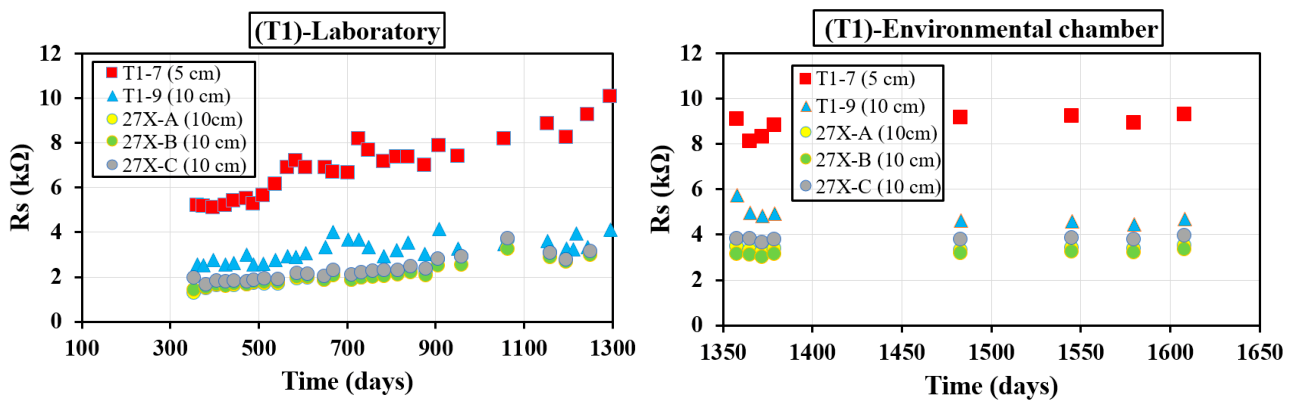
Figure 10.
Rs with time on selected single rebar and selected three rebar T2 samples exposed to the laboratory environment as well as on the environmental chamber.
Figure 10.
Rs with time on selected single rebar and selected three rebar T2 samples exposed to the laboratory environment as well as on the environmental chamber.
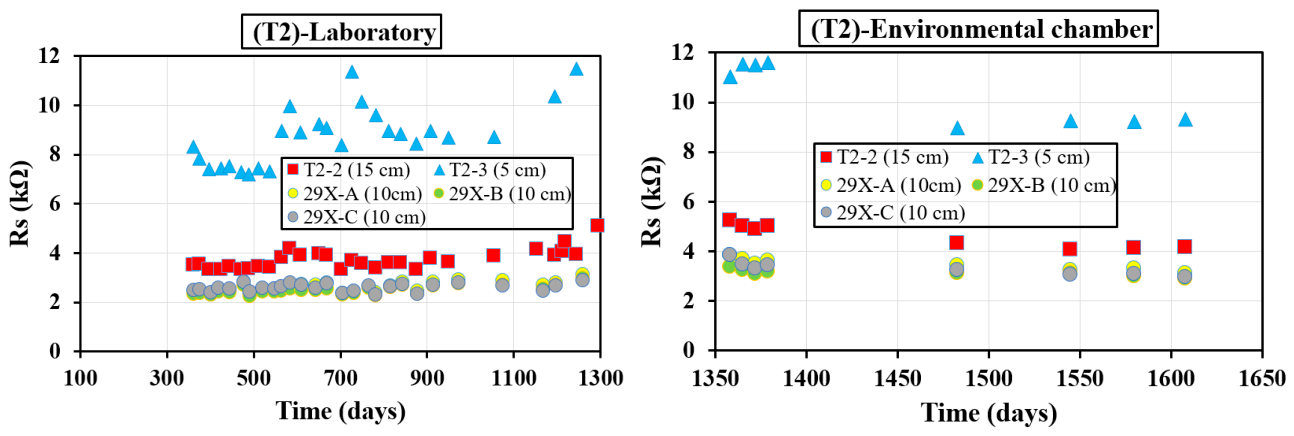
The laboratory readings (days 300-1300) show more fluctuation in Rs values, while the environmental chamber readings (days 1350-1650) exhibit more stable trends. In the environmental chamber, Rs generally increased or plateaued, with fewer fluctuations compared to the laboratory setting. Each figure (Figure 7 to Figure 10) compares Rs values for different concrete mixes, demonstrating more consistent trends in the controlled chamber, while the laboratory environment showed significant variability. The increased stability of the environmental chamber readings can be attributed to the more controlled conditions, which reduce the confounding factors that influence Rs in the laboratory [35]. This finding underscores the importance of using a standardized environment to obtain reliable and consistent electrical resistance measurements for concrete durability assessments.
5.3. Icorr vs. Rs
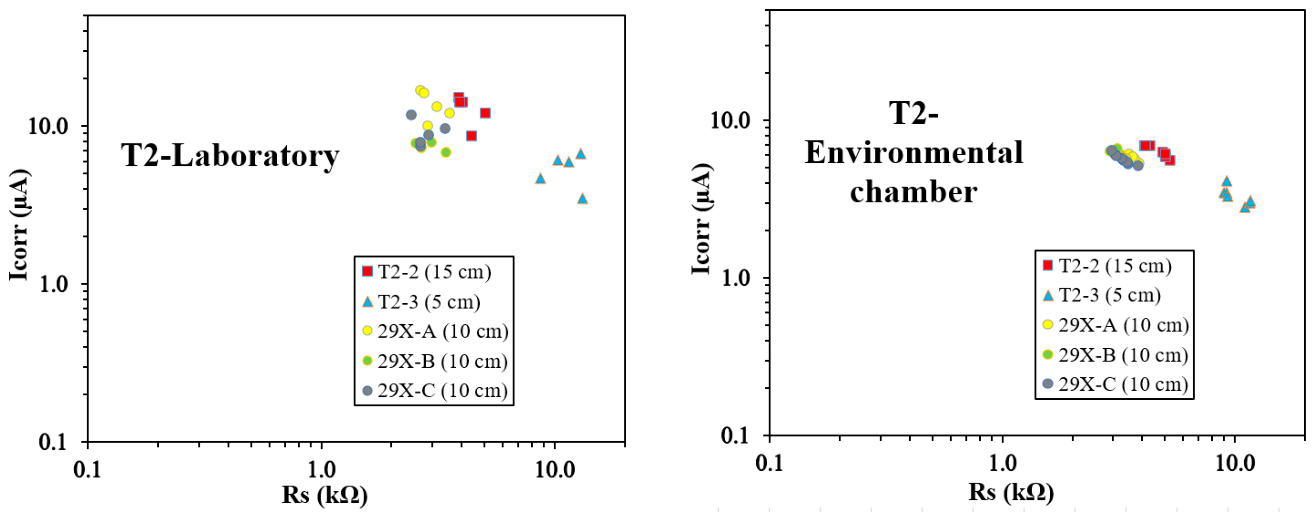
Figure 11 to Figure 14 present Icorr vs. Rs plots derived from GP measurements for concrete mixes SL, FA, T1, and T2, each incorporating both single rebar and three rebar samples. Figure 11 to Figure 14 includes two plots: the left-hand plot illustrates the Icorr vs. Rs relationship for specimens in a laboratory environment, with five sets of measurements taken prior to transferring the specimens to the environmental chamber. The right-hand plot shows similar data for the specimens placed in a controlled high-humidity environment within the chamber. The plots on the left capture readings from day 300 to day 1300, while the right-hand plots display data collected from day 1350 to day 1650. To facilitate comparison, specimens with the same concrete mixes were grouped and analyzed together.
Figure 11 displays the Icorr vs. Rs plots for selected single rebar and selected three rebar SL samples exposed to both a laboratory environment and an environmental chamber. In the laboratory setting, the Rs values for the SL single rebar specimens ranged from 6.2 to 9.6 kΩ, while Icorr values varied from 6.5 to 18.1 μA. For the SL three rebar specimens, Rs measured between 1.0 and 1.4 kΩ, with Icorr ranging from 6.2 to 27.0 μA. Upon transferring the samples to the environmental chamber, the Rs values for the SL single rebar specimens decreased to a range of 4.8 to 8.1 kΩ, and Icorr values were recorded between 7.3 and 12.1 μA. In contrast, the SL three rebar specimens showed Rs values between 1.0 and 1.5 kΩ, with Icorr values ranging from 6.6 to 35.8 μA. Notably, a reduction in variability was observed for both the single rebar and three rebar SL specimens when placed in the environmental chamber.
Figure 12 presents the Icorr vs. Rs plots for selected single rebar and selected three rebar FA samples subjected to both a laboratory environment and an environmental chamber. In the laboratory setting, the Rs values for the FA single rebar specimens ranged from 2.8 to 4.5 kΩ, with Icorr values varying from 7.4 to 18.4 μA. In contrast, the Rs for the FA three rebar specimens measured between 1.2 and 1.8 kΩ, and Icorr ranged from 6.2 to 26.6 μA. After the samples were placed in the environmental chamber, the Rs values for the FA single rebar specimens decreased to a range of 2.6 to 3.2 kΩ, while Icorr values increased to between 9.2 and 30.7 μA. For the FA three rebar specimens, Rs values ranged from 1.3 to 1.7 kΩ, and Icorr ranged from 6.8 to 13.3 μA. Notably, both the single rebar and three rebar FA specimens exhibited a decrease in variability when stored in the environmental chamber.
Figure 13 illustrates the Icorr vs. Rs plots for selected single rebar and selected three rebar T1 samples that were exposed to both a laboratory environment and an environmental chamber. In the laboratory setting, the Rs values for the T1 single rebar specimens ranged from 3.2 to 10.1 kΩ, while Icorr values varied between 8.9 and 22.3 μA. For the T1 three rebar specimens, Rs ranged from 2.7 to 3.8 kΩ, with Icorr values spanning from 7.8 to 31.5 μA. When the samples were placed in the environmental chamber, the Rs values for the T1 single rebar specimens ranged from 4.4 to 9.2 kΩ, and Icorr values fell between 5.0 and 9.9 μA. Meanwhile, the T1 three rebar specimens showed Rs values from 3.0 to 3.8 kΩ and Icorr values ranging from 7.8 to 10.6 μA. Interestingly, both the single rebar and three rebar T1 specimens demonstrated a decrease in variability during their monitoring period in the environmental chamber.
Figure 14 shows the Icorr vs. Rs plots for selected single rebar and selected three rebar T2 samples exposed to both a laboratory environment and an environmental chamber. In the laboratory setting, the Rs values for the T2 single rebar specimens ranged from 3.9 to 13.1 kΩ, while the Icorr values varied from 3.5 to 15.0 μA. In contrast, the T2 three rebar specimens exhibited Rs values between 2.5 and 3.8 kΩ and Icorr values ranging from 5.1 to 16.7 μA. After being placed in the environmental chamber, the Rs values for T2 single rebar specimens measured between 4.1 and 11.6 kΩ, with Icorr values decreasing to a range of 2.8 to 6.9 μA. Meanwhile, the T2 three rebar specimens showed Rs values from 3.0 to 3.9 kΩ and Icorr values ranging from 5.1 to 6.5 μA. Notably, a reduction in variability was observed for both the single rebar and three rebar T2 specimens while being placed in the environmental chamber.
In the laboratory, Rs and Icorr values showed higher variability across all mixes, while the environmental chamber results demonstrated more consistent and stable trends. Across all figures (Figure 11 to Figure 14), Rs typically decreased slightly in the environmental chamber, while Icorr values remained lower and less variable, indicating reduced corrosion activity in the controlled environment compared to the fluctuating laboratory conditions. The readings reveal that the environmental chamber provided a more stable and consistent setting for evaluating the corrosion resistance of the various concrete mixes, with lower variability in the measured parameters compared to the laboratory environment [36,37].
Figure 11.
Icorr vs. Rs plot on selected single rebar and selected three rebar SL samples exposed to the laboratory environment as well as on the environmental chamber.
Figure 11.
Icorr vs. Rs plot on selected single rebar and selected three rebar SL samples exposed to the laboratory environment as well as on the environmental chamber.
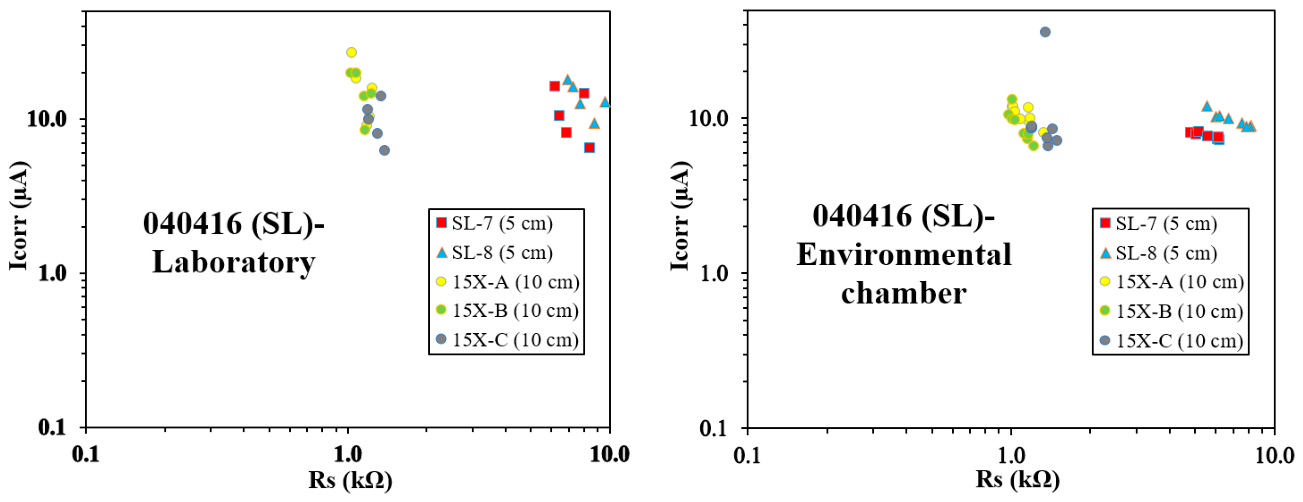
Figure 12.
Icorr vs. Rs plot on selected single rebar and selected three rebar FA samples exposed to the laboratory environment as well as on the environmental chamber.
Figure 12.
Icorr vs. Rs plot on selected single rebar and selected three rebar FA samples exposed to the laboratory environment as well as on the environmental chamber.
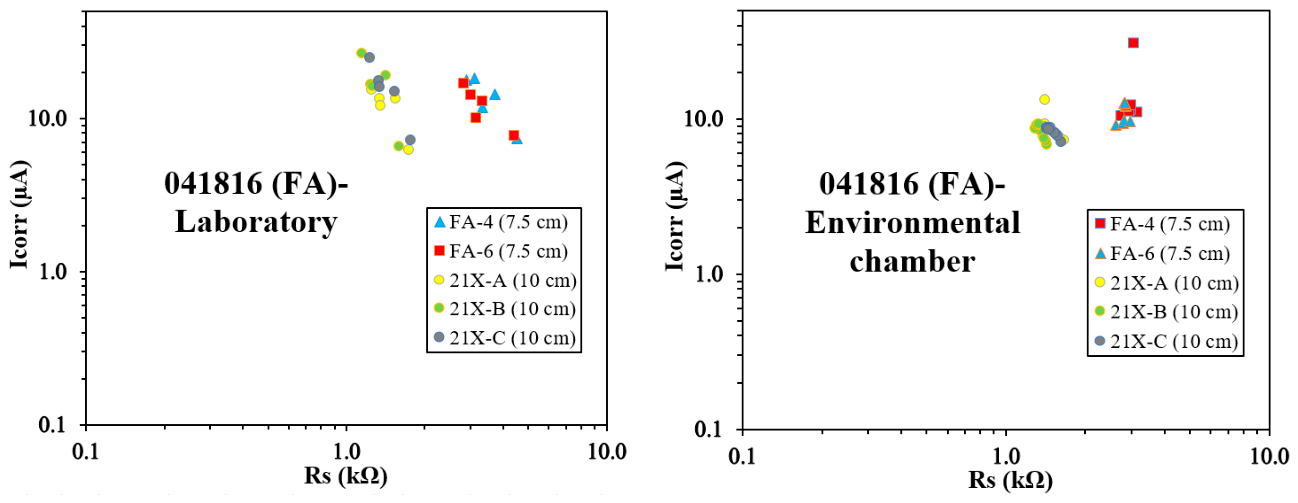
Figure 13.
Icorr vs. Rs plot on selected single rebar and selected three rebar T1 samples exposed to the laboratory environment as well as on the environmental chamber.
Figure 13.
Icorr vs. Rs plot on selected single rebar and selected three rebar T1 samples exposed to the laboratory environment as well as on the environmental chamber.
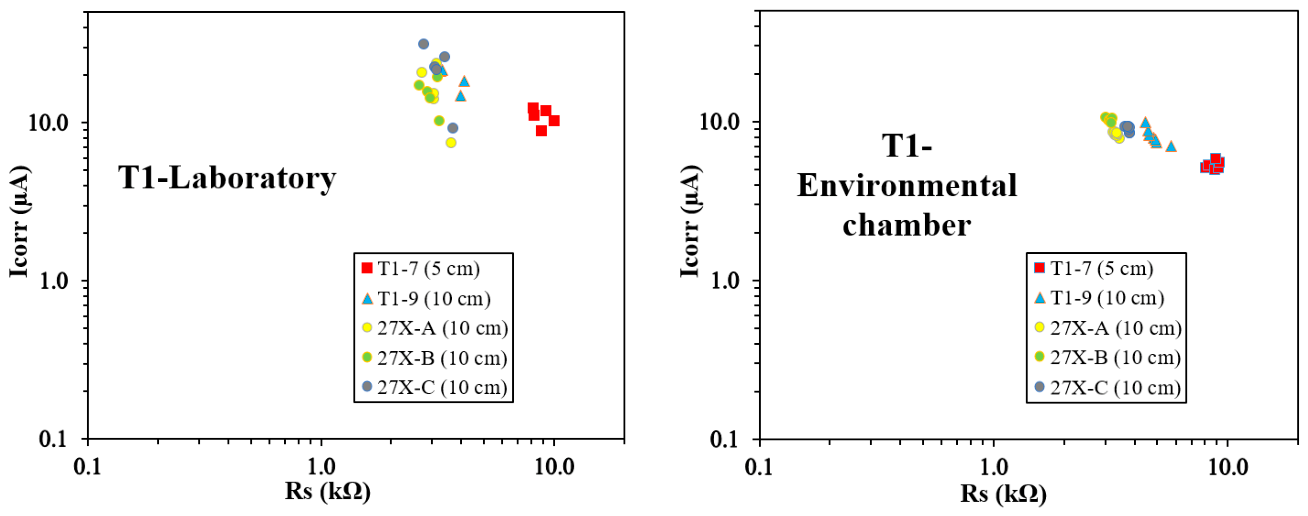
Figure 14.
Icorr vs. Rs plot on selected single rebar and selected three rebar T2 samples exposed to the laboratory environment as well as on the environmental chamber.
Figure 14.
Icorr vs. Rs plot on selected single rebar and selected three rebar T2 samples exposed to the laboratory environment as well as on the environmental chamber.
5.4. Ecorr vs. Icorr
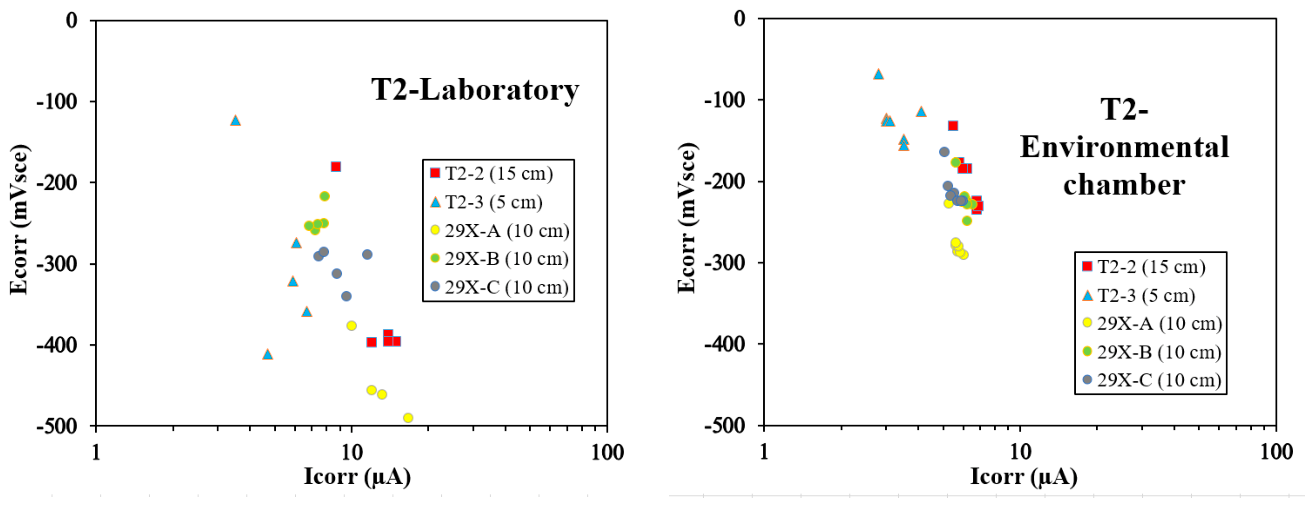
Figure 15 through Figure 18 display the Ecorr vs. Icorr plots obtained from GP measurements for concrete mixes SL, FA, T1, and T2, which include both single rebar and three rebar samples. Figure 15 to Figure 18 consists of two plots: the left plot illustrates the evolution of Ecorr vs. Icorr for specimens in a laboratory environment, with five sets of measurements taken before transferring the specimens to the environmental chamber. The right plot presents similar data for the specimens placed in a controlled high-humidity environment within the chamber. The Ecorr vs. Icorr plots on the left capture values recorded from day 300 to day 1300, while those on the right display values measured from day 1350 to day 1650. For clarity in comparison, specimens with identical concrete mixes were grouped together.
Figure 15 presents the Ecorr vs. Icorr plots for selected single rebar and selected three rebar SL samples subjected to both a laboratory environment and an environmental chamber. In the laboratory setting, the measured Ecorr values ranged from -454.8 mV to -114.8 mV, while the Icorr values varied from 6.2 μA to 26.9 μA. When the samples were transferred to the environmental chamber, Ecorr values shifted to a range of -355.8 mV to -67.6 mV, with Icorr values increasing from 6.6 μA to 35.8 μA. Notably, within the environmental chamber, several readings showed similar Ecorr; however, Icorr generally decreased compared to the values recorded in the laboratory environment. Additionally, it was observed that the variability in readings for the SL specimens diminished while in the environmental chamber.
Figure 16 depicts the Ecorr vs. Icorr plots for selected single rebar and selected three rebar FA samples that were exposed to both a laboratory environment and an environmental chamber. In the laboratory setting, the measured Ecorr values ranged from -424.8 mV to -87.3 mV, while the Icorr values varied from 6.2 μA to 26.6 μA. Upon transferring the samples to the environmental chamber, the Ecorr values shifted to a range of -285.9 mV to -156.2 mV, with Icorr values increasing from 6.8 μA to 30.7 μA. It was noted that most of the readings for the FA specimens in the environmental chamber exhibited more positive Ecorr values and lower Icorr values. Additionally, there was a marked reduction in variability for the rebars in the FA specimens while being placed in the environmental chamber.
Figure 17 illustrates the Ecorr vs. Icorr plots for selected single rebar and selected three rebar T1 samples subjected to both laboratory conditions and an environmental chamber. In the laboratory setting, the measured Ecorr values ranged from -462.2 mV to -117.1 mV, while the Icorr values varied from 7.5 μA to 31.5 μA. After placing the samples in the environmental chamber, the Ecorr values shifted to a range of -221.2 mV to -101.4 mV, and Icorr values decreased to between 5.0 μA and 10.6 μA. Most T1 specimens exhibited a trend toward more positive Ecorr values and lower Icorr values upon their transition to the environmental chamber. Additionally, a noticeable reduction in variability was observed among the T1 rebars while they were stored in the environmental chamber.
Figure 18 shows the Ecorr vs. Icorr plots for selected single rebar and selected three rebar T2 samples that were examined under both laboratory conditions and in an environmental chamber. In the laboratory setting, the recorded Ecorr values ranged from -501.2 mV to -122.6 mV, while the Icorr values spanned from 3.5 μA to 16.7 μA. When the samples were transferred to the environmental chamber, the Ecorr values shifted to a range of -291.3 mV to -67.8 mV, and the Icorr values decreased to between 2.8 μA and 6.9 μA. Notably, the majority of T2 specimens displayed more positive Ecorr values and reduced Icorr values in the environmental chamber. Additionally, a significant reduction in variability was observed among the rebars in the T2 specimens while being placed in the controlled environment.
In the laboratory, Ecorr values were generally more negative, and Icorr values showed greater variability, indicating higher corrosion activity. Once placed in the controlled environmental chamber, Ecorr values became more positive, and Icorr values decreased, suggesting reduced corrosion rates. Across all concrete mixes, variability in both Ecorr and Icorr significantly diminished in the environmental chamber, highlighting the stabilizing effect of controlled conditions on corrosion measurements. The experimental results showed that the corrosion systems examined in the study provide anti-corrosion protection on steel rebars against corrosion comparing with the reference group. The experimental results align with the findings of previous research, which have shown that corrosion potential and corrosion rate measurements may not accurately reflect the true corrosion state of reinforced concrete in a submerged/high humidity environment [38].
Figure 15.
Ecorr vs. Icorr plot on selected single rebar and selected three rebar SL samples exposed to the laboratory environment as well as on the environmental chamber.
Figure 15.
Ecorr vs. Icorr plot on selected single rebar and selected three rebar SL samples exposed to the laboratory environment as well as on the environmental chamber.
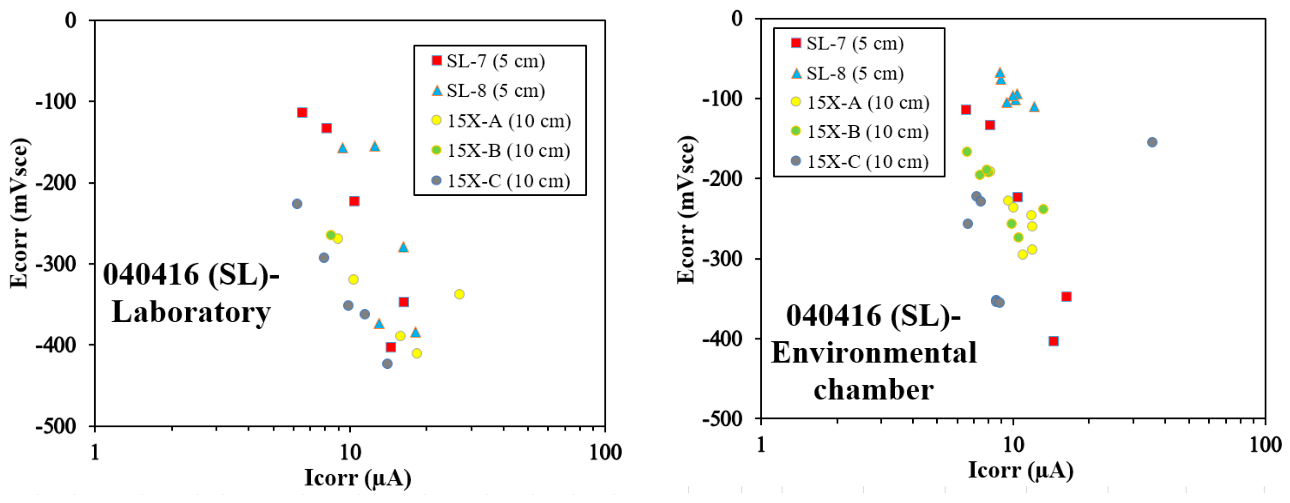
Figure 16.
Ecorr vs. Icorr plot on selected single rebar and selected three rebar FA samples exposed to the laboratory environment as well as on the environmental chamber.
Figure 16.
Ecorr vs. Icorr plot on selected single rebar and selected three rebar FA samples exposed to the laboratory environment as well as on the environmental chamber.
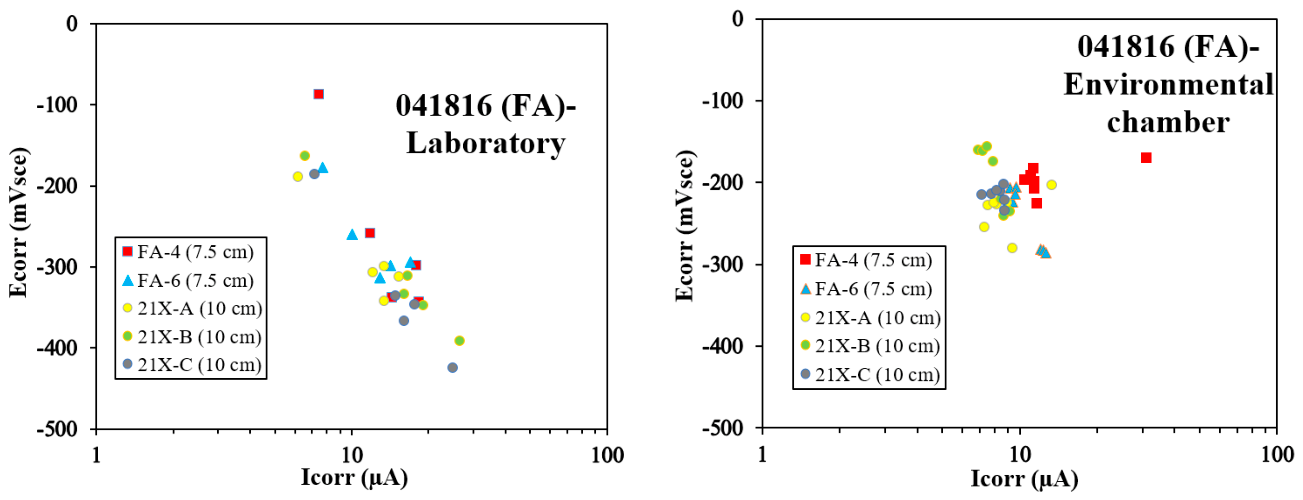
Figure 17.
Ecorr vs. Icorr plot on selected single rebar and selected three rebar T1 samples exposed to the laboratory environment as well as on the environmental chamber.
Figure 17.
Ecorr vs. Icorr plot on selected single rebar and selected three rebar T1 samples exposed to the laboratory environment as well as on the environmental chamber.
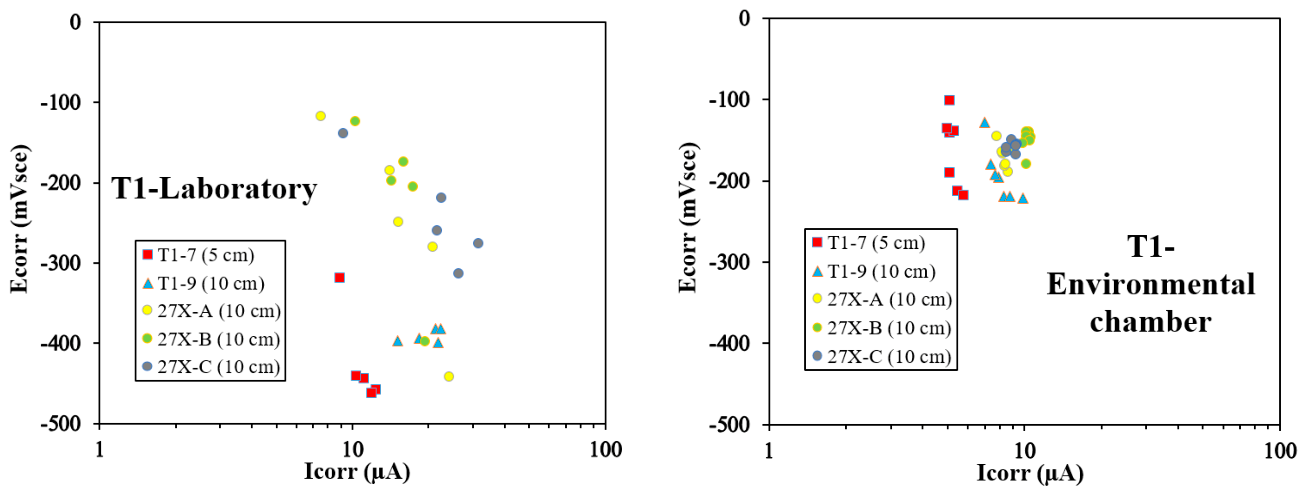
Figure 18.
Ecorr vs. Icorr plot on selected single rebar and selected three rebar T2 samples exposed to the laboratory environment as well as on the environmental chamber.
Figure 18.
Ecorr vs. Icorr plot on selected single rebar and selected three rebar T2 samples exposed to the laboratory environment as well as on the environmental chamber.
6. General Discussion
During the observation of corrosion progression, GP tests effectively monitored variations in Icorr, Rs, and Ecorr values. These parameters fluctuated as the corrosion process advanced. The findings from reinforced concrete corrosion studies demonstrated that parameters like Icorr, Rs, and Ecorr exhibit varying behaviors depending on the concrete mix and environmental conditions.
The Icorr provides a direct indication of the corrosion rate of embedded rebar. Across different concrete mixes (SL, FA, T1, and T2), Icorr fluctuations over time are influenced by the surrounding environment. In the high-humidity laboratory environment, Icorr tends to fluctuate more, while in the controlled conditions of the environmental chamber, it tends to stabilize or plateau. This behavior suggests that environmental factors like temperature and humidity play a critical role in corrosion activity, with the controlled chamber environment reducing Icorr variability and leading to more consistent corrosion rates. The environmental chamber helps mitigate external fluctuations in humidity and temperature, which in turn dampens variations in corrosion. Similar observations were found in these studies [39,40,41,42].
The Rs parameter, which reflects the concrete's resistance to ion movement, also impacts corrosion rates. Higher Rs values generally correspond to lower corrosion rates due to reduced ionic conductivity. In the environmental chamber, Rs values often show a plateau or slight increase over time, indicating greater stability in corrosion resistance. Conversely, Rs values are more variable in the laboratory setting, paralleling the fluctuating Icorr values. This suggests that Rs stabilizes in controlled conditions, which helps mitigate corrosion progression. Similar findings were reported in previous studies [43,44,45,46].
There is an inverse relationship between Icorr and Rs- as Rs increases, Icorr tends to decrease because higher resistance limits the movement of corrosive ions. For example, in the SL and FA specimens, higher Icorr values correspond to lower Rs, especially in the laboratory. This highlights the importance of concrete mix design, including the use of supplementary cementitious materials like slag and fly ash, in influencing long-term durability and the relationship between Rs and Icorr.
The Ecorr serves as a thermodynamic indicator of corrosion risk, while Icorr measures its kinetic activity. More negative Ecorr values (e.g., more negative than -350 mV) suggest a higher likelihood of active corrosion, which aligns with higher Icorr readings. Under controlled conditions in the environmental chamber, the scatter in Ecorr vs. Icorr plots decreases, indicating more predictable corrosion behavior. In contrast, the laboratory environment, with its variability, results in a wider range of Ecorr and Icorr values, reflecting more active and unpredictable corrosion processes.
The study underscores the impact of temperature and humidity on corrosion propagation. High humidity, particularly under controlled conditions, reduces fluctuations in Icorr, Rs, and Ecorr values. In contrast, the fluctuating conditions of the laboratory environment, including lower humidity levels (30% RH), introduce more variability. Icorr values tend to rise and fall, indicating alternating periods of increased and decreased corrosion activity.
The controlled environment of the chamber creates a more predictable setting for concrete solution resistance, reducing variability in Rs. This stabilization of resistive properties in turn influences the overall corrosion process. The high-humidity conditions in the chamber minimize scatter in the data, leading to a more consistent relationship between Rs and Icorr, allowing for more reliable monitoring of corrosion behavior. The chamber provides a more stable electrochemical environment, making it easier to interpret the relationship between Ecorr and Icorr and assess the corrosion state of the embedded rebars.
Therefore, parameters such as Icorr, Rs, and Ecorr are highly interconnected and sensitive to environmental conditions. Controlled environments like the environmental chamber tend to stabilize corrosion processes, while more variable environments, like the laboratory, lead to greater fluctuations in corrosion rates. The concrete mix also plays a significant role, with different materials and pore structures influencing Rs and Icorr values. Understanding the interactions between these parameters allows for more accurate predictions of corrosion in reinforced concrete, providing valuable insights for improving the durability of structures under diverse environmental conditions [26,38].
7. Conclusions
The study demonstrates that environmental conditions significantly impact corrosion behavior in reinforced concrete. In the high humidity laboratory environment, Icorr and Rs exhibited notable fluctuations, reflecting unstable corrosion rates across all concrete mixes (SL, FA, T1, and T2). Conversely, the controlled high-humidity conditions of the environmental chamber led to more consistent and stabilized corrosion patterns, with Icorr values generally leveling off and Rs either increasing or plateauing. The environmental chamber's ability to maintain stable temperature and humidity minimized scatter in key parameters like Icorr and Rs, resulting in more predictable and reliable corrosion rates.
Furthermore, the decrease in variability observed in the environmental chamber for both the Icorr vs. Rs and Ecorr vs. Icorr relationships underscores the importance of a controlled environment in corrosion studies. The stabilizing effect of the environmental chamber provided clearer insights into the long-term corrosion behavior of rebars in concrete, enabling a more accurate assessment of corrosion risks than could be achieved in a standard laboratory setting. These findings highlight the critical role of environmental controls in improving the reliability of corrosion monitoring and predicting the durability of concrete structures over time.
Author Contributions
Kazi Naimul Hoque: Conceptualization, Methodology, Resources, Data curation, Writing-Original draft preparation, Visualization, Investigation, Writing-Reviewing and Editing. Francisco Presuel-Moreno: Conceptualization, Methodology, Writing-Reviewing and Editing, Supervision.
Funding
This research is funded through grants provided by Florida Atlantic University, as well as the Florida Department of Transportation (FDOT).
Data Availability Statement
The data collected and analyzed in this study are available from the corresponding author on reasonable request.
Acknowledgments
The authors extend their heartfelt gratitude to the Florida Department of Transportation (FDOT) for their assistance with sample preparation. The authors sincerely thank Florida Atlantic University (FAU) and the students of the Marine Materials and Corrosion Laboratory at FAU for their hard work in the lab and data collection. The views expressed in this paper are solely those of the authors and do not necessarily reflect the perspectives of FAU, or FDOT.
Conflicts of Interest
The authors declare no conflict of interest.
References
- Angst UM (2018) Challenges and opportunities in corrosion of steel in concrete. Mater. Struct., vol. 51(4), pp. 1–20. [CrossRef]
- Jones AEK (1997) Development of a holistic approach to ensure the durability of new concrete construction. British Cement Association, Crowthorne.
- fib-Model-Code (2010) 3rd FIP/CEB Model Code for concrete structures. Comite Euro-International du Beton and Federation International de Precontrainte.
- Broomfield JP (2007) Corrosion of steel in concrete-understanding, investigation and repair, 2nd edition. Taylor & Francis, Oxford.
- Castel A, Vidal T, Francois R, Arliguie G (2003) Influence of steel-concrete interface quality on reinforcement corrosion induced by chlorides. Mag. Concr. Res., vol. 55(2), pp. 151-160.
- Francois R, Arliguie G (1998) Influence of service cracking on reinforcement steel corrosion. J. Mater. Civ. Eng., vol. 10(1), pp. 14-20. [CrossRef]
- Otieno M, Beushausen H, Alexander M (2016) Chloride-induced corrosion of steel in cracked concrete-part I: experimental studies under accelerated and natural marine environments. Cem. Concr. Res., vol. 79, pp. 373-385. [CrossRef]
- Vidal T, Castel A, Francois R (2007) Corrosion process and structural performance of a 17-year-old reinforced concrete beam stored in chloride environment. Cem. Concr. Res., vol. 37(11), pp. 1551-1561. [CrossRef]
- Zhang R, Castel A, Francois R (2009) Serviceability limit state criteria based on steel-concrete bond loss for corroded reinforced concrete in chloride environment. Mater. Struct., vol. 42(10), pp. 1407-1421. [CrossRef]
- Zhang R, Castel A, Francois R (2009) The corrosion pattern of reinforcement and its influence on serviceability of reinforced concrete members in chloride environment. Cem. Concr. Res., vol. 39(11), pp. 1077-1086. [CrossRef]
- Zhang R, Castel A, Francois R (2010) Concrete cover cracking with reinforcement corrosion of RC beam during chloride-induced corrosion process. Cem. Concr. Res., vol. 40(3), pp. 415-425. [CrossRef]
- Ballim Y, Reid JC (2003) Reinforcement corrosion and the deflection of RC beams-an experimental critique of current test methods. Cement Concr. Compos., vol. 25(6), pp. 625-632. [CrossRef]
- El Maaddawy T, Soudki K (2007) A model for prediction of time from corrosion initiation to corrosion cracking. Cement Concr. Compos., vol. 29(3), pp. 168-175. [CrossRef]
- Liu Y, Weyers RE (1998) Modelling the time-to-corrosion cracking in chloride contaminated reinforced concrete structures. ACI Mater. J., vol. 95(6), pp. 675-681.
- Malumbela G, Moyo P, Alexander MG (2009) Behaviour of reinforced concrete beams under sustained service loads. Constr Build. Mater., vol. 23(11), pp. 3346-3351.
- Torres-Acosta AA, Fabela-Gallegos MJ, Munoz-Noval A, Vazques-Vega D, Hernandez-Jimenez JR (2004) Influence of corrosion on the structural stiffness of reinforced concrete beams. Corrosion, vol. 60(9), pp. 862-872. [CrossRef]
- Torres-Acosta AA, Navarro-Guitierrez S, Teran-Guillen J (2007) Residual flexure capacity of corroded reinforced concrete beams. Eng. Struct., vol. 29(6), pp. 1145-1152. [CrossRef]
- El Maaddawy T, Soudki KA (2003) Effectiveness of impressed current technique to simulate corrosion of steel reinforcement in concrete. ASCE J. Mater. Civ. Eng., vol. 15(1), pp. 41-47. [CrossRef]
- Polder RB, Peelen HA (2002) Characterization of chloride transport and reinforcement corrosion in concrete under cyclic wetting and drying by electrical resistivity. Cem. Concr. Compos., vol. 24, pp. 427-435.
- Wu J, Li H, Wang Z, Liu J (2016) Transport model of chloride ions in concrete under loads and drying-wetting cycles. Constr. Build. Mater., vol. 112, pp. 733-738. [CrossRef]
- Andrade C, Alonso C, Molina FJ (1993) Cover Cracking as a Function of Rebar Corrosion: Part I -Experimental Test. Materials and Structures, vol. 26, pp. 453-464. [CrossRef]
- Alonso C, Andrade C, Rodriguez J (1998) Factors Controlli ng Cracking of Concrete Affected by Reinforcement Corrosion. Materials and Structures, vol. 31, pp. 435 -441.
- Andrade C, Alonso C, Rodriguez J, Garcia M (1996) Cover Cracking and Amount of Rebar Corrosion: Importance of the Current Applied Accelerated Tests. Concrete Repair, Rehabilitation and Protection, R. K. Dhir and M. R. Jones, eds., E&FN Spon, London, pp. 263-273.
- Rasheeduzzafar, Al-Saadoun SS, Al-Gahtani AS (1992) Corrosion Cracking in Relation to Bar Diameter, Cover, and Concrete Quality. Journal of Materials in Civil Engineering, ASCE, vol. 4(4), pp. 327-342. [CrossRef]
- Verma SK, Bhadauria SS, Akhtar S (2014) Monitoring Corrosion of Steel Bars in Reinforced Concrete Structures. The Scientific World Journal, vol. 1, pp. 57904. [CrossRef]
- Ismail M, Muhammad B, Ismail ME (2010) Compressive strength loss and reinforcement degradations of reinforced concrete structure due to long-term exposure. Construction and Building Materials, vol. 24(6), pp. 898-902.
- Presuel-Moreno F, Balasubramanian H, Wu Y (2013) Corrosion of reinforced concrete pipes: an accelerated approach. Corrosion 2013, paper no. C2013-0002551 (Houston, TX).
- Presuel-Moreno F, Nazim M, Tang F, Hoque K, Bencosme R (2018) Corrosion Propagation of Carbon Steel Rebars in High Performance Concrete. BDV27-977-08 Final Report for FDOT.
- Hope BB, Ip AKC (1987) Corrosion of steel in concrete made with slag cement. ACI Materials Journal, vol. 84(6), pp. 525-531.
- Andrade C, Alonso C (1996) Corrosion rate monitoring in the laboratory and on-site. Constr. Build. Mater., vol. 10(5), pp. 315-328. [CrossRef]
- Feliu V, Gonzalez JA, Feliu S (2007) Corrosion estimates from transient response to a potential step. Corros. Sci., vol. 49(8), pp. 3241-3255. [CrossRef]
- Gonzalez JA, Miranda JM, Feliu S (2004) Consideration on the reproducibility of potential and corrosion rate measurements in reinforced concrete. Corros. Sci., vol. 46(10), pp. 2467-2485. [CrossRef]
- Artigas A, Monsalve A, Sipos K, Bustos O, Mena J, Seco R, Garza-Montes-de-Oca N (2015) Development of accelerated wet–dry cycle corrosion test in marine environment for weathering steels. Corrosion Engineering, Science and Technology, vol. 50(8), pp. 628–632. [CrossRef]
- Recha F (2023) Estimation method of corrosion current density of RC elements. Open Engineering, vol. 13(1), pp. 20220430. [CrossRef]
- Hall MR, Najim KB (2014) Structural behaviour and durability of steel-reinforced structural Plain/Self-Compacting Rubberised Concrete (PRC/SCRC). Construction and Building Materials, vol. 73, pp. 490-497. [CrossRef]
- Zhou H, Chen S, Du Y, Lin Z, Liang X, Liu J, Xing F (2020) Field test of a reinforced concrete bridge under marine environmental corrosion. Engineering Failure Analysis, vol. 115, pp. 104669. [CrossRef]
- Baroghel-Bouny V, Dierkens M, Wang X, Soive A, Saillio M, Thiery M, Thauvin B (2013) Ageing and durability of concrete in lab and field conditions: investigation of chloride penetration. Journal of Sustainable Cement-Based Materials, vol. 2(2), pp. 67–110. [CrossRef]
- Hussain RR (2011) Underwater half-cell corrosion potential bench mark measurements of corroding steel in concrete influenced by a variety of material science and environmental engineering variables. Measurement, vol. 44, pp. 274-280. [CrossRef]
- Hoque K (2020) Corrosion propagation of reinforcing steel embedded in binary and ternary concrete. Ph.D. Dissertation, Department of Ocean and Mechanical Engineering, Florida Atlantic University (FAU), Boca Raton, Florida, USA.
- Presuel-Moreno F, Hoque K (2019) Corrosion propagation of carbon steel rebar embedded in concrete. Corrosion 2019, Nashville, Tennessee, USA.
- Hoque KN, Presuel-Moreno F, Nazim M (2023) Corrosion of carbon steel rebar in binary blended concrete with accelerated chloride transport. Journal of Infrastructure Preservation and Resilience, vol. 4(26), pp. 1-15. [CrossRef]
- Hoque KN, Presuel-Moreno F, Nazim M (2023) Accelerated Electromigration Approach to Evaluate Chloride-Induced Corrosion of Steel Rebar Embedded in Concrete. Advances in Materials Science and Engineering, Article ID. 6686519, pp. 1-14. [CrossRef]
- Hoque KN, Presuel-Moreno F (2026) Chloride transport accelerated via modest electromigration as a means to initiate corrosion of the steel reinforcement. Journal of Maritime Research, vol. 23(1), pp. 144-156. [CrossRef]
- Hoque KN, Presuel-Moreno F (2026) Influence of Rebar Configuration and Reservoir Size on Corrosion Dynamics in Fly Ash Concrete: A Galvanostatic Pulse Study. Journal of Maritime Research, vol. 22(3), pp. 74-82.
- Hoque KN, Presuel-Moreno F (2025) A Long-Term Experimental Study on Evaluating Corrosion Currents in Reinforced Concrete for Marine Structures. Scientific Journal of Maritime Research (Pomorstvo), vol. 39(2), pp. 173-185. [CrossRef]
- Hoque KN, Presuel-Moreno F (2025) Long-Term Corrosion Behavior of Reinforced Concrete: Impact of Supplementary Cementitious Materials and Reservoir Size Under Accelerated Chloride Ingress. Construction Materials, vol. 5(2), pp. 1-30. [CrossRef]
Figure 1.
Several single rebar and three rebar specimens with reservoirs installed.
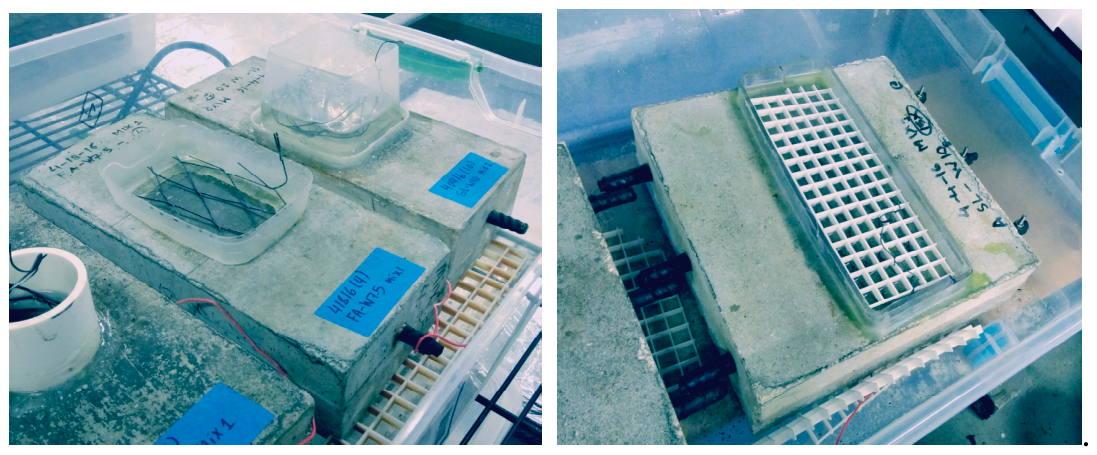
Figure 2.
Experimental setup used for electromigration process.
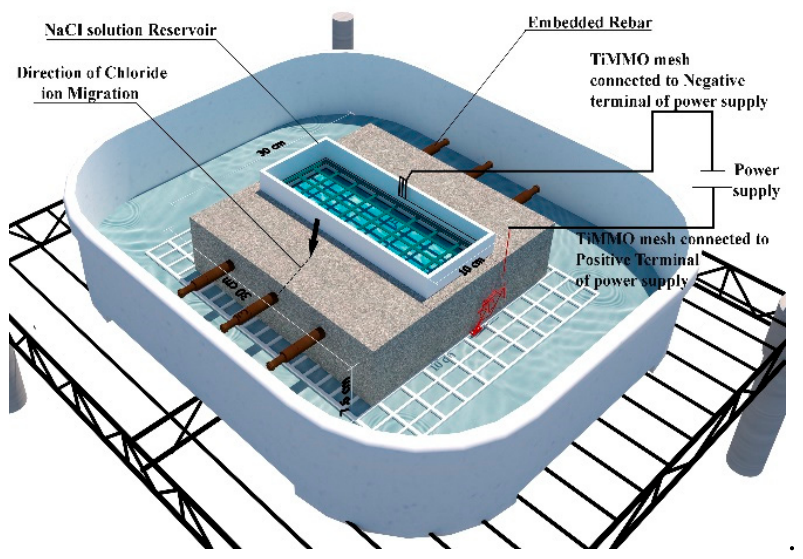

Table 1.
Concrete mix detail for SL, FA, T1 and T2 specimens.
| Mix | Cementitious Content | Cement Content | 20% FA |
8% SF |
50% Slag | Fine agg. | Coarse agg. | w/cm ratio |
| (kg/ m3) |
(kg/ m3) |
(kg/ m3) |
(kg/ m3) |
(kg/ m3) |
(kg/ m3) |
(kg/ m3) |
||
| SL | 390 | 195 | 0 | 0 | 195 | 782 | 1009 | 0.41 |
| FA | 390 | 312 | 78 | 0 | 0 | 967 | 833 | 0.41 |
| T1 | 390 | 117.5 | 78.3 | 0 | 195.2 | 761 | 1009 | 0.41 |
| T2 | 390 | 289 | 70 | 31 | 0 | 790 | 1046 | 0.37 |
Table 2.
Different single rebar and three rebar samples transferred to the environmental chamber according to the reservoir length.
Table 2.
Different single rebar and three rebar samples transferred to the environmental chamber according to the reservoir length.
| Concrete Mix | Reservoir Length (cm) | Rebar Size | Sample Name |
| SL | 5 | #3 rebar | SL-7 |
| 5 | #3 rebar | SL-8 | |
| 10 | #4 rebar | 15X | |
| FA | 7.5 | #3 rebar | FA-4 |
| 7.5 | #3 rebar | FA-6 | |
| 10 | #4 rebar | 21X | |
| T1 | 5 | #3 rebar | T1-7 |
| 10 | #3 rebar | T1-9 | |
| 10 | #4 rebar | 27X | |
| T2 | 15 | #3 rebar | T2-2 |
| 5 | #3 rebar | T2-3 | |
| 10 | #4 rebar | 29X |
Disclaimer/Publisher’s Note: The statements, opinions and data contained in all publications are solely those of the individual author(s) and contributor(s) and not of MDPI and/or the editor(s). MDPI and/or the editor(s) disclaim responsibility for any injury to people or property resulting from any ideas, methods, instructions or products referred to in the content. |
© 2026 by the authors. Licensee MDPI, Basel, Switzerland. This article is an open access article distributed under the terms and conditions of the Creative Commons Attribution (CC BY) license (http://creativecommons.org/licenses/by/4.0/).
Copyright: This open access article is published under a Creative Commons CC BY 4.0 license, which permit the free download, distribution, and reuse, provided that the author and preprint are cited in any reuse.


