
Submitted:
27 July 2026
Posted:
27 July 2026
You are already at the latest version
Abstract
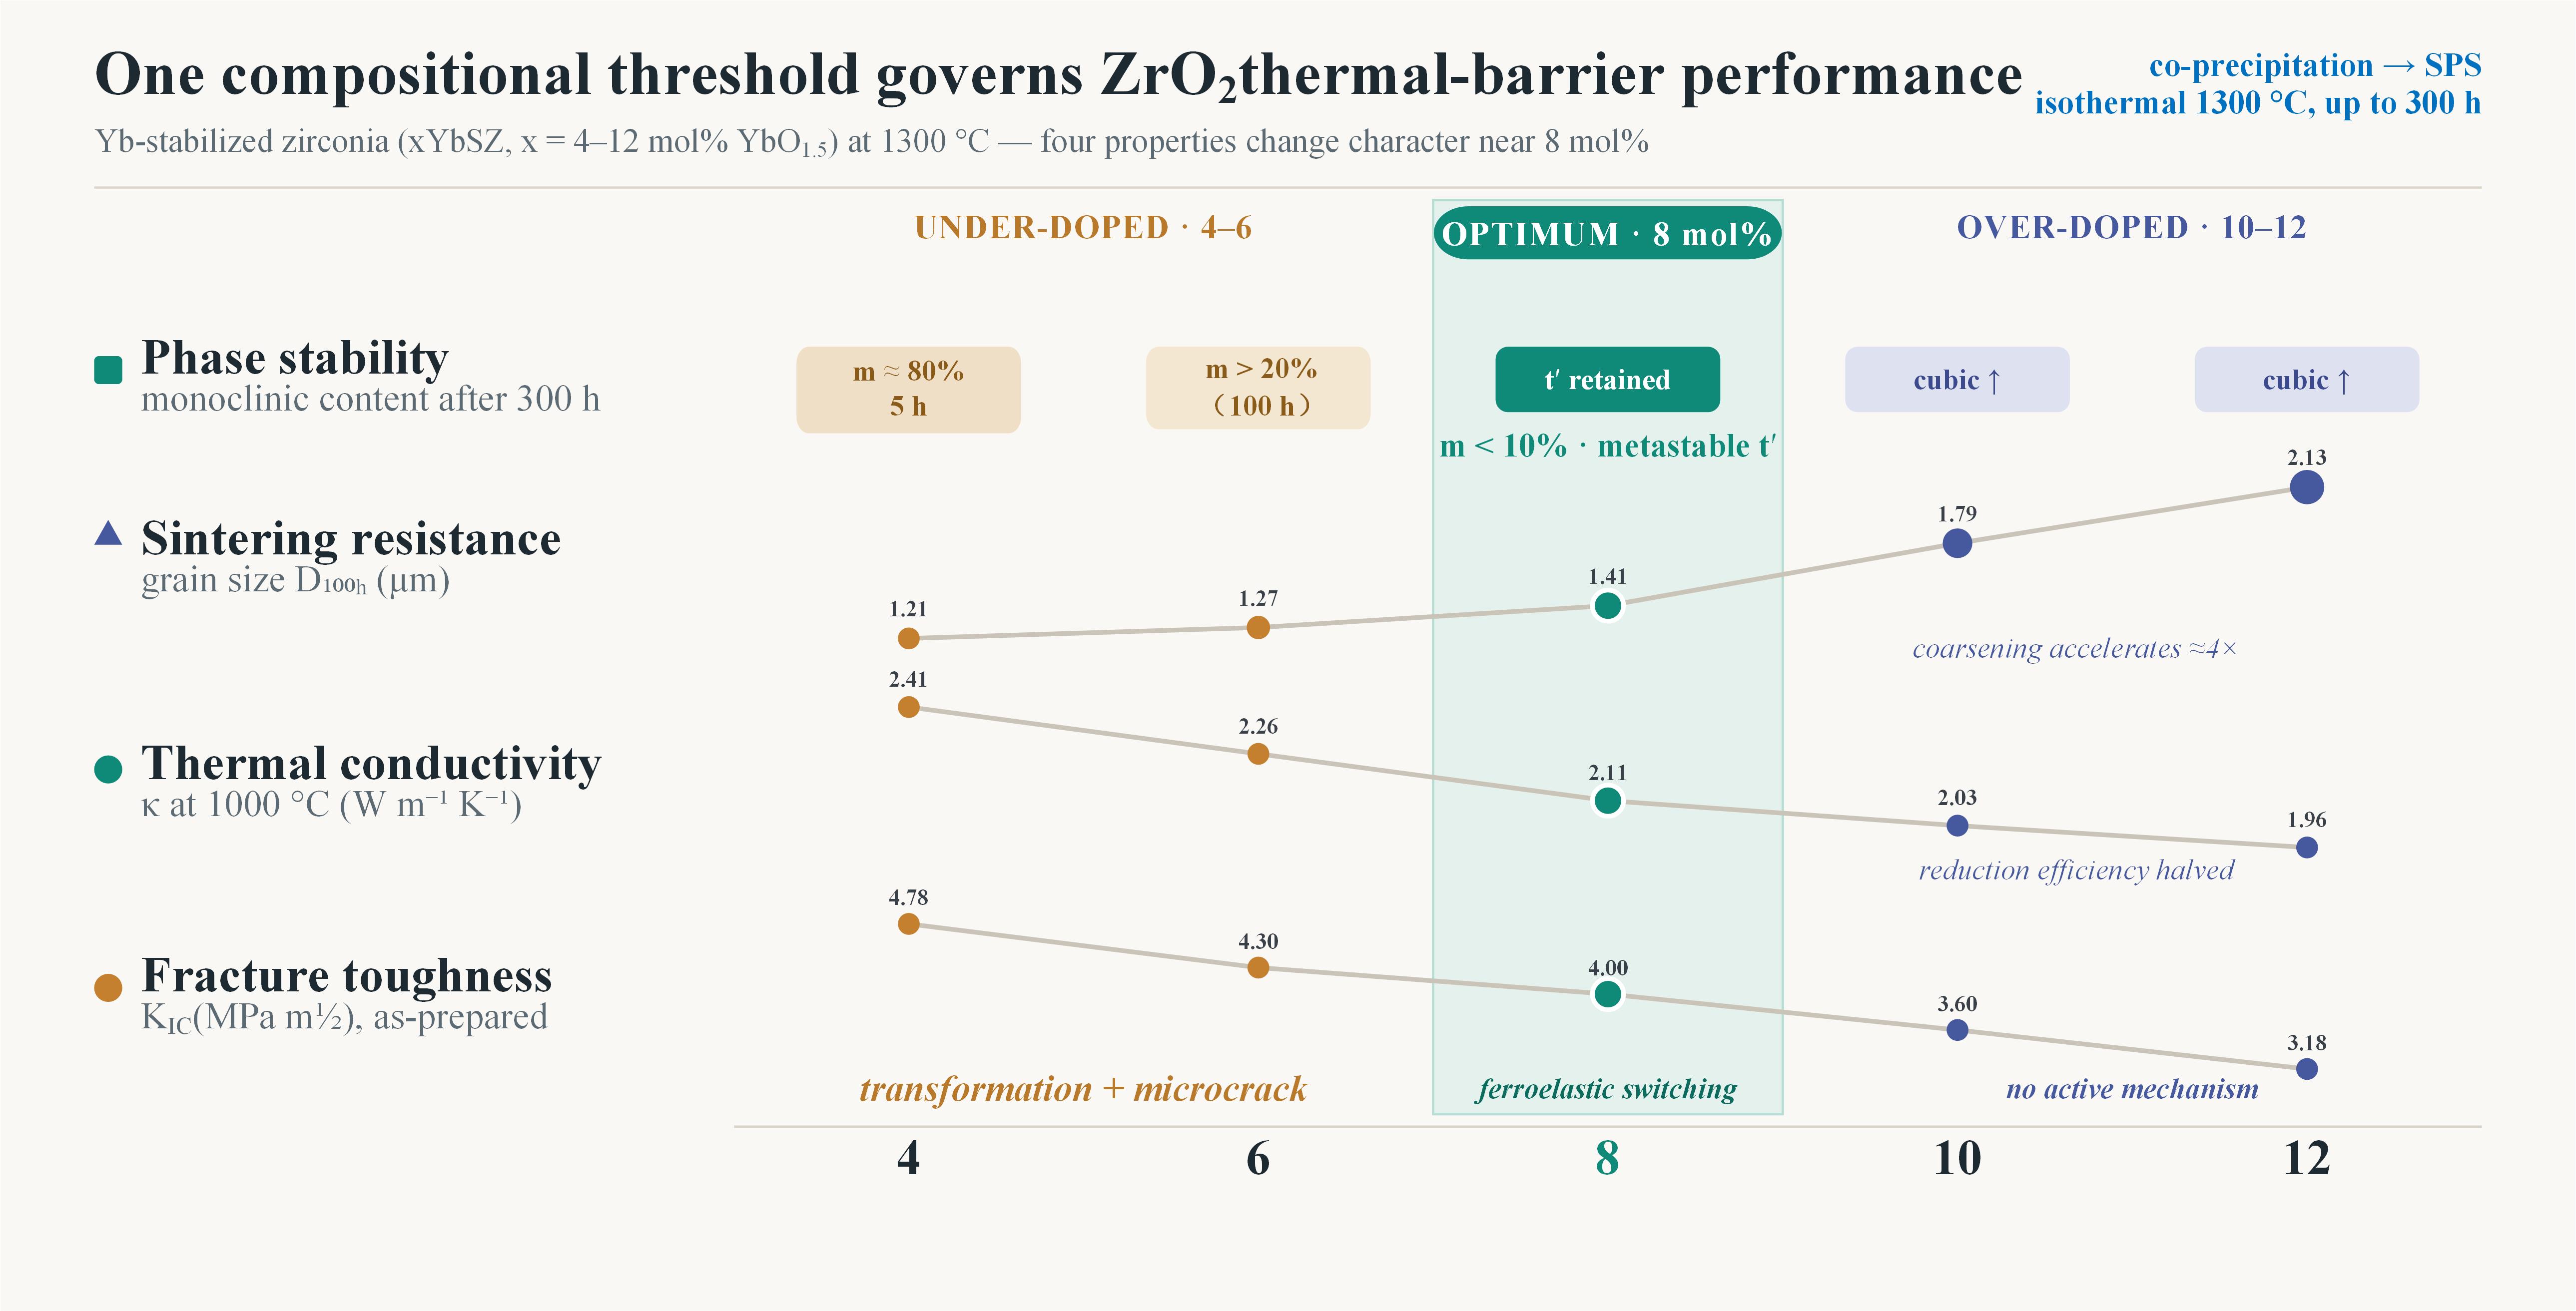
Yttria-stabilized zirconia (YSZ) thermal barrier coatings suffer from t′ phase destabilization and insufficient thermal insulation above 1200 ℃. In this work, YbO1.5-stabilized ZrO2 (xYbSZ, x = 4–12 mol%) powders were synthesized by chemical co-precipitation, consolidated by spark plasma sintering, and systematically evaluated at 1300 ℃ in terms of phase stability, sintering behavior, thermal conductivity, and fracture toughness. A common compositional boundary near 8 mol% YbO1.5 was identified across all four responses. 8YbSZ retained the metastable t′ phase with a monoclinic content below 10 mol% after 300 h at 1300 ℃, whereas the 4–6 mol% compositions destabilized rapidly and the 10–12 mol% compositions progressively developed the cubic phase. Grain coarsening accelerated markedly above 8 mol%, and the thermal-conductivity reduction efficiency per unit doping at 1000 ℃ was approximately halved beyond this composi-tion, with κ decreasing from 2.41 to 1.96 W·m-1·K-1 across the series, consistent with the saturation of point-defect phonon scattering. In the as-prepared state the fracture toughness decreased monotonically with doping, and the toughness gain produced by thermal treatment fell from 34% (4YbSZ) to about 10% (10–12YbSZ) as the dominant toughening mechanism shifted from transformation and microcrack toughening (4–6 mol%) to ferroelastic domain switching (8 mol%), both being lost in the cubic-dominated compositions. These results identify 8 mol% YbO1.5 as the optimal composition balancing phase stability, sintering resistance, thermal insulation, and mechanical integrity for TBC applications at 1300 ℃.
Keywords:
thermal barrier coating
; ytterbia-stabilized zirconia
; phase stability
; thermal conductivity
; fracture toughness
; compositional threshold
1. Introduction
Thermal barrier coatings (TBCs) are essential for thermal protection in advanced aero-engines and industrial gas turbines [1,2]. However, as service temperatures continue to rise, conventional yttria-stabilized zirconia (YSZ) materials face significant limitations above 1200 °C [3,4]. The primary challenge is the destabilization of the tetragonal prime (t′) phase, which provides the optimal balance between thermal stability and mechanical toughness in ZrO2-based TBCs. During prolonged high-temperature exposure, the t′ phase decomposes first into cubic (c) phase and equilibrium tetragonal (t) phase; subsequently, the t phase transforms to monoclinic (m) phase upon cooling, resulting in volume expansion, stress accumulation, and accelerated coating degradation. This phase instability, combined with insufficient thermal insulation performance at elevated temperatures, substantially restricts the practical applications of YSZ. The demand for improving gas turbine efficiencies has necessitated significant increases in combustion temperatures up to 1300-1400 °C, requiring TBC materials with better phase stability and thermal performance than conventional YSZ [5]. While researchers are investigating various low thermal conductivity ceramics as potential next-generation TBCs, ZrO2-based coatings remain valuable due to their excellent thermal expansion coefficient compatibility with superalloy substrates and superior mechanical properties. Consequently, enhancing the stability of the t′ phase has become critical for developing advanced ZrO2-based TBCs capable of withstanding increasingly demanding operational environments.
Extensive investigations of rare-earth-doped ZrO2 systems have established clear correlations between dopant characteristics and performance properties. The ionic radius, atomic weight, and concentration of rare earth elements significantly influence phase stability and thermophysical behavior through distinct mechanisms. Comparative studies reveal a systematic trend: large ionic radius elements (La3+, Nd3+) provide excellent sintering resistance but reduced phase stability, while smaller radius elements (Sc3+, Er3+, Yb3+) deliver superior phase stabilization. Dong et al. demonstrated that smaller ionic radius Sc2O3 doping effectively inhibits t′ phase decomposition to cubic and tetragonal phases at 1200 °C [6]. Similarly, the mass difference between dopant and host cations directly impacts thermal conductivity, with Rahaman et al. confirming that Gd2O3 doping significantly reduces thermal conductivity through enhanced phonon scattering [7]. These fundamental structure-property relationships established through single-dopant studies now provide the scientific foundation for developing more sophisticated multi-component systems with optimized performance characteristics.
As a heavy rare earth element, Yb3+ offers distinct advantages in stabilizing the ZrO2 structure and reducing thermal conductivity due to its smaller ionic radius (0.985 Å) and substantial mass difference compared to Zr4+. Jiang et al. demonstrated that 4 mol% Yb2O3 doping enhanced the high-temperature stability of the t′ phase and reduced coating sintering rates [8]. Feng et al. investigated the impact of Yb2O3 doping on material thermal conductivity, establishing a correlation between dopant concentration and phonon scattering efficiency [9]. In multi-component systems, Yb2O3 has emerged as an important constituent due to its phase stabilization capabilities. Guo et al. reported that in rare earth co-doped YSZ, the Yb2O3 concentration significantly influenced the system’s thermomechanical properties [10]. Similarly, Zhang et al. found that in Yb2O3-Sc2O3- ZrO2 systems, the Yb2O3 concentration determined the optimal balance between thermal conductivity reduction and mechanical property retention [11]. Despite these advances, a systematic investigation of the effect of Yb2O3 doping concentration on the high-temperature behavior of ZrO2 at 1300 °C—encompassing phase stability, sintering, thermal transport, and mechanical properties—is still lacking [12].
This research systematically explores the effects of YbO1.5 doping concentrations (4-12 mol%) on the phase stability, sintering behavior, thermal conductivity, and mechanical properties of ZrO2 thermal barrier materials at 1300 °C. The results reveal a common compositional boundary near 8 mol%, at which the phase stability, sintering behavior, thermal conductivity, and fracture toughness all change character. At this concentration, the oxygen-vacancy content and dopant-induced lattice effects are balanced such that the t′ phase is retained without excessive property penalties. These findings provide valuable reference for the development of new thermal barrier coating materials suitable for ultra-high temperature applications, with direct implications for next-generation gas turbines. Additionally, the observed compositional boundary contributes to the fundamental understanding of rare-earth doping mechanisms in complex oxide systems and provides a compositional reference for the ZrO2-based layer in advanced single- and double-layer TBC architectures.
2. Materials and Methods
2.1. Materials
YbO1.5 doped ZrO2 powders with varying compositions (x = 4, 6, 8, 10, 12 mol%) were synthesized using the chemical co-precipitation method. Yb2O3 (purity 99.9%) was dissolved in dilute nitric acid solution, while ZrOCl2·8H2O (purity 99.95%) was separately dissolved in distilled water. The two solutions were combined and thoroughly mixed for 30 minutes. Ammonia solution was gradually added to the mixed solution until reaching pH ≥ 12 to obtain a gel-like precipitate. The mixture was continuously stirred until reaching neutrality (pH = 7). The resulting precipitate was repeatedly washed with distilled water to remove residual chloride ions, followed by drying at 120 °C for 20 h. The dried powders were subsequently calcined at 900 °C for 4 h to achieve crystallization.
To prepare dense ceramic specimens for thermal diffusivity and fracture toughness measurements, the calcined powders were consolidated using Spark Plasma Sintering (SPS). The sintering process was conducted at 1250 °C for 5 min under a pressure of 40 MPa in an argon atmosphere. To eliminate residual stresses introduced during rapid sintering, the as-sintered specimens were annealed in vacuum at 1100 °C for 6 h. After annealing, the specimens were ground and polished to dimensions appropriate for subsequent characterization.
2.2. Methods
The morphology and microstructure of powders and sintered specimens were examined using scanning electron microscopy (SEM, JSM-7800F, JEOL, Japan). Ferroelastic domain structures and selected area electron diffraction (SAED) patterns were investigated using transmission electron microscopy (TEM, Talos F200X G2, Thermo Fisher Scientific, USA) operated at 200 kV. TEM specimens were prepared by focused ion beam (FIB) milling.
Phase analysis was performed by X-ray diffraction (XRD, D8 Advance, Bruker, Germany) using Cu Kα radiation (λ = 1.5406 Å) at an acceleration voltage of 40 kV and current of 30 mA. The diffraction patterns were collected in the angular range of 20° to 80° (2θ) at a scan rate of 1°·min⁻¹. The molar proportions of monoclinic (m), tetragonal (t), metastable tetragonal (t’), and cubic (c) phases were calculated using the following equations [13]:
Raman spectroscopy (inVia Qontor, Renishaw, UK) with a 532 nm laser excitation was used as a complementary technique to verify phase composition and structural evolution. Spectra were collected in the range of 100-800 cm-1 with an acquisition time of 60 s.
Thermal diffusivity (α) measurements were conducted using a laser flash apparatus (LFA 427, Netzsch, Germany) in flowing argon from room temperature to 1200 °C. Measurements were taken at 200 °C intervals, with three measurements averaged at each temperature point. The specimens were prepared as disks with a diameter of 12.6±0.5 mm and a thickness of 2.0±0.5 mm. Both surfaces were coated with a thin layer of graphite to ensure optimal laser absorption and emission. Thermal conductivity (λ) was calculated using the equation:
where is the bulk density determined by Archimedes’ method, and is the specific heat capacity calculated using the Kopp-Neumann rule based on the heat capacities and molar fractions of constituent oxides.
For phase stability evaluation, powder specimens were isothermally annealed in air at 1300 °C and characterized by XRD after each annealing interval. Intervals of 5, 30, 50, 100, and 300 h were used for 4YbSZ, whose transformation proceeds rapidly, and intervals of 50, 100, 150, 200, and 300 h were used for the other compositions.
The sintering behavior was evaluated through isothermal treatment of powder specimens at 1300 °C for durations up to 100 h in air, with microstructural evolution documented at intervals of 0, 50, and 100 h. Grain size measurements were performed from SEM micrographs using the linear intercept method, with a minimum of 200 grains counted for each specimen. Phase stability and sintering behavior were thus evaluated on powder specimens, whereas thermal conductivity and mechanical properties were measured on the SPS-consolidated bulk specimens.
Fracture toughness () was measured using the Vickers indentation method with a load of 9.8 N and a dwell time of 15 s. A minimum of five indentations were made on each specimen, and the crack lengths were measured immediately after indentation using optical microscopy. The fracture toughness was calculated using the equation:
where E is the elastic modulus, Hv is the Vickers hardness, P is the applied load, and c is the crack length measured from the center of the indentation to the crack tip. The elastic modulus was determined by nanoindentation (Nano Indenter G200, Agilent, USA) using the continuous stiffness measurement technique. Both E and Hv were determined separately for each composition and each thermal-treatment condition, and the state-specific values were used in Eq. (6).
During the preparation of this work, the authors used a generative AI tool in order to check grammar and spelling and to improve the readability of the English language. After using this tool, the authors reviewed and edited the content as needed and take full responsibility for the content of the published article.
3. Results and Discussion
3.1. Phase Composition and Structural Evolution at Elevated Temperature
The phase composition of as-prepared xYbSZ powders was characterized by X-ray diffraction. As shown in Figure 1a, characteristic monoclinic phase reflections at 2θ = 28.2° (−111) and 31.4° (111) are observed in 4YbSZ and 6YbSZ, indicating incomplete stabilization of the tetragonal structure at these doping levels. These monoclinic reflections diminish progressively with increasing YbO1.5 content and become undetectable at 8 mol% and above, suggesting enhanced phase stabilization at higher dopant concentrations.
The high-angle region (2θ = 72°–75°) in Figure 1b enables discrimination between tetragonal variants. For 4YbSZ, the clearly resolved (400)/ (004) splitting reflects a high tetragonality (c/a) characteristic of the transformable tetragonal phase, consistent with the minor monoclinic fraction seen in Figure 1a. In 6YbSZ, peak broadening and reduced splitting suggest the coexistence of t and t′ phases. At 8 mol% YbO1.5, a single broad peak centered at approximately 74.5° is observed. The breadth and position of this reflection are consistent with the metastable t′ phase, in which the tetragonality (c/a ratio) is too small to produce resolved (400)/(004) splitting but remains distinct from the sharp singlet expected for a fully cubic structure. For 10YbSZ and 12YbSZ, progressive peak sharpening and a shift toward lower angles indicate increasing cubic phase content, as the cubic (400) reflection appears at slightly lower 2θ values compared to the tetragonal doublet.
The thermal stability of xYbSZ powders was evaluated through isothermal exposure at 1300 °C for up to 300 h. The XRD patterns (Figure 2a–f) and the corresponding quantitative phase analysis (Figure 2g) reveal three distinct regimes of phase behavior across the composition range. In the low-doping regime (4–6 mol% YbO1.5), rapid phase destabilization occurs. The 4YbSZ composition exhibits intense monoclinic (−111) and (111) reflections after only 5 h of thermal exposure at 1300 °C (Figure 2a), with the monoclinic phase fraction reaching approximately 80 mol% as estimated from XRD peak intensities using Eqs. (1)–(4). The 6YbSZ composition shows improved but still limited stability, accumulating over 20 mol% m phase after 100 h (Figure 2b, g). At 8 mol% YbO1.5, the phase stability improves markedly. The XRD patterns in Figure 2c show limited evolution over 300 h, and the high-angle analysis (Figure 2d) indicates retention of the t′ phase character throughout thermal exposure. The monoclinic phase content remains below 10 mol% after 300 h (Figure 2g), comparing favorably with conventional 8YSZ, which has been reported to undergo significant t′ phase decomposition above 1200 °C [14]. In the high-doping regime (10–12 mol% YbO1.5), monoclinic formation is effectively suppressed. However, the XRD patterns reveal progressive development of the cubic phase with increasing thermal exposure time (Figure 2e). The cubic phase is thermodynamically stable and does not undergo the monoclinic transformation upon cooling; however, its increasing proportion has direct implications for the mechanical behavior of the coating (Section 3.4).
The composition dependence of the phase behavior maps directly onto the YbO1.5–ZrO2 phase field: at 4–6 mol% the stabilizer content is insufficient to retain a non-transformable tetragonal structure and the t phase partially reverts to monoclinic; at 8 mol% the composition lies within the metastable t′ field and is retained without transformation; above 8 mol% it approaches the cubic stability field, consistent with the progressive cubic development in 10YbSZ and 12YbSZ. Underlying this sequence, the aliovalent substitution of Yb3+ for Zr4+ generates oxygen vacancies for charge compensation, whose concentration increases monotonically with doping and serves as the common compositional variable in the analyses that follow:
The oxygen vacancy concentration is thus [Vö] = x/2, where x is the YbO1.5 molar fraction. Accordingly, the vacancy concentrations range from 2.0 mol% for 4YbSZ to 6.0 mol% for 12YbSZ, with the critical 8YbSZ composition corresponding to [Vö] = 4.0 mol%.
A comparison with conventional 8YSZ—which shares the same vacancy concentration ([Vö] = 4 mol%) yet exhibits inferior phase stability—isolates the role of the dopant cation itself. The smaller ionic radius of Yb3+ (0.985 Å) relative to Y3+ (1.019 Å) provides a closer size match to the Zr4+ host cation (0.84 Å), reducing the local lattice distortion associated with aliovalent substitution and thereby favoring retention of the t′ structure. At equal vacancy concentration, therefore, the size compatibility of the dopant—rather than the vacancy content alone—appears to play the dominant role in phase stability.
Taken together, the XRD phase analysis and the comparison with 8YSZ identify 8 mol% YbO1.5 as the composition at which the phase-stabilization behavior of the YbO1.5–ZrO2 system changes character. Whether this compositional boundary also governs the sintering, thermal-transport, and mechanical responses is examined in the following sections.
3.2. Sintering Behavior as a Function of Dopant Concentration
Sintering resistance is an important factor governing the durability of thermal barrier coatings, as grain coarsening and pore closure during high-temperature service can reduce strain tolerance and degrade thermal insulation performance. Figure 3 presents the microstructural evolution of the xYbSZ powders during isothermal treatment at 1300 °C.
After 50 h of thermal exposure at 1300 °C (Figure 3b), all compositions exhibit substantial grain coarsening relative to the as-prepared powder (Figure 3a). The as-prepared powders had an average grain size of approximately 25 nm, which increased to 0.41–0.79 μm after 50 h, with compositions containing lower YbO1.5 content showing finer microstructures. At this stage, the grains retain angular morphology with well-defined boundaries, and fine porosity remains uniformly distributed throughout the microstructure.
Extended treatment to 100 h (Figure 3c) reveals more pronounced differences among compositions. For 4–8 mol% YbO1.5 samples, the grain sizes increase to 1.21–1.41 μm while maintaining distinct boundaries and angular morphology. In contrast, the 10–12 mol% compositions show larger grain sizes of 1.79–2.13 μm with less distinct grain boundaries and evidence of grain boundary bridging. The grain morphology evolves from angular to more rounded, which is generally associated with enhanced mass transport during the later stages of sintering.
Table 1 summarizes the grain sizes after 50 and 100 h of thermal treatment. The corresponding grain size distributions (Figure 3d) remain unimodal for all compositions at both durations, indicating that the accelerated coarsening above 8 mol% proceeds by uniform grain growth rather than abnormal grain growth.
To examine whether the coarsening follows classical grain-growth kinetics, the data were compared with the parabolic grain-growth model:
where D is the average grain size at time t, D0 is the initial grain size, k is a rate constant, and the exponent n = 2 corresponds to diffusion-controlled grain-boundary migration. For n = 2, the grain size scales with the square root of time, so that D100h/D50h should approach . The measured ratios, however, fall in the range 2.7–3.0 for all compositions, well above this value—corresponding to an apparently super-linear time dependence between 50 and 100 h that would be anomalous for curvature-driven grain growth in a dense polycrystal. In powder specimens, however, the apparent grain size evolves by inter-particle neck growth and coalescence as well as by intragranular coarsening, and the acceleration between 50 and 100 h is attributed to the progressive onset of particle coalescence during extended exposure, consistent with the boundary bridging and grain rounding observed after 100 h (Figure 3c); a meaningful kinetic exponent therefore cannot be extracted from these data. Notably, the ratio varies only weakly with composition, indicating that this anomalous time dependence is common to all compositions—it is the composition sensitivity at fixed time, not the time exponent, that changes at 8 mol%. The 100 h grain size, D100h, is therefore used directly as a comparative measure of sintering resistance across compositions (Table 1).
The composition dependence of D100h reveals two features. First, D100h increases monotonically with YbO1.5 content across the entire composition range. Second, its rate of increase changes at 8 mol% YbO1.5: in the 4–8 mol% range D₁₀₀ₕ rises by approximately 0.05 μm per mol% YbO1.5, whereas above 8 mol% this rate increases nearly fourfold, to approximately 0.18 μm per mol%. The same acceleration appears independently in the 50 h data, where the rate rises from 0.02 to 0.075 μm per mol%, and it exceeds the measurement scatter: the increase from 8YbSZ to 10YbSZ at 100 h (0.38 μm) exceeds even the sum of the standard deviations of the two grain-size distributions (0.13 and 0.18 μm, Table 1), and is far larger than the standard errors of the means (≈0.01 μm for N ≥ 200). Together these observations indicate a marked increase in the composition sensitivity of grain coarsening at 8 mol%.
The monotonic increase of grain size with dopant content has a straightforward origin: aliovalent doping introduces oxygen vacancies, as established in Section 3.1, and grain-boundary transport in fluorite-structured oxides is enhanced by such point defects [15], so that the effective boundary diffusivity rises with doping:
where Q is the apparent activation energy for grain boundary diffusion, R is the gas constant, and T is the absolute temperature. This defect-enhanced transport accounts for the overall upward trend, but not for the abrupt change in composition sensitivity at 8 mol%: any smooth dependence of the rate constant on vacancy concentration, linear or sublinear, yields a correspondingly smooth variation of grain size with composition, whereas the measured slope of D100h increases nearly fourfold across 8 mol%, as shown in Table 1. An additional mechanism therefore becomes active above this composition. This acceleration coincides with the compositional range in which the structure begins to cross from the t′ field toward the cubic field identified in Section 3.1. Because cubic zirconia is reported to coarsen much more readily than the tetragonal phase [16], the enhanced grain growth at higher doping is attributed to the progressive development of the cubic phase, an interpretation grounded in the phase evolution measured on the same powder specimens.
The sintering behavior thus exhibits a composition-dependent transition similar to that observed in phase stability (Section 3.1): moderate changes below 8 mol% YbO1.5, but accelerated effects above this composition. These results reveal a trade-off within the high-doping regime. While 10–12 mol% YbO1.5 compositions avoid monoclinic transformation by stabilizing the cubic phase (Section 3.1), this benefit is accompanied by reduced sintering resistance. By analogy, the accelerated coarsening observed in these compositions is expected to translate into reduced strain tolerance when these materials are deployed as coatings, since sintering-induced coarsening and densification are known to stiffen the coating microstructure and increase residual thermal stresses [17].
Compositions in the 4–8 mol% range exhibit comparatively better sintering resistance. In particular, the 100 h grain size of 8YbSZ is only approximately 17% larger than that of 4YbSZ despite having twice the oxygen vacancy concentration. This moderate increase suggests that grain boundary migration in this composition range is not strongly accelerated by the additional vacancies. However, as discussed in Section 3.1, the lower-doped compositions (4–6 mol%) exhibit limited phase stability at 1300 °C, which constrains their practical applicability. The effects of dopant concentration on thermal conductivity and mechanical properties are examined in Section 3.3 and Section 3.4, respectively.
3.3. Thermal Conductivity Characteristics
The thermal conductivity of xYbSZ ceramics was measured from room temperature to 1200 °C (Figure 4a). All compositions exhibit characteristic temperature dependence: thermal conductivity decreases with increasing temperature up to 800–1000 °C due to Umklapp phonon-phonon scattering, then increases slightly above 1000 °C, commonly attributed to radiative heat transfer through the semi-transparent ceramic [18]. At 1000 °C, the thermal conductivity decreases monotonically from 2.41 W·m-1·K-1 for 4YbSZ to 1.96 W·m-1·K-1 for 12YbSZ, representing an approximately 19% reduction across the composition range.
Three features of Figure 4 require explanation: the monotonic decrease of thermal conductivity with doping (Figure 4a), the diminishing rate of this decrease above 8 mol% YbO1.5 (Figure 4b), and the lower conductivity of 8YbSZ relative to 8YSZ at identical vacancy concentration, marked by the star symbol in Figure 4b. All three follow from the Klemens description of point-defect phonon scattering. When Yb3+ substitutes for Zr4+ in the ZrO2 lattice, phonon scattering arises from the mass and ionic radius mismatch between the dopant and host cations, as well as from the oxygen vacancies generated for charge compensation. The scattering coefficient for substitutional point defects is:
where x is the dopant fraction, ∆M and Δr are the differences in atomic mass and ionic radius between dopant and host cations, M̄ and r̄ are the corresponding average values, and ε is a phenomenological strain field parameter (typically 2–4 for fluorite-structured oxides [19]). The total scattering coefficient includes contributions from both substitutional cations and oxygen vacancies:
The Klemens model treats dopants and vacancies as isolated, randomly distributed point defects—an assumption that becomes less accurate at the highest doping levels, where defect–defect interactions are non-negligible.
To avoid the uncertainty associated with the choice of ε, the mass-disorder scattering coefficient Γmass is introduced:
This quantity contains no adjustable parameters. For the Yb–Zr system, (ΔM/M̄)2 = 0.384, while the strain term ε(Δr/r̄)2 is estimated at 0.050–0.101 (ε = 2–4), corresponding to only 12–21% of the total cation scattering coefficient. Since both terms share the same x(1−x) dependence, Γmass captures the compositional trend without requiring a specific ε value.
Figure 4b presents Γmass (left axis) and the experimentally measured thermal conductivity at 1000 °C (right axis) as a function of YbO1.5 content. Γmass increases with dopant concentration following the x(1−x) dependence. The thermal conductivity decreases correspondingly, although the rate of decrease diminishes at higher doping levels; this correspondence is qualitative Γmass governs the compositional trend of the reduction, while its absolute magnitude follows the sublinear relation of Eq. (13). The normalized thermal conductivity follows Eq. (13), where κ₀ is the thermal conducti vity of the defect-free host lattice and u ∝ (Γtotal·κ₀)1/2; since κ₀ is common to all compositions in this series, u scales as (Γtotal)1/2. Because arctan(u)/u is a sublinear function, increasing Γtotal yields diminishing returns in thermal conductivity reduction.
Figure 4b also includes 8YSZ data, shown as a star symbol, for comparison. Both 8YbSZ and 8YSZ have [Vö] = 4 mol%, yet their Γmass values differ by a factor of nearly 600: (ΔM/M̄)2 = 0.384 for Yb versus 0.00066 for Y, and 0.384/0.00066 ≈ 580. This difference directly reflects the atomic mass contrast (Yb: 173.04 amu; Y: 88.91 amu; Zr: 91.22 amu) and accounts for the lower thermal conductivity of 8YbSZ despite identical vacancy concentrations. Extending this comparison across the lanthanide series would be of interest but is beyond the scope of the present work.
To quantify this saturation, a conductivity-reduction efficiency per unit doping, η = −Δκ/Δx, was calculated from the 1000 °C data for each composition interval, with x the YbO1.5 content in mol%. In the 4–8 mol% range, η = 0.065–0.085 W·m-1·K-1 per mol% YbO1.5, averaging 0.075; above 8 mol%, η falls to 0.035–0.040 W·m-1·K-1 per mol%, averaging 0.038. The doping efficiency of conductivity reduction is thus approximately halved beyond 8 mol%, consistent with the sublinear dependence expressed by Eq. (13).
These results have practical implications for composition selection. Increasing the YbO1.5 content from 8 to 12 mol% yields only an additional 0.15 W·m⁻¹·K⁻¹ reduction at 1000 °C (approximately 7% relative to 8YbSZ), despite a 50% increase in oxygen vacancy concentration. This diminishing return, combined with the accelerated grain coarsening at higher doping levels (Section 3.2), suggests that the incremental thermal conductivity benefit of exceeding 8 mol% YbO1.5 is limited relative to the trade-offs in other properties. The effects of dopant concentration on mechanical properties are examined in Section 3.4.
3.4. Mechanical Properties
The phase and microstructural differences documented in Section 3.1 and Section 3.2 have direct consequences for mechanical performance. Figure 5 presents the fracture toughness of xYbSZ ceramics as a function of dopant concentration. In the as-prepared state, fracture toughness decreases monotonically from 4.78 ± 0.18 MPa·m1/2 for 4YbSZ to 3.18 ± 0.24 MPa·m1/2 for 12YbSZ. Thermal treatment at 1300 °C enhances the toughness of all compositions, but to markedly different degrees: after 10 h, 4YbSZ increases to 6.42 ± 0.54 MPa·m1/2, a gain of 1.64 MPa·m1/2 or 34%; 6YbSZ rises by 20% to 5.13 ± 0.28 MPa·m1/2; 8YbSZ increases by 12%, from 4.00 ± 0.20 to 4.46 ± 0.30 MPa·m1/2; whereas 10YbSZ and 12YbSZ gain only about 10%, reaching 3.95 ± 0.25 and 3.49 ± 0.17 MPa·m1/2, respectively. The treatment-induced gain thus decreases monotonically with doping, and its magnitude tracks the availability of the toughening mechanisms identified below.
The underlying toughening mechanisms were examined by Raman spectroscopy acquired both adjacent to the Vickers indentations and in the far field (Figure 6a–c), for the as-prepared state and after thermal treatment for 5 h and 10 h. These spectra provide an independent phase characterization of the very bulk specimens on which KIC was measured, and are consistent with the phase assignments established on the powders (Section 3.1): monoclinic-rich after thermal treatment in 4–6YbSZ, t′ in 8YbSZ, and predominantly cubic in 10–12YbSZ. The far-field spectra reflect the phase constitution produced by thermal exposure alone, so any additional monoclinic intensity in the near-indentation spectra can only originate from the indentation stress field, providing a direct signature of stress-induced t→m transformation. In 4YbSZ and 6YbSZ (Figure 6a, b), the near-indentation spectra exhibit enhanced monoclinic bands (~180/190 cm-1) relative to the corresponding far-field spectra, confirming that stress-induced transformation operates in these compositions; the associated 4–5% volume expansion generates compressive stresses that shield the crack tip and increase the energy required for crack propagation, accounting for their pronounced toughness increase after thermal treatment (Figure 5b). The two compositions differ, however, in the persistence of this mechanism: the tetragonal band (~260 cm-1) in the far-field spectra remains clearly observable in 6YbSZ but is of very low intensity in 4YbSZ after thermal treatment, indicating that the transformable reservoir in 4YbSZ is largely consumed by thermal exposure. The sustained high toughness of 4YbSZ after 10 h is therefore attributed in part to microcrack toughening, in which the microcrack network generated by the extensive t→m transformation deflects and blunts propagating cracks [20].
For 8YbSZ, the near-indentation and far-field spectra show no comparable enhancement of monoclinic intensity (Figure 6c), demonstrating directly that the t′ phase in the bulk specimens does not undergo stress-induced transformation, in line with the t′ stability observed for the powders (Section 3.1). The toughening in this composition instead arises from ferroelastic domain switching: the TEM micrograph in Figure 6d reveals characteristic domain structures, and the (112) selected-area diffraction pattern exhibits three distinct orientation variants, confirming the presence of ferroelastic domains, whose switching under the crack-tip stress field is the established toughening pathway in t′ zirconia [21,22]. Such domain reorientation dissipates fracture energy without phase transformation, providing effective toughening while preserving phase stability, and explaining why 8YbSZ maintains higher toughness than the cubic-dominated compositions.
In 10YbSZ and 12YbSZ, the Raman spectra (Figure 6e, f) are consistent with a predominantly cubic structure, with no monoclinic formation either near or far from the indentations. Neither transformation toughening nor ferroelastic switching is therefore available: cubic symmetry lacks the tetragonality required for domain formation, and this absence of active toughening mechanisms explains both their low fracture toughness and its weak response to thermal treatment (Figure 5b). The small residual increase after thermal treatment even in these compositions, approximately 0.3–0.4 MPa·m1/2 or about 10%, indicates a minor baseline contribution from thermally induced microstructural relaxation common to all compositions; the far larger gain of 4YbSZ (1.64 MPa·m1/2) rises well above this baseline and is therefore attributed to the transformation-related mechanisms evidenced in Figure 6.
The monotonic decrease of fracture toughness with dopant concentration reveals a fundamental trade-off in TBC materials design. Lower YbO1.5 concentrations (4–6 mol%) provide superior fracture toughness through transformation and microcrack toughening but suffer from phase instability at 1300 °C (Section 3.1). Higher YbO1.5 content (10–12 mol%) offers phase stability through cubic phase formation but at the cost of reduced toughness and accelerated sintering. The 8YbSZ composition achieves an optimal balance among the competing requirements. It maintains adequate fracture toughness (4.46 MPa·m1/2 after thermal treatment) through ferroelastic mechanisms while providing phase stability at 1300 °C, moderate sintering resistance, and efficient thermal conductivity reduction (Section 3.3). This combination of properties makes 8YbSZ suitable for applications requiring both mechanical resilience and thermal stability. The composition-dependent toughening mechanisms also enable application-specific material selection. For components subjected to high mechanical loads with moderate thermal cycling, 4–6 mol% YbO1.5 compositions offer superior toughness through transformation toughening. For stationary components operating nearly isothermally with few thermal cycles, the 10–12 mol% compositions may remain viable where the absence of monoclinic transformation and the lowest thermal conductivity outweigh their reduced toughness and sintering resistance; this trade-off must, however, be assessed against the specific duty cycle.
4. Conclusions
This study systematically investigated the effect of YbO1.5 doping concentration on the phase stability, sintering behavior, thermal conductivity, and mechanical properties of ZrO2-based thermal barrier coating materials. The conclusions are as follows:
1.The 8 mol% YbO1.5 doping level emerged as an optimal balance for comprehensive performance in extreme environments. This composition maintained the metastable t′ phase during prolonged exposure at 1300 °C, with the monoclinic phase content remaining below 10 mol% after 300 h and limited cubic phase development, while exhibiting moderate sintering resistance and acceptable fracture toughness.
2. Compositions below 8 mol% demonstrated superior fracture toughness and sintering resistance but suffered from rapid phase destabilization at elevated temperatures. Compositions above 8 mol% maintained phase stability primarily through cubic phase formation and exhibited the lowest thermal conductivity—though with diminishing returns per additional dopant—but experienced accelerated sintering and reduced fracture toughness.
3. The thermal conductivity of all compositions decreased with increasing YbO1.5 content. At 1000 °C, the thermal conductivity decreased monotonically from 2.41 W·m-1·K-1 (4YbSZ) to 1.96 W·m-1·K-1 (12YbSZ), and the conductivity-reduction efficiency per unit dopant concentration was approximately halved above 8 mol%, consistent with the sublinear (saturating) dependence of phonon scattering on defect concentration.
Overall, the four property sets change character at a common composition near 8 mol% YbO1.5, in senses specific to each: phase stability passes through its optimum, the composition sensitivity of grain coarsening increases sharply, the conductivity-reduction efficiency per unit doping is halved, and the dominant toughening mechanism switches from transformation-based to ferroelastic and then to none. The coincidence of these transitions with the crossover from the t′ toward the cubic phase field suggests a common structural origin, although the present data establish correlation rather than causation. These findings highlight the importance of tailoring YbO1.5 content to specific service conditions. While 8 mol% offers an optimal balance for general thermal barrier applications, higher-doped compositions (10–12 mol%) may be considered for stationary components with few thermal cycles, provided that their reduced toughness and sintering resistance are acceptable for the intended duty cycle. Conversely, lower-doped compositions (4-6 mol%) may be advantageous in applications where mechanical resilience is prioritized over absolute high-temperature stability.
References
- Cao, X. Q.; Vassen, R.; Stoever, D. Ceramic materials for thermal barrier coatings[J]. J. Eur. Ceram. Soc. 2004, 24(1), 1–10. [Google Scholar] [CrossRef]
- Clarke, D. R.; Oechsner, M.; Padture, N. P. Thermal-barrier coatings for more efficient gas-turbine engines[J]. Mrs Bull. 2012, 37(10), 891–902. [Google Scholar] [CrossRef]
- Lima, R. S. Perspectives on Thermal Gradients in Porous ZrO2-7–8 wt.% Y2O3 (YSZ) Thermal Barrier Coatings (TBCs) Manufactured by Air Plasma Spray (APS)[J]. Coatings 2020, 10(9). [Google Scholar] [CrossRef]
- Jesuraj, S. A.; Kuppusami, P.; Tamilselvi, M.; et al. Tailored columnar microstructure of 7YSZ TBCs using electron beam physical vapour deposition parameters: Impact on durability and isothermal oxidation performance[J]. Appl. Surf. Sci. 2025, 690. [Google Scholar]
- Clarke, D. R.; Levi, C. G. Materials Design for the Next Generation Thermal Barrier Coatings[J]. Annu. Rev. Mater. Res. 2003, 33(1), 383–417. [Google Scholar] [CrossRef]
- Dong, Y. S.; Yan, C. L.; Li, J.; et al. Study on thermal shock resistance of Sc2O3 and Y2O3 co-stabilized ZrO2 thermal barrier coatings[J]. Ceram. Int. 2023, 49(12), 20034–20040. [Google Scholar] [CrossRef]
- Rahaman, M.; Gross, J.; Dutton, R.; et al. Phase stability, sintering, and thermal conductivity of plasma-sprayed ZrO2–Gd2O3 compositions for potential thermal barrier coating applications[J]. Acta Mater. 2006, 54(6), 1615–1621. [Google Scholar] [CrossRef]
- Jiang, K.; Liu, S.; Li, Y.; et al. Effects of RE3+ Ionic Radius on Monoclinic Phase Content of 8 mol% REO1.5 Partially Stabilized ZrO2 (RE = Yb, Y, Gd, and Nd) Powder Compacts after Annealing at High Temperature[J]. J. Am. Ceram. Soc. 2014, 97(3), 990–995. [Google Scholar]
- Feng, J.; Ren, X.; Wang, X.; et al. Thermal conductivity of ytterbia-stabilized zirconia[J]. Scr. Mater. 2012, 66(1), 41–44. [Google Scholar] [CrossRef]
- Guo, L.; Li, M.; Ye, F. Phase stability and thermal conductivity of RE2O3 (RE=La, Nd, Gd, Yb) and Yb2O3 co-doped Y2O3 stabilized ZrO2 ceramics[J]. Ceram. Int. 2016, 42(6), 7360–7365. [Google Scholar] [CrossRef]
- Yan, Z.; Peng, H.; Yuan, K.; et al. Optimization of Yb2O3-Gd2O3-Y2O3 Co-Doped ZrO2 Agglomerated and Calcined Powders for Air Plasma Spraying[J]. Coatings 2021, 11(4). [Google Scholar] [CrossRef]
- Guo, L.; Zhang, C.; Xu, L.; et al. Effects of TiO2 doping on the defect chemistry and thermo-physical properties of Yb2O3 stabilized ZrO2[J]. J. Eur. Ceram. Soc. 2017, 37(13), 4163–4169. [Google Scholar] [CrossRef]
- Limarga, A. M.; Iveland, J.; Gentleman, M. The use of Larson–Miller parameters to monitor the evolution of Raman lines of tetragonal zirconia with high temperature aging[J]. Acta Mater. 2011, 59(3), 1162–1167. [Google Scholar] [CrossRef]
- Krogstad, J. A.; Krämer, S.; Lipkin, D. M. Phase stability of t′-zirconia-based thermal barrier coatings: mechanistic insights[J]. J. Am. Ceram. Soc. 2011, 94(s1), s168–s177. [Google Scholar] [CrossRef]
- Kilo, M.; Borchardt, G.; Lesage, B. Cation transport in yttria stabilized cubic zirconia: 96Zr tracer diffusion in (ZrxY1−x)O2−x/2 single crystals with 0.15≤x≤0.48[J]. J. Eur. Ceram. Soc. 2000, 20(12), 2069–2077. [Google Scholar] [CrossRef]
- Matsui, K.; Yoshida, H.; Ikuhara, Y. Grain-boundary structure and microstructure development mechanism in 2–8 mol% yttria-stabilized zirconia polycrystals[J]. Acta Mater. 2008, 56(6), 1315–1325. [Google Scholar] [CrossRef]
- Thompson, J. A.; Clyne, T. W. The effect of heat treatment on the stiffness of zirconia top coats in plasma-sprayed TBCs[J]. Acta Mater. 2001, 49(9), 1565–1575. [Google Scholar] [CrossRef]
- Siegel, R.; Spuckler, C. M. Analysis of thermal radiation effects on temperatures in turbine engine thermal barrier coatings[J]. Mater. Sci. Eng. A 1998, 245(2), 150–159. [Google Scholar] [CrossRef]
- Abeles, B. Lattice thermal conductivity of disordered semiconductor alloys at high temperatures[J]. Phys. Rev. 1963, 131(5), 1906–1911. [Google Scholar] [CrossRef]
- Hutchinson, J. W. Crack tip shielding by micro-cracking in brittle solids[J]. Acta Metall. 1987, 35(7), 1605–1619. [Google Scholar] [CrossRef]
- Virkar, A. V.; Matsumoto, R. L. K. Ferroelastic domain switching as a toughening mechanism in tetragonal zirconia[J]. J. Am. Ceram. Soc. 1986, 69(10), C-224-C-226. [Google Scholar] [CrossRef]
- Mercer, C.; Williams, J. R.; Clarke, D. R. On a ferroelastic mechanism governing the toughness of metastable tetragonal-prime (t′) yttria-stabilized zirconia[J]. Proc. R. Soc. A 2007, 463(2081), 1393–1408. [Google Scholar] [CrossRef]
Figure 1.
XRD patterns of as-prepared xYbSZ powders (x = 4–12 mol%): (a) full patterns (2θ = 20°–80°); (b) high-angle region (2θ = 72°–75°), in which the t′ (004)/(400) doublet progressively merges with increasing YbO1.5 content, indicating decreasing tetragonality.
Figure 1.
XRD patterns of as-prepared xYbSZ powders (x = 4–12 mol%): (a) full patterns (2θ = 20°–80°); (b) high-angle region (2θ = 72°–75°), in which the t′ (004)/(400) doublet progressively merges with increasing YbO1.5 content, indicating decreasing tetragonality.
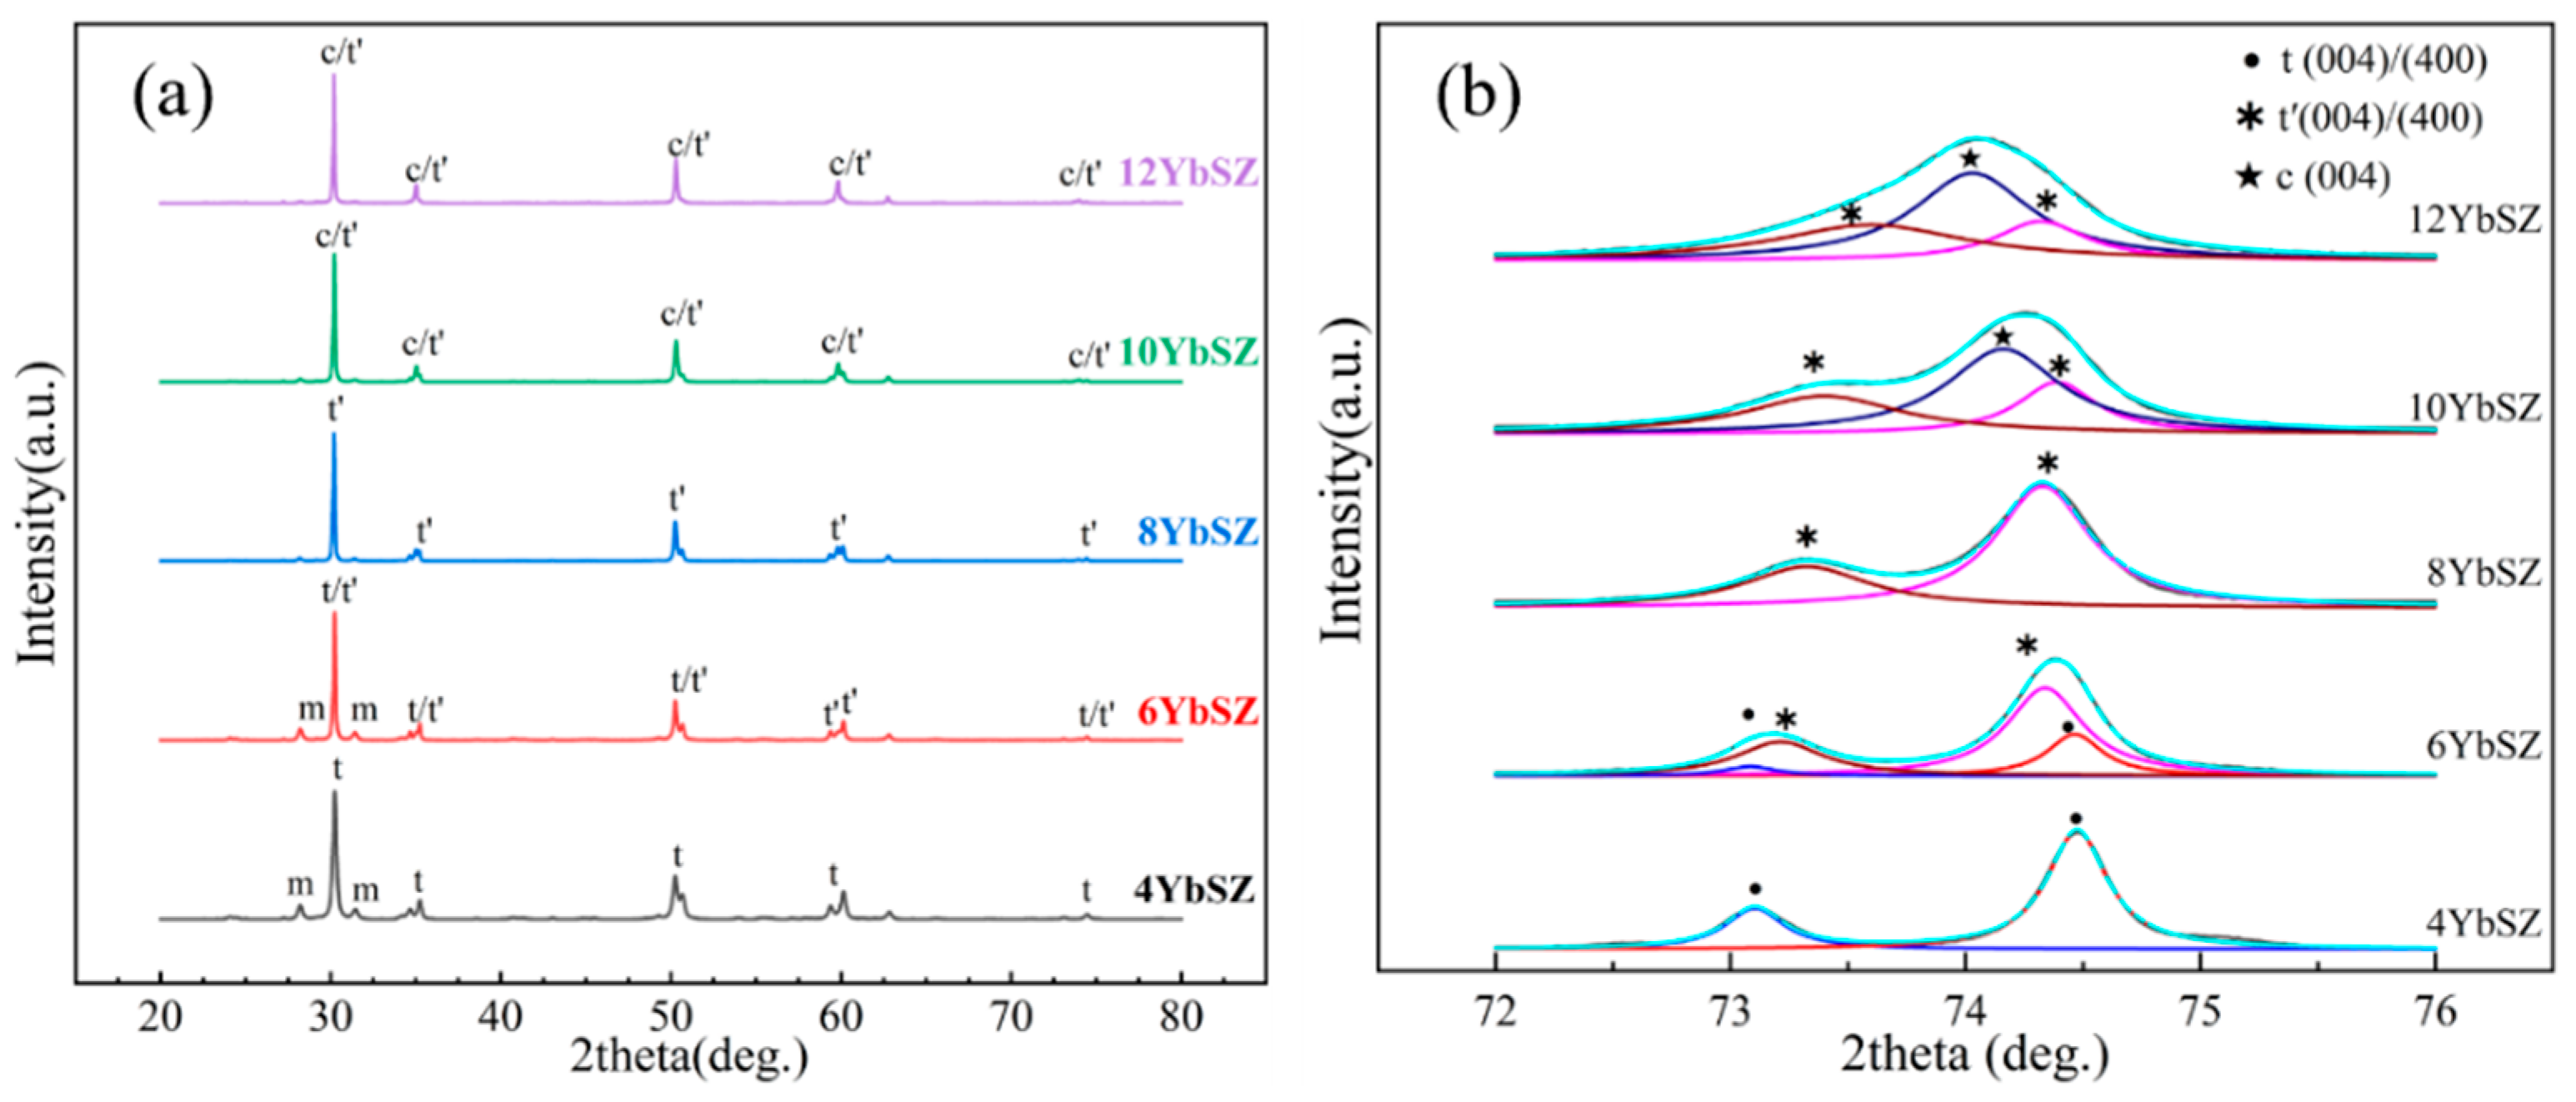
Figure 2.
Phase evolution of xYbSZ during isothermal exposure at 1300 °C for up to 300 h: XRD patterns of (a) 4YbSZ, (b) 6YbSZ, (c) 8YbSZ, (e) 10YbSZ, and (f) 12YbSZ; (d) high-angle region of 8YbSZ; (g) monoclinic phase fraction as a function of exposure time, determined from Eqs. (1)–(4).
Figure 2.
Phase evolution of xYbSZ during isothermal exposure at 1300 °C for up to 300 h: XRD patterns of (a) 4YbSZ, (b) 6YbSZ, (c) 8YbSZ, (e) 10YbSZ, and (f) 12YbSZ; (d) high-angle region of 8YbSZ; (g) monoclinic phase fraction as a function of exposure time, determined from Eqs. (1)–(4).
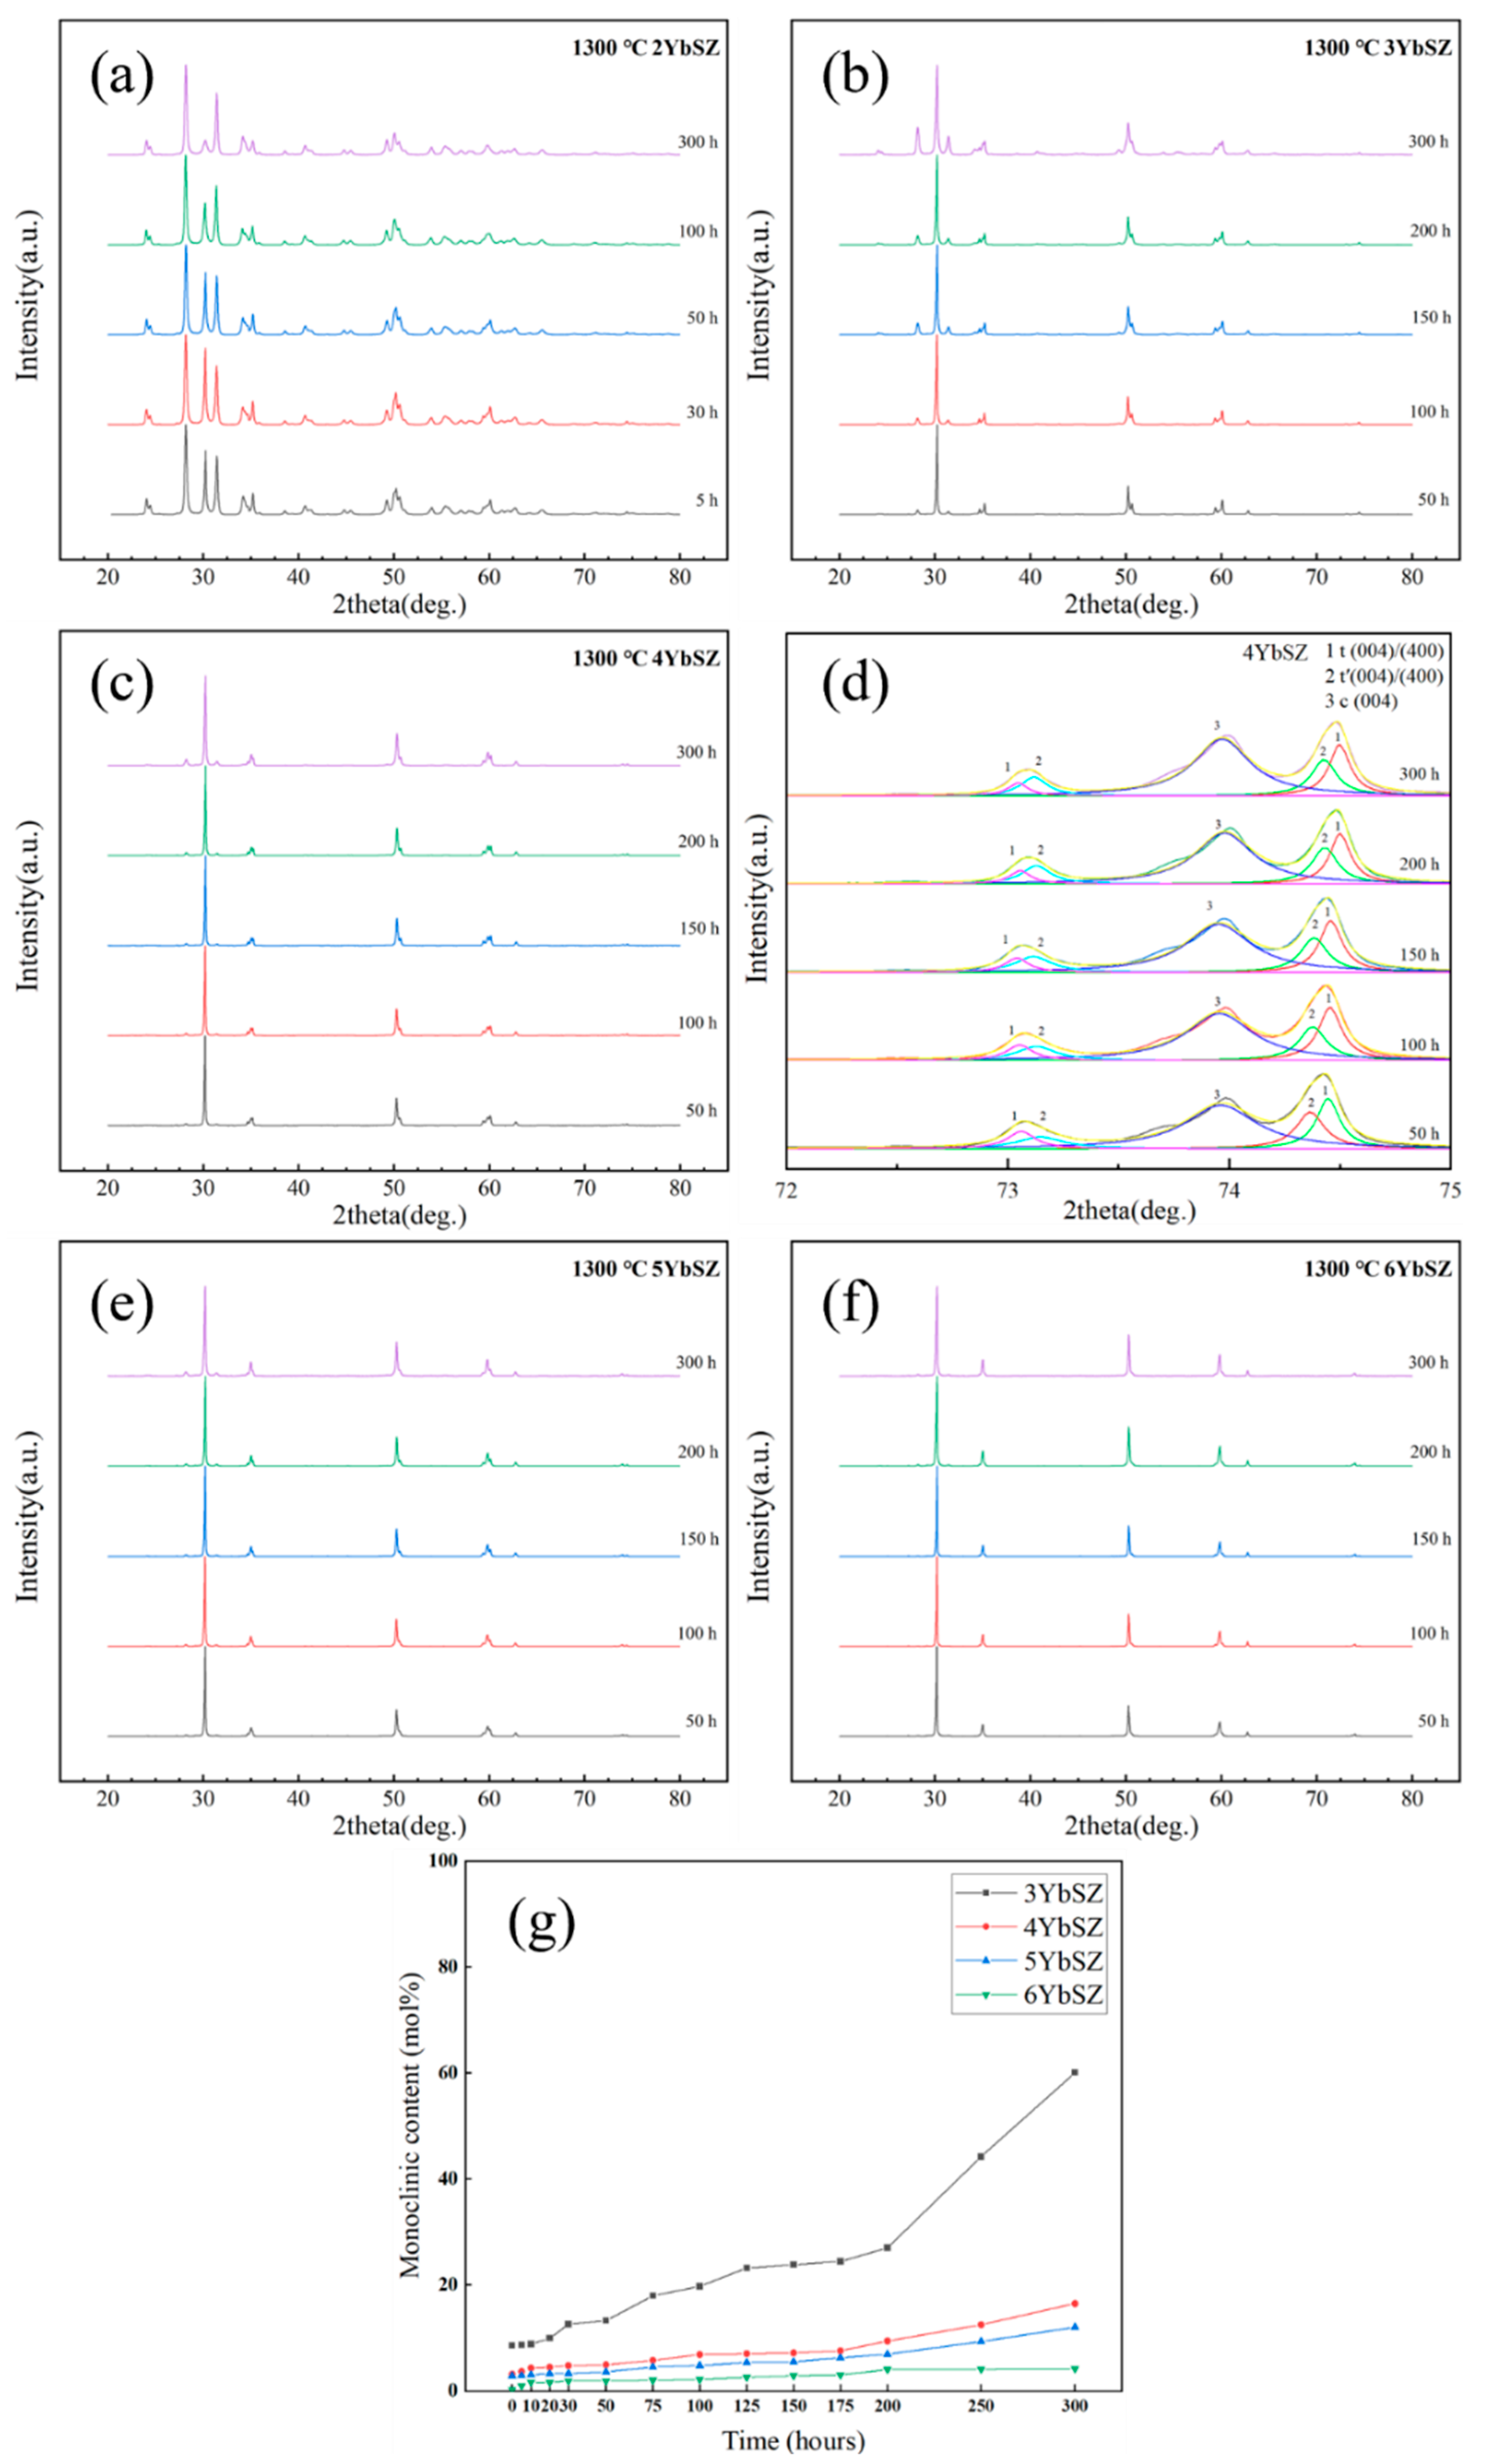
Figure 3.
Microstructural evolution of xYbSZ powders during isothermal treatment at 1300 °C: SEM micrographs of (a) the as-prepared powder and after (b) 50 h and (c) 100 h of exposure; (d) grain size distributions after 50 h and 100 h, determined by the linear intercept method.
Figure 3.
Microstructural evolution of xYbSZ powders during isothermal treatment at 1300 °C: SEM micrographs of (a) the as-prepared powder and after (b) 50 h and (c) 100 h of exposure; (d) grain size distributions after 50 h and 100 h, determined by the linear intercept method.
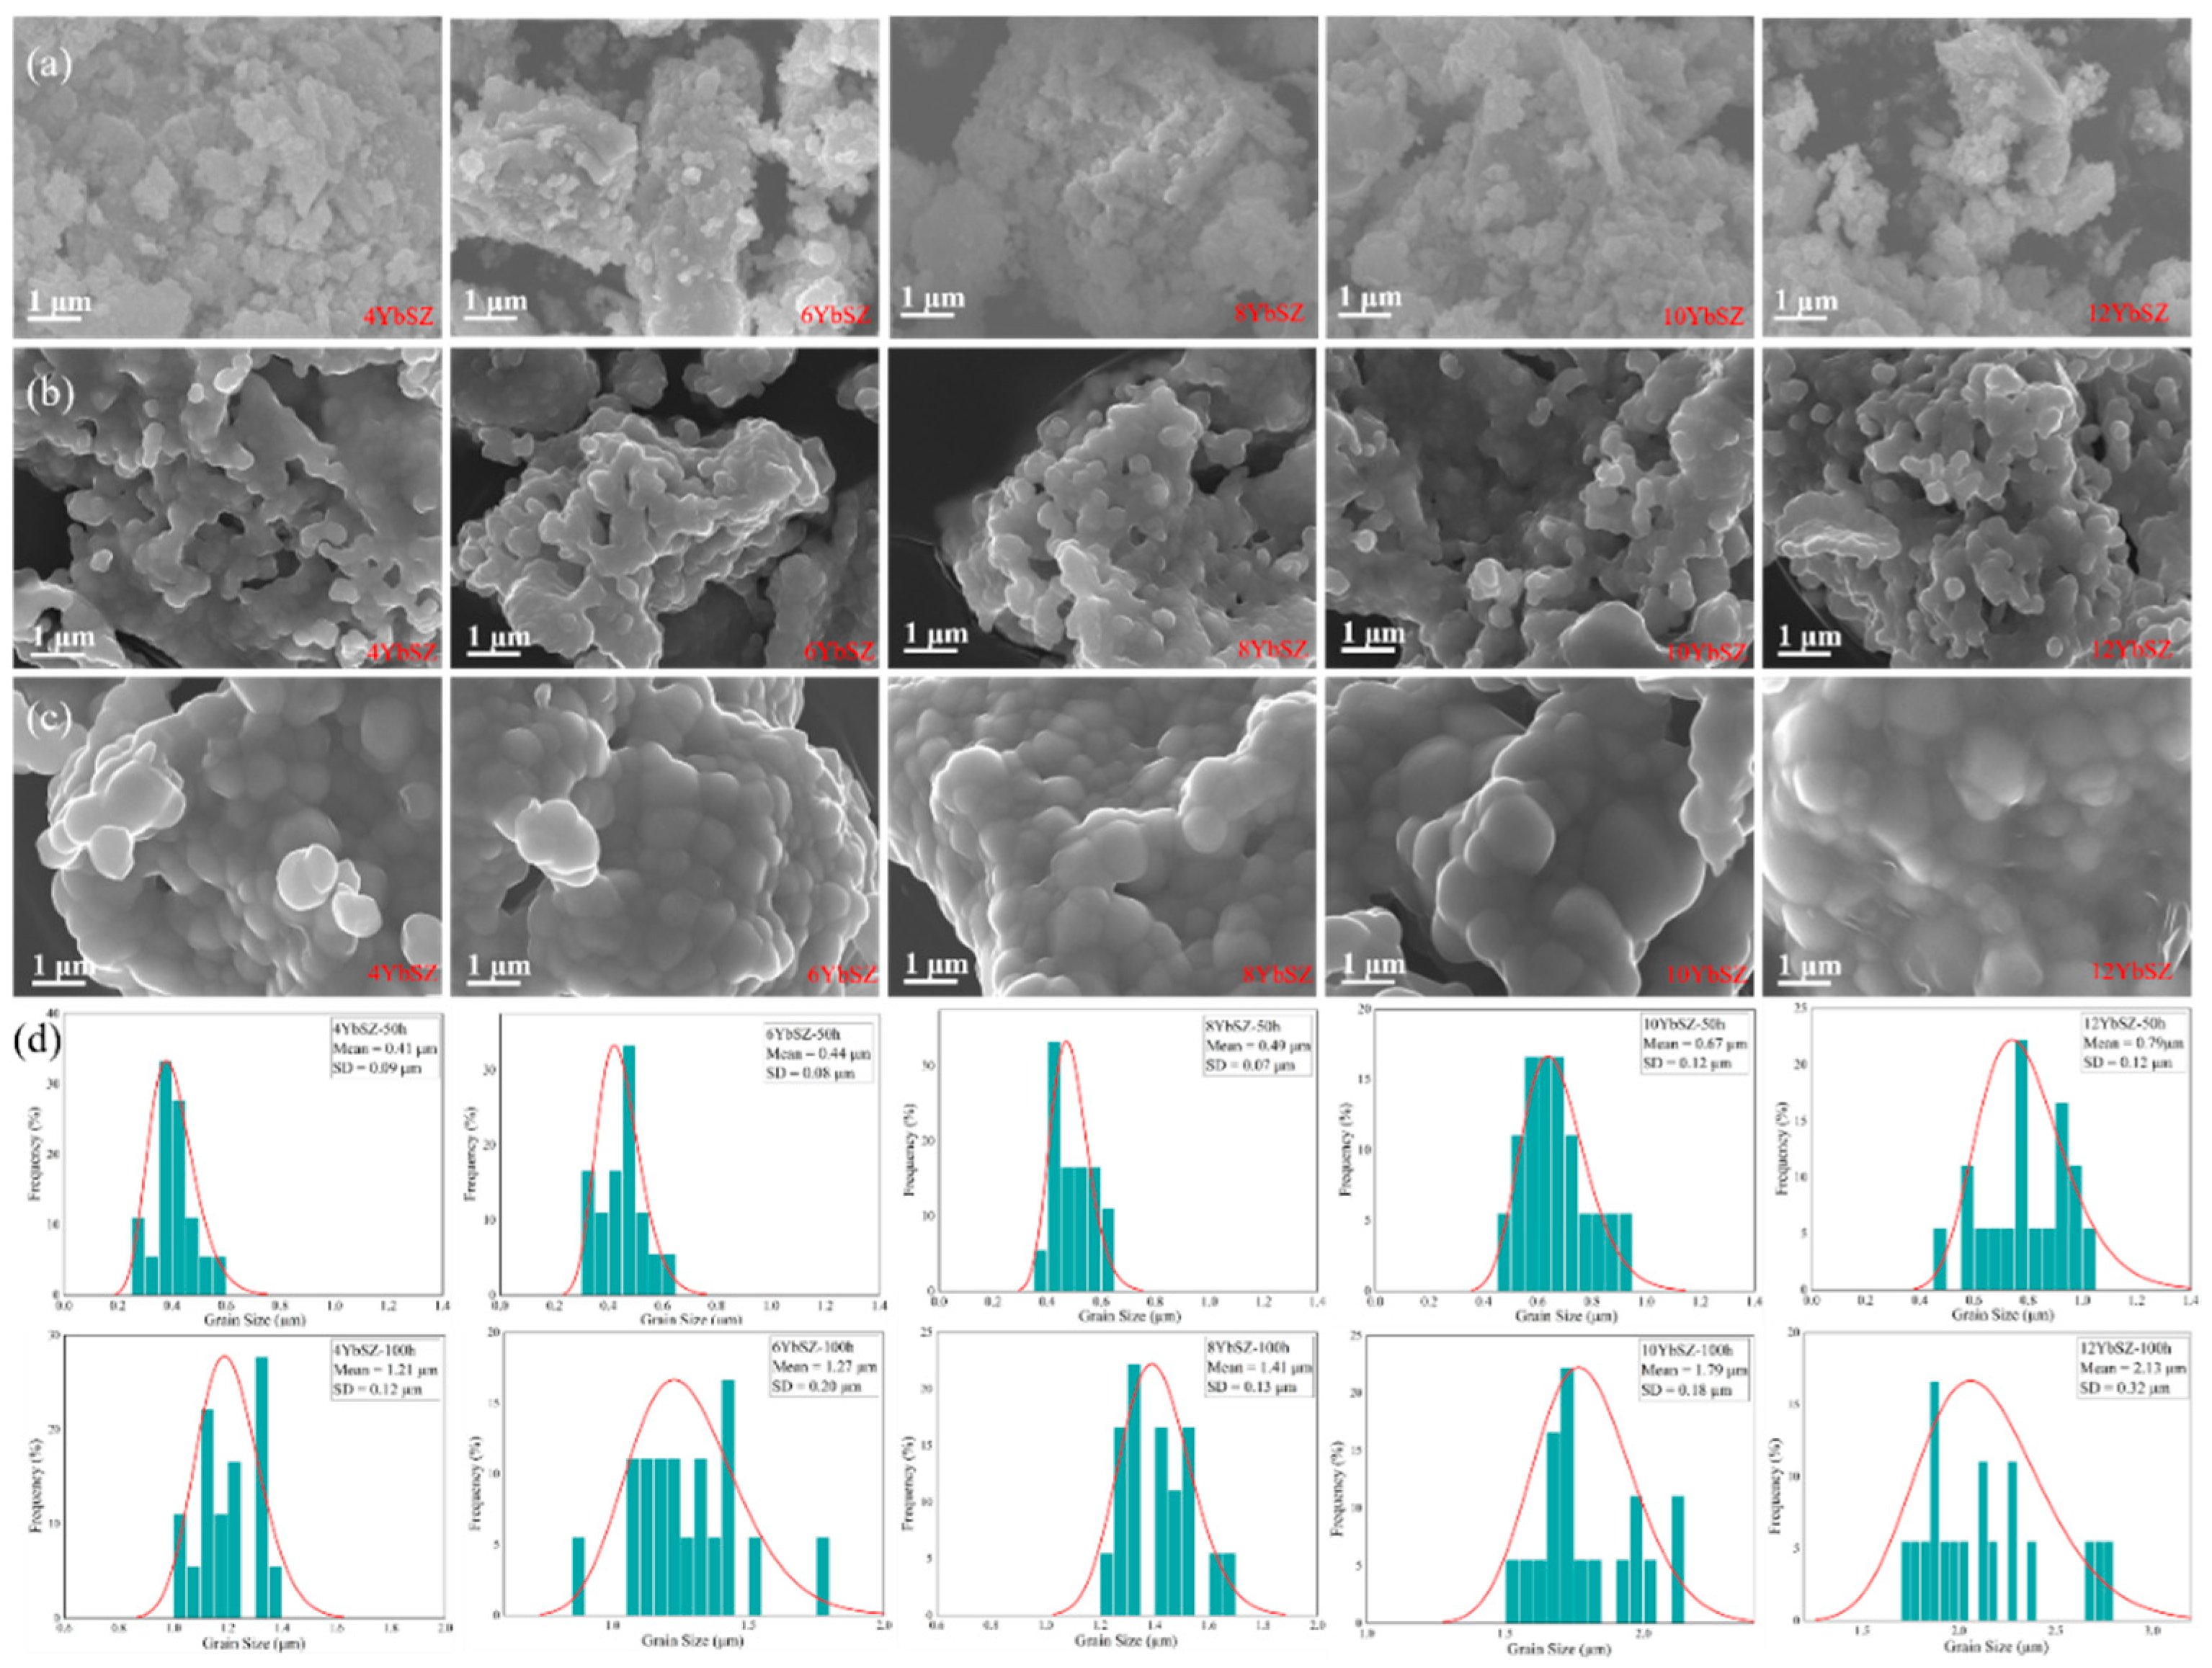
Figure 4.
(a) Temperature-dependent thermal conductivity of xYbSZ ceramics from room temperature to 1200 °C. (b) Mass-disorder phonon scattering coefficient Γmass (left axis, solid symbols) and thermal conductivity at 1000 °C (right axis, open symbols) as a function of YbO1.5 content. Γmass is calculated from Eq. (12) using known atomic masses without adjustable parameters. The star symbol indicates 8YSZ for comparison.
Figure 4.
(a) Temperature-dependent thermal conductivity of xYbSZ ceramics from room temperature to 1200 °C. (b) Mass-disorder phonon scattering coefficient Γmass (left axis, solid symbols) and thermal conductivity at 1000 °C (right axis, open symbols) as a function of YbO1.5 content. Γmass is calculated from Eq. (12) using known atomic masses without adjustable parameters. The star symbol indicates 8YSZ for comparison.
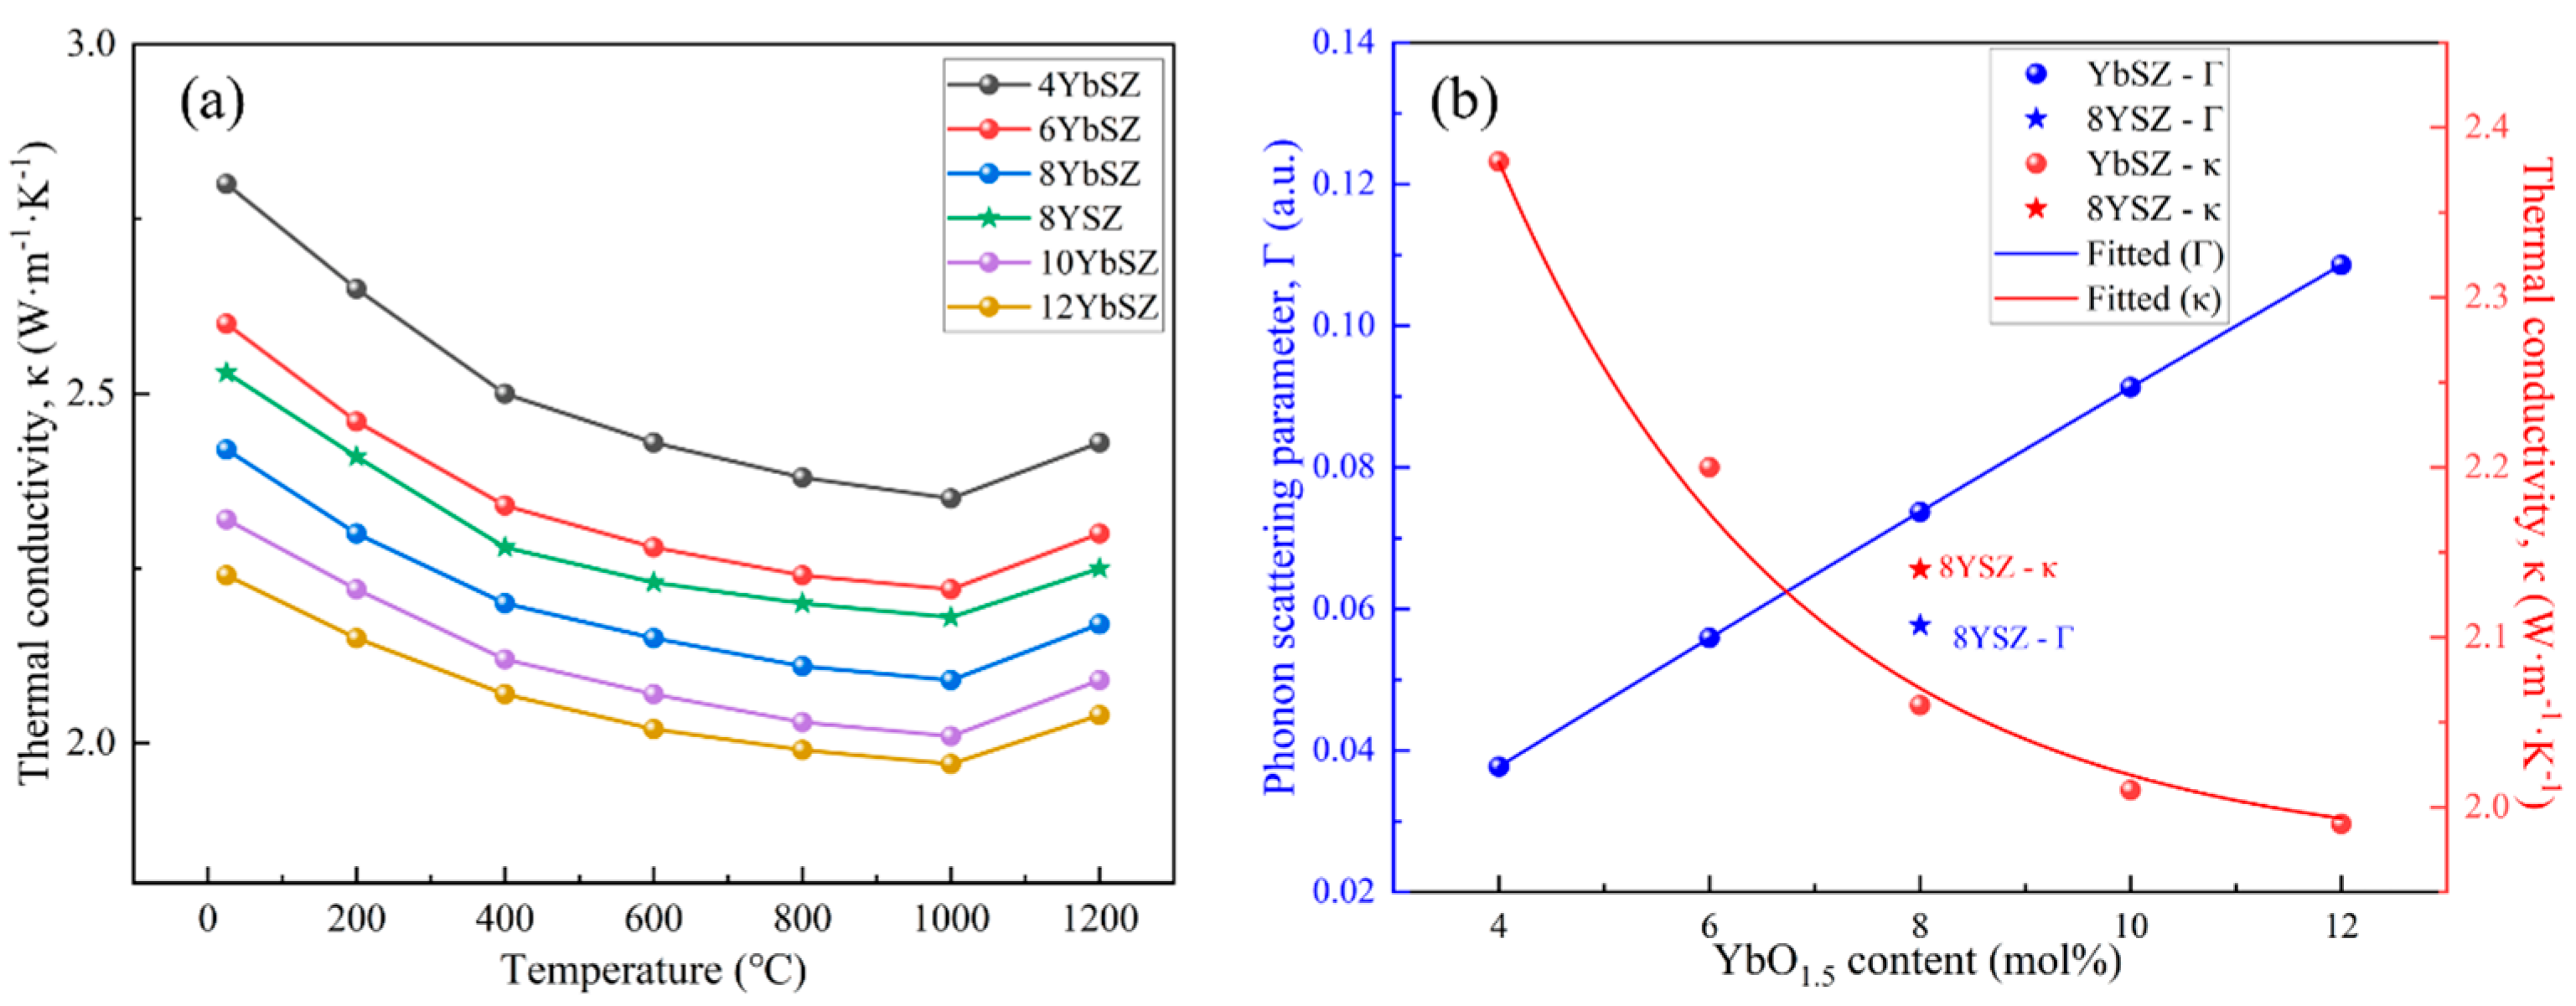
Figure 5.
Fracture toughness of xYbSZ ceramics: (a) representative Vickers indentation with crack length c and half-diagonal d defined as in Eq. (6); (b) KIC as a function of YbO1.5 content in the as-prepared state and after thermal treatment at 1300 °C for 5 h and 10 h, showing the monotonic decrease with dopant content and the composition-dependent toughness gain after thermal treatment.
Figure 5.
Fracture toughness of xYbSZ ceramics: (a) representative Vickers indentation with crack length c and half-diagonal d defined as in Eq. (6); (b) KIC as a function of YbO1.5 content in the as-prepared state and after thermal treatment at 1300 °C for 5 h and 10 h, showing the monotonic decrease with dopant content and the composition-dependent toughness gain after thermal treatment.
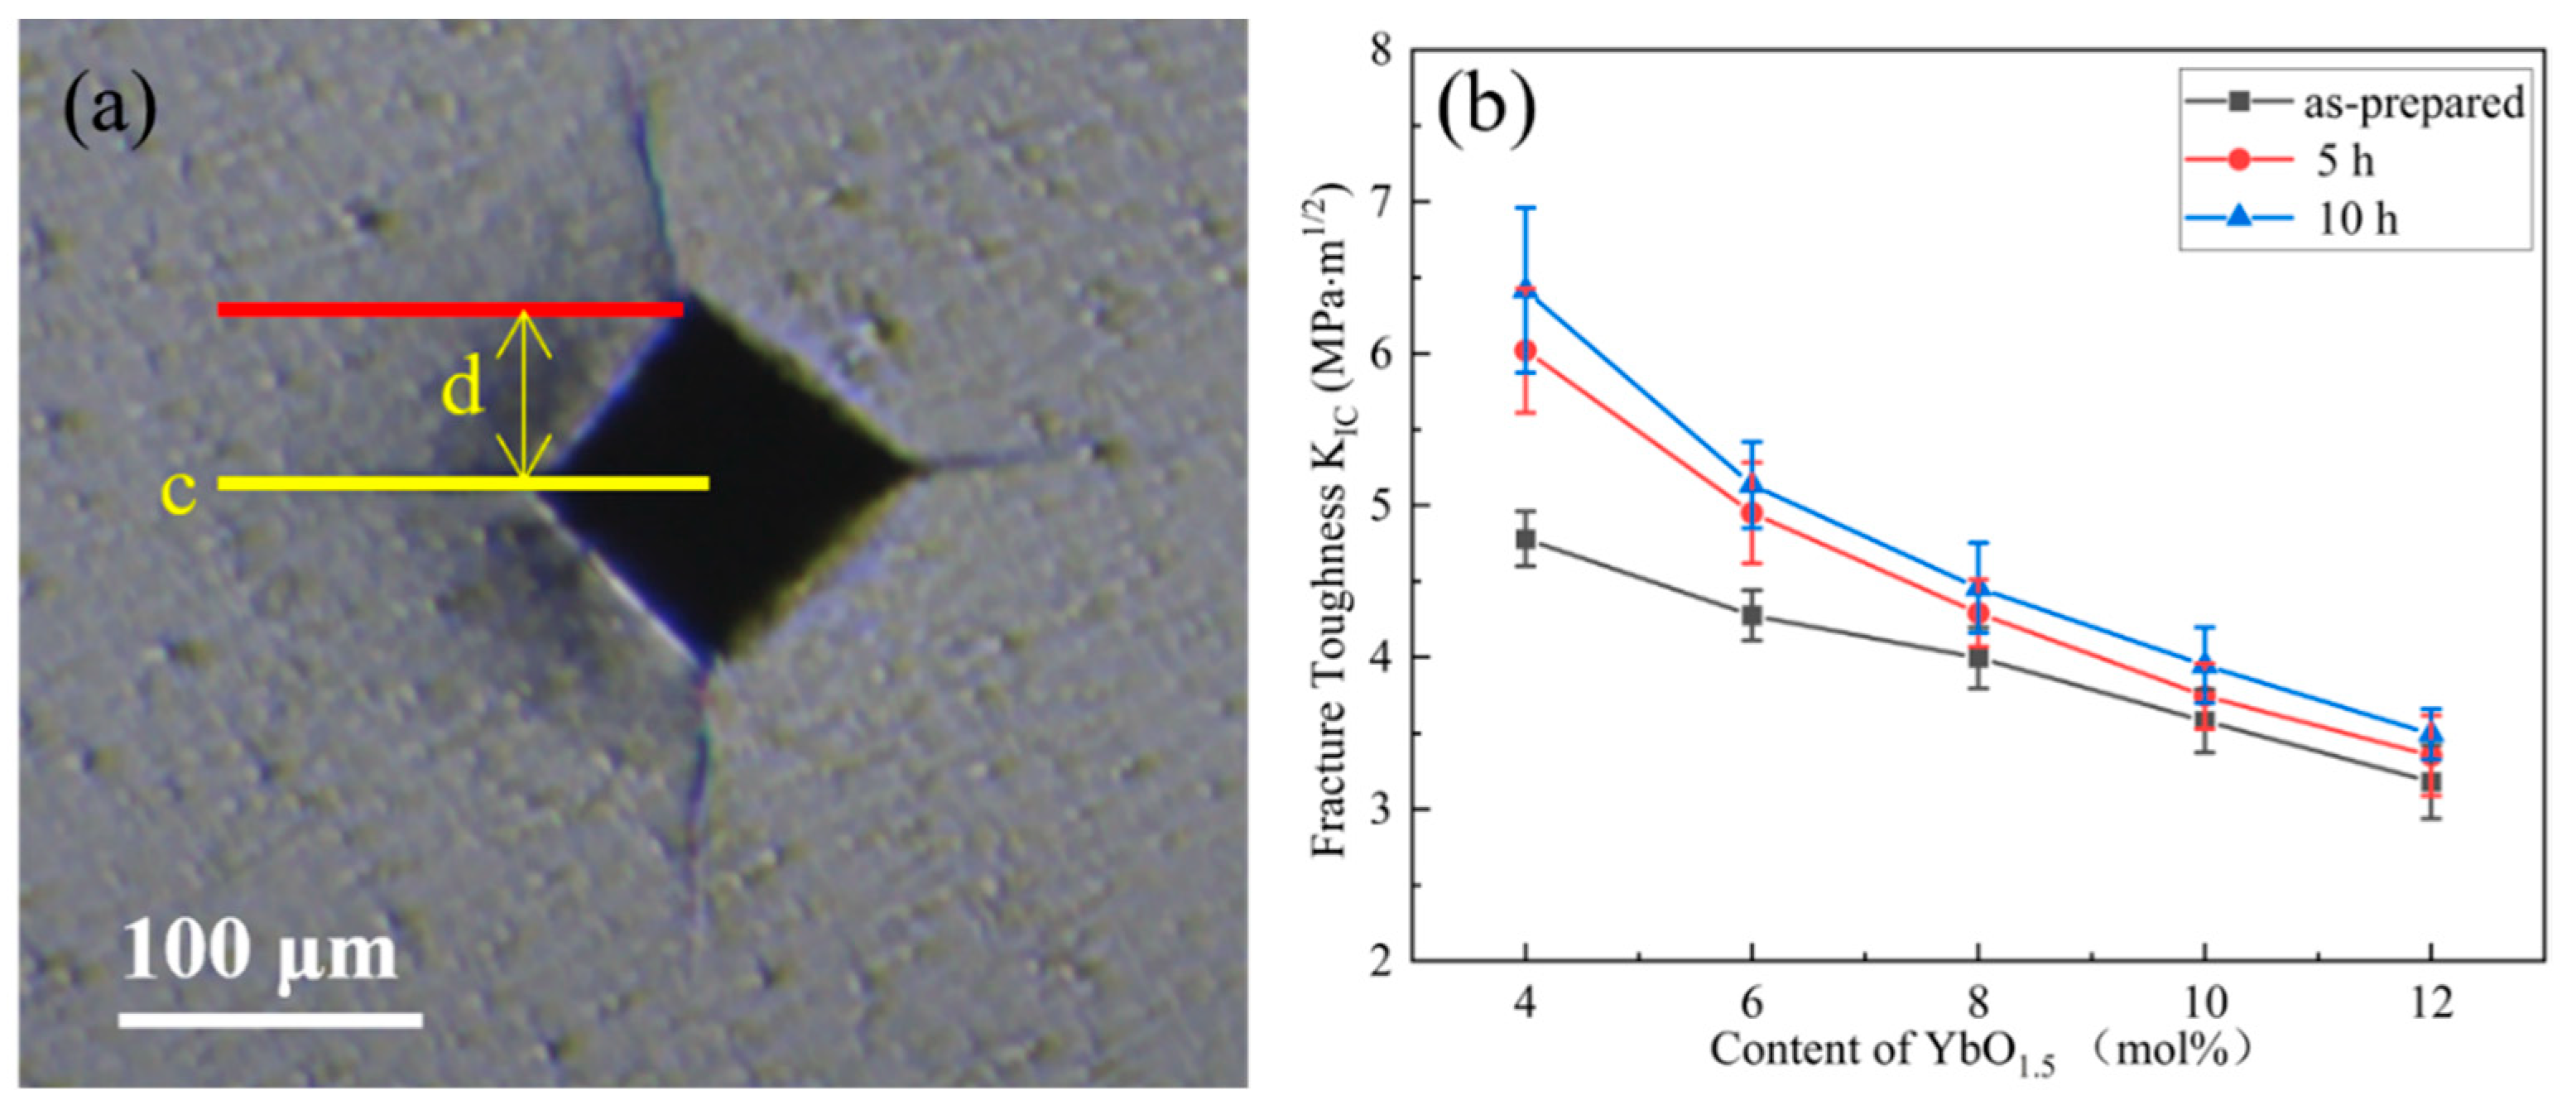
Figure 6.
Toughening mechanism analysis of xYbSZ: (a–c) Raman spectra of 4YbSZ, 6YbSZ, and 8YbSZ acquired near the Vickers indentation and in the far field, in the as-prepared state and after thermal treatment at 1300 °C for 5 h and 10 h, with the tetragonal (~260 cm⁻¹) and monoclinic (~180/190 cm⁻¹) bands indicated; (d) TEM micrograph of 8YbSZ showing ferroelastic domains, with the (112) selected-area diffraction pattern exhibiting three orientation variants; (e, f) Raman spectra of 10YbSZ and 12YbSZ.
Figure 6.
Toughening mechanism analysis of xYbSZ: (a–c) Raman spectra of 4YbSZ, 6YbSZ, and 8YbSZ acquired near the Vickers indentation and in the far field, in the as-prepared state and after thermal treatment at 1300 °C for 5 h and 10 h, with the tetragonal (~260 cm⁻¹) and monoclinic (~180/190 cm⁻¹) bands indicated; (d) TEM micrograph of 8YbSZ showing ferroelastic domains, with the (112) selected-area diffraction pattern exhibiting three orientation variants; (e, f) Raman spectra of 10YbSZ and 12YbSZ.
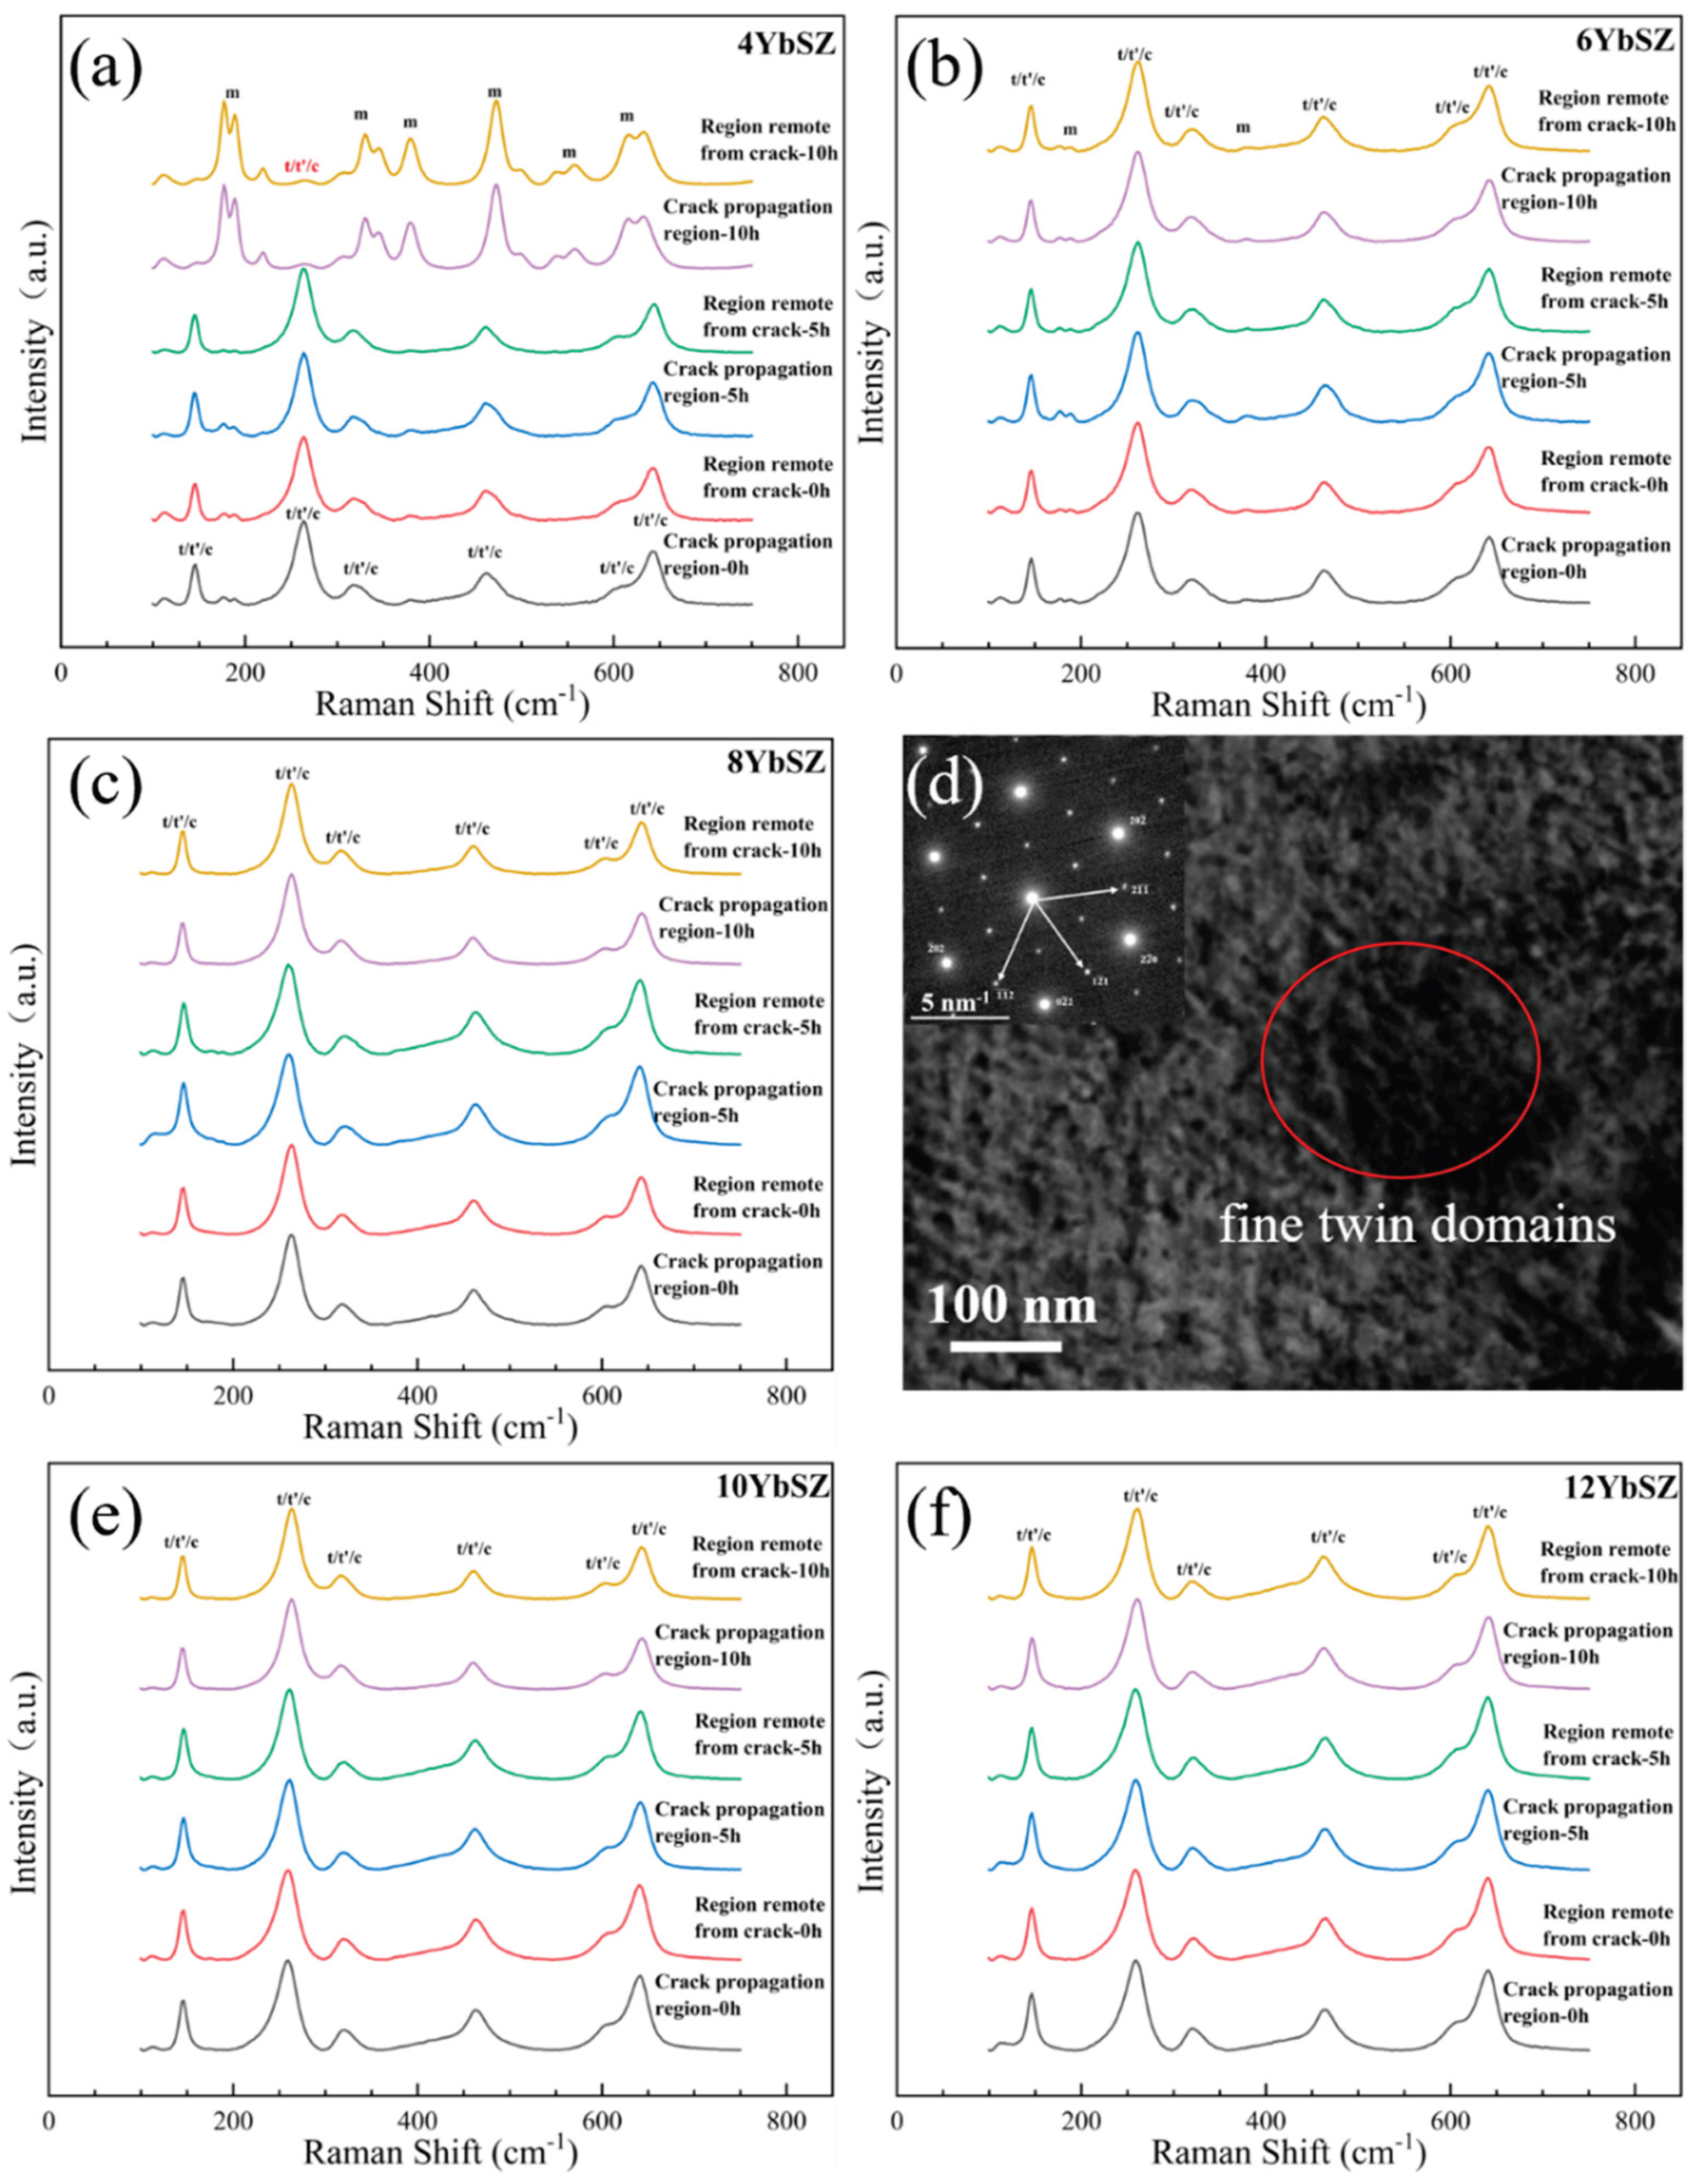

Table 1.
Grain sizes (mean ± SD of the grain-size distribution, linear intercept method, ≥200 grains per condition) of xYbSZ powders after 50 h and 100 h of isothermal treatment at 1300 °C, the corresponding oxygen vacancy concentrations, and the D100h/D50h ratio used to test the parabolic growth model.
Table 1.
Grain sizes (mean ± SD of the grain-size distribution, linear intercept method, ≥200 grains per condition) of xYbSZ powders after 50 h and 100 h of isothermal treatment at 1300 °C, the corresponding oxygen vacancy concentrations, and the D100h/D50h ratio used to test the parabolic growth model.
| Composition | [Vö] (mol%) | D50h (μm) | D100h (μm) | D100h/D50h |
| 4YbSZ | 2.0 | 0.41 ± 0.09 | 1.21 ± 0.12 | 2.95 |
| 6YbSZ | 3.0 | 0.44 ± 0.08 | 1.27 ± 0.20 | 2.89 |
| 8YbSZ | 4.0 | 0.49 ± 0.07 | 1.41 ± 0.13 | 2.88 |
| 10YbSZ | 5.0 | 0.67 ± 0.12 | 1.79 ± 0.18 | 2.67 |
| 12YbSZ | 6.0 | 0.79 ± 0.12 | 2.13 ± 0.32 | 2.70 |
Disclaimer/Publisher’s Note: The statements, opinions and data contained in all publications are solely those of the individual author(s) and contributor(s) and not of MDPI and/or the editor(s). MDPI and/or the editor(s) disclaim responsibility for any injury to people or property resulting from any ideas, methods, instructions or products referred to in the content. |
© 2026 by the authors. Licensee MDPI, Basel, Switzerland. This article is an open access article distributed under the terms and conditions of the Creative Commons Attribution (CC BY) license (http://creativecommons.org/licenses/by/4.0/).
Copyright: This open access article is published under a Creative Commons CC BY 4.0 license, which permit the free download, distribution, and reuse, provided that the author and preprint are cited in any reuse.