

Submitted:
26 July 2026
Posted:
27 July 2026
You are already at the latest version
Abstract
Objectives: To develop and validate a fully digital, surgeon-oriented interactive framework for final dental occlusion alignment in orthognathic patients. Methods: A digital framework integrating automatic alignment, using a two-dimensional Iterative Closest Point (2D ICP) algorithm with geometric corrections and optimization-based refinement, and an interactive graphical user interface (GUI) for standardized manual refinement were implemented in MATLAB. Validation was performed on preoperative digital models from 21 orthognathic patients. Obtained digital occlusions were compared with manually articulated physical models, considered the reference standard. Translational and rotational discrepancies were assessed before and after manual refinement. Results: The workflow was successfully completed in all 21 patients. Automatic alignment showed the largest translational discrepancy along the Y-axis (−2.26 ± 2.10 mm), which significantly improved after manual refinement (−1.17 ± 0.92 mm; p = 0.02). A small but significant increase in Z-axis discrepancy was observed (−0.91 ± 0.58 mm vs −1.19 ± 0.44 mm; p = 0.04), whereas X-axis differences were not significant (p = 0.22). Overall translational RMSE decreased significantly (1.83 ± 0.91 mm vs 1.09 ± 0.39 mm; p = 0.001). Individual rotational errors were unchanged (p = 0.08; p = 0.39; p = 0.43 for X-, Y- and Z-axes). Rotational RMSE significantly decreased from 2.00° ± 1.01° to 1.35° ± 0.25° (p = 0.01). Manual refinement reduced error variability, with standard deviations decreasing after standardized refinement. Conclusions: The proposed framework achieved high agreement with the reference manual occlusion. Automatic alignment provided a reliable starting point, but standardized manual refinement remained essential.
Keywords:
orthognathic surgery
; surgical occlusion
; virtual surgical planning
; virtual occlusion
1. Introduction
The assessment of the final dental occlusion represents a critical step in orthognathic surgery planning [1,2,3,4,5,6], as achieving a stable and functional occlusal relationship is essential to ensure dental stability, periodontal health, and temporomandibular joint function, as well as efficient mastication, phonation, and overall orofacial balance [7,8,9]. Consequently, precise occlusal assessment is fundamental for identifying the source of discrepancies and selecting the most appropriate treatment strategy.
Traditionally, occlusal planning has been performed manually, with plaster dental casts long regarded as the clinical reference standard1, [10,11,12]. However, these methods present inherent limitations [10,12,13,14] and recent advances have significantly transformed orthognathic surgery workflows, promoting the increasing adoption of digital and computer-assisted planning [13,14,15,16,17,18,19].
The integration of digital dental models in .STL format into surgical planning software enables the creation of a fully virtual environment in which osteotomies and skeletal movements can be simulated, alternative treatment strategies compared, and the most appropriate solution for each patient selected [6,10,20,21,22,23].
Despite these advances, conventional workflows often still rely on the fabrication of physical models derived from intraoral scans for occlusal planning [24,25]. In this process, resin models of the maxillary and mandibular arches are produced and manually articulated by the surgeon to reproduce the desired occlusion and are then rescanned to record the resulting relationship [26,27]. These data are subsequently imported into dedicated software for surgical planning. However, this workflow remains time-consuming and resource-intensive due to the need for physical model fabrication.
Although several virtual occlusion (VO) tools have been introduced, their widespread clinical adoption remains limited by the lack of tactile feedback and by the absence of physical collision constraints in the virtual environment, where the operator has to rely exclusively on visual indicators, such as occlusograms and colour-coded contact maps, to evaluate occlusal relationships [6,10,12,28,29,30,31].
The present study aims to develop and validate a full digital surgeon-oriented interactive interface for dental occlusion definition and analysis, integrating an automated computational framework with clinically defined criteria within a standardized, stepwise protocol. This approach is intended to provide a more objective, reproducible, and clinically applicable tool for the assessment of the surgical occlusion in orthognathic surgery planning.
2. Materials and Methods
The study was conducted through a collaboration between the Maxillofacial Surgery Unit of AOU Città della Salute e della Scienza, University of Turin, Italy, and the Department of Management and Production Engineering (DIGEP), Polytechnic University of Turin, from October 2025 to March 2026.
Patients’ selection
Dental models from patients with occlusal discrepancies and undergoing orthognathic surgical treatment between October 2025 and January 2026 were collected. For each patient, preoperative dental arches and surgical occlusion defined using the manual method on physical plaster casts (Manual Reference Occlusion, MrO), was acquired in digital format through intraoral scanning (IOS); the resulting three-dimensional (3D) meshes were exported in .STL format for further processing.
The inclusion criteria for the analysis were (1) age ≥ 18 years; (2) presence of an occlusal discrepancy requiring surgical correction; (3) availability of preoperative dental models in .STL format. Exclusion criteria were applied as follows: (1) noisy or incomplete IOS acquisitions; (2) presence of fewer than six pairs of antagonistic teeth per side; (3) segmental surgery of the maxilla; (4) inability to retrieve clinical information.
For each subject, demographic (gender and age) and clinical data (type of facial dysmorphism and surgical procedure) were collected, together with the .STL file representing the dental arches and final MrO, which was considered the reference standard. The dataset comprised patients with a broad spectrum of skeletal and dental malocclusions. No subgroup analysis based on the surgical approach (single jaw versus bimaxillary surgery) was conducted, as the definition of the final occlusion is independent of the number of jaws undergoing surgical repositioning.
Based on the data collected from these patients, a digital surgeon-oriented interactive interface was developed incorporating a two-step workflow: 1) a geometry-based pipeline for initial automatic positioning of the dental arches followed by 2) a dedicated Graphic User Interface (GUI) enabling the operator to adjust the occlusion through a surgeon-oriented standardized refinement phase.
Geometry-based automatic pipeline
The first step of the proposed methodology relies on the development of an automatic pipeline for the estimation of the best occlusal relationships between dental arches based on geometric references on 3D models.
Firstly, 3D meshes from IOS were processed and optimized using MeshLab (version 2023.12; ISTI-CNR, Italy). Subsequent computational algorithms for alignment and quantitative analysis were developed in MATLAB (version R2023a; MathWorks, Natick, MA, USA), allowing full control over computational procedures and ensuring reproducible results.
The high level of geometric complexity introduced by detailed IOS makes direct application of computational algorithms challenging. To reduce geometrical complexity, the dental surfaces were represented in form of depth maps preserving the morphological information necessary to assess inter-arch contacts and relationships without reproducing the entire dental geometry, reducing data dimensionality and sensitivity to non-functional variations.
To compute the depth maps, each mesh was sampled on a regular grid of 512x512 points and for each point the depth value was calculated using a volumetric ray casting algorithm [32]. At this point, the 3D geometry was projected into a 2D domain while retaining relevant occlusal information, making subsequent processing more efficient [33].
To isolate relevant geometry from areas of non-interest, the depth maps were cropped (Figure 1).
These simplified models were standardized using principal component analysis (PCA), ensuring consistent orientation and alignment of the datasets in a common reference system [34].
Curvature-based descriptors were then computed on these surfaces, specifically the mean curvature (H) and the Gaussian curvature (K), from which the principal curvatures are derived. These parameters ultimately enabled the calculation of the shape index (S), providing a local classification of surface morphology and allowing the identification of concave, convex, and saddle-shaped regions [35].
To ensure consistency between the upper and lower arches, the sign of the mandibular shape index was inverted to account for the opposite spatial orientation of the mandibular arch (Figure 2). At this point, the shape index values allow the identification of matching points between the two arches, by pairing the concavities of one arch with the convexities of the other, and vice versa.
The resulting maps were stored and used as input features for the subsequent alignment process.
The mandibular arch was considered as a fixed reference, while the maxillary arch was considered as a mobile model. An initial rigid transformation of the arches was obtained using a 2D variant of the Iterative Closest Point (ICP) algorithm, which uses a least-squares approach based on the Kabsch algorithm [36,37]. The algorithm analyses the points of the depth maps, identifies the corresponding points based on the shape index, and subsequently minimizes the distance between them, thereby progressively bringing the two arches closer together by translating them along the x- and y-axis while neglecting translation along the z-axis.
The adoption of the 2D ICP algorithm, optimally suited for shape information [38], allows the reduction of computational complexity without losing the complex geometrical information of the anatomical models, to which 3D ICP is excessively sensitive. The 2D ICP applied to shape index allows to couple the cusps of the maxillary arch with the corresponding fossae of the mandibular arch providing a global reciprocal positioning between maxillary and mandibular models (Figure 3).
To combine the functionality of geometric ICP with the specific functionality of the shape index, a weighted distance between corresponding points on the two arches is defined by combining the Euclidean distance of the ICP with that related to the shape index. This definition is formalized in the following formula:
where:
- is the Euclidean distance on the XY plane;
- is a similarity distance based on the shape index;
- is the weight accounting for morphological consistency.
In the present study, an experimental α value of 0.3 was adopted, meaning that the shape index contributed 30% to the overall distance calculation; preliminary tests on a subset of cases demonstrated that α = 0.3 provided the best compromise between geometric proximity and morphological correspondence. By adjusting this parameter, the algorithm can range from a purely geometric ICP-based behaviour (α = 0), to a fully shape index–based behaviour (α = 1).
After applying the estimated transformations, a specific refinement phase was implemented to correct the translation on the Z-axis, corresponding to the vertical translation (Z-shift) required to achieve a physiologically consistent inter-arch distance.
To achieve this, a preliminary correction of the rotation around the X-axis was required in order to obtain a maxillary occlusal plane parallel to the mandibular one, thereby ensuring a uniform Z-axis distance between the corresponding points of the two arches. To do so, the algorithm divides the model along the anteroposterior axis into anterior (incisor) and posterior (molar) regions. Representative surface points on the maxillary arch are selected within these regions, and their vertical distances from the mandibular arch are evaluated. The height difference between the anterior and posterior regions is then used to estimate the corrective inclination, which is subsequently applied as a rotation around the X-axis to compensate for occlusal plane misalignment (Figure 4).
Following tilt correction, the vertical translation (Z-shift) required to achieve a physiologically consistent inter-arch distance is calculated by identifying corresponding points between the two arches via spatial proximity and analyzing their vertical differences. Robust statistical measures such as percentiles are used to reduce the influence of outliers and irregularities on the local surface. The Z-axis translation is applied as the final step before the refinement procedure.
To address cases where excessive inter-arch penetration occurs, a non-penetration constraint was introduced. Considering that teeth can undergo slight deformations under load, an acceptable penetration range of 300µm to 500µm was established during the experimental phase [39,40,41]. In this study, an penetration threshold of 0.3 mm was adopted, allowing a small, controlled degree of interpenetration between the arches. However, the framework has been designed to enable the practitioner to modify this value.
Two methods for managing the non-penetration constraint are proposed below:
- The algorithm evaluates the spatial relationship between the maxillary and mandibular arches by measuring the inter-arch distances. Areas of overlap are identified as penetrations. Based on this analysis, the extent and distribution of penetrations are calculated to determine the vertical adjustment required to obtain the desired clearance between the arches. The rigid constraint is then applied through a rigid vertical translation of the maxilla model, ensuring a controlled and consistent correction of the inter-arch relationship. The final alignment is subsequently verified to confirm that the required clearance has been achieved. This constraint, as shown in Figure 5, is effective in spacing the arches but provides few stable occlusal contacts.
- 2.
- This method, introduced to increase the number of occlusal contacts, formulates the alignment as an iterative optimization problem, in which a rigid transformation of the maxilla is computed to maximize the quality of the occlusion.
The optimization is based on an objective function defined as a weighted combination of three terms:
- a penalty for penetration below a target free space value;
- a contact reward modeled by a Gaussian function centered on the free space value;
- a regularization term to limit non-physiological transformations.
Moreover, a spatial weighting strategy was introduced to modulate the contribution of the three terms along the dental arch, assigning greater importance to the posterior regions, particularly the molars and premolars, while preserving a smaller, yet non-zero, contribution from the anterior region. This weighting is implemented through a logistic function governed by parameters defining the transition point, slope, and relative weighting between the anterior and posterior regions.
At each iteration, the maxillary model is rigidly transformed, and the point vertical spaces are recalculated with respect to the mandibular model. Optimization favors configurations that maintain stable contact while avoiding excessive separation or penetration, resulting in smooth “sliding” behavior between the arches.
The iterative process is performed for up to 900 iterations or until convergence is achieved, typically before the completion of the total number of iterations. This phase follows the initial alignment and allows for a more physiologically realistic occlusion, achieving a controlled compromise between contact stability and non-penetration (Figure 6).
Ultimately, as the latter method resulted in the most consistent with the physiological needs of a stable occlusion, it has been adopted for the subsequent steps of this study. However, the framework has been designed to enable the practitioner to choose between the two approaches.
Manual stepwise refinement GUI
A GUI for potential final manual refinement of the occlusion obtained after the automatic phase was implemented.
To enhance the visualization of the dental arches, the complete models obtained from the IOS were transferred to the current occlusal position defined on the depth maps. A rigid registration procedure based on fiducial points was implemented. This procedure requires the operator to position at least three pairs of corresponding fiducial points to ensure reliable spatial alignment [42] (Figure 7).
Specifically, as shown in Figure 7, the points were selected considering the cusps of the following teeth:
- mesiobuccal cusps of the right and left second molar;
- right and left canine cusps;
- the midpoint of right and left maxillary central incisors’ incisal edge.
To improve local accuracy, this initial transformation is refined using traditional ICP together with a multi-resolution strategy that refines the alignment by subsampling the point clouds, and a point-to-plane metric that improves convergence behavior.
Subsequently, the same registration and alignment procedure was applied to the mandibular arch.
At the end of registration procedures, models in final occlusion and with complete geometries to be directly used in preoperative surgical planning were obtained (Figure 8).
At this point, the maxillary and mandibular arches are displayed in an interactive interface with adjustable display parameters. The mandible is held fixed as a reference, while the maxilla is interactively modified through rigid transformations, including translations in mm and rotations in degrees along all axis, controlled via sliders. These controls are expressed using clinically meaningful terminology and indications to ensure intuitive interaction (Figure 9).
The GUI includes tools to restore the configuration, undo the last transformation, view the applied transformation values, and save the result.
Real-time quantitative and qualitative feedback is provided during the interaction. Contacts are visually highlighted, while a heat map dynamically represents the depth of penetration.
The non-penetration constraint can be deactivated in cases where premature contacts prevent the achievement of a stable occlusion. In such situations, the areas of interpenetration are highlighted and identified as regions requiring preoperative occlusal adjustment.
Complete workflow validation
For ensuring a reproducible validation procedure, controlled misalignments were artificially introduced in the MrO to simulate malocclusion conditions and evaluate the robustness of the full digital workflow with respect to a known reference standard.
A surgeon from the Maxillofacial Surgery Unit at AOU Città della Salute e della Scienza di Torino executed the complete digital procedure. After completion of the automatic phase, the surgeon was asked to evaluate whether any further correction was required based on the resulting occlusal relationship.
In such cases, a strict step-by-step protocol was provided, specifying the sequence of actions to be performed in an orderly manner. All adjustments were carried out by moving the maxillary arch while maintaining the mandibular arch as the fixed reference.
Initially, the surgeon was instructed to position the models in frontal view and proceed through the revision steps reported in Table 1. Each clinical parameter had to be evaluated and, when considered necessary, corrected before proceeding to the subsequent step.
If satisfied with the result obtained in the frontal view, the surgeon was instructed to proceed rotating the model in the right lateral view (Table 2).
After all these ordered evaluations and corrections had been completed, and the surgeon was satisfied, resulting occlusal model was saved and stored as an .STL file.
In this validation phase, a transformation matrix was calculated to describe the rotational and translational discrepancies between the occlusion obtained using the full digital workflow and the MrO, with the latter being considered the reference standard. For the whole dataset, the matrix was calculated first after the automatic phase alone, and then after the manual stepwise refinement.
Statistical Analysis
Summary statistical indicators were calculated (Microsoft Excel, version 16.109; Microsoft Corp., Redmond, WA, USA) to facilitate the comparison of the obtained results:
- Mean Value (MV), which represents the average value of the observed errors across all patients;
- Mean Absolute Value (MAV), which represents the average magnitude of the deviations regardless of their sign;
- Standard deviation (SD), to quantify the variability of the data from the mean value.
For each translational (X, Y, and Z axis) and rotational (pitch, roll, and yaw) discrepancy, values obtained after the automatic alignment phase were compared with those recorded after the manual refinement phase to determine whether the refinement procedure significantly reduced positioning errors. Results are reported as mean ± standard deviation (SD), together with the corresponding p - values.
Before comparative analysis, the normality of the paired differences was assessed using the Shapiro–Wilk test. Variables with normally distributed paired differences were analyzed using paired Student’s t-test, whereas Rotation on the Y - axes, which showed a non-normal distribution, was analyzed using the Wilcoxon signed-rank test. Statistical significance was set at p < 0.05.
3. Results
Twenty-one consecutive patients (10 males and 11 females; mean age, 26.8 ± 6.6 years; range, 18–40 years) undergoing orthognathic surgery were included, details are reported in Table 3.
All patients underwent bimaxillary surgery with Le Fort I osteotomy and bilateral sagittal split osteotomy, and 11 patients (52.4%) also underwent genioplasty. The cohort included a broad spectrum of dentofacial deformities.
The discrepancy values between the occlusion obtained through the digital workflow and the MrO, before and after the manual refinement phase, are reported in Table 4 and Table 5, respectively.
Analysis of translational discrepancies revealed that, following automatic alignment, the greatest mean error was observed along the Y-axis (MV = −2.26 ± 2.10 mm) (Table 4).
Although a residual discrepancy remained (Table 5), the comparison with the results obtained after manual refinement demonstrated a statistically significant reduction in Y-axis translational discrepancy (p = 0.02). Specifically, the mean value decreased to −1.17 ± 0.92 mm, indicating improved estimation of the anteroposterior relationship between the arches (Table 6).
The same trend was observed when considering the Mean Absolute Value (MAV). The largest translational error was consistently recorded along the Y-axis, decreasing from 2.54 mm after automatic alignment to 1.26 mm following manual refinement (Table 4 and Table 5).
Translational discrepancies along the Z-axis were considerably smaller, with mean values of −0.91 ± 0.58 mm, before refinement (Table 4). Interestingly, the vertical discrepancy increased in a statistically significant way (p = 0.04) after manual refinement, reaching −1.19 ± 0.44 mm (Table 5 and Table 6). Similarly, smaller MAV values were observed along the Z-axis, measuring 0.93 mm and 1.21 mm before and after refinement, respectively.
The smallest discrepancies were consistently observed along the X-axis, with mean value of 0.32 ± 1.39 mm before refinement. After manual refinement, the mean value decreased to −0.04 ± 0.49 mm (Table 5); however, this difference did not reach statistical significance, as shown in Table 6 (p = 0.22). This observation was further confirmed by the MAV analysis, which showed the lowest values on the X-axis, decreasing from 1.12 mm after automatic alignment to 0.38 mm following manual refinement.
An additional measure of performance is represented by the standard deviation (SD), which reflects the dispersion of errors within the study sample. Following automatic alignment, standard deviations were 1.39 mm, 2.10 mm, and 0.58 mm along the X-, Y-, and Z-axis, respectively, demonstrating considerable variability, particularly in the sagittal dimension. Manual refinement markedly reduced this variability, with standard deviations decreasing to 0.49 mm, 0.92 mm, and 0.44 mm, respectively, indicating greater consistency across patients.
Finally, the translational RMSE confirmed the overall statistically significant improvement associated with manual refinement (p = 0.001) (Table 6). RMSE values decreased from 1.83 ± 0.91 mm after automatic alignment to 1.09 ± 0.39 mm following refinement, providing a global measure of error reduction and demonstrating the effectiveness of the operator-guided adjustment phase (Table 4 and Table 5).
A similar trend is observed in rotational errors.
After automatic alignment, MV of -0.81 ± 1.71°, 0.21 ± 1.08°, and -0.27 ± 3.27° were observed for rotational errors around the X (pitch), Y (roll), and Z axis (yaw), respectively. The greatest improvement after refinement is achieved in yaw rotation (Z-axis), which decreases to 0.3 ± 1.07°, followed by roll rotation (Y-axis), with MV of -0.14 ± 0.44 after refinement phase. Conversely, pitch (X-axis) MV increased to -1.42 ± 1.55.
The same trend was observed when considering the MAV. The largest rotational error was consistently recorded in yaw rotations around the Z-axis (MAV = 2.61) after automatic alignment, and in rotations around the X-axis (pitch) after manual refinement (MAV = 1.95). As for translational discrepancies, while MAV values decreased for yaw and roll (MAV = 0.83 and 0.38, respectively), pitch discrepancies increased (MAV after automatic alignment = 1.55). Notably, the dispersion of rotational errors around the Z-axis is particularly high in automatic alignment, as SD = 3.27°, likely due to asymmetrical arch morphologies that induce compensatory rotations.
As shown in Table 6, no significant differences were observed for individual rotational components (X – axes rotation: p = 0.08; Y – axes rotation: p = 0.39; Z – axes rotation: p = 0.43). However, manual refinement significantly reduces this variability, as SD = 1.07°, indicating greater consistency and control.
The comparison of rotational RMSE further confirms this trend, with a statistically significant reduction from 2° in automatic alignment to 1.35° after manual refinement (p = 0.01) (Table 6).
4. Discussion
In this study, qualitative analysis demonstrated that despite most models achieved plausible occlusion using the automatic procedure alone, in all cases the surgeon considered essential the manual refinement phase for correcting residual errors.
Quantitative analysis demonstrated that, in most cases, limited discrepancies emerged on the validation occlusal models between the automatic and MrO procedures. However, manual refinement improved most measurements, especially the inaccuracies in anteroposterior translation (overjet) and z-axis rotation (yaw) of the maxilla.
In fact, after the automatic alignment, the highest MV error is on the Y-axis; such a high value can be clinically interpreted as a tendency of the system to overestimate the overjet. This behavior arises from the intrinsic nature of automatic alignment algorithms, which aim to geometrically match cusps and fossae, often leading to an excessive anterior positioning of the maxillary arch.
This limitation is consistent with findings reported in the literature. For instance, studies on digital occlusal planning, such as Sabev et al. [43] have shown that although digital workflows can achieve clinically acceptable accuracy, discrepancies are more pronounced along the anteroposterior axis. Similarly, Almadi et al. [44] highlights that the greatest variability in digital occlusion is often associated with sagittal positioning, confirming that this remains a critical challenge for automated systems.
Comparing these results with those obtained through manual refinement, a significant reduction in Y-axis translation errors is observed, with a substantial improvement in the estimation of the anteroposterior position. However, this correction does not eliminate the residual discrepancy.
This observation aligns with previous studies on automatic occlusion reconstruction, such as the algorithm proposed by Chang et al. [45], where it is emphasized that fully automatic approaches struggle to achieve clinically realistic occlusion without operator intervention. The complexity of dental morphology and the absence of functional constraints limit the effectiveness of purely computational alignment strategies. Similarly, when considering the MAV, the largest residual error remains on the Y-axis, despite improvements introduced by manual refinement. This further supports the idea that sagittal alignment represents the most critical and difficult aspect to control in digital occlusion workflows.
Interestingly, translation errors along the Z-axis significantly increased following manual refinement, contrary to what might be expected. While the automatic alignment tends to generate fewer contacts between the arches, without considering functional occlusal relationships, manual refinement promotes improved intercuspation and a more balanced distribution of occlusal contacts. Consequently, the arches are brought into closer occlusion, resulting in an increase in the mean vertical displacement (MV), which changed from −0.91 mm to −1.19 mm.
This increase can also be explained by the different constraints governing the two phases of the workflow. During automatic alignment, the algorithm is strongly driven by non-penetration constraints, which prevent inter-arch collisions. During manual refinement, the operator attempts to achieve a more realistic occlusal relationship. However, because the virtual environment does not provide tactile feedback, the clinician cannot directly perceive or control minor interpenetrations between the arches, as would be possible when manipulating physical casts. As a result, the pursuit of improved intercuspation may lead to a slight increase in vertical displacement and local penetrations. Rather than indicating a deterioration in accuracy, this finding reflects a transition from a purely geometric alignment toward a more physiologically and clinically meaningful occlusal configuration. This interpretation is supported by clinical studies such as Wong et al.46 which emphasize that digital models lack physical interaction and therefore cannot inherently reproduce occlusal contact dynamics. Consequently, clinician-guided refinement remains essential to achieve a realistic and functionally appropriate final occlusion.
Moreover, the reduction in variability in SD for all translational discrepancies agrees with the literature, where digital workflows are often described as reproducible but sensitive to anatomical variability [44]. The introduction of guided refinement reduces this sensitivity, improving robustness across heterogeneous clinical cases. A similar trend is observed in rotational errors.
The largest MAV was recorded for rotational discrepancies around the Z-axis (yaw). Nevertheless, yaw was also the parameter most effectively corrected during manual refinement, with the MAV decreasing from 2.61° to 0.83°. Furthermore, automatic alignment produced a wide dispersion of yaw errors (SD = 3.27°), suggesting a limited ability to consistently manage asymmetrical arch morphologies. Manual refinement substantially reduced this variability (SD = 1.07°), resulting in a more reproducible and controlled final occlusal arrangement.
Conversely, the MAV for rotational discrepancies around the X-axis (pitch) increased from 1.55° to 1.95° following manual refinement. This finding may be explained by the different constraints governing the automatic and manual procedures. The automatic algorithm strictly controls model interpenetration, whereas the operator, while rotating the maxillary arch relative to the mandible to improve posterior occlusal contacts, may inadvertently allow slight interpenetration of the digital models. Unlike conventional model articulation, the virtual environment does not provide tactile feedback, making it more difficult to simultaneously optimize occlusal contacts and monitor collision between the dental arches43. This interpretation is further supported by the directional analysis of the discrepancies. Rotations around the X-axis showed the largest deviation of MV values from zero and consistently exhibited a negative direction both before and after manual refinement, with mean values of −0.81 ± 1.71° and −1.42 ± 1.55°, respectively. These findings suggest a systematic tendency toward the same rotational compensation pattern, reflecting the challenge of balancing contact stability and collision avoidance, particularly in the molar regions, when operating in a purely virtual environment.
Although no statistically significant differences were observed for the individual rotational components (pitch, roll, and yaw), the comparison of the overall rotational RMSE demonstrated a significant reduction in rotational discrepancies, decreasing from 2.00° after automatic alignment to 1.35° following manual refinement (p=0.008). These findings suggest that the refinement process improved the overall rotational accuracy, even though the effect did not reach statistical significance when each rotational axis was analyzed separately.
Overall, both the mean values (MV) and mean absolute values (MAV) of the discrepancies reported in this study remained below ±2 mm for translations and ≤±2° for rotations. Although no universally accepted thresholds currently exist to define the accuracy of a digital occlusion, several previous studies have adopted these values as clinically relevant benchmarks, supporting the validity of the proposed workflow. Comparable levels of accuracy have also been reported in investigations of digital occlusal planning, suggesting that both fully digital and hybrid workflows can achieve clinically acceptable outcomes [43,44].
These findings are consistent with previous clinical and computational studies highlighting the importance of incorporating occlusal contact constraints into digital alignment procedures [47]. Unlike purely geometric matching approaches, workflows that account for occlusal interactions, either through clinician-guided refinement or emerging technologies such as mixed reality environments, have been shown to improve both accuracy and clinical applicability.
The proposed semi-automatic workflow represents a compromise between automation and clinical expertise. By combining the efficiency and objectivity of computational alignment with surgeon-guided refinement, it enhances the precision of the final occlusal setup while improving the reproducibility and robustness of the overall planning process. This advantage becomes particularly relevant in complex cases characterized by significant anatomical variability, where purely automatic approaches may struggle to accurately reproduce the desired occlusal relationships.
Several limitations of the present study should be acknowledged.
First, the sample size was relatively small, and the present findings should be interpreted as preliminary and require confirmation in larger multicentric cohorts. As illustrated in Figure 11, a considerable dispersion of errors was observed, which is likely related to the limited number of patients included. A larger cohort would likely provide more stable estimates and reduce the variability of the measured discrepancies. Moreover, the study population exhibited a limited range of anatomical and surgical variability. Future investigations should evaluate the proposed workflow in more complex clinical scenarios, including atypical segmentation patterns and segmented maxillary arches, to further assess its generalizability and robustness.
Moreover, the inter and intra -operator reproducibility of the manual refinement phase was not evaluated. Future studies should assess inter- and intra-operator variability associated with the use of the proposed interface.
Furthermore, although the framework enables the identification and visualization of occlusal interferences and dental penetrations, the translation of this information into the clinical setting remains operator dependent. While the software can quantify the magnitude and location of an interference, the subsequent selective grinding required to eliminate the discrepancy is currently performed manually by the surgeon during model surgery or intraoperatively. Consequently, the execution of the correction remains dependent on the operator’s experience and judgment, potentially introducing variability between users.
5. Conclusions
Overall, this study developed and validated a fully digital surgeon-oriented interactive framework for occlusal alignment in patients with craniofacial deformities undergoing surgical correction. The automatic alignment algorithm provided a reliable initial approximation of the final occlusion, successfully identifying the principal contact areas and establishing a quantitative framework for occlusal analysis. However, the results demonstrated that a manual refinement phase remains necessary to overcome the intrinsic limitations of automatic matching algorithms and to adapt the occlusal setup to patient-specific anatomical and functional requirements.
The findings also highlight the persistent challenges associated with reproducing occlusal relationships within a purely virtual environment, where the absence of tactile feedback may affect the balance between contact optimization and collision control. Consequently, further development of more robust, adaptive, and clinically informed algorithms is warranted to improve performance across the broad spectrum of dentofacial deformities encountered in clinical practice.
Despite these limitations, the proposed workflow represents a meaningful step toward objective, reproducible, and clinically applicable digital occlusal planning. By combining automated computation with surgeon-guided refinement, it offers a practical strategy for integrating digital technologies into routine orthognathic surgical workflows while maintaining clinical oversight of the final occlusal outcome.
Author Contributions
Conceptualization, Y.G., G.R. and F.M.; methodology, E.C.O. and F.M.; software, E.C.O., F.M., G.B., G.M.G.; validation, Y.G., G.B., G.M.G..; formal analysis, E.C. and F.M.; investigation, G.B., G.M.G.; resources, F.R., E.V. and S.M.; data curation, G.B. and G.M.G .; writing—original draft preparation, Y.G, G.B. and G.M.G..; writing—review and editing, E.C.O.; visualization, F.R. and S.M..; supervision, F.M. and G.R.; project administration, E.V. and G.R. All authors have read and agreed to the published version of the manuscript.
Funding
This research received no external funding.
Institutional Review Board Statement
The study was conducted in accordance with the Declaration of Helsinki. The study protocol was reviewed and approved by the Clinical Research Office of the A.O.U. Città della Salute e della Scienza di Torino (Protocol No. 00013/2026, approved on May 8, 2026).
Informed Consent Statement
Written informed consent was obtained from all subjects involved in the study.
Data Availability Statement
The research data supporting the findings of this study are available from the corresponding author upon reasonable request.
Conflicts of Interest
The authors declare no conflicts of interest.
Abbreviations
The following abbreviations are used in this manuscript:
| MrO | Manual Reference Occlusion |
| IOS | Intraoral Scan |
| 3D | Three-Dimensional |
| STL | Standard Tessellation Language |
| GUI | Graphical User Interface |
| ICP | Iterative Closest Point |
| 2D ICP | Two-Dimensional Iterative Closest Point |
| PCA | Principal Component Analysis |
| RMSE | Root Mean Square Error |
| MV | Mean Value |
| MAV | Mean Absolute Value |
| SD | Standard Deviation |
| BSSO | Bilateral Sagittal Split Osteotomy |
| LFI | Le Fort I Osteotomy |
| LD | Laterodeviation |
| GP | Genioplasty |
| VO | Virtual Occlusion |
References
- Bock JJ, Odemar F, Fuhrmann RAW. Assessment of Quality of Life in Patients Undergoing Orthognathic Surgery. J Orofac Orthop / Fortschritte der Kieferorthopädie. 2009;70(5):407-419.
- Cunningham SJ, Garratt AM, Hunt NP. Development of a condition-specific quality of life measure for patients with dentofacial deformity: II. Validity and responsiveness testing. Community Dent Oral Epidemiol. 2002;30(2):81-90.
- Khadka A, Liu Y, Li J, et al. Changes in quality of life after orthognathic surgery: a comparison based on the involvement of the occlusion. Oral Surgery, Oral Med Oral Pathol Oral Radiol Endodontology. 2011;112(6):719-725.
- Ho CT, Lin HH, Lo LJ. Intraoral Scanning and Setting Up the Digital Final Occlusion in Three-Dimensional Planning of Orthognathic Surgery: Its Comparison with the Dental Model Approach. Plast Reconstr Surg. 2019;143(5):1027e-1036e.
- Liu XJ, Li QQ, Zhang Z, Li TT, Xie Z, Zhang Y. Virtual occlusal definition for orthognathic surgery. Int J Oral Maxillofac Surg. 2016;45(3):406-411.
- Nadjmi N, Mollemans W, Daelemans A, Van Hemelen G, Schutyser F, Bergé S. Virtual occlusion in planning orthognathic surgical procedures. Int J Oral Maxillofac Surg. 2010;39(5):457-462.
- Joshi. Skeletal Malocclusion: A Developmental Disorder With a Life-Long Morbidity. J Clin Med Res. 2014;6(6):399-408.
- Srivastava D, Singh H, Mishra S, Sharma P, Kapoor P, Chandra L. Facial asymmetry revisited: Part I- diagnosis and treatment planning. J Oral Biol Craniofacial Res. 2018;8(1):7-14.
- Rodríguez-Olivos LHG, Chacón-Uscamaita PR, Quinto-Argote AG, Pumahualcca G, Pérez-Vargas LF. Deleterious oral habits related to vertical, transverse and sagittal dental malocclusion in pediatric patients. BMC Oral Health. 2022;22(1):88.
- Awad D, Häfner A, Reinert S, Kluba S. Plaster Casts vs. Intraoral Scans: Do Different Methods of Determining the Final Occlusion Affect the Simulated Outcome in Orthognathic Surgery? J Pers Med. 2022;12(8):1288.
- Pongrácz F, Bárdosi Z. Dentition planning with image-based occlusion analysis. Int J Comput Assist Radiol Surg. 2006;1(3):149-156.
- Wu W, Chen H, Cen Y, Hong Y, Khambay B, Heng PA. Haptic simulation framework for determining virtual dental occlusion. Int J Comput Assist Radiol Surg. 2017;12(4):595-606.
- Wong S, Deng H, Gateno J, et al. Clinical Evaluation of Digital Dental Articulation for One-Piece Maxillary Surgery. J Oral Maxillofac Surg. 2020;78(5):799-805.
- Lee LW, Chen SH, Yu CC, Lo LJ, Lee SR, Chen YR. Stigma, Body Image, and Quality of Life in Women Seeking Orthognathic Surgery. Plast Reconstr Surg. 2007;120(1):225-231.
- Rosa S La, Leonardi R, Ronsivalle V, Cicciù M, Giudice A Lo. Radiographic and diagnostic approaches for mandibular asymmetries in orthodontic practice: a narrative review. J Clin Pediatr Dent. 2024;48(4):1.
- Aditya Tadinada , Sydney Schneider SY. Role of Cone Beam Computed Tomography in Contemporary Orthodontics. Oral Surg Oral Med Oral Pathol Oral Radiol. 2018;24(4):407-415.
- Yamaguchi K, Lonic D, Ko EWC, Lo LJ. An integrated surgical protocol for adult patients with hemifacial microsomia: Methods and outcome. Cray JJ, ed. PLoS One. 2017;12(8):e0177223.
- Lonic D, Pai BCJ, Yamaguchi K, Chortrakarnkij P, Lin HH, Lo LJ. Computer-Assisted Orthognathic Surgery for Patients with Cleft Lip/Palate: From Traditional Planning to Three-Dimensional Surgical Simulation. Cray J, ed. PLoS One. 2016;11(3):e0152014.
- Liao YF, Lo SH. Surgical Occlusion Setup in Correction of Skeletal Class III Deformity Using Surgery-First Approach: Guidelines, Characteristics and Accuracy. Sci Rep. 2018;8(1):11673.
- Schepke U, Meijer HJA, Kerdijk W, Cune MS. Digital versus analog complete-arch impressions for single-unit premolar implant crowns: Operating time and patient preference. J Prosthet Dent. 2015;114(3):403-406.e1.
- Yuzbasioglu E, Kurt H, Turunc R, Bilir H. Comparison of digital and conventional impression techniques: evaluation of patients’ perception, treatment comfort, effectiveness and clinical outcomes. BMC Oral Health. 2014;14(1):10.
- McGuinness NJ, Stephens CD. Storage of Orthodontic Study Models in Hospital Units in the U.K. Br J Orthod. 1992;19(3):227-232.
- Van Noort R. The future of dental devices is digital. Dent Mater. 2012;28(1):3-12.
- Akhil G, Senthil Kumar KP, Raja S, Janardhanan K. Three-dimensional assessment of facial asymmetry: A systematic review. J Pharm Bioallied Sci. 2015;7(Suppl 2):S433-S437.
- Pedersoli L, Dalessandri D, Tonni I, et al. Facial Asymmetry Detected with 3D Methods in Orthodontics: A Systematic Review. Open Dent J. 2022;16(1):1-17.
- McNeill C. Occlusion: What It Is and What It Is Not. J Calif Dent Assoc. 2000;28(10):748-755.
- Shalabi MM, Darwich KMA, Kheshfeh MN, Hajeer MY. Accuracy of 3D Virtual Surgical Planning Compared to the Traditional Two-Dimensional Method in Orthognathic Surgery: A Literature Review. Cureus. 2024;16(11).
- Varga E, Hammer B, Hardy BM, Kamer L. The accuracy of three-dimensional model generation. What makes it accurate to be used for surgical planning? Int J Oral Maxillofac Surg. 2013;42(9):1159-1166.
- Clark JR, Evans RD. Functional Occlusion: I. A Review. J Orthod. 2001;28(1):76-81.
- Wilkat M, Liu S, Schwerter M, et al. A New Approach to Virtual Occlusion in Orthognathic Surgery Planning Using Mixed Reality—A Technical Note and Review of the Literature. J Pers Med. 2023;13(12):1709.
- Xia JJ, Chang YB, Gateno J, Xiong Z, Zhou X. Automated Digital Dental Articulation. In: ; 2010:278-286.
- Roth SD. Ray casting for modeling solids. Comput Graph Image Process. 1982;18(2):109-144.
- Tian S, Huang R, Li Z, et al. A Dual Discriminator Adversarial Learning Approach for Dental Occlusal Surface Reconstruction. Ieracitano C, ed. J Healthc Eng. 2022;2022:1-14.
- Ur Rehman HZ, Lee S. Automatic Image Alignment Using Principal Component Analysis. IEEE Access. 2018;6:72063-72072.
- Koenderink JJ, van Doorn AJ. Surface shape and curvature scales. Image Vis Comput. 1992;10(8):557-564.
- Besl PJ, McKay ND. A method for registration of 3-D shapes. IEEE Trans Pattern Anal Mach Intell. 1992;14(2):239-256.
- Olivetti EC, Marcolin F, Moos S, et al. How to predict the future face? A 3D methodology to forecast the aspect of patients after orthognathic surgeries. Comput Methods Programs Biomed. 2025;265(April):108757.
- Kim HH, Choi S, Chang YI, Yi WJ, Ahn SJ. Developing a three-dimensional statistical shape model of normal dentition using an automated algorithm and normal samples. Clin Oral Investig. 2022;27(2):759-772.
- Barak MM, Geiger S, Chattah NLT, Shahar R, Weiner S. Enamel dictates whole tooth deformation: A finite element model study validated by a metrology method. J Struct Biol. 2009;168(3):511-520.
- Jantarat J, Palamara JE., Messer HH. An investigation of cuspal deformation and delayed recovery after occlusal loading. J Dent. 2001;29(5):363-370.
- Lucas PW, van Casteren A. The wear and tear of teeth. Med Princ Pract. 2015;24 Suppl 1(Suppl 1):3-13.
- Jansen BJ. The Graphical User Interface - An Introduction. SIGCHI Bull. 1998;30(2):1-5.
- Sabev B, Abazi S, Patcas R, et al. Fully digital occlusion planning in orthognathic surgery – A crossover study. J Cranio-Maxillofacial Surg. 2024;52(11):1348-1353.
- Almadi D, Benington P, Ju X, Ayoub A. Reproducibility and reliability of digital occlusal planning for orthognathic surgery. Int J Oral Maxillofac Surg. 2023;52(10):1074-1080.
- Chang YB, Xia JJ, Gateno J, Xiong Z, Zhou X, Wong STC. An automatic and robust algorithm of reestablishment of digital dental occlusion. IEEE Trans Med Imaging. 2010;29(9):1652-1663.
- Wong S, Deng H, Gateno J, et al. Clinical Evaluation of Digital Dental Articulation for One-Piece Maxillary Surgery. J Oral Maxillofac Surg. 2020;78(5):799-805.
- Waard O de, Baan F, Bruggink R, Bronkhorst EM, Kuijpers-Jagtman AM, Ongkosuwito EM. Digital Orthodontic Setups in Orthognathic Surgery: Evaluating Predictability and Precision of the Workflow in Surgical Planning. J Clin Med. 2025;14(15).
Figure 1.
(a) Depth map of the maxilla before cropping; (b) Depth map of the maxilla after cropping.
Figure 1.
(a) Depth map of the maxilla before cropping; (b) Depth map of the maxilla after cropping.
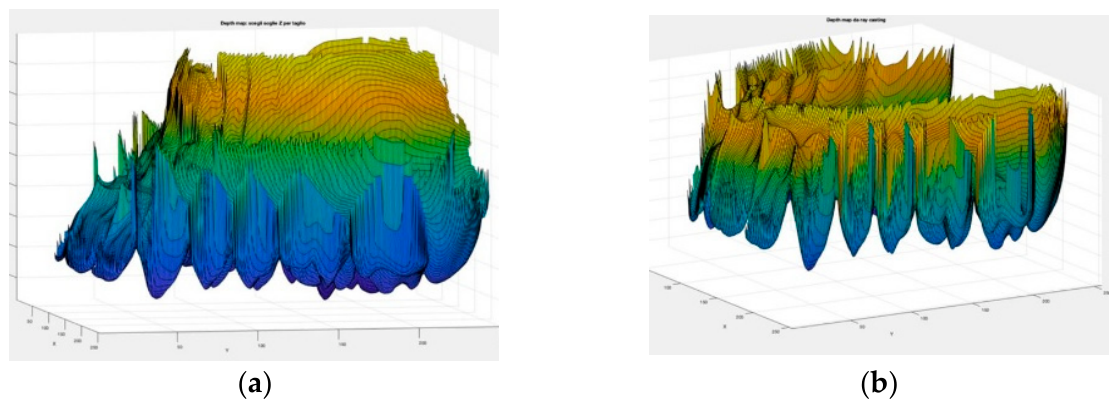
Figure 2.
(a) Shape index of maxilla; (b) Shape index of mandible.
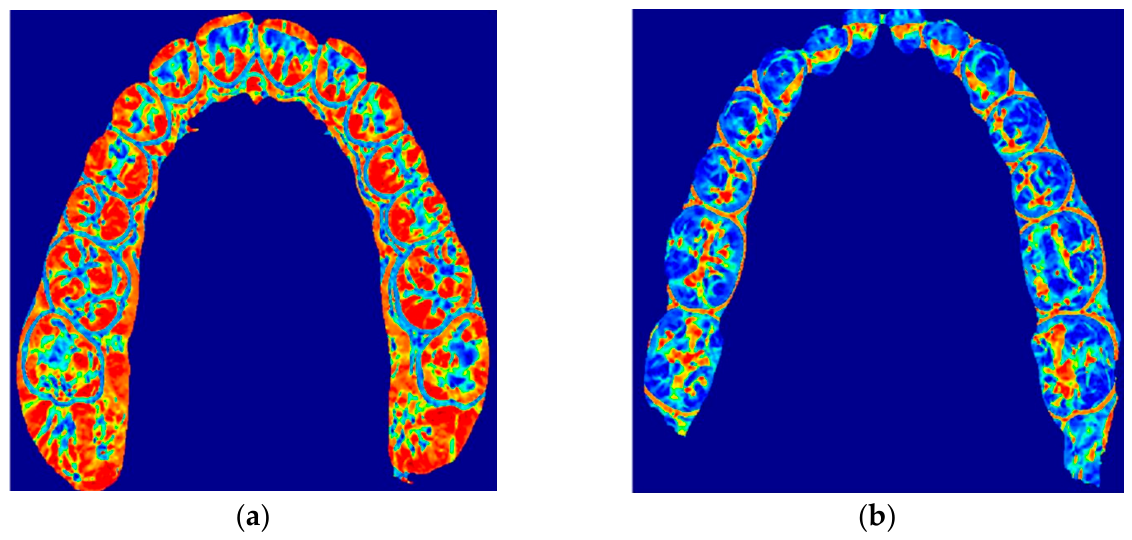
Figure 3.
Example of the alignment between corresponding dental arches using 2D ICP on shape index.
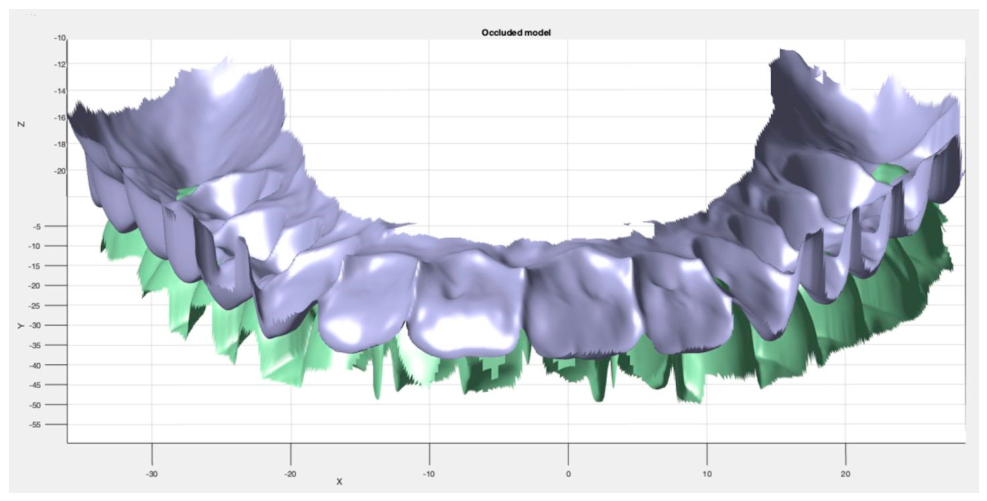
Figure 4.
(a) Maxilla plane not parallel to the mandible one; (b) Maxillary plane parallel to the mandibular one, after rotation around X-axis was corrected.
Figure 4.
(a) Maxilla plane not parallel to the mandible one; (b) Maxillary plane parallel to the mandibular one, after rotation around X-axis was corrected.
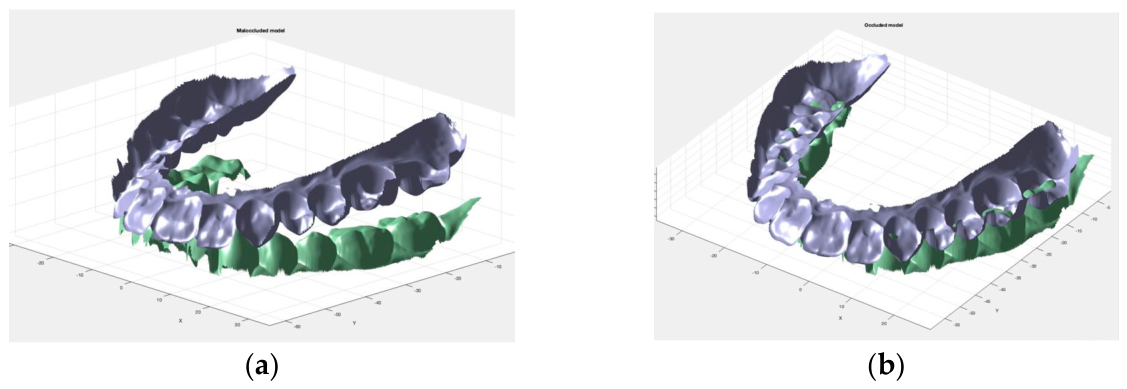
Figure 5.
Views of the dental arches after applying the non-penetration constraint. (a) Left lateral view; (b) Caudal view; the points of penetration are highlighted.
Figure 5.
Views of the dental arches after applying the non-penetration constraint. (a) Left lateral view; (b) Caudal view; the points of penetration are highlighted.
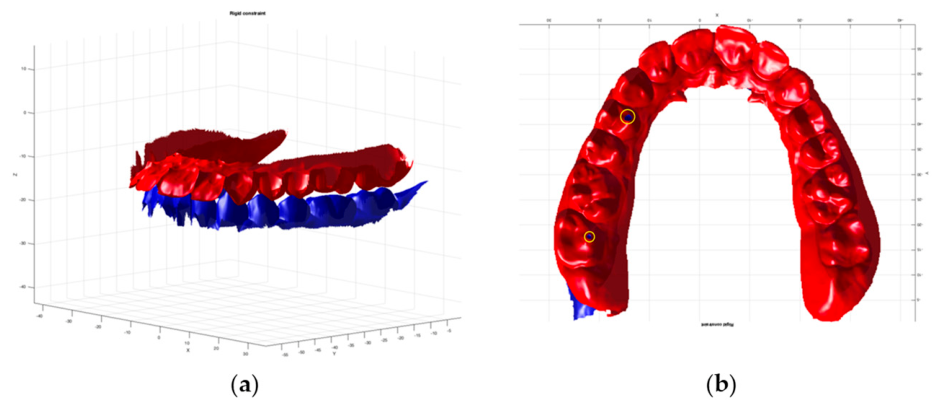
Figure 6.
Views of the dental arches after the automatic refinement phase. In the superior view, the penetration points are highlighted. (a) Lateral left view; (b) Caudal view.
Figure 6.
Views of the dental arches after the automatic refinement phase. In the superior view, the penetration points are highlighted. (a) Lateral left view; (b) Caudal view.
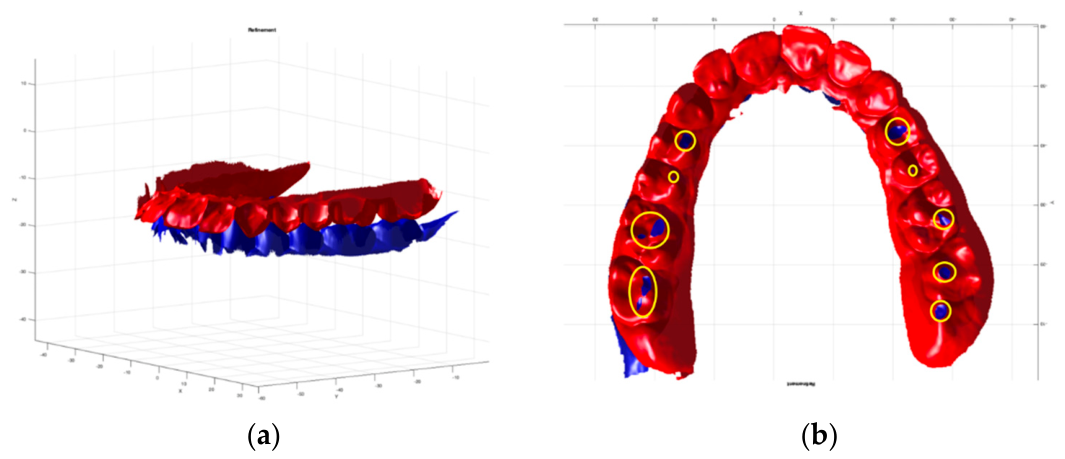
Figure 7.
(a) Visualization of the operating interface and fiducial points placement on the maxillary arch on the IOS STL model; (b) Visualization of the operating interface and fiducial points placement on the maxillary arch on the depth map generated by the automatic algorithm; (c) Superimposition of the two surfaces to establish point correspondence and registration.
Figure 7.
(a) Visualization of the operating interface and fiducial points placement on the maxillary arch on the IOS STL model; (b) Visualization of the operating interface and fiducial points placement on the maxillary arch on the depth map generated by the automatic algorithm; (c) Superimposition of the two surfaces to establish point correspondence and registration.
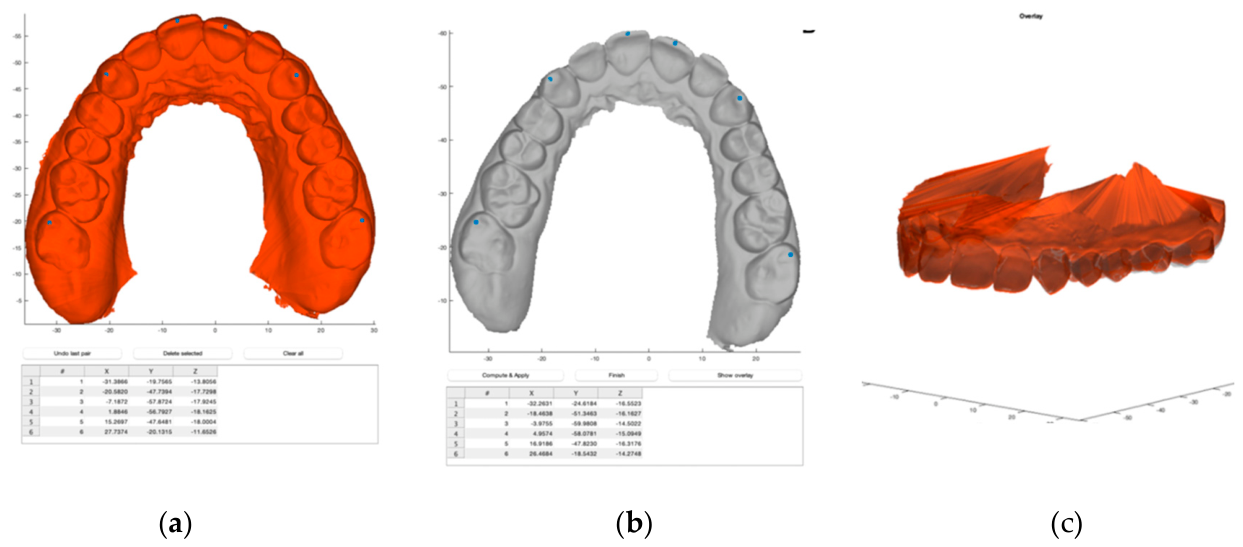
Figure 8.
Complete visualization of the arches in occlusion after the automatic digital procedure.
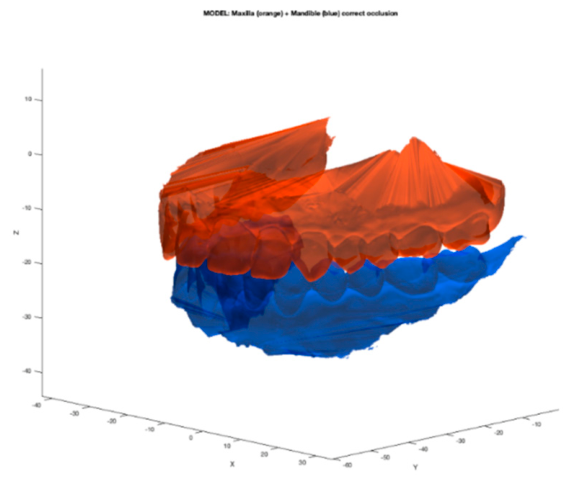
Figure 9.
GUI with manual adjustment interface.
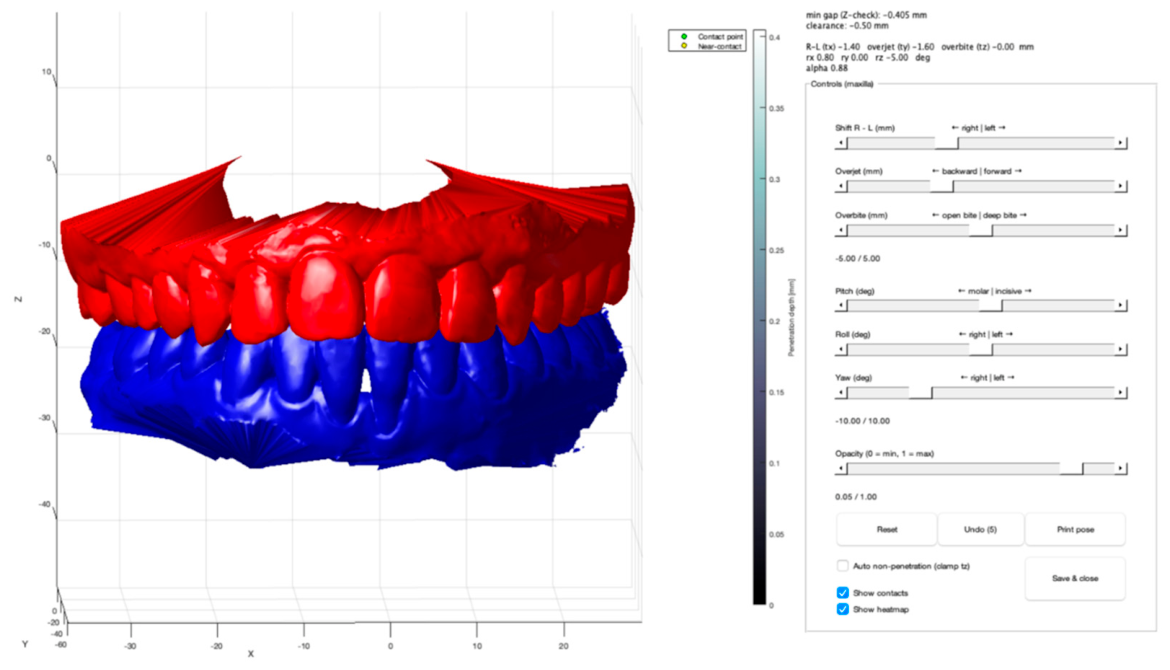
Figure 10.
Mean Values (MV) of translational and rotational errors.
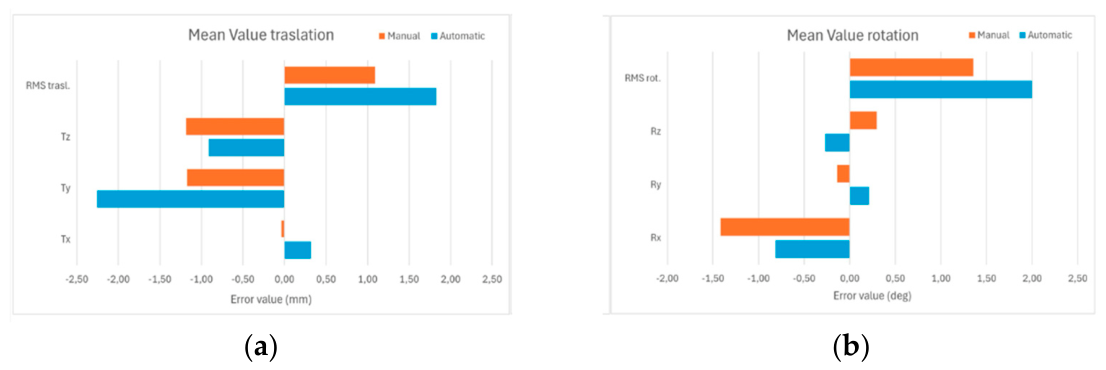
Figure 11.
Mean Absolute Value (MAV) of translation and rotation errors.
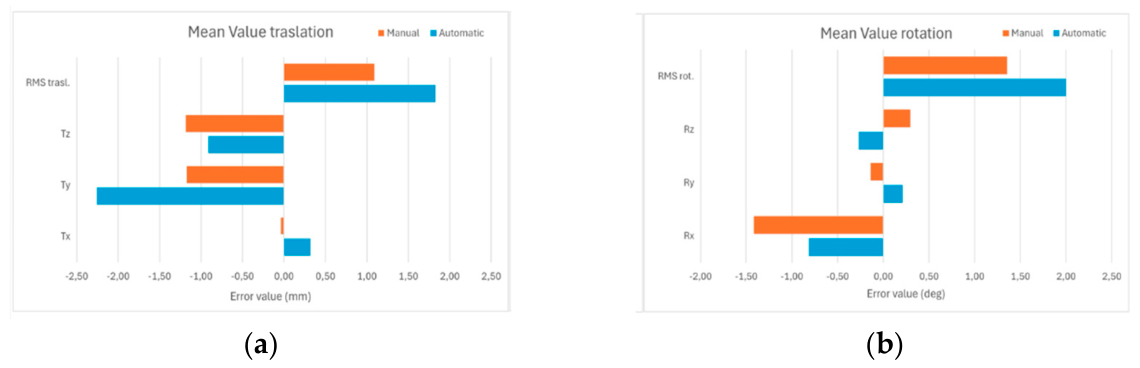

Table 1.
Standardized movement in frontal view.
| Clinical parameter | Movement |
|---|---|
| F1. Interincisal lines alignment | Shift on the X-axis |
| F2. Maxillary occlusal plan rotation (yaw) | Rotation on Z-axis |
| F3. Interincisal lines alignment after yaw correction | Shift on the X-axis |
| F4. Occlusal canting (roll) | Rotation on Y-axis |
F = Frontal view.
Table 2.
Standardized movement in lateral view.
| Clinical parameter | Movement |
|---|---|
| L1. Canine occlusal relationship | Shift on the Y-axis |
| L2. Overjet | Shift on the Y-axis |
| L3. Maxillary occlusal plan inclination (pitch) | Rotation on X-axis |
| L4. Overbite | Shift on the Z-axis |
| L5. Changes in maxillary occlusal plane inclination following overbite correction in cases where the result achieved during phase L3 was modified during phase L4 due to the non-penetration constraint (pitch) | Rotation on X-axis |
L = Lateral view.
Table 3.
Clinical dataset: demographic data, pathology and surgical treatment.
| Patient | Age | Gender | Pathology | Surgery |
|---|---|---|---|---|
| 01 | 24 | M | MnAs | BSSO |
| 02 | 28 | F | MnP, MnAs, MxR | LFI; BSSO; GP |
| 03 | 19 | F | MnP, MnAs, MxR | LFI; BSSO |
| 04 | 33 | F | MnAs, MxAs | LFI; BSSO; GP |
| 05 | 40 | M | MnP, MxR | LFI; BSSO |
| 06 | 21 | M | MnP, MnAs, MxR, | LFI; BSSO; GP |
| 07 | 24 | M | MnAs, MxR and hypoplasia | LFI; BSSO |
| 08 | 21 | F | MnP, MnLD, MxR | LFI; BSSO |
| 09 | 21 | F | MnP, MnAs, MxR | LFI; BSSO |
| 10 | 27 | F | MnR, deepbite | LFI; BSSO; GP |
| 11 | 18 | F | MnAs, MxR | LFI; BSSO |
| 12 | 26 | F | MnP, MxR | LFI; BSSO |
| 13 | 40 | M | MnR, MnAs, MxR | LFI; BSSO; GP |
| 14 | 24 | M | MnR, deepbite | LFI; BSSO; GP |
| 15 | 27 | M | MnR, MnAs, MxR, openbite | LFI; BSSO; GP |
| 16 | 30 | M | MxR | LFI; BSSO |
| 17 | 33 | F | MnR, MnAs, MxR | LFI; BSSO; GP |
| 18 | 20 | M | MnAs, MxR | LFI; BSSO |
| 19 | 20 | F | MnR, MxR | LFI; BSSO; GP |
| 20 | 26 | F | MnR, MxR, | LFI; BSSO; GP |
| 21 | 33 | F | MnAs, MxR | LFI; BSSO; GP |
M = male; F = female; Mn = mandibular; Mx = maxillary; As = asymmetry; R = retrusion; P = protrusion; LD = laterodeviation; LFI = le Fort I osteotomy; BSSO = bilateral sagittal split osteotomy; GP = genioplasty.
Table 4.
Errors resulting from automatic alignment computational framework.
| Subject | Trasl X | Trasl Y | Trasl Z | RMSE_trasl | Rot X | Rot Y | Rot Z | RMSE_rot |
|---|---|---|---|---|---|---|---|---|
| p01 | -0.27 | -1.44 | -0.05 | 0.85 | -0.64 | -0.33 | -1.75 | 1.09 |
| p02 | -0.37 | -3.04 | -0.91 | 1.84 | 1.05 | -0.01 | 6.06 | 3.55 |
| p03 | -0.39 | -1.41 | -0.99 | 1.02 | 0.1 | -0.85 | -4.25 | 2.5 |
| p04 | 2.13 | 0.89 | -1.35 | 1.54 | -2.21 | -0.15 | 3.32 | 2.31 |
| p05 | 0.49 | -4.33 | -1.12 | 2.6 | -2.82 | -0.52 | 1.34 | 1.83 |
| p06 | 1.01 | -2.67 | -1.49 | 1.86 | 2.23 | 0.78 | 6.14 | 3.8 |
| p07 | 0.52 | -1.56 | 0.24 | 0.96 | 1.81 | 3.64 | 3.81 | 3.22 |
| p08 | -1.44 | -4.41 | -1.3 | 2.78 | -0.66 | 1.1 | -0.08 | 0.74 |
| p09 | -2.11 | -4.71 | -0.47 | 2.99 | -0.63 | 0.58 | -1.76 | 1.13 |
| p10 | -0.3 | -1.36 | -1.11 | 1.03 | -2.67 | 0.23 | -0.17 | 1.55 |
| p11 | 1.55 | -6.86 | -0.22 | 4.06 | -0.53 | -0.39 | -1.94 | 1.18 |
| p12 | 1.73 | -2.56 | -1.31 | 1.94 | -2.66 | -0.17 | -3.58 | 2.58 |
| p13 | 3.0 | -1.71 | -1.97 | 2.29 | -3.62 | 0.58 | -1.48 | 2.28 |
| p14 | 1.55 | -1.42 | -1.37 | 1.45 | -1.22 | -0.68 | -0.67 | 0.89 |
| p15 | 2.09 | -4.38 | -1.55 | 2.94 | -0.86 | -0.63 | 3.1 | 1.89 |
| p16 | -2.25 | 0.05 | -0.41 | 1.32 | -3.45 | 2.2 | -3.79 | 3.22 |
| p17 | 0.43 | 0.54 | -0.92 | 0.67 | -1.02 | 0.58 | -0.15 | 0.68 |
| p18 | -0.79 | -1.22 | -0.24 | 0.85 | 1.61 | 0.23 | -1.18 | 1.16 |
| p19 | -0.43 | 1.45 | -0.25 | 0.88 | 0.81 | -0.31 | 0.77 | 0.67 |
| p20 | -0.12 | -4.31 | -0.87 | 2.54 | -1.76 | -0.74 | -5.23 | 3.21 |
| p21 | 0.64 | -2.98 | -1.45 | 1.95 | 0.1 | -0.71 | -4.14 | 2.43 |
| MV | 0.32 | -2.26 | -0.91 | 1.83 | -0.81 | 0.21 | -0.27 | 2.0 |
| MAV | 1.12 | 2.54 | 0.93 | 1.83 | 1.55 | 0.73 | 2.61 | 2.0 |
| SD | 1.39 | 2.1 | 0.58 | 0.91 | 1.71 | 1.08 | 3.27 | 1.01 |
RMSE = Root Mean Square Error; MV = Mean Value; MAV = Mean Absolute Value; SD = Standard Deviation.
Table 5.
Errors resulting after standardized manual refinement phase.
| Subject | Trasl X | Trasl Y | Trasl Z | RMSE_trasl | Rot X | Rot Y | Rot Z | RMSE_rot |
|---|---|---|---|---|---|---|---|---|
| p01 | 0.89 | -1.23 | -0.74 | 0.98 | -1.85 | -0.09 | 2.35 | 1.72 |
| p02 | -1.13 | -0.68 | -0.82 | 0.89 | 1.84 | -0.09 | 1.06 | 1.23 |
| p03 | -0.74 | -0.9 | -1.2 | 0.96 | -2.76 | -0.06 | 0.49 | 1.62 |
| p04 | 0.4 | -0.57 | -1.22 | 0.81 | -2.63 | -0.33 | 0.1 | 1.53 |
| p05 | -0.14 | -1.07 | -1.37 | 1.01 | -2.23 | -0.74 | 1.94 | 1.76 |
| p06 | -0.02 | -2.61 | -1.39 | 1.71 | 1.79 | -0.78 | 1.33 | 1.36 |
| p07 | 0.54 | -2.76 | -1.56 | 1.86 | -2.18 | 0.19 | -0.34 | 1.28 |
| p08 | 0.08 | -2.07 | -1.42 | 1.45 | -2.06 | 0.29 | 0.08 | 1.2 |
| p09 | -0.44 | -1.45 | -1.61 | 1.28 | -1.78 | 0.74 | 0.37 | 1.13 |
| p10 | -0.07 | -2.31 | -1.13 | 1.49 | -3.01 | 0.43 | 0.03 | 1.76 |
| p11 | 0.47 | -0.73 | -1.26 | 0.88 | -0.33 | -0.18 | -1.67 | 0.99 |
| p12 | 0.17 | -1.45 | -1.74 | 1.31 | -2.58 | 0.44 | 0.38 | 1.53 |
| p13 | 0.29 | -2.07 | -1.31 | 1.42 | -2.53 | 0.01 | -0.19 | 1.46 |
| p14 | -0.16 | -0.71 | -1.13 | 0.78 | -1.82 | -0.89 | 0.53 | 1.21 |
| p15 | -0.24 | -1.58 | -1.48 | 1.26 | -2.72 | -0.13 | -0.1 | 1.57 |
| p16 | -0.36 | -0.14 | -0.89 | 0.56 | -1.47 | -0.35 | 0.98 | 1.04 |
| p17 | -0.07 | -0.24 | -0.89 | 0.54 | -0.42 | 0.38 | -1.62 | 0.99 |
| p18 | -0.22 | 0.84 | -0.69 | 0.64 | -1.33 | -0.65 | 1.22 | 1.11 |
| p19 | -0.73 | 0.13 | 0.2 | 0.44 | 2.01 | -0.32 | 0.76 | 1.25 |
| p20 | -0.03 | -1.74 | -1.58 | 1.36 | -2.41 | -0.19 | 0.22 | 1.4 |
| p21 | 0.7 | -1.24 | -1.67 | 1.27 | -1.31 | -0.61 | -1.72 | 1.3 |
| MV | -0.04 | -1.17 | -1.19 | 1.09 | -1.42 | -0.14 | 0.3 | 1.35 |
| MAV | 0.38 | 1.26 | 1.21 | 1.09 | 1.95 | 0.38 | 0.83 | 1.35 |
| SD | 0.49 | 0.92 | 0.44 | 0.39 | 1.55 | 0.44 | 1.07 | 0.25 |
RMSE= Root Mean Square Error; MV= Mean Value; MAV= Mean Absolute Value; SD= Standard Deviation.
Table 6.
Comparison of translational and rotational discrepancies between virtual and reference occlusion before and after manual refinement. Pre-refinement values were obtained using the automatic pipeline alone, whereas post-refinement values were measured following the manual refinement phase.
Table 6.
Comparison of translational and rotational discrepancies between virtual and reference occlusion before and after manual refinement. Pre-refinement values were obtained using the automatic pipeline alone, whereas post-refinement values were measured following the manual refinement phase.
| Variable | Pre - refinement MV | Post - refinement MV | p-value |
|---|---|---|---|
| Translation X (mm) | 0.32 | -0.04 | 0.22 |
| Translation Y (mm) | -2.26 | -1.17 | 0.02 |
| Translation Z (mm) | -0.91 | -1.19 | 0.04 |
| Translation RMSE (mm) | 1.83 | 1.09 | < 0.01 |
| Rotation X (°) | -0.81 | -1.42 | 0.08 |
| Rotation Y (°) | 0.21 | -0.14 | 0.39* |
| Rotation Z (°) | -0.27 | 0.30 | 0.43 |
| Rotation RMSE (°) | 2.00 | 1.35 | 0.01 |
MV= Mean Value. RMSE = Root Mean Square Error. * Analyzed using the Wilcoxon signed-rank test due to non-normal distribution.
Disclaimer/Publisher’s Note: The statements, opinions and data contained in all publications are solely those of the individual author(s) and contributor(s) and not of MDPI and/or the editor(s). MDPI and/or the editor(s) disclaim responsibility for any injury to people or property resulting from any ideas, methods, instructions or products referred to in the content. |
© 2026 by the authors. Licensee MDPI, Basel, Switzerland. This article is an open access article distributed under the terms and conditions of the Creative Commons Attribution (CC BY) license (http://creativecommons.org/licenses/by/4.0/).
Copyright: This open access article is published under a Creative Commons CC BY 4.0 license, which permit the free download, distribution, and reuse, provided that the author and preprint are cited in any reuse.


