

Submitted:
24 July 2026
Posted:
27 July 2026
You are already at the latest version
Abstract
In recent years, increasing attention has been devoted to improving cyclists’ safety in road traffic, particularly on roads without separated cycling infrastructure. Advisory cycle lanes (2–1 roads) have recently been introduced in several European countries on narrow roads where conventional cycling facilities cannot be provided. However, evidence regarding their safety effects remains limited. This paper evaluates the effects of advisory cycle lanes on overtaking behaviour and crash occurrence on selected roads in and around Maribor, Slovenia. The study combines OpenBikeSensor measurements of lateral passing distance, traffic volume and speed data, and a before-and-after analysis of police-reported crashes. In total, 970 overtaking manoeuvres were recorded on six streets with advisory lanes and comparable control streets without cycling infrastructure. Advisory bike lanes were associated with greater lateral passing distances, with mean clearance increasing from 135 cm to 156 cm. Nevertheless, around 40–50% of overtakes still occurred within 1.5 m of the cyclist. Crash analysis indicated reductions of about 22% in total crashes and 38% in cyclist-involved crashes, although the small number of crashes warrants cautious interpretation. The collected data enable a comparison of traffic behaviour and safety effects of advisory cycle lanes in Slovenia, providing a basis for future planning of traffic infrastructure aimed at improving the coexistence of cyclists and motor vehicle drivers.
Keywords:
urban cycling safety
; cycle lanes
; 30 km/h zones
; before-and-after study
; overtaking distance
; traffic calming
; 2–1 roads
; open bike sensor
1. Introduction
Cycling is widely recognised as a key component of sustainable and healthy urban mobility, yet in many cities its modal share remains modest [1,2]. Among the many factors shaping people’s willingness to cycle, safety – and especially how safe cyclists feels – plays a central role. Previous works consistently shows that perceived crash risk is one of the main reasons why many people either do not cycle or cycle less than they would like [3,4,5]. At the same time, people who cycle only occasionally are often those most sensitive to feelings of insecurity and therefore crucial if cities wish to grow cycling mode share [6,7].
A useful starting point is the distinction between objective and subjective safety. Objective safety typically refers to crash and injury risk as measured in police records or hospital data, while subjective safety captures how safe or threatened road users feel in a given situation [8,9,10]. For decades, cycling safety policy and research focused mainly on objective indicators, aiming to reduce crash rates through infrastructure design and traffic regulation. More recently, there has been a growing emphasis on incorporating the “specific requirements and needs of local people and their perception of traffic” into planning [11], with subjective safety explicitly recognised as a precondition for the acceptance and everyday use of cycling infrastructure [6,7]. Representative surveys such as the German Fahrradmonitor show that subjective safety can change over time – for instance, the share of cyclists reporting that they feel “very/mostly safe” increased from 53% in 2017 to 63% in 2021 – and that perceived dangers are strongly linked to traffic volume, lack of cycle lanes, insufficient separation from motor traffic and inconsiderate driver behaviour [12,13].
Infrastructure is one of the most powerful levers for improving both objective and subjective cycling safety [14]. Numerous studies suggest that physically separated cycle lanes can substantially reduce crash risk compared to mixed-traffic conditions, particularly on busy streets with higher motor-traffic speeds [15,16,17]. Painted cycle lanes without physical separation can also improve safety in some contexts, although the magnitude and direction of this effect depend on factors such as lane width, speed limit and junction design [18,19,20,21]. At the same time, several authors point out that certain types of infrastructure – for example, cycle tracks with poor intersection treatments – may inadvertently increase specific crash types, underlining the importance of detailed design rather than simply the presence or absence of a cycle facility [17,20,22].
Subjective safety patterns across different facilities broadly mirror this picture, but not perfectly. Large-scale stated-preference and comfort studies consistently show that cyclists and potential cyclists feel most comfortable on physically separated tracks, followed by buffered or wide painted lanes, and least safe in mixed-traffic conditions without dedicated space [23,24,25]. The “How safe do you feel?” survey of subjective safety on various cycling lane types confirms that people strongly prefer facilities that provide clear, continuous and visually distinct space for cycling; conversely, designs such as narrow lanes adjacent to parked cars or high-speed traffic are perceived as unsafe even if formally designated as cycling infrastructure [3,4,5]. However, several studies also show that subjective and objective risk can diverge. For example, crash risk on protected cycle tracks is often lower than cyclists believe, whereas multi-use paths may feel safe but exhibit relatively higher crash involvement [26,27,28].
A particularly critical situation, both for actual crashes and for perceived risk, is the overtaking of cyclists by motor vehicles [29]. On undivided roads, collisions arising from overtaking manoeuvres represent a prominent crash type and are associated with comparatively severe injuries [7,30,31]. Even when no crash occurs, closely passing vehicles are frequently experienced as “near misses” [3], and repeated exposure to such events – or even their anticipation – can substantially reduce people’s propensity to cycle for everyday trips [32]. In recognition of this, many countries have introduced legal minimum passing distances (e.g., 1.5 m in built-up areas in Germany, France, Czechia, Portugal, and Spain), yet these thresholds are largely derived from court rulings rather than systematic evidence on what distances cyclists actually experience as safe or stressful [33].
A growing body of research uses instrumented bicycles to measure lateral passing distance and investigates which factors influence it. Studies from Australia and Europe report mean passing distances in the order of 1.3-1.7 m and indicate that a non-trivial share of overtakes occur at distances below 1.0 m [34,35,36,37]. Results concerning infrastructure are nuanced: in Melbourne and the Australian Capital Territory, on-road painted cycle lanes we cycle re associated with shorter passing distances compared to comparable streets without cycle lanes [34,35], whereas a multi-city Australian study found that physically protected lanes effectively eliminated very close passes and that painted lanes still performed better than having no designated facility at all [36]. In Brussels, Ampe et al. [37] reported no significant difference between a shared lane and an on-road lane in terms of average passing distance, while earlier work in Taiwan and Canada suggested that the introduction of cycle lanes can increase lateral clearance and reduce critically close events [38,39]. Meta-analytic work summarises these findings as context-dependent and highlights the importance of speed limits, vehicle type, lane and shoulder width, and the presence of parked cars as key determinants of passing distance [40,41].
Beyond objective measurements, several studies have examined how cyclists sub-jectively experience overtaking. On rural roads, perceived risk increases markedly with higher overtaking speeds and smaller lateral distances [42,43]. Beck et al. [32] combined button presses signalling “too close/unsafe” passes with sensor-based distance measurements and found that only about 1% of overtakes were flagged as unsafe, but the probability of a button press rose sharply for small distances, higher speeds and streets without either parking or a cycle lane. Physiological approaches using wearables show that overtaking is one of the main stressors in everyday cycling, with roughly one in six recorded overtaking events triggering a measurable stress response; the likelihood of stress increases strongly for passing distances below approximately 1.6 m, lending empirical support to the commonly cited 1.5 m rule as a “feel-safe” threshold [33].
A recurring theme in this literature is that road type and cycling infrastructure influence both objective passing distances and subjective assessments of safety, but not always in the same direction. In 30 km/h zones, von Stülpnagel et al. [28] found that streets with dedicated cycling space, such as cycle lanes or cycling boulevards, actually exhibited shorter passing distances than comparable streets without cycling infrastructure, even though survey respondents rated the former as safer. Similar misalignments between perceived and observed risk have been documented for cycling tracks, multi-use paths and streets with contraflow cycling [26,27]. These findings suggest that visual cues of dedicated space and reduced speed limits can increase cyclists’ feeling of safety even where they do not lead to larger passing distances, and that local micro-environmental factors – such as the presence of oncoming traffic, parking, tree lines, or curb extensions – may shape subjective safety in ways not captured by coarse infrastructure categories alone.
In some European countries, advisory cycle lanes and 2–1 streets have emerged as a design for low-speed mixed-traffic streets. In these layouts, the carriageway is shared between motor vehicles and bicycles, but the cross-section visually reserves a central or edge-adjacent space for cyclists through dashed lines, coloured surfaces or symbols, while motor vehicles are expected to encroach on this space only when necessary and at low speed. Such designs are attractive to municipalities because they can be implemented within constrained cross-sections and at relatively low cost compared to fully separated tracks. However, from a safety perspective, they occupy an ambiguous position: they promise more clearly defined space for cyclists without providing physical protection, and they may simultaneously encourage drivers to overtake within narrow widths, potentially leading to small lateral clearances. Existing empirical work on related facility types – such as cycling boulevards and mixed-traffic streets with visual priority for bicycles – suggests that they are perceived as safer than ordinary mixed traffic but less safe than protected tracks [23,24,25], while the limited available passing-distance data indicate that dedicated space on low-speed streets does not necessarily guarantee larger clearances [28].
Despite substantial progress in understanding cyclist-motorist interactions, there is still little empirical evidence on how advisory cycle lanes and similar mixed-traffic solutions affect both objective passing distance and cyclists’ perceived safety, especially in outside countries with high cycling rates. Existing studies either focus on standard cycle lanes and protected tracks or treat bicycle streets and cycling boulevards in aggregated infrastructure categories, without disentangling the role of specific design elements such as remaining carriageway width, presence of parking or interaction with oncoming traffic.
This paper addresses this gap by examining overtaking interactions on streets with advisory cycle lanes (called 2–1 roads) and comparable streets without such facilities, combining instrumented-bicycle measurements of passing distance with measures of perceived safety. In doing so, it contributes to the ongoing debate on how to design cost-effective, mixed-traffic cycling infrastructure that not only reduces crash risk but also aligns with cyclists’ subjective need for safe and comfortable everyday riding.
2. Literature Review
Improving cyclist safety is a major focus of European transport research, as urban traffic environments pose serious risks to bicyclists. Cyclists are among the most vulnerable road users, accounting for roughly 8% of all road fatalities in the EU (2,160 cyclist deaths in 2018), and a majority of these fatalities occur on urban roads in collisions with motor vehicles [44]. This literature review summarizes key findings on how factors such as vehicle speeds, road design, and cycling infrastructure affect cyclist safety, road user behaviour, and crash rates.
2.1. Vehicle Speed and Crash Risk
Numerous studies confirm a strong link between vehicle speed and crash risk and severity. Meta-analyses of the “power model” show that even a small increase in average speed leads to a disproportionately large increase in crash frequency and especially fatalities; for example, a 5% increase in mean speed can produce around a 20% increase in fatal crashes [45,46].
Pedestrians and cyclists are particularly vulnerable. Rosén and Sander [47] showed that the fatality risk for a struck pedestrian rises steeply with impact speed: the probability of fatal injury is low at urban speeds but increases rapidly beyond about 50 km/h. Similar relationships are reported in WHO safety reports and European speed reviews, which recommend keeping impact speeds with unprotected road users well below 50 km/h.
Lower speed limits and accompanying traffic-calming measures have been shown to yield substantial safety benefits. Reviews of city-wide 30 km/h (or 20 mph) programmes in Europe consistently find sizeable reductions in crashes and serious injuries when speed limits are lowered and enforced on residential and distributor streets [48,49]. These benefits are not confined to objective safety: slower traffic also improves cyclists’ and pedestrians’ subjective sense of safety, which can encourage a shift from driving to walking and cycling.
2.2. Speed Dispersion and Speed-Limit Credibility
Not only the mean speed but also the spread of speeds on a road (speed dispersion) affects safety. Analyses of UK urban roads by Taylor et al. [50] show that injury accident frequency increases rapidly with both higher mean speeds and a larger coefficient of variation of speeds, indicating that greater speed dispersion is associated with higher crash risk. This is particularly important for cyclists: if motor vehicles travel at similar, moderated speeds, drivers can more easily anticipate and safely execute overtakes of slower cyclists.
Recent work by Arias et al. [51] on the arterial network in Georgia, USA, found that the difference between the 85th and 50th percentile speeds is a robust predictor of crashes involving pedestrians or cyclists: larger gaps between these percentiles correspond to higher crash risk for vulnerable road users. Design measures such as advisory cycle lanes, lane narrowing, or visual gateways may reduce this dispersion by signalling a low-speed, mixed-traffic environment and encouraging more uniform speeds.
Traffic engineers also stress the “credibility” of speed limits –whether the road’s visual appearance corresponds to the posted limit. Research on self-explaining roads and credible speed limits in the Netherlands and elsewhere shows that when a street looks like a low-speed environment (narrow cross-section, few lanes, no centre line, side friction), drivers naturally slow down and comply better with modest limits [45,52]. Conversely, wide, straight arterials signed at low speeds often generate poor compliance. In practice, a well-matched design – for example, narrow lanes and the absence of a centre line – can make lower limits partially self-enforcing. This principle, embedded in the Dutch “Sustainable Safety” policy and similar approaches, implies that road design and speed signage should reinforce each other to keep actual speeds low and safe where cyclists mix with motor traffic.
2.3. Overtaking Clearance
Maintaining a safe lateral clearance when passing cyclists is another critical factor for safety [29]. Based on a growing body of on-road sensor studies and policy reports, many experts and agencies converge on a minimum passing distance of about 1.5 m in urban areas, with some jurisdictions allowing 1.0 m at lower speeds and requiring 2.0 m at higher speeds or outside built-up areas [53,54,55]. Smaller distances are associated with higher stress and perceived danger among cyclists. New Zealand field research combining over 6,000 overtaking events found that clearances of at least 1.0 m at speeds below 60 km/h and 1.5 m at higher speeds correspond to comfort levels above 90% of interactions, whereas smaller gaps were disproportionately associated with rider discomfort, especially on higher-speed roads [53].
Many countries now codify these distances in law. Germany, France, Spain, Portugal, and more recently, the Czech Republic have introduced explicit 1.5 m minimum lateral distances when overtaking cyclists in built-up areas [33,54], with Slovenia likewise establishing this requirement as a legally binding safety standard [56]. However, achieving this distance on narrow streets can be impossible without crossing into the opposite lane. On a typical ~3.0 m-wide lane with oncoming traffic, a driver cannot safely overtake a cyclist while maintaining a 1.5 m gap without waiting for a gap in opposing traffic.
Advisory cycle lanes (also known as wide edge lanes) can help by removing a rigid centre line, effectively giving drivers flexible use of the full carriageway width. Observational and instrumented-bike studies generally show that where an edge line delineates a cycling space, most drivers provide adequate or larger clearance than on similar streets without any marking [36,38]. Chuang et al. [38], using a quasi-naturalistic cycling method in Taiwan, found that the presence of a solid white line separating cyclists from motor traffic increased initial passing distance and reduced the frequency of very close passes.
At the same time, recent German studies using instrumented bicycles suggest that on relatively narrow urban streets, painted advisory or on-road cycle lanes (“Schutz-streifen”) tend to be associated with slightly smaller average passing distances than mixed-traffic streets without marked cycling facilities, whereas wider, physically separated tracks provide larger clearances [28,57]. Overtaking behaviour in cycling environments is influenced by several factors, including lane width, traffic conditions and characteristics of road users [58]. One explanation is that cyclists position themselves further from the kerb inside the marked lane, so drivers do not need to deviate as much, and that overall speeds are lower, which partly compensates for the reduced nominal gap. Importantly, several of these studies report that very close passes (e.g., below 1.0 m) are rare on streets with wide lanes, wide painted buffers, or protected cycle lanes, even though mean passing distances differ only moderately between layouts [36,57]. In Reh and Lißner’s [57] Dresden field study, for instance, passes closer than 0.5 m occurred only seven times out of more than 4,000 recorded overtakes.
In real-world trials, compliance with legal clearance requirements is often imperfect. In a recent German field study in Freiburg, cars met the 1.5 m legal minimum in towns in only about 30% of overtaking events, and the smallest passing gaps occurred on road types that cyclists subjectively rated as relatively safe, such as traffic-calmed streets or streets with marked cycle lanes [28]. A larger OpenBikeSensor study in Stuttgart similarly found that 42% of overtakes were closer than 1.5 m and that drivers passed cyclists more closely on cycle lanes than in mixed traffic [59]. A plausible interpretation is that on narrow or strongly channelised roads, drivers feel constrained by lane markings or obtain a false sense of safety and attempt to overtake without moving sufficiently into the opposing lane.
The systematic review of lateral passing distance studies concludes that conventional painted on-road cycle lanes, especially when narrow, do not reliably increase passing distances and should not be installed on narrow roadways [41]. Recommended solutions, drawing on crash-based and passing-distance studies, include providing sufficiently wide lanes (wide enough to accommodate a motor vehicle and at least 1.0–1.5 m to a cyclist), converting to designs that require lane-changing to overtake (e.g., protected cycle lanes next to general traffic lanes), or using physical separation (curbs, bollards) so that overtaking a cyclist necessarily involves a lateral lane change rather than squeezing past [36,41,57,60,61].
2.4. Cycling Infrastructure and Safety Outcomes
The type of cycling infrastructure has a strong impact on crash rates. Studies com-paring different route types consistently find that physically separated cycle tracks (ver-tically or horizontally separated from the carriageway) are associated with the lowest injury risk, because they largely eliminate same-direction conflicts with motor vehicles except at junctions. Van Petegem et al. [60], using ambulance data for Amsterdam, reported that 50 km/h distributor roads with physically separated cycle tracks had roughly 1.6–1.9 times lower bicycle crash risk than similar roads with painted cycle lanes, and considerably lower risk than mixed-traffic conditions, after controlling for cyclist expo-sure and traffic volumes.
Teschke et al. [62], analysing 690 cycling injuries in Toronto and Vancouver using a case-crossover design, found substantially lower injury odds on cycle tracks and bike-only paths than on major streets without dedicated cycling infrastructure. Painted cycle lanes on major streets showed lower odds than the reference category, but effects were not consistently statistically significant, particularly where parking was present.
In contrast, simple painted cycle lanes – especially narrow lanes immediately adjacent to motor traffic and parking – have not consistently demonstrated safety improvements in aggregate. A Cochrane review and subsequent evidence syntheses concluded that there is limited or mixed evidence that standard painted cycle lanes reduce collision rates, whereas physically separated cycle tracks are more likely to decrease risk [63,64]. Some before-and-after studies also found that converting mixed-traffic streets to layouts with painted lanes was associated with little change or even increases in police-reported collisions [65,66]. This counterintuitive finding likely reflects selection effects (painted lanes often being installed on already high-risk corridors) and design issues (e.g., narrow lanes next to parking doors or turning conflicts at junctions). It suggests that line-marked lanes alone do not guarantee safer conditions unless other factors such as speeds, volumes and junction design are also addressed.
In low-volume contexts, advisory/edge-lane road concepts are intended to support cyclist safety primarily through speed management and improved expectancy of cyclists. A New Zealand 2–1 trial combined with a 60 km/h limit indicated potential for daytime speed reduction, but the 2–1 road marking was discontinued due to safety concerns, underlining the role of driver understanding and appropriate yielding behaviour [67]. Simulation-based work highlights that interaction rates on edge-lane roads increase rapidly with motor-vehicle volumes, making traffic volume a critical determinant for feasibility; however, the study does not conclusively establish superiority over standard two-lane roads nor cyclist perceived safety benefits [68].
Another positive mechanism is “safety in numbers”: as cycling becomes more common, individual risk per cyclist tends to decrease. The classic analysis by Jacobsen [69], found that cities with higher walking and cycling volumes generally have lower per-capita collision rates with motor vehicles. More recently, modelling for London indicated that a doubling of morning-peak cycle flows on a link is associated with about a 13% reduction in individual injury odds, holding other factors constant [61]. In other words, better infrastructure attracts more cyclists, and higher cyclist numbers in turn can make cycling safer for everyone by increasing driver awareness and prompting further infrastructure upgrades.
Transport planning guidelines in cycling-focused countries reflect these insights. In the Netherlands and Denmark, distributor roads with speed limits of 50 km/h or above typically require dedicated cycle lanes or, more often, physically separated tracks; on 30 km/h access streets, cyclists may legally mix with motor traffic if volumes are low, but cycle lanes or tracks are still recommended where motor volumes exceed approximately 3,000–4,000 vehicles per day or where substantial on-street parking generates conflicts [70,71]. These policies align with the Vision Zero and “Sustainable Safety” approaches, which seek to design the road system so that serious crashes become highly unlikely even when human errors occur.
2.5. Impact on Mode Choice and Collisions
Beyond safety statistics, new cycling infrastructure often leads to measurable changes in travel behaviour. International case studies summarised by Pucher and Buehler [72] and OECD/ITF [71] indicate that constructing high-quality separated cycle tracks and dense cycling networks can lead to substantial increases in bicycle traffic on treated corridors, often accompanied by reductions in car traffic and shifts from car to bike. These effects appear strongest when measures are implemented as coherent networks rather than isolated links.
These studies also suggest that painted cycle lanes and mixed-traffic calming treatments tend to produce smaller ridership increases than fully separated cycle tracks, but can still have positive effects on cycling volumes, particularly when they close critical gaps or form part of broader traffic-calming schemes [60,71,72]. “Bicycle streets” (fi-etsstraten) in the Netherlands, where cars are formally “guests” and speeds are limited to 30 km/h, have been associated with increases in cycling volumes and decreases in through motor traffic on those streets, even when crash rates do not change dramatically [73].
However, new infrastructure can also create unintended hazards if not carefully designed, especially at intersections and driveways. Several evaluations have reported that converting junctions to designs with painted cycle lanes but without full separation can increase cycle collisions, whereas designs with physically separated cycle track crossings or clear priority arrangements tend to reduce risk [60,63,64]. This highlights that simply adding a cycle lane on a straight road does not automatically solve safety issues at junctions; attention to intersection geometry, visibility, signal timing and parking layout is essential. Evidence from recent reviews and health impact assessments indicates that, when cycling replaces car trips, the health and environmental benefits substantially outweigh the associated safety and exposure risks, particularly in contexts with high-quality cycling infrastructure [71,74].
2.6. Driver and Cyclist Behaviour and Perception
Recent experimental work combining test-track and field-test data suggests that drivers are mainly concerned about head-on or side-swipe collisions with oncoming traffic when overtaking cyclists, whereas cyclists feel most threatened by insufficient lateral clearance and high passing speeds [33,43]. This difference in perception helps explain typical behaviours: on narrow roads, drivers may slow down because they fear collisions with oncoming traffic, while cyclists initially feel vulnerable to close passes, gaining confidence only when markings or dedicated space make their position clearer.
The psychological impact of road markings, colours and layout is well documented. Experiments on “self-explaining roads” show that drivers adjust their speed and lateral position based on visual cues such as lane width, edge lines and surface colour, even when the formal cross-section stays the same [52,75]. For cyclists, design elements such as coloured cycle crossings, buffer space next to parked cars and clear bicycle symbols are used to improve visibility and subjective comfort, which can in turn affect route and mode choice [60,71].
Previous research highlights that the design and type of cycling infrastructure strongly influence cyclists’ perceived safety and risk. Studies using simulation approaches show that road environments without dedicated cycling facilities are often perceived as more dangerous, while separated or clearly designated cycling spaces can significantly improve cyclists’ feeling of safety and comfort [76].
While nothing replaces the protection of physically separated cycle tracks, the literature suggests that well-designed visual cues and markings can significantly improve both objective safety and subjective comfort where full physical separation is not feasible in the short term. In particular, treatments that simultaneously lower speeds, clarify priority relations and provide identifiable space for cyclists – such as advisory lanes on low-volume roads, 30 km/h zones, and bicycle streets – appear especially promising when embedded in a coherent cycling network strategy.
2.7. 2–1 Roads and Edge-Lane Roads in International Practice
A specific form of mixed-traffic design closely related to advisory cycle lanes is the so-called “2–1 road” or edge-lane road, where a narrow central lane for two-way motor traffic is flanked by advisory lanes used primarily by cyclists. Across Europe, this concept has appeared under various labels (e.g., Dutch edge strips, Danish “2–1-veje”, Swedish bygdeväg, French chaussée à voie centrale banalisée and Belgian adaptations), but with broadly similar geometric parameters: a central lane of roughly 3.0–3.5 m and two edge lanes of around 1.0–1.75 m, applied on roads with moderate speeds (typically 50–70 km/h) and limited traffic and heavy-vehicle volumes. National handbooks generally restrict their use to lower-order distributor or access roads where full physical separation is not feasible; Table 1 in this paper summarises the cross-section and volume thresholds in different countries.
Empirical evaluations show a nuanced safety picture. In the Netherlands, edge-strip layouts were rolled out as part of a broader 60 km/h “sustainable safety” programme on rural access roads; before-and-after studies reported sizeable reductions in injury crashes compared with the previous 80 km/h situation, but the effect cannot be attributed to edge strips alone because speed limits, intersection treatments and access control changed simultaneously [92].
Danish before-and-after studies of more than fifty 2–1 road schemes similarly found that re-marking alone produces only small or inconsistent changes in mean speed and crash frequency; safety outcomes were generally neutral to mildly positive, with better performance where 2–1 roads were combined with lower speed limits (≤ 60 km/h) and additional calming measures such as humps or gateways [93,94]. A Norwegian synthesis of Dutch, Danish and Swedish experiences reached comparable conclusions, emphasising that 2–1 roads should be viewed as a space-reallocation tool rather than a stand-alone safety countermeasure, and that they work best on roads with low to moderate volumes, credible speed limits and clear visual cues that drivers must yield to cyclists when necessary [95].
Swedish bygdeväg and bymiljöväg pilots – typically 60–70 km/h local roads with one wide central lane and coloured edge lanes – recorded modest average speed reductions (on the order of 1–3 km/h) and improved channelisation of motor traffic, but no clear crash effect given the low baseline numbers; user surveys showed that residents generally appreciated the calmer appearance, whereas some cyclists still reported discomfort with close overtakes at higher speeds [96,97]. In France, experimental chaussées à voie centrale banalisée and their Walloon counterparts in Belgium are authorised on relatively narrow two-lane roads (often 70 km/h) where conventional cycle lanes do not fit; guidance stresses the need for careful siting (limited heavy traffic, few sharp bends), high-quality signing and systematic communication campaigns to avoid confusion among drivers and cyclists [90,98]. Complementing these European experiences, a recent North American and Australian study of “edge lane roads” combined microscopic simulation with Empirical Bayes evaluations of eleven schemes in the United States and several rural convesions in Queensland, finding substantial crash reductions on low-speed urban corridors (project-level crash modification factor around 0.56) but a more equivocal picture on higher-speed rural roads, where short observation periods and possible selection bias precluded firm conclusions [68].
Overall, the international literature indicates that 2–1 roads can support cycling and redistribute scarce carriageway space where separate paths are not feasible, but that their safety performance depends critically on keeping speeds and volumes low, ensuring creible self-explaining design, and monitoring overtaking behaviour so that legal minimum passing distances are routinely achieved.
3. Methodology
The present study focuses on the city of Maribor, Slovenia, where several streets have recently been retrofitted with cycle lanes. On these corridors, a so-called 2–1 cross-section (also referred to as an edge lane road or advisory cycle lane layout) was implemented: the available carriageway width is insufficient to provide two full-width motor-vehicle lanes and separated cycle tracks, so the cross-section was reallocated to a single narrow bidirectional motor-vehicle lane in the centre, flanked by marked cycle lanes along both edges of the carriageway (Figure 1).
The road remains formally open to two-way motor traffic; when two motor vehicles meet, drivers are expected to temporarily encroach into the edge cycle lanes, but only if these are not occupied by cyclists. The study includes six diverse urban road segments with varying speed limits, traffic volumes, and roadway configurations. Some segments are residential or collector streets with a 30 km/h limit, while others are busier urban arterials within 50 km/h zones; traffic volumes range from relatively low neighbourhood traffic to heavily trafficked urban corridors. Cycle lanes were introduced on these roads at different times since 2020. For each location, we defined a “before” period that matched the length of time since the cycle lanes were installed. For example, if a lane was added in October 2024, we compared road accidents in the year since installation (to October 2025) against the corresponding year prior to installation (October 2023–October 2024). If the lane was introduced in 2022, the “after” period ran from 2022 to October 2025, and the “before” period spanned the three years prior. This paired-period design enabled consistent, site-specific comparisons aligned with the infrastructure’s operational timeframe.
We collected elevated camera video data at selected streets during the study to directly observe traffic behaviour. Using specialized video analysis software (such as the aforementioned AI system), we extract measurements, including vehicle speeds, traffic densities, lateral positioning within the lane, and interactions between road users (e.g., overtaking events and cyclist positioning). We also conducted manual traffic counts and speed measurements. In addition, a bicycle equipped with OpenBikeSensor device was ridden repeatedly along these corridors during the data-collection period, logging hundreds of overtaking-distance data points. By combining these data sources, we obtained a detailed picture of how the introduction of cycle lanes influenced both operational behaviour (i.e., how motorists and cyclists moved and interacted) and vehicle positioning, particularly lateral trajectories.
3.1. Study Site and Road Selection
The analysis included six urban road segments where advisory cycle lanes were implemented as a retrofit measure within a 2–1 road configuration. The segments were purposefully selected to represent a range of traffic and spatial conditions, including variations in traffic volumes, posted speed limits, carriageway widths, and surrounding land use. This variation enabled an assessment of the performance of the implemented design under a range of urban conditions. All selected segments consist of a single central lane accommodating two-way motor traffic, flanked by delineated advisory cycle lanes on both sides.
The analysed segments correspond to the following streets: Segment 1 – Limbuška cesta; Segment 2 – Tomšičeva ulica; Segment 3 – Ulica Matije Murka; Segment 4 – Lackova cesta; Segment 5 – Cesta v Rašpoh; and Segment 6 – Vrbanska cesta.
The key characteristics of the selected segments are summarised in Table 2, including geometric features, traffic parameters, applicable speed limits, and representative photographs of each segment. The table provides an overview of site-specific conditions relevant to the evaluation of the implemented 2–1 road design. A map showing the locations of the analysed segments is presented in Figure 2.
This consistent cross-sectional configuration allowed for comparison across sites while accounting for contextual differences. In addition to the six selected road segments (1–6), several other road segments with advisory cycle lanes exist in Maribor. These segments, hereafter referred to as Segments 7–8, were not included in the main analytical sample due to data limitations and their limited suitability for comparative analysis. However, these additional segments were considered in the road safety analysis as reference cases. These additional road segments are hereafter referred to as Segment 7 (Cesta Graške Gore) and Segment 8 (Betnavska cesta).
All road dimensions (lane and shoulder widths) were measured on-site using a laser rangefinder to ensure accuracy. Four of the six treated streets have a 30 km/h speed limit, while two include sections at 50 km/h. For comparative purposes, we also identified several control segments in Maribor that remained untreated (no cycle lane) but have similar geometry and speed limits. These non-intervention sites were used to collect reference data on drivers’ overtaking behaviour under comparable conditions (same city and roadway characteristics) but without the presence of advisory cycle lanes.
The methodological framework is presented in Figure 3. The study consisted of six sequential phases: segment selection, dimensional measurements, overtaking distance measurements, traffic monitoring, crash data collection, and statistical analysis.
3.2. Overtaking Distance Measurement
To record the lateral passing clearance between overtaking vehicles and the bicycle, we employed an instrumented bicycle methodology (similar to that used by Chuang et al. [38], Beck et al. [34], Nolan et al. [36]). A custom open-source device – the OpenBikeSensor – was mounted on a standard bicycle to serve as a data acquisition system. The OpenBikeSensor (OBS) incorporates ultrasonic distance sensors that continuously measure the gap to the nearest object on the bicycle’s left side (i.e., the passing traffic side) at a high sampling rate, while an integrated GPS receiver records location data and timestamps [99]. This setup allowed the precise capture of each overtaking recording, defined as an instance in which a motor vehicle approached from behind and passed the bicycle while travelling in the same direction. The OBS hardware was attached to the bicycle’s rear rack at approximately 0.8 m above ground, with the sensor oriented perpendicular to the bicycle’s travel direction to measure the lateral distance to passing vehicles. Before data collection, the device’s calibration was verified in a controlled setting (using a measuring tape and a test vehicle) to ensure distance readings were accurate to within a few centimetres, consistent with validation tests reported in prior studies of similar ultrasonic sensors [36].
All overtaking data were collected by the same experienced cyclist (researcher and co-author) to maintain consistency in riding behaviour. The cyclist rode near the right-hand edge of the carriageway, maintaining a position as far to the right as practicable within the advisory cycle lane (or the road edge on non-cycle lane streets) and maintained a steady, predictable path and speed. This approach was intended to replicate a typical conservative cycling position and to minimise any influence of rider positioning variability on passing clearance [38]. Each of the six treated street segments (and the comparable control segments) was traversed multiple times under normal traffic conditions. Data collection rides were conducted over two weeks (November 6–18, 2025) during daylight hours, covering different days of the week and varying times of day in order to capture a broad range of traffic conditions. In total, 970 overtaking manoeuvres were recorded across all segments. For each passing event, the OBS automatically logged the minimum lateral distance between the overtaking vehicle and bicycle (in centimetres) along with the GPS location and time. These data were later exported for analysis. During post-processing, any spurious recordings (e.g., sensor triggers not corresponding to actual overtakes, such as a cyclist passing a parked car) were filtered out based on the GPS and distance profiles, and only valid vehicle overtake events were retained.
3.3. Traffic Volume and Speed Monitoring
To contextualise the cycling data with traffic conditions, we collected motor traffic volume and speed data on the study streets. Portable AI-enabled video counters (Swiroo units by Swisstraffic AG) were installed at each site for a 24-hour period. These temporary traffic cameras automatically counted vehicles and estimated their speeds using computer vision and radar calibration, providing 24-hour traffic volumes subsequently converted into passenger-car units using standard equivalence factors, as well as vehicle speed distributions. The 24-hour counts confirmed the average daily traffic levels for each segment (e.g., on the order of a few thousand vehicles per day, as noted above). In addition to the automated counters, on three segments (Segment 2, Segment 4, and Segment 6), we performed manual spot speed measurements using a handheld radar gun. This was done to validate the camera-based speed data and to gather more detailed speed samples during typical daytime periods. The speeds of approximately 120 free-flowing vehicles per site were measured at mid-block locations using the radar. Across all sites, the posted speed limits (30 or 50 km/h) were generally observed by most drivers; the supplementary radar data indicated 85th percentile speeds close to the speed limit on the low-speed (30 km/h) streets, whereas on the 50 km/h sections 85th percentiles were slightly above 50 km/h (were between 55 and 60 km/h). The combination of these volume and speed measurements was used to characterise the traffic environment in the analysis (for instance, to consider whether traffic speed/volume might influence overtaking clearance).
3.4. Crash Data Collection and Analysis
To evaluate potential safety impacts of the advisory cycle lanes, a before-and-after crash analysis was performed for each treated street. Police-reported crash data were obtained from the national crash database maintained by the Slovenian Traffic Safety Agency (Agencija za varnost prometa, AVP). We queried the AVP’s online crash mapping portal [100] to extract all recorded traffic accidents occurring on the specific road seg-ments of interest. For each site, we defined a “before” period covering several years prior to the installation of the advisory lanes and an equivalent-length “after” period following the implementation. The cut-off dates were chosen based on when the new lane markings were introduced, as provided by municipal records. For example, Segment 1 was converted to an advisory cycle lane in mid-2020; accordingly, we compiled crash data from 1 March 2015 to 30 June 2020 as the before period and from 1 July 2020 to 31 October 2025 as the after period (matching approximately 5 years and 4 months in each period). Likewise, Segment 4 (lane introduced in late 2021) was analysed from 1 January 2018 to 30 November 2021 (before) and from 1 December 2021 to 31 October 2025 (after); Segment 6 (lane introduced in mid-2022) was analysed from 1 March 2019 to 30 June 2022, and from 1 July 2022 to 31 October 2025 for the after period, and so on for the remaining sites. On Segment 3, advisory cycle lanes were introduced in early April 2023. The crash analysis compared the period before implementation, covering crashes between 1 September 2020 and 1 April 2023, with the post-implementation period, which included data from 1 April 2023 to 31 October 2025.
From the crash reports, we extracted details including the number of crashes, crash severity (e.g., property-damage-only, injury, fatal), crash type (collision with cyclist, collision with motor vehicle, single-vehicle, etc.), and the reported cause of each crash. We noted any crashes involving cyclists on those roads. The before-and-after crash counts were then compared to assess whether overall crash frequency changed following the advisory lane intervention and whether there were any notable shifts in cyclist-involved crashes or in severity outcomes. Given the relatively small numbers of crashes per site (as is typical on low-volume city streets), we primarily relied on descriptive statistics and simple before-and-after comparisons rather than formal modelling. No regression-to-the-mean adjustment or empirical Bayes method was applied; the analysis therefore, represents a simple before-and-after comparison [68]. Results of this safety analysis are reported in terms of percentage change in crashes and qualitative discussion of changes in crash patterns before-and-after implementation.
Within the traffic accident analysis, a matched comparison design was applied for two selected segments. Segment 1 (Limbuška cesta) was paired with Control Segment 1 (Erjavčeva ulica), while Segment 4 (Lackova cesta) was paired with Control Segment 4 (Pohorska ulica). The control streets were selected based on comparable geometric characteristics, traffic function, and their position within the road network. For the remaining segments, no directly comparable control streets were identified; therefore, the analysis relies on within-segment before-and-after comparisons.
3.5. Data Analysis and Statistical Methods
All collected data were compiled and analysed using Microsoft Excel. Summary statistics were calculated for the lateral passing distance data on each road.
We first computed a set of descriptive statistics for the passing distance distribution:
- Mean and median passing distances;
- Minimum and maximum;
- First and third quartiles;
- 5th percentile (to capture the lower tail of the distribution);
- Standard deviation.
We also computed the incidence of “close passes,” defined here as overtaking events leaving less than 1.5 m of clearance, consistent with common safe passing distance guidelines and laws [36]. For hypothesis testing, we first checked the reliability and consistency of the overtaking distance measurements gathered on different days.
These indicators were used to characterise typical and critical passing behaviour on each road and to support comparison between streets with and without advisory cycle lanes, in line with previous work on cyclist passing distances [34,36].
For the inferential comparison, all overtaking events were pooled into two datasets:
- Dataset 1 – streets with advisory cycle lanes (all treated segments);
- Dataset 2 – streets without any dedicated cycling infrastructure (control segments with comparable geometry and speed limits).
To decide which form of t-test to use, we first tested the equality of variances between these two datasets using a two-sample F-test for variance (α = 0.05). The F-test indicated no statistically significant difference between the variance in passing distances between the two groups (F ≈ 0.98, p ≈ 0.41), and we therefore proceeded under the assumption of equal variances.
Subsequently, we applied a two-sample t-test assuming equal variances to compare the mean passing distance between streets with advisory cycle lanes and streets without cycling infrastructure. The null hypothesis stated that the mean lateral passing distance was equal between the two groups; the alternative hypothesis allowed for a difference in either direction (two-tailed test). The t-test returned a highly significant result (t ≈ 8.38, p < 0.001), indicating that the mean passing distance differs between the two groups. The detailed numerical results are presented in the Results section.
4. Results
4.1. Traffic Conditions and Sample Description
Across the six retrofitted 2–1 roads in Maribor, posted speed limits range from 30 km/h on four residential or collector streets (Segment 1, Segment 2, Segment 4, Segment 6) to 50 km/h on two more peripheral segments (Segment 3 and Segment 5). Central lane widths vary between 3.3 and 3.5 m, while cycle lane widths range from 1.20 to 1.75 m, with the widest lanes provided on Segment 3 (1.75 m). Average daily traffic volumes span approximately 2 350–6 000 PCU/24 h, with the highest flows on Segment 1 and Segment 3.
Speed measurements indicate that operating speeds on all segments exceed the posted 30 km/h limit and remain close to, but generally below, the 50 km/h limit on the two faster roads. On the 30 km/h streets with advisory cycle lanes, the mean speed is about 39.6 km/h and the 85th percentile speed (V85) is 47.8 km/h; on the 50 km/h streets with advisory lanes, the corresponding values are 41.5 km/h and 50 km/h. Thus, the 30 km/h segments are characterised by notable speeding, while the 50 km/h segments operate slightly below the limit on average.
The complete results of the analysis are summarised in Table 3. In total, 970 overtaking manoeuvres were recorded. Of these, roughly 70% occurred on streets with cycle lanes (Dataset 1 in the statistical tests) and 30% on streets without cycle lanes (Dataset 2). On the 2–1 streets with advisory cycle lanes, the number of observed overtaking manoeuvres per segment ranged from 45 (Segment 4) to 184 (Segment 3). The control streets without cycle lanes together accounted for 172 overtaking manoeuvres, including one control segment associated with Segment 1.
4.2. Lateral Passing Distances by Street
Mean lateral passing distances on the advisory-lane streets cluster in a relatively narrow band between about 150 and 161 cm (Figure 4). Segment 1, Segment 2, Segment 4 and Segment 6 (all 30 km/h streets) show mean distances of 149.9, 155.7, 154.0 and 154.4 cm, respectively. On the two 50 km/h streets, Segment 3 and Segment 5, mean distances reach 160.4 cm and 161.4 cm, with medians of 160 cm and 157.5 cm. Standard deviations are in the order of 31–41 cm, indicating substantial variability within each street.
Despite similar mean distances, the share of “close” passes remains substantial on all advisory-lane streets. The proportion of manoeuvres with a distance below 1.5 m ranges from about 38.9% on Segment 5 to 50.3% on Segment 1. For the 1.25 m threshold, the proportion ranges varies between roughly 14.7% and 23.5%. Distances below 1.0 m account for between 2.1% (Segment 6) and 11.1% (Segment 4). These values are consistent with those reported in other passing-distance studies on urban roads, where mean distances around 1.5–1.7 m and non-negligible shares of sub-1.0 m passes have been observed [34,36,59].
The control streets without cycle lanes show systematically shorter distances. Their combined mean lateral passing distance is 133.0 cm (median 131.5 cm), with a standard deviation of 34.4 cm. Almost three-quarters (72.1%) of overtakes occur within 1.5 m, 42.4% within 1.25 m, and 14.5% within 1.0 m. On the control segment of Segment 1 without bicycle lanes, the mean distance is 139.5 cm (median 137 cm), and 61.2% of passes are closer than 1.5 m.
When focusing on the lower tail of the distribution, the 5th percentile distance on streets with advisory lanes ranges between approximately 102 cm (zone 30 group) and 106 cm (zone 50 group), whereas the 5th percentile on streets without cycle lanes is only 83.6 cm. This means that the worst 5% of overtakes on streets with cycle lanes are still around 20–23 cm further away from the cyclist than on streets without cycle lanes.
This pattern is clearly visible in the histograms. Figure 4 shows the distribution for advisory-lane streets, where a higher share of events occurs above 150 cm. In contrast, Figure 5 illustrates the distribution for streets without cycle lanes, which is clearly shifted to the left, with a concentration of passes in the 75–125 cm range.
4.3. 2–1 Streets Vs. Control Streets
The comparison between all overtakes on streets with advisory lanes (Dataset 1) and all overtakes on control streets without cycle lanes (Dataset 2) confirms these descriptive patterns. The mean passing distance is 156.4 cm for Dataset 1 and 135.5 cm for Dataset 2 – a difference of approximately 20.9 cm. The standard deviations are similar (34.8 cm for Dataset 1 and 35.2 cm for Dataset 2), indicating comparable variability in both groups. This is supported by the F-test: the F statistic is 0.98 with a p-value of 0.41, so equality of variances cannot be rejected at the 5% significance level.
Given the comparable variability, the two-sample t-test with equal variances is appropriate. This test yields a t-statistic of 8.38 and a two-tailed p-value below 2 × 10⁻¹⁶, far below the conventional 0.05 threshold. The null hypothesis of equal means is therefore rejected at the 5% significance level, indicating that overtakes on streets with advisory cycle lanes provide significantly more lateral space than overtakes on streets without cycle lanes. The magnitude of this difference (around 21 cm) is substantial when compared with the minimum passing distances discussed in the literature and in legal regulations - typically 1.0-1.5 m depending on speed limit [33,36].
The improved distances on advisory lane streets are also visible in the distribution of close passes. While roughly 40–50% of passes on advisory-lane segments still occur within 1.5 m, the share of sub-1.25 m and sub-1.0 m passes are markedly lower than on control streets. This is consistent with findings from other large-scale passing distance studies, where the presence of painted cycle lanes is associated with fewer very close passes, even after controlling available carriageway width [36].
4.4. Effect of Speed Limit (30 Km/h Vs. 50 Km/h) on Advisory-Lane Segments
When the advisory-lane streets are grouped by posted speed limit, an interesting pattern emerges. On the 30 km/h streets with advisory lanes (Segment 1, Segment 2, Segment 4 and Segment 6), the mean passing distance is 153.2 cm (median 152 cm), with 46.9% of passes below 1.5 m, 20.1% below 1.25 m, and 4.7% below 1.0 m. On the 50 km/h advisory-lane streets (Segment 3 and Segment 5), the mean passing distance is higher at 161.0 cm (median 158 cm), and the share of close passes is somewhat lower: 39.8% below 1.5 m, 15.2% below 1.25 m, and 3.6% below 1.0 m.
In the present case, the 50 km/h streets also have relatively wide cycle lanes (1.35 m and 1.75 m) and more generous cross-section geometry compared to some of the 30 km/h segments. It is therefore plausible that the additional lateral space available to drivers fully compensates for the higher speeds, allowing drivers to move further away from the cyclist during the pass. The similarity of standard deviations between the 30 km/h and 50 km/h advisory-lane groups (33.4 cm vs. 36.3 cm) suggests that variability in driver behaviour is comparable; what changes is primarily the central tendency of the distances.
Within the 50 km/h group, Segment 3—with the widest cycle lanes in the sample (1.75 m)—shows one of the highest mean distances (161.4 cm) and relatively low shares of very close passes (about 15.8% below 1.25 m and 3.8% below 1.0 m). Segment 5, where the lanes are narrower (1.35 m) and traffic volumes lower, yields a very similar mean distance (160.4 cm), but a marginally higher share of sub-1.0 m passes (4.2%). Given the small number of passes per segment, these differences should be interpreted cautiously; nonetheless, they are consistent with the broader evidence that greater effective operating width tends to facilitate safer overtaking manoeuvres [40,41,59].
4.5. Analysis of Traffic Accidents on the Selected Road Segments
Based on the methodological framework described above, the following section presents the results of the traffic crash analysis conducted on the selected road segments with advisory cycle lanes. The analysis examines absolute and relative changes in the number of crashes, their severity, the involvement of cyclists, and shifts in causal and typological patterns. Table 4 presents a comparative overview of traffic safety on selected roads before and after the implementation of measures. For each section, it shows the observation period, the total number of accidents, accidents involving cyclists, injuries, the most common causes, and typical types of accidents.
The trends presented in Table 4 clearly indicate where the measures led to improvements and where deterioration occurred. However, it is essential to note methodological limitations related to the small absolute numbers of traffic accidents on the individual road sections. Due to the low frequency of events, it is not possible to reliably determine the statistical significance of the observed differences, as even a single additional case—or its absence—can substantially alter the relative values and create the impression of a notable change that carries limited analytical weight.
Therefore, the results should be understood primarily as indicative trends rather than definitive evidence of the effectiveness of individual measures. Analysis of seven road sections over a 31- to 64-month period shows clear differences in the effectiveness of implemented traffic measures, while also indicating an overall positive trend.
The total number of traffic accidents decreased by 22% after the measures were introduced, and the number of accidents involving cyclists fell by 38%, confirming that the measures were effective at most locations in reducing risk for road users.
The most notable improvements were recorded on Segment 1, where the number of accidents decreased from 23 to 16 (–30%), and accidents involving cyclists from 5 to 0 (-100%), accompanied by a visible decline in injuries: minor injuries from 9 to 3 and serious injuries from 2 to 2. On Segment 1, the introduction of advisory cycle lanes not only reduced the total number of accidents but also changed their structure. The number of accidents caused by inappropriate speed decreased, as the narrower driving lanes and the introduction of a 30 km/h zone calmed traffic. At the same time, the share of accidents related to vehicle manoeuvring increased, primarily because these manoeuvres were often associated with parking activities. Such manoeuvres typically involve multiple changes of direction as well as stopping and starting, which increases the likelihood of conflict situations and thus contributes to a higher number of such accidents.
The results of the paired comparison for the selected 2–1 road segments are presented in Table 5. The table summarises the before-and-after changes in total and cyclist-involved accidents on 2–1 roads and their matched control streets.
Segment 1 was compared with Control segment 1, which does not include advisory cycle lanes. This street was selected because it runs parallel to the analysed section and represents an important traffic corridor with higher permitted speeds. Due to its comparable function and position within the road network, it provides an appropriate basis for assessing the broader effects of infrastructural changes in the area.
A significant decrease in accidents was also observed on Control segment 1, from 29 to 12 (-59%), while cyclist-involved accidents declined from 2 to 1. Since no physical interventions were implemented on this control segment, the reduction cannot be attributed to direct measures on the street itself. Instead, it is likely the result of wider infrastructural changes in the surrounding area, primarily on Segment 1, as both roads form an important traffic connection.
An additional factor influencing traffic volumes was the opening in 2023 of the new parallel road—the extension of Cesta proletarskih brigad towards Limbuš—designed as an urban arterial route from the direction of Ruše. This new connection diverted part of the traffic away from the residential area of Studenci, thereby reducing traffic volumes on both Segment 1 and Control Segment 1. Prior to its construction, these streets served as the main access routes, although Segment 1, due to spatial constraints, does not meet the standards required for such a heavily used corridor and does not allow for substantial infrastructural upgrades [101].
The introduction of a 30 km/h zone, lane narrowing, and advisory cycle lanes on Segment 1 reduced vehicle speeds and partly redistributed traffic, which indirectly improved safety on Control Segment 1. Therefore, part of the reduction in accidents on Segment 1 can likely be attributed to broader infrastructural improvements in the area.
Cyclist safety on Segment 1 also improved after the introduction of advisory cycle lanes. Previously, cyclists frequently shared space with pedestrians and were required to yield at every intersection, leading to increased conflict points. With clearly marked cycle lanes, cyclists’ trajectories became more defined and predictable, reducing potential conflicts with motor vehicles and consequently lowering the number of cyclist-related accidents.
Segment 4 demonstrates a particularly strong positive effect of the implemented measure. The total number of accidents decreased from 11 to 3 (-73%), representing the largest relative reduction within the sample. Although cyclist-involved accidents remained unchanged (1 before and 1 after), the number of injuries decreased, indicating less severe consequences and calmer traffic conditions.
A comparison with Control segment 4, a nearby street without cycle lanes, reveals an important distinction. Although the total number of accidents there also declined (from 54 to 27), the structure of accidents remained largely unchanged. Most incidents occurred in parking areas and were related to manoeuvring around parked or stationary vehicles. These risks are therefore not directly associated with the absence of cycle lanes. In contrast, Segment 4 reflects a more specific and direct effect of the infrastructural intervention.
Segments 5 and 7 represent exceptions to the generally positive trend. On Segment 5, the total number of accidents remained unchanged (10 before and 10 after), while cyclist-involved accidents increased slightly from 2 to 3 (+50%), and minor injuries from 3 to 4. Given the very small absolute numbers, these changes cannot be interpreted as statistically reliable indicators of a real deterioration in safety and may be attributable to random variation. In both periods, the predominant cause of accidents was inappropriate speed. Segment 5 exhibits characteristics typical of rural road sections, with multiple curves and occasional longer straight segments that may encourage drivers to overestimate safe speeds.
On Segment 7, accidents increased from 2 to 3 (+50%), although most incidents resulted in no injuries. Due to the very low number of cases, firm conclusions cannot be drawn.
Overall, considering total accident numbers, cyclist involvement, and injury severity, the implementation of 2–1 roads contributed to improved traffic safety on most analysed segments. The most pronounced effects were observed on Segment 1 and Segment 4, where accident numbers declined substantially and cyclist-related accidents were either eliminated or remained minimal. Injury rates also decreased on these sections.
Segments with low traffic volumes, such as Segment 3 and Segment 6, show moderate improvements that are statistically more difficult to assess, yet the overall trend remains positive. On Segment 2, no traffic accidents were recorded either before or after the introduction of advisory cycle lanes. However, as the intervention was implemented relatively recently, the post-implementation period is too short to allow for a reliable long-term assessment.
While the previous table presented results for individual segments, Table 6 provides an aggregated overview by causes and types of traffic accidents. This combined analysis further confirms the trends identified at the level of individual segments.
After the measures were introduced, most of the most frequent and most dangerous causes of traffic accidents decreased significantly: inappropriate speed (-36%), failure to yield (-57%), failure to maintain a safe distance (-63%), improper overtaking, pedestrian violations, and road deficiencies (all –100%). Two negative trends stand out: an increase in driving on the wrong side of the road (+14%) and vehicle manoeuvring incidents (+100%).
Regarding the distribution of accident types, the data show a clear restructuring of their pattern: the number of “other” accidents fell to 0, side collisions decreased (-29%), vehicle rollovers were greatly reduced (-75%), head-on collisions even more so (-83%), and rear-end collisions halved. The negative trend is the rise in scraping-type accidents from 1 to 8 (+700%). The measures effectively reduced the most severe and frequent types of accidents, but they also introduced new challenges, particularly related to manoeuvring and scraping, which require further traffic adjustments.
Due to the sharply increased number of scraping-type accidents, a more detailed analysis was carried out to determine whether this rise may be linked to the introduction of advisory cycle lanes. Because the crash map from the Slovenian Traffic Safety Agency does not include sufficiently detailed data, the police were requested to provide additional information on scraping incidents occurring on the selected streets. The data show that scraping accidents occur at several locations, with no consistent pattern indicating a systematic effect of the new traffic layout. One case stands out on Segment 5, where the cause was clearly identified as driving on the wrong side of the road. Such a mechanism may reflect the influence of the modified 2–1 road geometry, which can, in certain circumstances, contribute to incorrect vehicle positioning on the carriageway. For the remaining cases on Segment 1, Segment 4, Segment 7, and Segment 8, no evidence was found indicating the presence of similar causal mechanisms.
A common feature of all recorded events is that scraping accidents fall under the category of “vehicle movements”, which includes vehicle manoeuvring. Such manoeuvres typically occur at low speeds and are mostly associated with parking, indicating that these events arise primarily from interactions between motor vehicles. Because the analysed locations differ in both traffic volume and traffic design, the available data does not support the conclusion that the increase in scraping accidents is a direct consequence of introducing advisory cycle lanes.
5. Discussion
Overall, the results show that advisory cycle lanes on 2–1 roads in Maribor are associated with significantly larger lateral passing distances compared to similar streets without cycle lanes. The improvement is evident not only in the higher mean distance (approximately +21 cm), but also in the substantial reduction of very close (<1.0 m and <1.25 m) passes and in a rightward shift of the entire distribution. At the same time, a considerable share of overtakes still occurs within 1.5 m, indicating that the legal minimum distance is frequently not respected, consistent with findings reported by Beck et al. [34], Hauenstein et al. [33] and Casey et al. [59].
The comparison between 30 km/h and 50 km/h advisory-lane segments suggests that higher posted speeds do not automatically lead to shorter passing distances when cross-sections and cycle lane widths are sufficiently generous. Instead, the interaction between lane configuration, available width and operating speed appears to shape overtaking behaviour.
These findings complement previous instrumented-bicycle research. Henao et al. [102], Beck et al. [34], and Nolan et al. [36] similarly demonstrated that roadway geometry and cross-sectional design play a decisive role in determining drivers’ lateral positioning and overtaking trajectories. By focusing on retrofitted 2–1 roads, the present study adds evidence from a Central-European context and extends the discussion beyond conventional cycle-lane configurations, informing design considerations for advisory cycle lanes in extra-urban environments.
A recent large-scale sensor-based analysis by Fian et al. [103], based on more than 11,000 overtaking events recorded with the OpenBikeSensor system in Austria, showed that effective carriageway width, infrastructure type and functional road classification are significant predictors of lateral passing distance. In line with the present findings, their results suggest that spatial allocation and cross-sectional design play a stronger role in shaping overtaking behaviour than speed limits alone. Although their study did not specifically address 2–1 advisory layouts, it provides robust empirical support for the relevance of geometric design factors, which the present study now extends to retrofitted 2–1 configurations.
In the context of comparison with the existing literature, the findings are consistent with the results of Louro et al. [104], who, based on 2,032 overtaking manoeuvres measured using an instrumented bicycle, demonstrated that the presence of a painted bicycle lane significantly increases the lateral passing distance (by approximately 31 cm on average), while lane width further contributes to greater lateral clearance. At the same time, they found that higher speed limits increase overtaking speed, and commercial areas are associated with a combination of higher speeds and shorter lateral distances, representing increased risk for cyclists. These results confirm that roadway geometry and spatial traffic organization significantly influence vehicle–cyclist interactions, which is also relevant when interpreting findings on 2–1 roads.
Beyond the increase in mean passing distance, the results suggest a structural shift in overtaking behaviour. The advisory lane configuration appears to improve the lower end of the distribution, indicating that drivers operate within a similar variability range but begin from a safer lateral baseline rather than “anchoring” at minimal gaps. This supports the interpretation that clearer spatial allocation enhances road legibility and reduces uncertainty during overtaking.
The findings also highlight the importance of effective operating width. Wider advisory lanes and generous cross-sections seem to facilitate safer lateral positioning, whereas narrow markings may limit functional comfort. Importantly, the comparison of speed regimes suggests that geometry and spatial design may play a more decisive role than posted speed alone. Within the limits of the available crash data, no evidence of safety deterioration was observed following implementation.
Finally, a practical implication concerns speed-limit “credibility” and corridor selection. Several segments show a mismatch between posted limits and operating speeds (notably on 30 km/h streets), indicating that signage alone may be insufficient. At the same time, the results show that 2–1 layouts can function on streets signed at 50 km/h without observable crash deterioration and with slightly improved overtaking distances. This supports a context-sensitive recommendation: rather than artificially lowering posted speed limits purely to justify installation of advisory lanes, practitioners should prioritise streets where (i) motor-vehicle volumes are compatible with the 2–1 operating principle, (ii) the cross-section can provide adequate cyclist operating width, and (iii) the road environment supports credible speeds through geometry and self-explaining design.
Several limitations should be acknowledged. Passing-distance measurements were collected by a single rider during a limited campaign window, under daylight conditions, and within one urban area; generalisability to other cyclist profiles, night-time conditions, different seasons, and different cultural/traffic contexts remain uncertain. The study focused on minimum lateral distance, but perceived safety is also influenced by relative speed, heavy-vehicle share, and oncoming-traffic presence; adding overtaking speed, vehicle classification, and video-based trajectory coding would strengthen causal interpretation. The crash evaluation used a naive before-and-after approach without Empirical Bayes or exposure adjustment; future work should incorporate longer observation periods, cycling-volume proxies, and formal safety-performance evaluation methods where data availability permits.
6. Conclusions
The Maribor field study indicates that 2–1 streets with advisory cycle lanes deliver measurable improvements in cyclist-motorist interactions compared with similar streets without cycling infrastructure:
- Lateral clearance improves substantially. Mean passing distance increased by about 21 cm (156.4 cm vs. 135.5 cm), with strong statistical support based on 970 overtaking events.
- Very close passes become markedly less frequent. Overtakes below 1.0 m dropped to roughly ~4% on 2–1 streets versus ~14–15% on control streets, indicating a shift toward safer driver choices.
- Higher-speed segments (50 km/h) did not perform worse in this sample. Mean clearance was about 8–10 cm higher on 50 km/h advisory-lane streets than on 30 km/h advisory-lane streets, with a slightly lower share of close passes, likely reflecting more generous effective width on those corridors.
- Crash-based results are indicative but broadly reassuring. While statistical proof is not possible due to low crash counts, the before-and-after evidence suggests no increase in crash occurrence and no clear emergence of new “layout-specific” crash types; if anything, trends are neutral-to-positive.
- Design matters. The findings support using ≥ 1.5 m advisory lane width (and preferably more where feasible), as narrow lanes (≈ 1.25 m), especially with poor surface quality, may compromise both functional comfort and safety outcomes.
In summary, the results suggest that, when applied on appropriate streets with suitable widths and compatible traffic conditions, 2–1 layouts in Maribor are associated with improved overtaking behaviour and do not appear to increase crash risk. This supports their role as a cost-effective retrofit measure where fully separated cycling facilities are not feasible, while also underscoring the need for careful corridor selection and design detailing.
Author Contributions
Conceptualization, M.R., F.M. and I.P.; methodology, M.R., F.M. and I.P.; software, F.M.; validation, F.M. and I.P.; formal analysis, M.R., F.M. and I.P.; investigation, F.M., I.P. and M.R.; resources, M.R. and F.M.; data curation, I.P. and F.M.; writing—original draft preparation, M.R., F.M. and I.P.; writing—review and editing, I.P. and M.R.; visualization, I.P. and F.M.; supervision, M.R.; project administration, M.R. All authors have read and agreed to the published version of the manuscript.
Funding
This research was partially supported by the Slovenian Research Agency “ARIS” in the framework of the Research Program “Development, modelling and Optimization of Structures and Processes in Civil Engineering and Traffic P2-0129 (A)”.
Informed Consent Statement
Not applicable.
Data Availability Statement
The original contributions presented in the study are included in the article; further inquiries can be directed to the corresponding author.
Conflicts of Interest
The authors declare no conflicts of interest.
References
- Buehler, R.; Pucher, J. Cycling through the COVID-19 pandemic to a more sustainable transport future: Evidence from case studies of 14 large bicycle-friendly cities in Europe and North America. Sustainability 2022, 14, 7293. [Google Scholar] [CrossRef]
- Nikitas, A.; Tsigdinos, S.; Karolemeas, C.; Kourmpa, E.; Bakogiannis, E. Cycling in the era of COVID-19: Lessons learnt and best practice policy recommendations for a more bike-centric future. Sustainability 2021, 13, 4620. [Google Scholar] [CrossRef]
- Aldred, R. Cycling near misses: Their frequency, impact, and prevention. Transp. Res. Part A Policy Pract. 2016, 90, 69–83. [Google Scholar] [CrossRef]
- Parkin, J.; Wardman, M.; Page, M. Models of perceived cycling risk and route acceptability. Accid. Anal. Prev. 2007, 39, 364–371. [Google Scholar] [CrossRef] [PubMed]
- Winters, M.; Davidson, G.; Kao, D.; Teschke, K. Motivators and deterrents of bicycling: comparing influences on decisions to ride. Transportation 2010, 38, 153–168. [Google Scholar] [CrossRef]
- Aldred, R.; Woodcock, J. Reframing safety: An analysis of perceptions of cycle safety clothing. Transp. Policy 2015, 42, 103–112. [Google Scholar] [CrossRef]
- Bill, E.; Ferguson, N. Does experience affect perceived risk of cycling hazards? Scott. Transp. Appl. Res. 2015, 19. [Google Scholar]
- Johannsen, H. Unfallmechanik und Unfallrekonstruktion; Springer Fachmedien Wiesbaden: Wiesbaden, Germany, 2013. [Google Scholar] [CrossRef]
- Klebelsberg, D. Verkehrspsychologie; Springer: Berlin, Germany, 1982. [Google Scholar] [CrossRef]
- Fuller, R. Towards a general theory of driver behaviour. Accid. Anal. Prev. 2005, 37, 461–472. [Google Scholar] [CrossRef] [PubMed]
- Gehl, J. Cities for People; Island Press: Washington, DC, USA, 2010. [Google Scholar]
- Sinus Markt- und Sozialforschung GmbH. Fahrrad-Monitor Deutschland 2019; Bundesministerium für Verkehr und digitale Infrastruktur: Berlin, Germany, 2019; Available online: https://www.bmv.de/SharedDocs/DE/Anlage/StV/fahrradmonitor-2019-ergebnisse.pdf?__blob=publicationFile.
- Sinus Markt- und Sozialforschung GmbH. Fahrrad-Monitor Deutschland 2021; Bundesministerium für Digitales und Verkehr: Berlin, Germany, 2021. [Google Scholar]
- Fonseca, F.; Ribeiro, P.; Neiva, C. A planning practice method to assess the potential for cycling and to design a bicycle network in a starter cycling city in Portugal. Sustainability 2023, 15, 4534. [Google Scholar] [CrossRef]
- Lusk, A.C.; Furth, P.G.; Morency, P.; Miranda-Moreno, L.F.; Willett, W.C.; Dennerlein, J.T. Risk of injury for bicycling on cycle tracks versus in the street. Inj. Prev. 2011, 17, 131–135. [Google Scholar] [CrossRef] [PubMed]
- Thomas, B.; DeRobertis, M. The safety of urban cycle tracks: a review of the literature. Accid. Anal. Prev. 2013, 52, 219–227. [Google Scholar] [CrossRef] [PubMed]
- Vandenbulcke, G.; Thomas, I.; Int Panis, L. Predicting cycling accident risk in Brussels: a spatial case-control approach. Accid. Anal. Prev. 2014, 62, 341–357. [Google Scholar] [CrossRef] [PubMed]
- Park, J.; Abdel-Aty, M.; Lee, J.; Lee, C. Developing crash modification functions to assess safety effects of adding bike lanes for urban arterials with different roadway and socio-economic characteristics. Accid. Anal. Prev. 2015, 74, 179–191. [Google Scholar] [CrossRef] [PubMed]
- Pulugurtha, S.S.; Thakur, V. Evaluating the effectiveness of on-street bicycle lane and assessing risk to bicyclists in Charlotte, North Carolina. Accid. Anal. Prev. 2015, 76, 34–41. [Google Scholar] [CrossRef] [PubMed]
- Jensen, S.U. Bicycle tracks and lanes: A before–after study. In The 87th TRB Annual Meeting Compendium; Transportation Research Board: Washington, DC, USA, 2007; Available online: https://www.renehersecycles.com/wp-content/uploads/2013/08/bicycle20tracks20and20lanes.pdf.
- Šemrov, D.; Rijavec, R.; Lipar, P. Dimensioning of cycle lanes based on the assessment of comfort for cyclists. Sustainability 2022, 14, 10172. [Google Scholar] [CrossRef]
- Prati, G.; De Angelis, M.; Fraboni, F.; Pietrantoni, L. Factors contributing to bicycle–motorised vehicle collisions: a systematic literature review. Transp. Rev. 2018, 38, 184–208. [Google Scholar] [CrossRef]
- Foster, N.; Monsere, C.M.; Dill, J.; Clifton, K. Level-of-Service Model for Protected Bike Lanes. Transp. Res. Rec. 2019, 2520, 90–99. [Google Scholar] [CrossRef]
- McNeil, N.; Monsere, C.M.; Dill, J. Influence of Bike Lane Buffer Types on Perceived Comfort and Safety of Bicyclists and Potential Bicyclists. Transp. Res. Rec. 2019, 2520, 132–142. [Google Scholar] [CrossRef] [PubMed]
- von Stülpnagel, R.; Binnig, N. How safe do you feel?—A large-scale survey concerning the subjective safety associated with different kinds of cycling lanes. Accid. Anal. Prev. 2022, 167, 106577. [Google Scholar] [CrossRef] [PubMed]
- Winters, M.; Becker, H.J.E.H.; Brubacher, J.R.; Chipman, M.; Cripton, P.; Cusimano, M.D.; Friedman, S.M.; Harris, M.A.; Hunte, G.; Monro, M.; Reynolds, C.C.O.; Shen, H.; Teschke, K. Safe Cycling: How Do Risk Perceptions Compare With Observed Risk? Can. J. Public Health 2012, 103, S42–S47. [Google Scholar] [CrossRef] [PubMed]
- von Stülpnagel, R.; Lucas, J. Crash risk and subjective risk perception during urban cycling: Evidence for congruent and incongruent sources. Accid. Anal. Prev. 2020, 142, 105584. [Google Scholar] [CrossRef] [PubMed]
- von Stülpnagel, R.; Hologa, R.; Riach, N. Cars overtaking cyclists on different urban road types – Expectations about passing safety are not aligned with observed passing distances. Transp. Res. Part F. Traffic Psychol. Behav. 2022, 89, 334–346. [Google Scholar] [CrossRef]
- Seriani, S.; Perez, V.; Aprigliano, V.; Fujiyama, T. Experimental study of cyclists’ sensitivity when they are overtaken by a motor vehicle: A pilot study in a street without cycle lanes. Sustainability 2022, 14, 16784. [Google Scholar] [CrossRef]
- Pai, C.W. Overtaking, rear-end, and door crashes involving bicycles: an empirical investigation. Accid. Anal. Prev. 2011, 43, 1228–1235. [Google Scholar] [CrossRef] [PubMed]
- Diaz Fernandez, P.; Lindman, M.; Isaksson-Hellman, I.; Jeppsson, H.; Kovaceva, J. Description of same-direction car-to-bicycle crash scenarios using real-world data from Sweden, Germany, and a global crash database. Accid. Anal. Prev. 2022, 168, 106587. [Google Scholar] [CrossRef] [PubMed]
- Beck, B.; Perkins, M.; Olivier, J.; Chong, D.; Johnson, M. Subjective experiences of bicyclists being passed by motor vehicles: The relationship to motor vehicle passing distance. Accid. Anal. Prev. 2021, 155, 106102. [Google Scholar] [CrossRef] [PubMed]
- Hauenstein, J.; Zeile, P.; Merk, J. The Effect of Overtaking Distances on the Stress Occurrence of Cyclists in Urban Areas. In Proceedings of the 28th International Conference on Urban Planning and Regional Development in the Information Society (REAL CORP 2023), Ljubljana, Slovenia, 18–20 September 2023; Available online: https://publikationen.bibliothek.kit.edu/1000164089.
- Beck, B.; Chong, D.; Olivier, J.; Perkins, M.; Tsay, A.; Rushford, A.; Li, L.; Cameron, P.; Fry, R.; Johnson, M. How much space do drivers provide when passing cyclists? Understanding the impact of motor vehicle and infrastructure characteristics on passing distance. Accid. Anal. Prev. 2019, 128, 253–260. [Google Scholar] [CrossRef] [PubMed]
- Mackenzie, J. R. R.; Dutschke, J. K.; Ponte, G. An investigation of cyclist passing distances in the Australian Capital Territory. Accid. Anal. Prev. 2021, 154, 106075. [Google Scholar] [CrossRef] [PubMed]
- Nolan, J.; Sinclair, J.; Savage, J. Are bicycle lanes effective? The relationship between passing distance and road characteristics. Accid. Anal. Prev. 2021, 159, 106184. [Google Scholar] [CrossRef] [PubMed]
- Ampe, T.; De Geus, B.; Walker, I.; Serrien, B.; Truyen, B.; Durlet, H.; Meeusen, R. The impact of a child bike seat and trailer on the objective overtaking behaviour of motorized vehicles passing cyclists. Transp. Res. Part F. Traffic Psychol. Behav. 2020, 75, 55–65. [Google Scholar] [CrossRef]
- Chuang, K.H.; Hsu, C.C.; Lai, C.H.; Doong, J.L.; Jeng, M.C. The use of a quasi-naturalistic riding method to investigate bicyclists’ behaviors when motorists pass. Accid. Anal. Prev. 2013, 56, 32–41. [Google Scholar] [CrossRef] [PubMed]
- Mehta, K.; Mehran, B.; Hellinga, B. Evaluation of the Passing Behavior of Motorized Vehicles When Overtaking Bicycles on Urban Arterial Roadways. Transp. Res. Rec. 2019, 2520, 8–17. [Google Scholar] [CrossRef]
- Shackel, S.C.; Parkin, J. Influence of road markings, lane widths and driver behaviour on proximity and speed of vehicles overtaking cyclists. Accid. Anal. Prev. 2014, 73, 100–108. [Google Scholar] [CrossRef] [PubMed]
- Rubie, E.; Haworth, N.; Twisk, D.; Yamamoto, N. Influences on lateral passing distance when motor vehicles overtake bicycles: a systematic literature review. Transp. Rev. 2020, 40, 754–773. [Google Scholar] [CrossRef]
- Llorca, C.; Angel-Domenech, A.; Agustin-Gomez, F.; Garcia, A. Motor vehicles overtaking cyclists on two-lane rural roads: Analysis on speed and lateral clearance. Saf. Sci. 2017, 92, 302–310. [Google Scholar] [CrossRef]
- Rasch, A.; Moll, S.; López, G.; García, A.; Dozza, M. Drivers’ and cyclists’ safety perceptions in overtaking maneuvers. Transp. Res. Part F. Traffic Psychol. Behav. 2022, 84, 165–176. [Google Scholar] [CrossRef]
- Adminaité-Fodor, D.; Jost, G. How safe is walking and cycling in Europe? (PIN Flash 38); European Transport Safety Council: Brussels, Belgium, 2020. [Google Scholar]
- Aarts, L.; van Schagen, I. Driving speed and the risk of road crashes: a review. Accid. Anal. Prev. 2006, 38, 215–224. [Google Scholar] [CrossRef] [PubMed]
- Elvik, R.; Christensen, P.; Amundsen, A. Speed and Road Accidents: An Evaluation of the Power Model; Institute of Transport Economics (TØI): Oslo, Norway, 2004; p. 46. [Google Scholar]
- Rosén, E.; Sander, U. Pedestrian fatality risk as a function of car impact speed. Accid. Anal. Prev. 2009, 41, 536–542. [Google Scholar] [CrossRef] [PubMed]
- Yannis, G.; Michelaraki, E. Review of City-Wide 30 km/h Speed Limit Benefits in Europe. Sustainability 2024, 16, 4382. [Google Scholar] [CrossRef]
- European Commission. EU Road Safety Policy Framework 2021–2030—Next Steps towards “Vision Zero”; European Commission: Brussels, Belgium, 2019; Available online: https://transport.ec.europa.eu/system/files/2021-10/SWD2190283.pdf.
- Taylor, M.C.; Lynam, D.A.; Baruya, A. The Effects of Drivers’ Speed on the Frequency of Road Accidents; Transport Research Laboratory: Crowthorne, UK, 2000. [Google Scholar]
- Arias, D.; Ederer, D.; Rodgers, M.O.; Hunter, M.P.; Watkins, K.E. Estimating the effect of vehicle speeds on bicycle and pedestrian safety on the Georgia arterial roadway network. Accid. Anal. Prev. 2021, 161, 106351. [Google Scholar] [CrossRef] [PubMed]
- Theeuwes, J. Self-explaining roads: What does visual cognition tell us about designing safer roads? Cogn. Res. Princ. Implic. 2021, 6, 15. [Google Scholar] [CrossRef] [PubMed]
- Balanovic, J.; Davison, A.; Thomas, J.; Bowie, C.; Frith, B.; Lusby, M.; Kean, R.; Schmitt, L.; Beetham, J.; Robertson, C.; Trotter, M.; Kortegast, P.; Burton, J. Investigating the Feasibility of Trialling a Minimum Overtaking Gap Law for Motorists Overtaking Cyclists in New Zealand; NZ Transport Agency Internal Report; Opus Research/NZ Transport Agency: Wellington, New Zealand, 2016; Available online: https://nzta.govt.nz/walking-cycling-and-public-transport/cycling/cycling-research.
- Kircher, K.; Forward, S.; Wallén Warner, H. Cycling in Rural Areas—An Overview of National and International Literature; Swedish National Road and Transport Research Institute (VTI): Linköping, Sweden, 2022. [Google Scholar]
- Road Safety Authority. Examining the International Research Evidence in Relation to Minimum Passing Distances for Cyclists; Road Safety Authority of Ireland: Ballina, Ireland, 2018. [Google Scholar]
- Ministrstvo za infrastrukturo. Pravilnik o kolesarskih površinah; Uradni list RS, št. 36/18 in 132/22 – ZCes-2: Ljubljana, Slovenia, 2018.
- Reh, J.; Lauer, S. Pathways to more space. What factors influence the lateral distance of overtaking vehicles from cyclists? Transp. Res. Procedia 2023, 72, 3585–3592. [Google Scholar] [CrossRef]
- Wang, C.; Wei, L.; Wang, K.; Tang, H.; Yang, B.; Li, M. Investigating the factors affecting rider’s decision on overtaking behavior: A naturalistic riding research in China. Sustainability 2022, 14, 11495. [Google Scholar] [CrossRef]
- Casey, L.; Gaspers, L.; Mandel, H. Overtaking in Stuttgart—analysis of the lateral distances between motor vehicles and bicycle traffic with reference to traffic volume and cycling infrastructure. Traffic Saf. Res. 2024, 7. [Google Scholar] [CrossRef]
- van Petegem, J.W.H.; Schepers, P.; Wijlhuizen, G.J. The safety of physically separated cycle tracks compared to marked cycle lanes and mixed traffic conditions in Amsterdam. Eur. J. Transp. Infrastruct. Res. 2021, 21, 19–37. [Google Scholar] [CrossRef]
- Adams, T.; Aldred, R. Cycling Injury Risk in London: Impacts of Road Characteristics and Infrastructure. In Transp. Findings; 2020. [Google Scholar] [CrossRef]
- Teschke, K.; Harris, M.A.; Reynolds, C.C.; Winters, M.; Babul, S.; Chipman, M.; Cusimano, M.D.; Brubacher, J.R.; Hunte, G.; Friedman, S.M.; Monro, M.; Shen, H.; Vernich, L.; Cripton, P.A. Route infrastructure and the risk of injuries to bicyclists: a case-crossover study. Am. J. Public Health 2012, 102, 2336–2343. [Google Scholar] [CrossRef] [PubMed]
- Mulvaney, C.A.; Smith, S.; Watson, M.C.; Parkin, J.; Coupland, C.; Miller, P.; Kendrick, D.; McClintock, H. Cycling infrastructure for reducing cycling injuries in cyclists. Cochrane Database Syst. Rev. 2015, 12, CD010415. [Google Scholar] [CrossRef] [PubMed]
- Phillips, D.; Mindell, S.; Rantanen, K.; Bury, J.; Sayers, E.; Forsyth, E.; Brainard, J. Cycling and Walking Safety: A Rapid Evidence Assessment for the Department for Transport; NatCen Social Research: London, UK, 2018. [Google Scholar]
- Reynolds, C.C.; Harris, M.A.; Teschke, K.; Cripton, P.A.; Winters, M. The impact of transportation infrastructure on bicycling injuries and crashes: a review of the literature. Environ. Health 2009, 8, 47. [Google Scholar] [CrossRef] [PubMed]
- Montufar, J.; Chapman, S.; Poapst, R. Safety Performance of Bicycle Infrastructure in Canada; Transportation Association of Canada: Ottawa, ON, Canada, 2020; p. 66. [Google Scholar]
- Trotter, M.; Kean, P.; Beetham, J.; Bowie, C.; Burton, J.; Thomas, J. Improving Safety for People Who Cycle on Rural Roads; NZ Transport Agency Research Report 589; Opus International Consultants Ltd.: Wellington, New Zealand, 2016. [Google Scholar]
- Williams, M.; Leland, M.; Bauranov, A.; Pande, A. Safety Considerations for All Road Users on Edge Lane Roads (20-55); Mineta Transportation Institute, San José State University: San Jose, CA, USA, 2021. [Google Scholar]
- Jacobsen, P.L. Safety in numbers: more walkers and bicyclists, safer walking and bicycling. Inj. Prev. 2003, 9, 205–209. [Google Scholar] [CrossRef] [PubMed]
- CROW. Design Manual for Bicycle Traffic; CROW: Ede, The Netherlands, 2016. [Google Scholar]
- International Transport Forum. Cycling, Health and Safety; ITF Research Reports; OECD Publishing: Paris, France, 2013; ISBN 9789282105948, 9789282105955. [Google Scholar]
- Pucher, J.; Buehler, R. City Cycling; The MIT Press: Cambridge, MA, USA, 2012. [Google Scholar] [CrossRef]
- Uijtdewilligen, T.; Ultee, M.B.; Wijlhuizen, G.J.; Geurs, K.T. Exploring the relationship between cyclists’ perceived unsafety, crash risk, and exposure in Dutch cities. Accid. Anal. Prev. 2025, 219, 108113. [Google Scholar] [CrossRef] [PubMed]
- Logan, G.; Somers, C.; Baker, G.; Connell, H.; Gray, S.; Kelly, P.; McIntosh, E.; Welsh, P.; Gray, C.M.; Gill, J.M.R. Benefits, risks, barriers, and facilitators to cycling: a narrative review. Front. Sports Act. Living 2023, 5, 1168357. [Google Scholar] [CrossRef] [PubMed]
- Aarts, L.; Wegman, F.C.M.; van Schagen, I.; Louwerse, R. Safe Speeds and Credible Speed Limits (SaCredSpeed): New Vision for Decision Making on Speed Management. In Proceedings of the Transportation Research Board 88th Annual Meeting, Washington, DC, USA, 2009; Available online: https://trid.trb.org/view/881073.
- Ayad, L.; Imine, H.; De Crescenzio, F.; Lantieri, C. Bicycle simulator use to evaluate safety risks and perceptions for enhanced sustainable urban mobility. Sustainability 2024, 16, 9786. [Google Scholar] [CrossRef]
- Vejdirektoratet. 2 Minus 1 Veje—Erfaringsopsamling; Vejdirektoratet: Copenhagen, Denmark, 2013. [Google Scholar]
- German Federal Government. Road Traffic Regulations (Straßenverkehrs-Ordnung, StVO); Federal Ministry of Transport: Berlin, Germany, 2016. [Google Scholar]
- National Transport Authority. National Cycle Manual; National Transport Authority: Dublin, Ireland, 2011. [Google Scholar]
- CROW. Design Manual for Bicycle Traffic; CROW: Utrecht, The Netherlands, 2017. [Google Scholar]
- Visser van der Meulen, J.; Berg, S. Fördjupat Experiment med 2-1-Vägar—Bygdeväg; Trafikverket: Stockholm, Sweden, 2018. [Google Scholar]
- Berg, S. Fördjupat Experiment med 2-1-Vägar, Bygdeväg—Utökat Delprojekt; Trafikverket: Stockholm, Sweden, 2020. [Google Scholar]
- Transport for London. London Cycling Design Standards; Transport for London: London, UK, 2014. [Google Scholar]
- Alta Planning + Design. Lessons Learned: Advisory Bike Lanes in North America; Alta Planning + Design: Portland, OR, USA, 2017. [Google Scholar]
- Ředitelství silnic a dálnic ČR. TP 172: Navrhování Komunikací pro Cyklisty; Ministry of Transport: Prague, Czech Republic, 2023. [Google Scholar]
- Ministry of Infrastructure. Wytyczne Projektowania Odcinków Dróg Zamiejskich. Część 4: Katalog Typowych Przekrojów Poprzecznych; Ministry of Infrastructure: Warsaw, Poland, 2023. [Google Scholar]
- Forschungsgesellschaft Straße–Schiene–Verkehr (FSV). RVS 03.02.13: Radverkehr; FSV. Vienna, Austria, 2015.
- Finnish Transport Agency. Pyöräliikenteen Suunnittelu; Finnish Transport Agency: Helsinki, Finland, 2018. [Google Scholar]
- Belgian Road Research Centre (BRRC). Fiche 29: Chaussée à Voie Centrale Banalisée (CVCB); BRRC: Brussels, Belgium, 2021. [Google Scholar]
- Aboucaya, G.; Duhamel, N.; Jouannot, T. Évaluation des Chaussées à Voie Centrale Banalisée: Quels Enseignements ? Cerema: Lyon, France, 2014. [Google Scholar]
- Ministerio de Transportes; Movilidad y Agenda Urbana. Guía de Recomendaciones de Infraestructura Ciclista; Ministerio de Transportes, Movilidad y Agenda Urbana: Madrid, Spain, 2021. [Google Scholar]
- SWOV. Kantstroken op erftoegangswegen buiten de bebouwde kom; SWOV Institute for Road Safety Research: The Hague, The Netherlands, 2013; Available online: https://swov.nl/system/files/publication-downloads/factsheet_rijlopers_gearchiveerd.pdf.
- Lund, B. Trafiksikkerhedsanalyse af ‘2-1’ veje; Trafik & Samfund—Diplomvej: Copenhagen, Denmark, 2015. [Google Scholar]
- Vejdirektoratet. Håndbog: Trafiksikkerhed—Effekter af Vejtekniske Virkemidler, 2nd ed.; Report No. 507; Vejdirektoratet: Copenhagen, Denmark, 2014. [Google Scholar]
- Erke, A.; Sørensen, M. 2008. Veger med inntrukken kantlinje utenfor tettbygd strøk. Report No. 961/2008. Institute of Transport Economics (TØI): Oslo, Norway.
- Berg, S. Fördjupat experiment med 2-1-vägar—Bygdeväg; MOVEA: Stockholm, Sweden, 2020. [Google Scholar]
- Trafikverket. Dataproduktspecifikation—Bygdeväg, Version 3.0; Trafikverket: Borlänge, Sweden, 2024. [Google Scholar]
- Service public de Wallonie. La chaussée à voie centrale; Service public de Wallonie: Namur, Belgium, 2022; Available online: https://securotheque.wallonie.be/e-amenagements-usagers-et-vehicules/cyclistes/amenagements-cyclables/chausse-a-voie-centrale.
- Rudolph, C.; Lauer, M.; Metzler, S.; Ingram, Z. Too close? Investigating the distance between cars and bikes when overtaking with regards to the infrastructure using the OpenBikeSensor and information from OpenStreetMap. In Proceedings of the 10th Annual International Cycling Safety Conference (ICSC), Dresden, Germany, 2022. [Google Scholar]
- Javna agencija Republike Slovenije za varnost prometa (AVP). Evidenca prometnih nesreč. Available online: http://nesrece.avp-rs.si/.
- Selan, I. Po dobrih treh letih končno le otvoritev Limbuške obvoznice v Mariboru. Večer 2023. Available online: https://vecer.com/maribor/aktualno/po-dobrih-treh-letih-koncno-le-otvoritev-limbuske-obvoznice-v-mariboru-10340054.
- Henao, A.; Apparicio, P.; Maignan, D. One Metre Plus (1M+): A Multifunctional Open-Source Sensor for Bicycles Based on Raspberry Pi. Sensors 2021, 21, 5812. [Google Scholar] [CrossRef] [PubMed]
- Fian, T.; Hauger, G.; Soteropoulos, A.; Zuser, V.; Scheibmayr, M. A Sensor-Based and GIS-Linked Analysis of Road Characteristics Influencing Lateral Passing Distance Between Motor Vehicles and Bicycles in Austria. Sensors 2025, 26, 87. [Google Scholar] [CrossRef] [PubMed]
- Louro, T.V.; Junior, J.U.P.; Gardin, G.T.O.; da Silva Junior, C.A.P. Factors Influencing Lateral Distance and Speed of Motorized Vehicles Overtaking Bicycles. Transp. Res. Rec. 2023, 2677, 51–61. [Google Scholar] [CrossRef]
Figure 1.
Typical cross-section of the 2–1 layout.
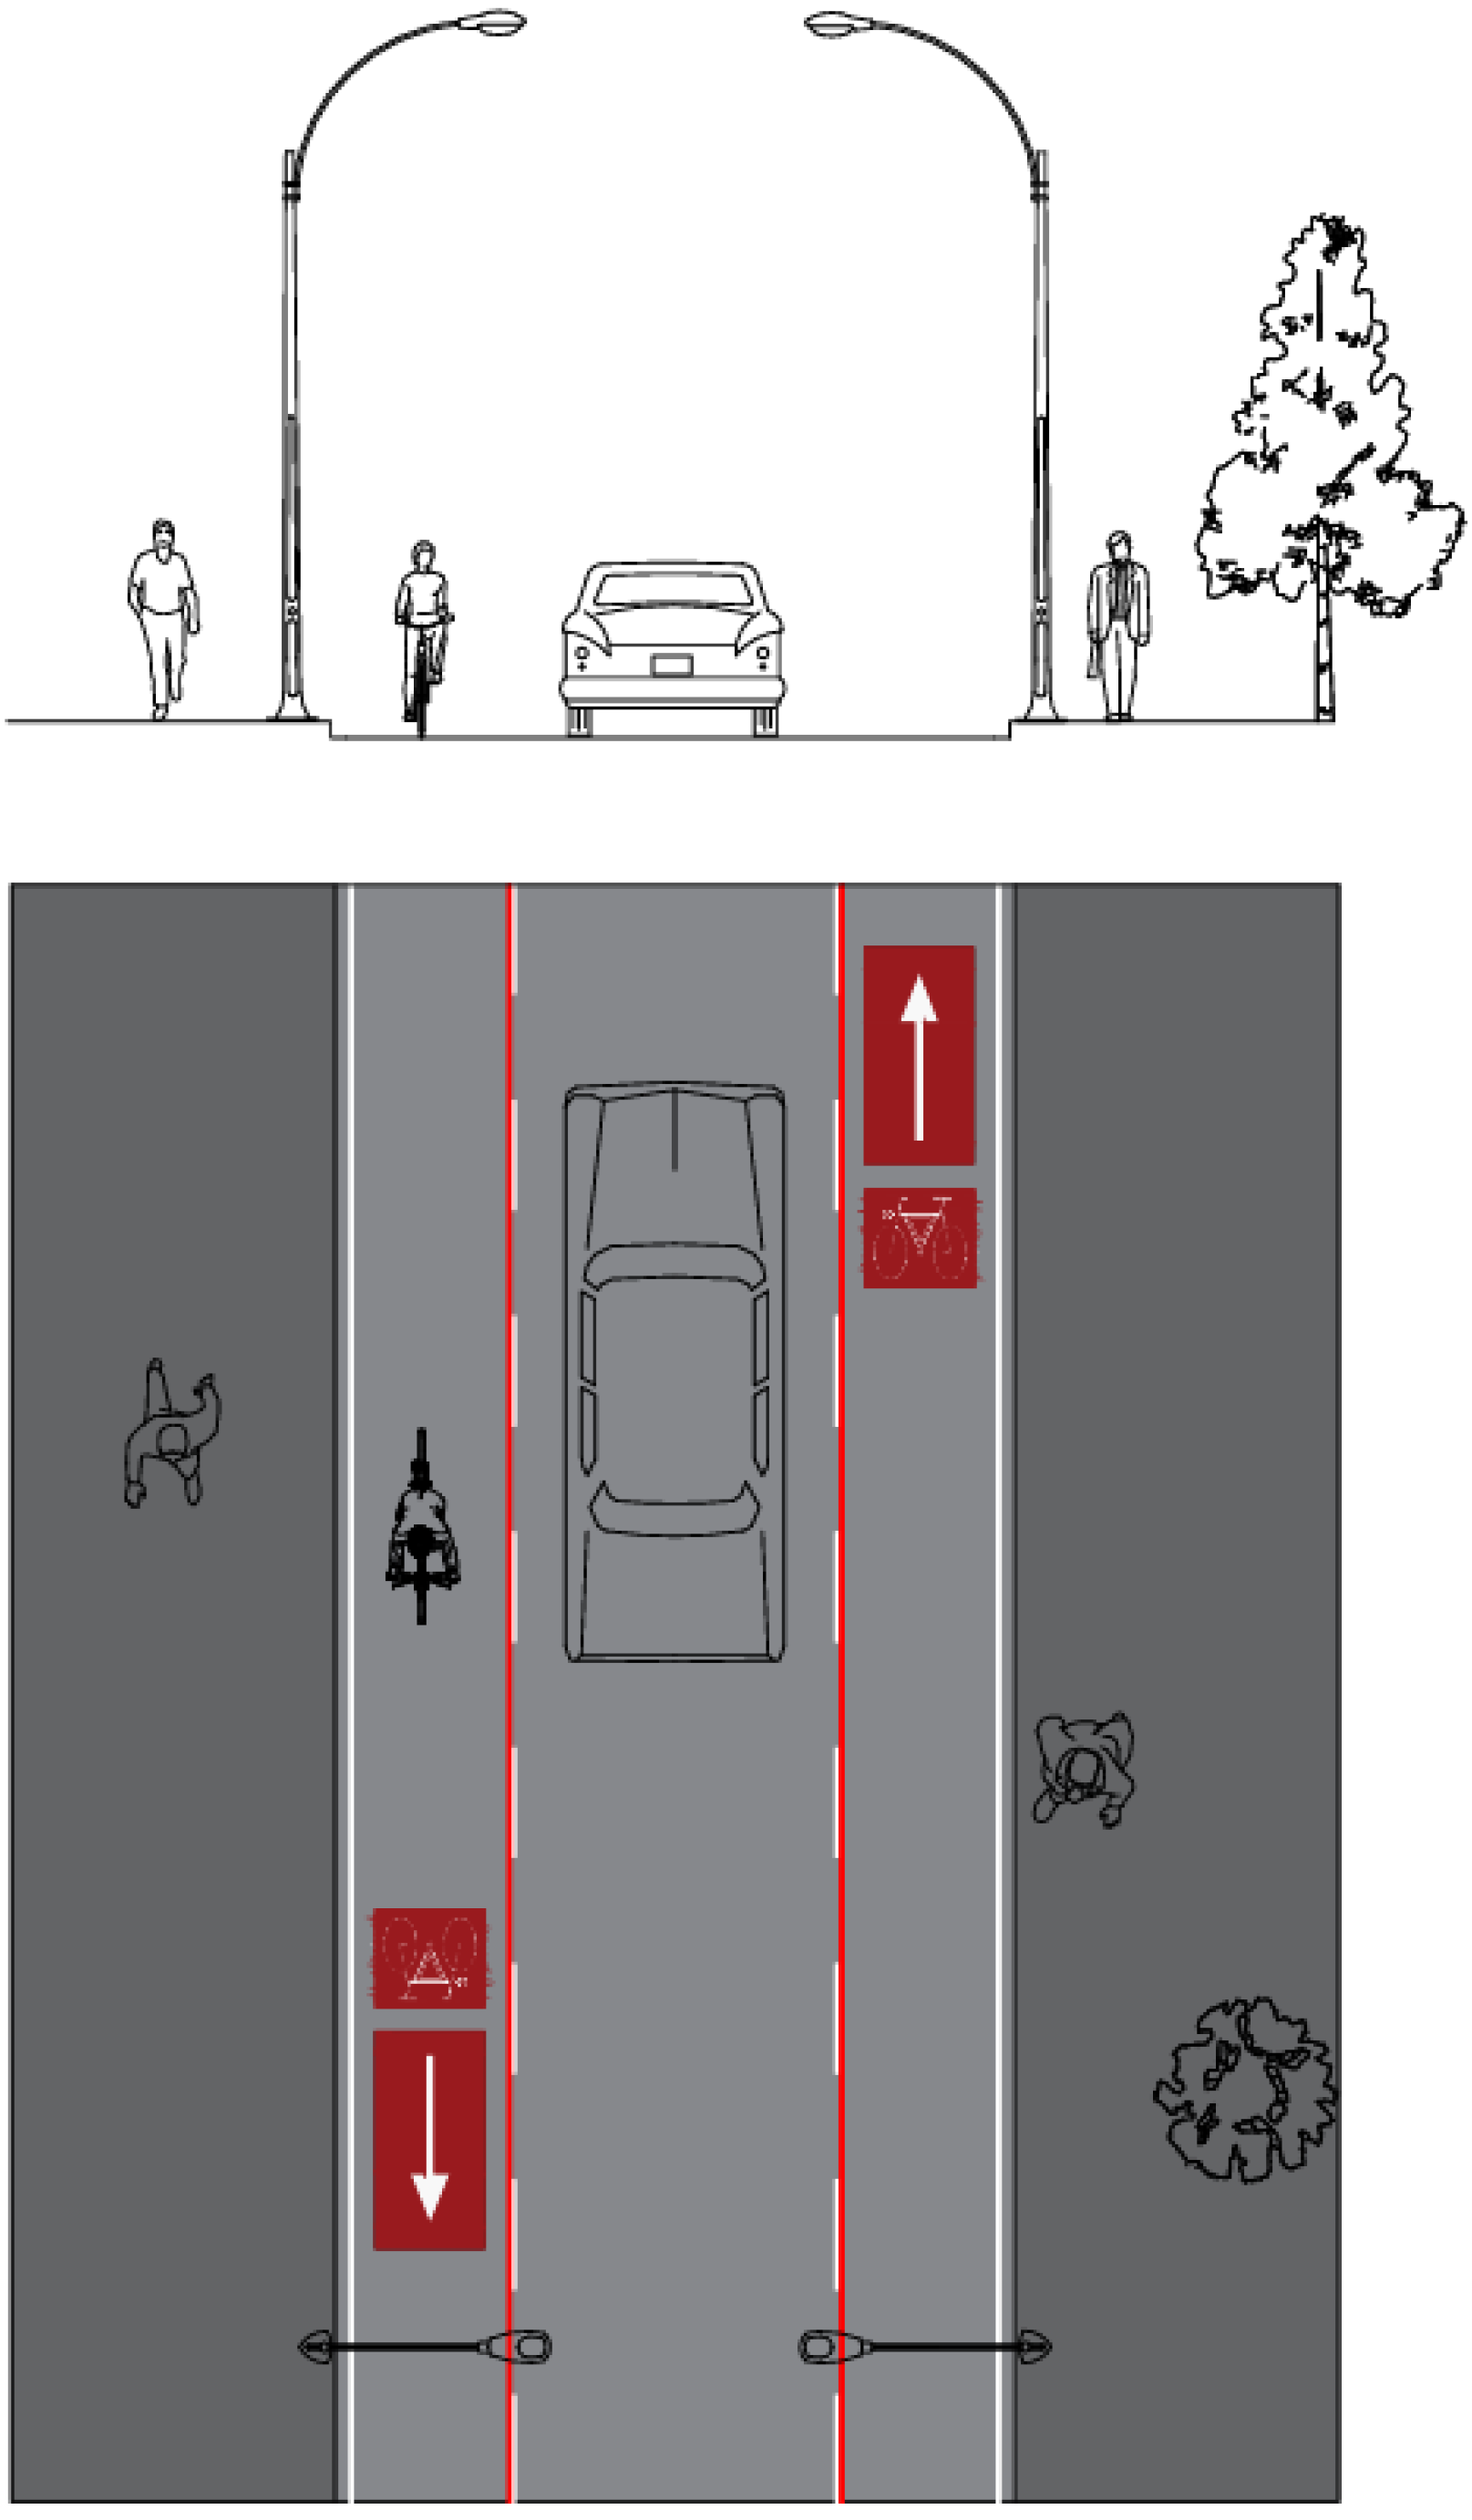
Figure 2.
Spatial distribution of the analysed 2–1 road segments within the study area.
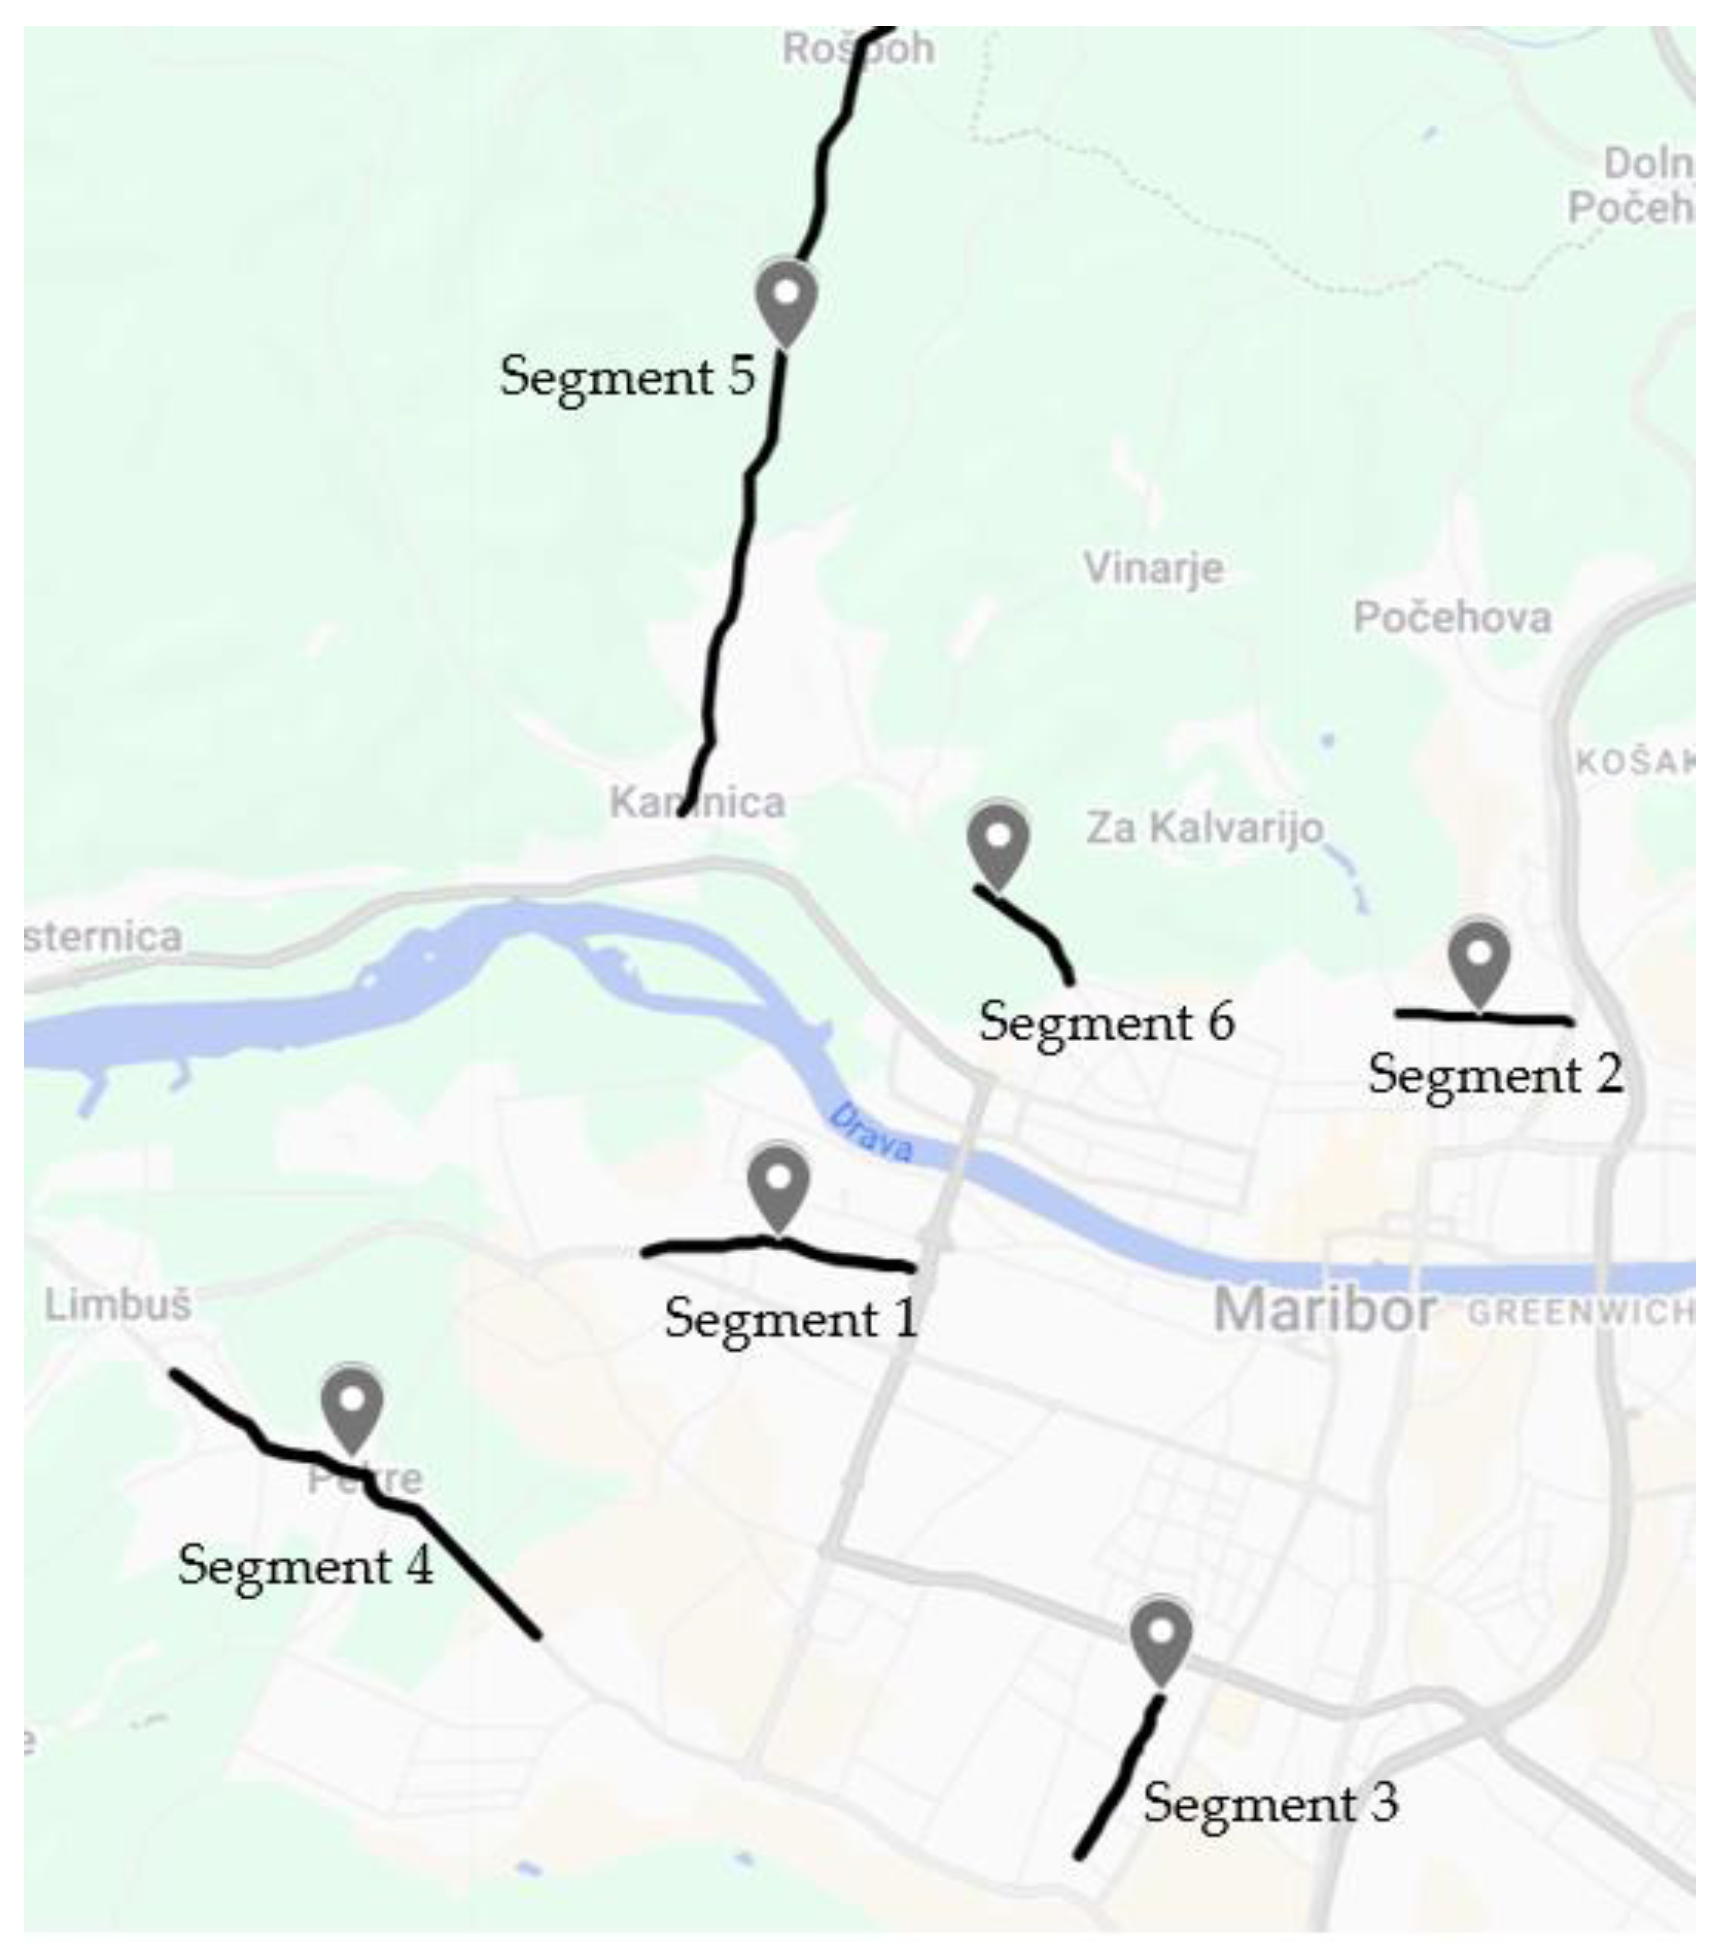
Figure 3.
Methodological framework of the study.
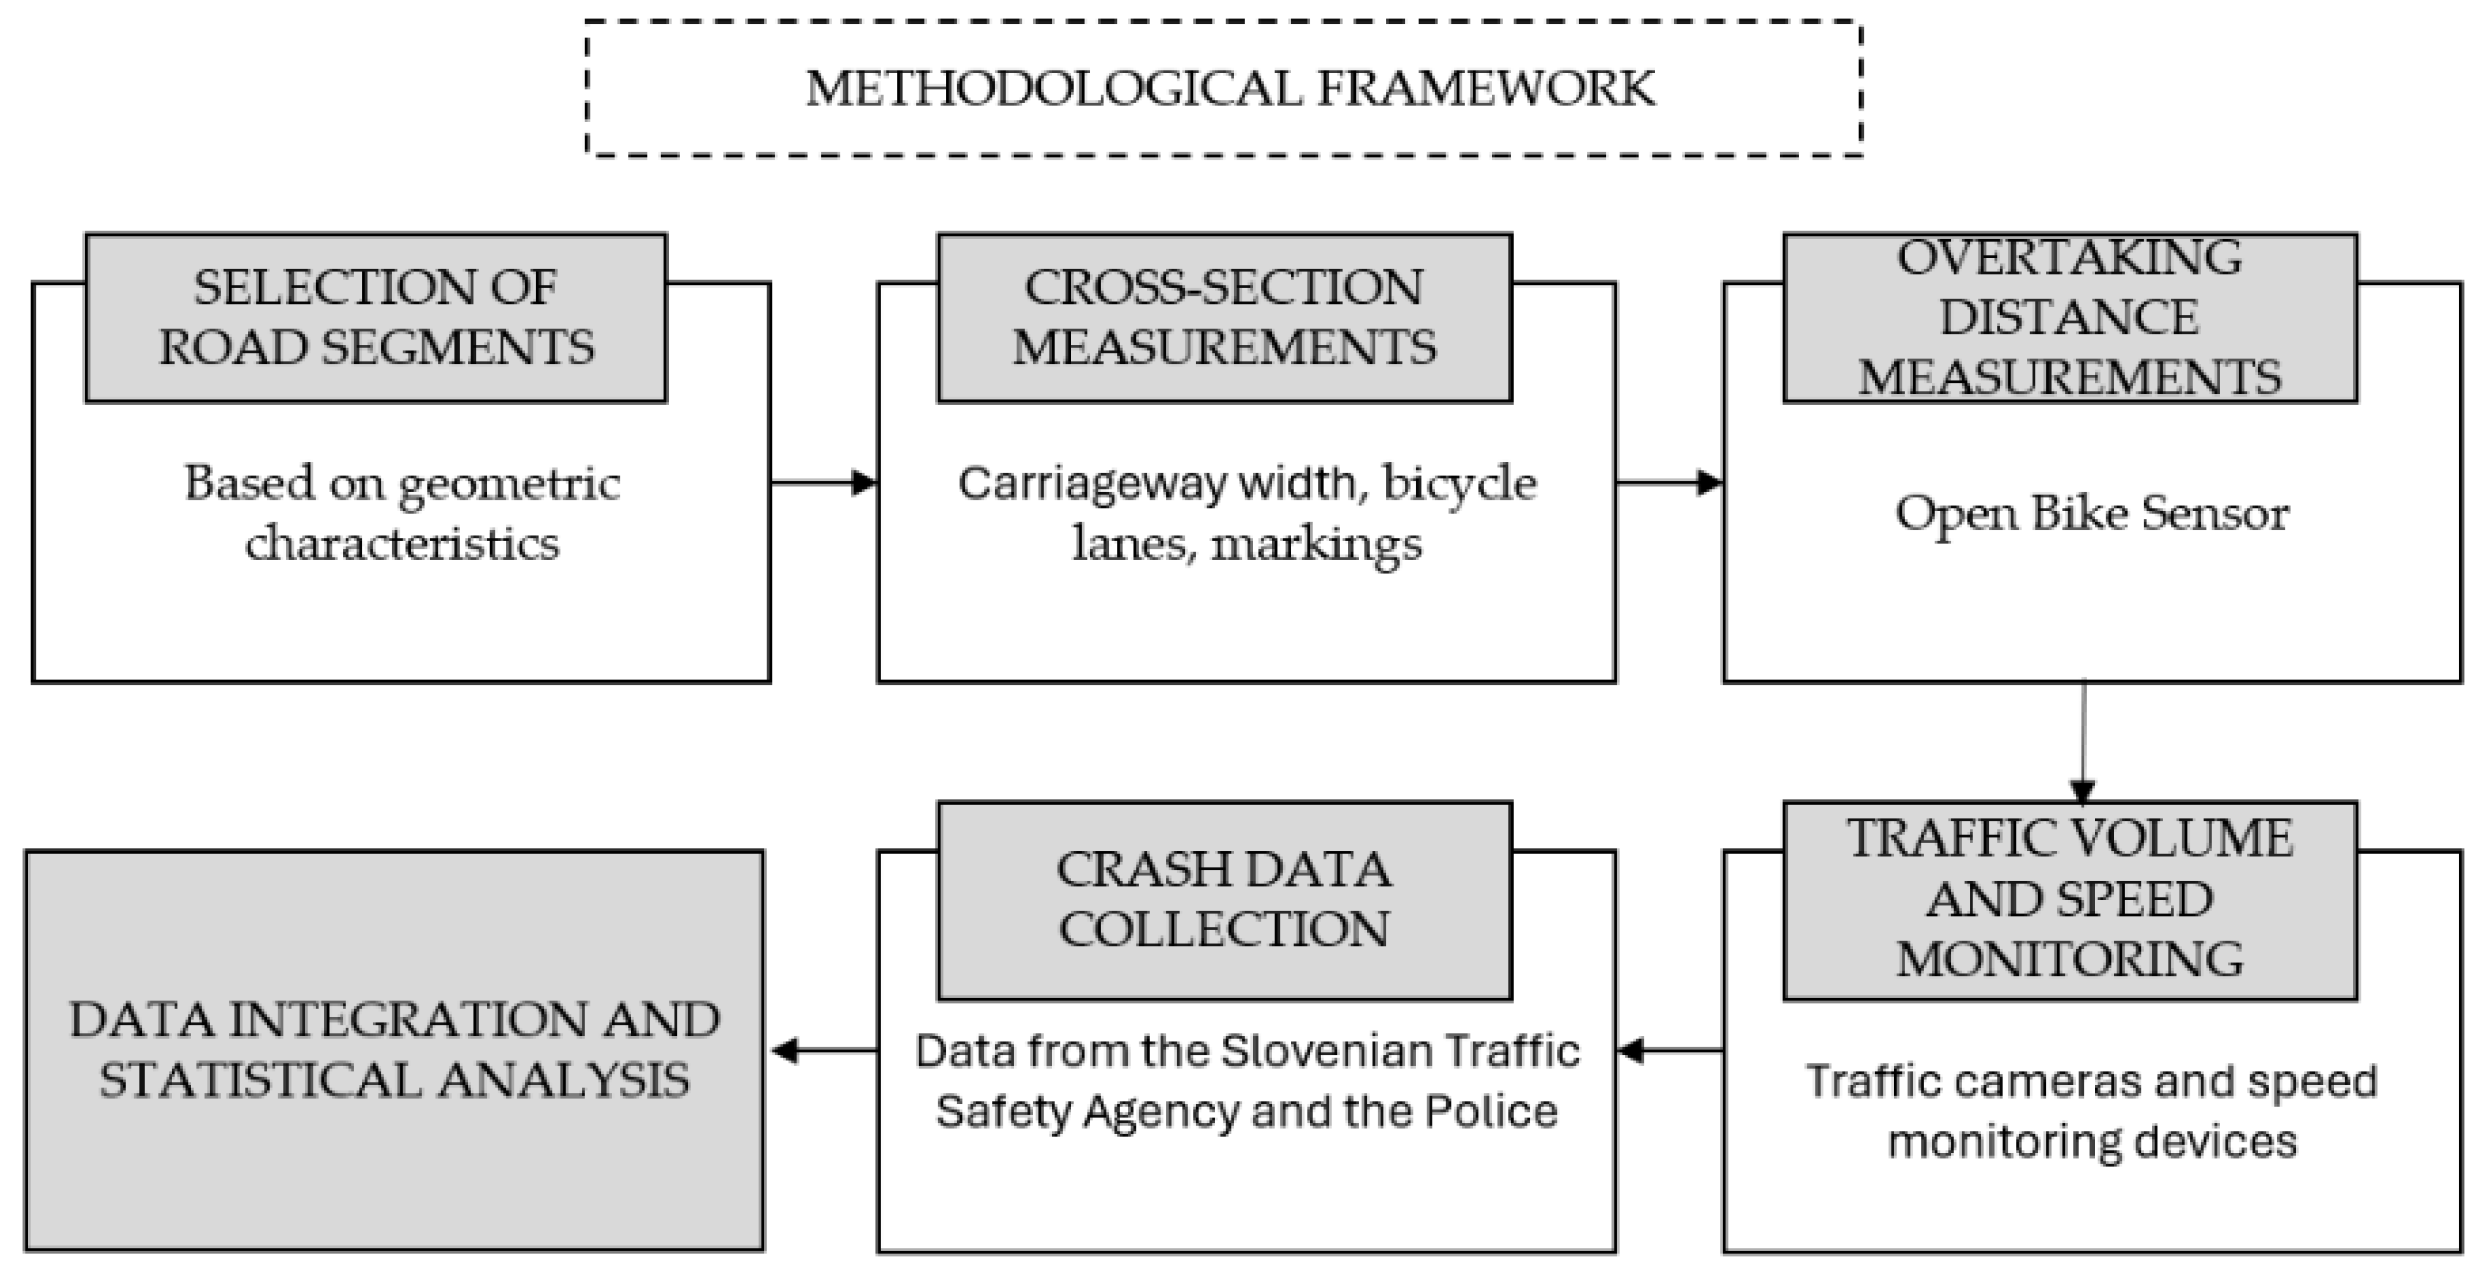
Figure 4.
Frequency distribution of lateral distances on advisory-lane streets. The vertical line indicates the recommended minimum overtaking distance of 1.5 m.
Figure 4.
Frequency distribution of lateral distances on advisory-lane streets. The vertical line indicates the recommended minimum overtaking distance of 1.5 m.
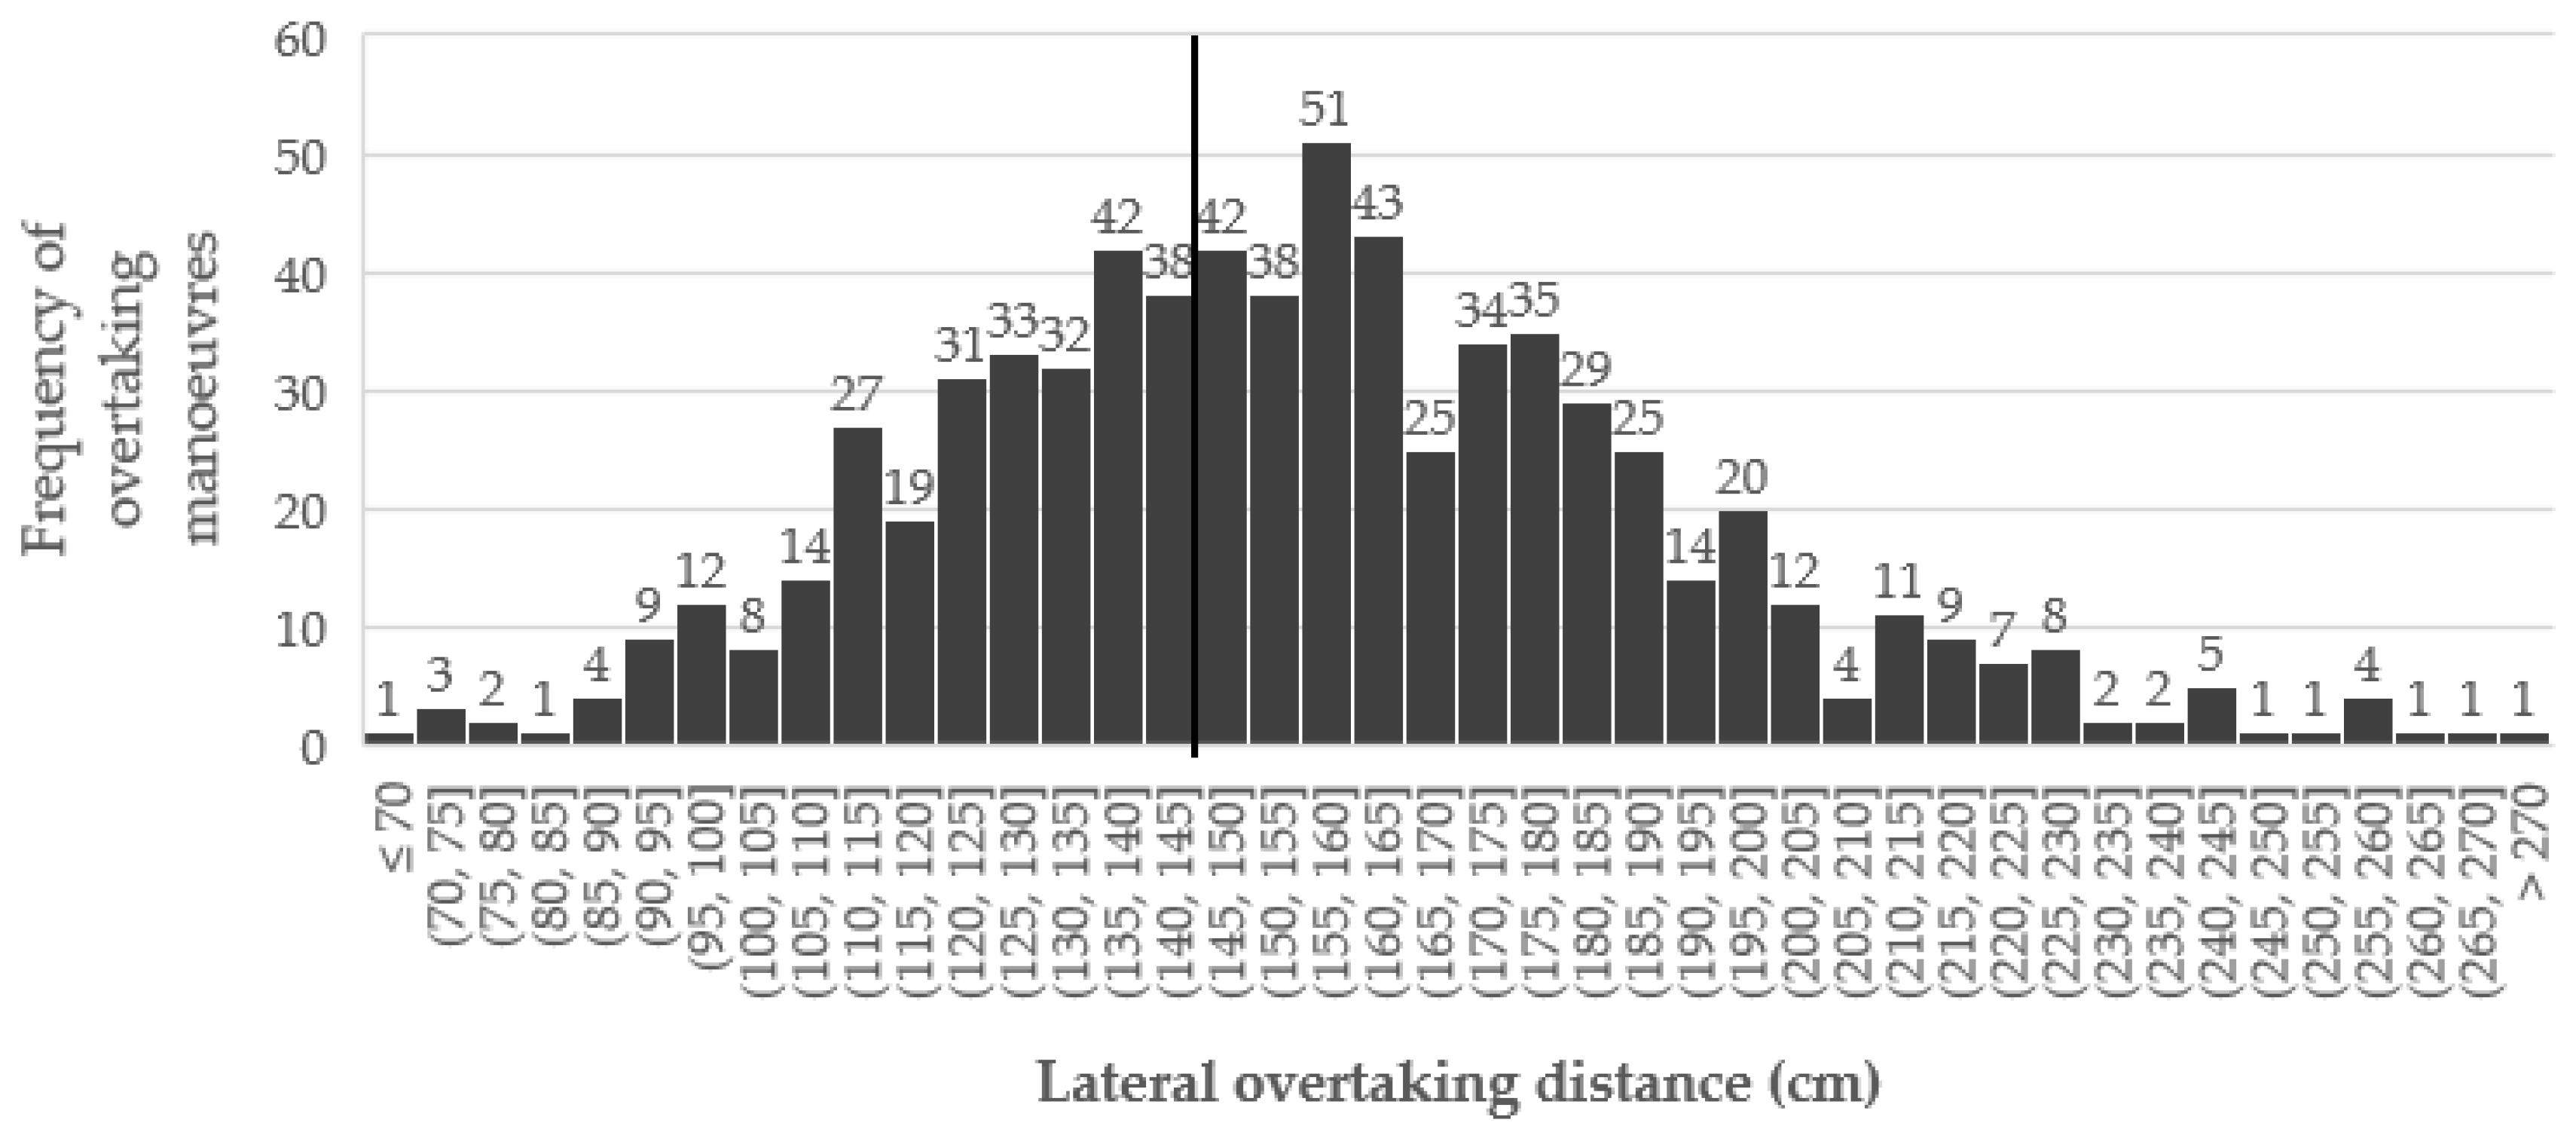
Figure 5.
Frequency distribution of lateral overtaking distances on streets without cycle lanes. The vertical line indicates the recommended minimum overtaking distance of 1.5 m.
Figure 5.
Frequency distribution of lateral overtaking distances on streets without cycle lanes. The vertical line indicates the recommended minimum overtaking distance of 1.5 m.
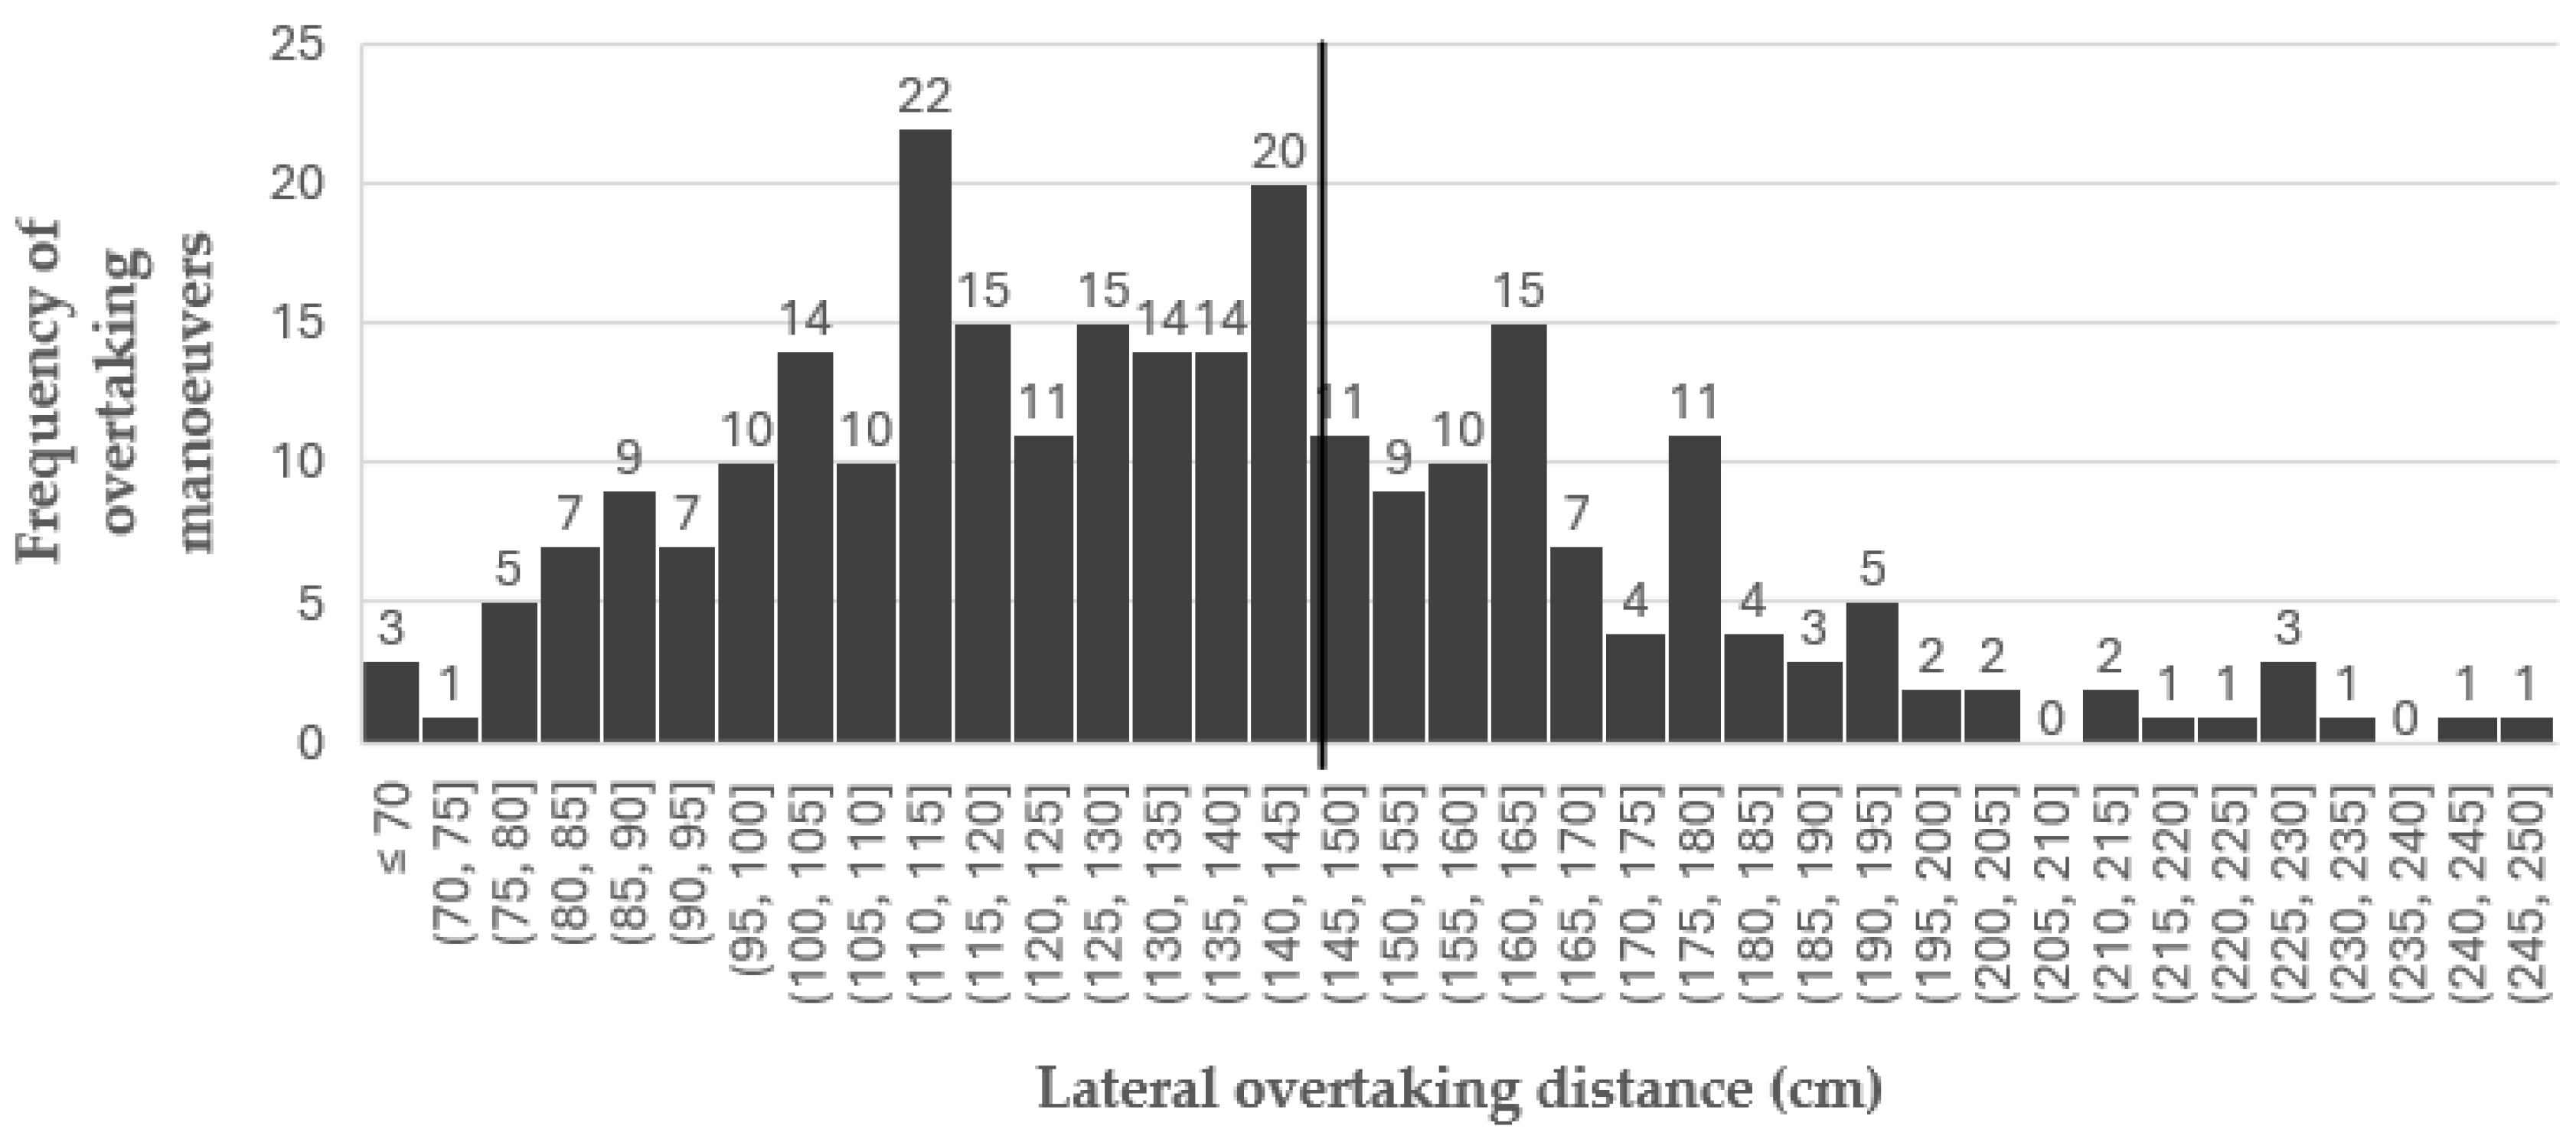

Table 1.
2–1 Roads recommendation throughout the world [68].
Table 1.
2–1 Roads recommendation throughout the world [68].
| Local name | Country | Area type | Central lane min [m] | Central lane optimal [m] |
Cycle lane min [m] | Cycle lane optimal [m] |
Speed limit [km/h] | Max PCU [veh/h] |
Source |
|---|---|---|---|---|---|---|---|---|---|
| 2 minus 1 vej | Denmark | Outside urban | 3 | 3.5 | 0.9 | 1.5 | 60 | 300 | Vejdirektoratet [77] |
| - | Germany | Inside urban | 4.5 | - | 1.25 | 1.5 | 50 | - | German Road Authority [78] |
| - | Ireland | Inside urban | 4 | - | 2 | 2 | 50 | - | National Transport Authority [79] |
| - | Netherlands | Outside urban | 3 | - | 1.25 | 1.5 | 60 | 4000 | CROW [80] |
| bymiljöväg | Sweden | Inside urban | 3 | - | 0.2 | 1.5 | 50 | 1500 | Meulén & Berg [81] |
| - | Sweden - pilot | Outside urban | 3 | 3.5 | 0.75 | 1.5 | 70 | 3000 | Fördjupat Experiment [82] |
| - | United Kingdom | Outside urban | 3 | 3.5 | 1.5 | 2 | 64 | 4000 | Transport for London [83] |
| - | United States | Inside urban | 3 | 4.9 | 1.2 | 1.8 | 56 | 6000 | Alta Planning [84] |
| - | Czech Republic |
Outside urban | 3 | 3.5 | 1.25 | 1.5 | 70 | 1500 | TP 179 [85] |
| - | Slovenia | Inside urban | 3.5 | - | 1 | 1.5 | 30 | - | Pravilnik o kolesarskih površinah [56] |
| - | Poland | Outside urban | 2.75 | 3.5 | 1.25 | 1.5 | 50 | - | WR-D-22-4 [86] |
| - | Austria | Outside urban | 3 | 4.5 | 1.5 | 1.8 | 30 (70 pilot) | - | RVS 03.02.13 [87] |
| Kylätie | Finland | Inside urban | 2.6 | 3.8 | 1.5 | 2.2 | 40 | 3000 | Pyöräliikenteen suunnittelu [88] |
| Chaussée à voie centrale banalisée | France | Outside urban | 3 | 3.5 | 1.5 | - | 70 | 2000 | Fiche 29 (CVCB) [89] |
| Chaussée à voie centrale (CVC) | Belgium | Outside urban | 2.5 | 3.5 | 1.25 | 1.5 | 70 | - | La chaussée à voie centrale [90] |
| Bandas laterales de protección |
Spain | Outside urban | 3 | 3 | 1.5 | - | - | - | Guía de recomendaciones [91] |
Table 2.
Geometric and traffic characteristics of the analysed road segments.
| Segment ID | Representative photograph |
Length [m] | Central lane width | Cycle lanes width | Speed limit [km/h] | AADT |
|---|---|---|---|---|---|---|
| Segment 1 | 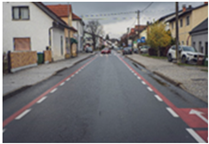 |
1000 | 3.5 | 1.25 | 30 | 6000 |
| Segment 2 | 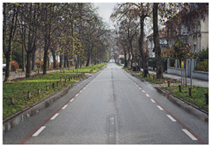 |
620 | 3.5 | 1.25 | 30 | 3840 |
| Segment 3 | 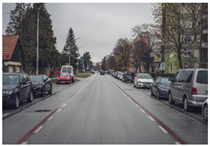 |
900 | 3.5 | 1.75 | 50 | 5600 |
| Segment 4 | 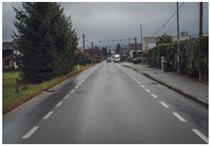 |
1400 | 3.5 | 1.25 | 30 | 2570 |
| Segment 5 | 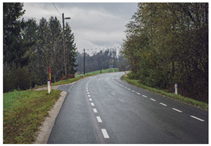 |
3700 | 3.3 | 1.35 | 50 (30) | 2350 |
| Segment 6 | 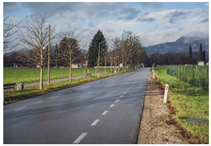 |
560 | 3.45 | 1.2 | 30 | 2950 |
Table 3.
Geometric, traffic and overtaking characteristics of the analysed road segments.
| Parameter | Segment 1 | Segment 2 | Segment 3 | Segment 4 | Segment 5 | Segment 6 | Streets without cycle lanes |
Segment 1 - without cycle lanes |
|---|---|---|---|---|---|---|---|---|
| Maximum allowed speed [km/h] | 30 | 30 | 50 | 30 | 50 | 30 | 50 | 50 |
| Length of the segment [m] |
1000 | 620 | 900 | 1400 | 3700 | 560 | - | - |
| Average daily intensity [veh/day] |
6000 | 3840 | 5600 | 2570 | 2600 | 2950 | - | - |
| Average speed [km/h] | 39 | 33.8 | 32 | 39.75 | 51 | 45.7 | - | - |
| In the speed limit [%] | N/A | 28.3 | N/A | 11 | 15 | 4 | - | - |
| V85 [km/h] | 47 | 41 | 39 | 47 | 61 | 56 | - | - |
| Number of overtakes | 153 | 128 | 184 | 45 | 95 | 95 | 172 | 98 |
| Average [cm] | 149.93 | 155.73 | 161.4 | 154 | 160.36 | 154.38 | 133.02 | 139.51 |
| Median [cm] | 149 | 155 | 157.5 | 152 | 160 | 153 | 131.5 | 137 |
| Min [cm] | 71 | 75 | 86 | 69 | 72 | 78 | 58 | 62 |
| Max [cm] | 230 | 259 | 272 | 244 | 249 | 264 | 243 | 250 |
| Q1 [cm] | 128 | 133 | 137 | 130 | 139 | 129 | 109 | 114.5 |
| Q3 [cm] | 172 | 179.25 | 184.25 | 178 | 181 | 174 | 154 | 162 |
| 5th Percentile [cm] |
101.8 | 109.35 | 106.9 | 91.4 | 105.7 | 108 | 83.55 | 87.85 |
| Standard deviation [cm] | 31.70582 | 32.27849 | 37.54677 | 41.273478 | 34.08997 | 33.70718 | 34.37792605 | 36.40330927 |
| Share <150 cm [%] | 50.3 | 45.3 | 40.2 | 44.4 | 38.9 | 45.3 | 72.1 | 61.2 |
| Share <125 cm [%] | 23.5 | 14.8 | 15.8 | 22.2 | 14.7 | 21.1 | 42.4 | 38.8 |
| Share <100 cm [%] | 4.6 | 4.7 | 3.8 | 11.1 | 4.2 | 2.1 | 14.5 | 14.3 |
Table 4.
Changes in total and cyclist-related traffic accidents before and after implementation by road segment.
Table 4.
Changes in total and cyclist-related traffic accidents before and after implementation by road segment.
| Segment ID | Time period (months) |
Period | Total accidents |
Δ Total [%] | Cyclist accidents |
Δ Cyclist [%] | Minor injuries |
Major injuries |
Most often cause | Most frequent accident type |
||
|---|---|---|---|---|---|---|---|---|---|---|---|---|
| No. | Cause | No. | Cause | |||||||||
| Seg. 1 | 64 | B | 23 | -30% | 5 | -100% | 9 | 2 | 6 | IS | 4 | RE, OTH, VR |
| A | 16 | 0 | 3 | 2 | 7 | VM | 4 | SC, SV | ||||
| Seg. 2 | 3 | B | 0 | - | 0 | - | 0 | 0 | - | - | - | - |
| A | 0 | 0 | 0 | 0 | - | - | - | - | ||||
| Seg. 3 | 31 | B | 10 | -30% | 0 | - | 4 | 0 | 8 | FY | 5 | SD |
| A | 7 | 0 | 3 | 0 | 4 | FY | 3 | SD | ||||
| Seg. 4 | 47 | B | 11 | -73% | 1 | 0% | 2 | 2 | 3 | ISD | 3 | RE, OTH, VR |
| A | 3 | 1 | 0 | 0 | 1 | FY, ISD, VM | 2 | SCR | ||||
| Seg. 5 | 38 | B | 10 | - | 2 | 50% | 3 | 1 | 3 | IS, FY | 5 | SD |
| A | 10 | 3 | 4 | 0 | 4 | IS, WD | 2 | SD, VR, SCR, SV | ||||
| Seg. 6 | 40 | B | 2 | -50% | 1 | -100% | 0 | 0 | 1 | FY, OTH | 1 | SD, HC |
| A | 1 | 0 | 0 | 0 | 1 | VM | 1 | SV | ||||
| Seg. 7 | 37 | B | 2 | 50% | 0 | 0% | 0 | 0 | 2 | OTH | 1 | OTH, AH |
| A | 3 | 0 | 1 | 0 | 1 | IS, WD, VM | 1 | SD, SCR, SV | ||||
| Moderate decrease | ||||||||||||
| Substantial decrease | ||||||||||||
| Large decrease | ||||||||||||
| Complete reduction | ||||||||||||
| Increase | ||||||||||||
B - before; A – after; IS – inappropriate speed; FY – failure to yield/disregard of right-of-way rules; WS – wrong-side driving; VM – vehicle maneuvers; ISD – insufficient safety distance; OTH – other causes; SD– side collision; HC – head-on collision; SCR – scraping collision; RE – rear-end collision; SV – collision with stationary/parked vehicle; AH – animal hit.
Table 5.
Changes in total and cyclist-related accidents before and after implementation on ABL and control segments.
Table 5.
Changes in total and cyclist-related accidents before and after implementation on ABL and control segments.
| Street | Number of all accidents |
Δ Total [%] |
Number of accidents involving cyclist |
Δ Total [%] |
|
|---|---|---|---|---|---|
| Segment 1 | Before | 23 | -30 | 5 | -100 |
| After | 16 | 0 | |||
| Segment 4 | Before | 11 | -73 | 1 | 0 |
| After | 3 | 1 | |||
| Control Segment 1 |
Before | 29 | -59 | 2 | -50 |
| After | 12 | 1 | |||
| Control Segment 4 |
Before | 54 | -50 | 5 | -80 |
| After | 27 | 1 |
Table 6.
Distribution of road accident causes and accident types before and after implementation.
| Cause of road accidents | Before | After | Trend [%] | |
|---|---|---|---|---|
| Inappropriate speed | 11 | 7 | -36 | |
| Failure to yield / Disregard of right-of-way rules | 14 | 6 | -57 | |
| Driving on the wrong side | 7 | 8 | 14 | |
| Vehicle maneuvers | 6 | 12 | 100 | |
| Improper overtaking | 2 | 0 | -100 | |
| Insufficient safety distance | 8 | 3 | -63 | |
| Pedestrian violations | 1 | 0 | -100 | |
| Road irregularities | 2 | 0 | -100 | |
| Cargo irregularities | 0 | 0 | 0 | |
| Other causes | 6 | 3 | -50 | |
| Vehicle irregularities | 0 | 0 | 0 | |
| Type of road accidents | ||||
| Other | 7 | 0 | -100 | |
| Side collision | 14 | 10 | -29 | |
| Vehicle rollover | 8 | 2 | -75 | |
| Head-on collision | 6 | 1 | -83 | |
| Scraping collision | 1 | 8 | 700 | |
| Collision with an object | 4 | 4 | 0 | |
| Rear-end collision | 8 | 4 | -50 | |
| Collision with a stationary/parked vehicle | 6 | 7 | 17 | |
| Pedestrian hit | 2 | 2 | 0 | |
| Animal hit | 1 | 1 | 0 | |
Disclaimer/Publisher’s Note: The statements, opinions and data contained in all publications are solely those of the individual author(s) and contributor(s) and not of MDPI and/or the editor(s). MDPI and/or the editor(s) disclaim responsibility for any injury to people or property resulting from any ideas, methods, instructions or products referred to in the content. |
© 2026 by the authors. Licensee MDPI, Basel, Switzerland. This article is an open access article distributed under the terms and conditions of the Creative Commons Attribution (CC BY) license (http://creativecommons.org/licenses/by/4.0/).
Copyright: This open access article is published under a Creative Commons CC BY 4.0 license, which permit the free download, distribution, and reuse, provided that the author and preprint are cited in any reuse.