
Submitted:
23 July 2026
Posted:
24 July 2026
You are already at the latest version
Abstract
Marine Spatial Planning (MSP) is a key instrument for advancing sustainable ocean governance in Europe, yet the spatial distribution of socioeconomic benefits and trade-offs remains poorly understood. This study addresses this gap by applying and extending the Spatial Economic Benefit Analysis (SEBA) framework to evaluate the socioeconomic footprint of offshore wind energy and capture fisheries in France, with a focus on the North Atlantic–Western Channel (NAMO) region. Methodologically, a mixed-methods approach is used, integrating publicly available data, industry disclosures, and spatial analysis to produce regional-scale economic maps of employment, firm participation, infrastructure, and financial performance. The study also presents an interactive, updatable visualization platform that enhances SEBA, by enabling continuous data integration and dynamic exploration, strengthening its relevance for public policy and stakeholder engagement. Results show that offshore wind energy generates spatially concentrated yet internationally distributed economic benefits, characterized by transnational value chains and uneven regional participation. In contrast, fisheries exhibit highly localized benefits but increasing structural vulnerability, reflected in fleet decline, employment contraction, and financial dependence. These findings reveal a persistent asymmetry in benefit distribution within MSP, with implications for spatial equity and sectoral inclusion. By advancing SEBA as a scalable and decision-support tool, this research aims to contribute to a more transparent, data-driven MSP and to support the transition toward a more inclusive and sustainable blue economy.
Keywords:
capture fisheries
; marine spatial planning
; offshore wind energy
; maritime governance
; spatial economic benefit analysis
; spatial visualization
; socioeconomic impacts
; spatial equity
1. Introduction
Marine Spatial Planning (MSP) constitutes a comprehensive ecosystem-based governance framework aimed at organizing the spatial and temporal allocation of marine resources and activities to ensure environmental sustainability and socio-economic equity [1,2,3]). MSP is embedded within European legislative frameworks, notably the Water Framework Directive (2000/60/EC), Marine Strategy Framework Directive (2008/56/EC), and Maritime Spatial Planning Directive (2014/89/EU), which collectively mandate integrated maritime governance balancing ecological integrity, economic development, and social considerations [2,4,5,6]. A defining feature of MSP is its participatory methodology, which incorporates diverse stakeholder knowledge from governmental bodies and industry actors to coastal communities and NGOs, thus enhancing both technical robustness and social legitimacy [7,8,9].
Technological advancements in geospatial analysis, remote sensing, and data visualization have markedly improved MSP’s capacity to assess spatial trends, cumulative environmental impacts, and future-use scenarios [10]. Although Spatial Economic Benefit Analysis (SEBA) has demonstrated utility in Baltic MSP contexts, no study has operationalized it for simultaneous dual-sector comparison (offshore wind vs. fisheries) in data-scarce environments lacking centralized marine economic databases. This methodological gap prevents French planners from conducting equity-conscious spatial gap analyses (i.e., a gap that prevents distributive equity assessments defined as evaluating whether economic benefits accrue proportionally to communities bearing environmental burdens because planners lack data showing where sectoral benefits concentrate relative to impact zones) [11,12]. Prior SEBA applications, for example, Schultz-Zehden et al. [13] focused on single sectors such as shipping, aquaculture, etc. at the national scale.
The normative framework of MSP increasingly foregrounds social justice principles, emphasizing the recognition, representation, and equitable distribution of marine benefits and burdens [14]. This shift aligns with the United Nations Sustainable Development Goals (SDGs), particularly SDG 14 (“Life Below Water”), which focuses on the conservation and sustainable use of oceans, seas, and marine resources, in conjunction with broader goals for sustainable development. Despite the EU-wide requirement for maritime spatial plans by 2021, implementation has varied significantly across Member States, shaped by governance structures, regional conditions, and political priorities, with implications for policy integration and effectiveness [15].
The accelerating expansion of offshore renewable energy (ORE), particularly offshore wind, alongside traditional maritime sectors such as fisheries, shipping, and tourism, intensifies spatial competition and necessitates enhanced cross-sectoral coordination and governance integration [16,17]. MSP facilitates this transition by providing spatial clarity, legal certainty, platforms for stakeholder dialogue, streamlining decision-making, and mitigating user conflicts [18]. Empirical examples from Germany, the Netherlands, and the United Kingdom demonstrate the MSP’s role in enabling rapid offshore wind deployment while balancing marine conservation objectives [19]. Nonetheless, economic assessments of the MSP’s impact on regional development and the blue economy remain underdeveloped, underscoring the need for improved socioeconomic evaluation frameworks [20].
Effective MSP integration relies on the deliberate selection and strategic application of planning and decision support tools (DSTs) tailored to specific objectives, institutional capacities, data availability, and stakeholder contexts [21,22]. These tools range from problem-focused spatial analyses, such as Marxan and SEBA, to process-oriented instruments that foster stakeholder engagement and knowledge co-production [23,24]. SEBA addresses socio-economic integration gaps by spatially mapping economic beneficiaries across marine sectors and supporting multidimensional integration encompassing knowledge, stakeholder, policy, land-sea, and transboundary considerations [13]. Its application to offshore wind and fisheries in France revealed spatial economic patterns that are essential for an inclusive, data-driven MSP.
France’s MSP framework, operationalized through Documents Stratégiques de Façade (DSF), mandates ecosystem-based planning across four maritime regions [25]. The 2022–2027 cycle prioritizes offshore wind expansion (target: 18 GW by 2035) while maintaining fishery access; however, socioeconomic trade-off analyses remain underdeveloped. MSP facilitates spatial coordination by delineating priority zones for offshore wind deployment, informed by scientific assessments and stakeholder consultations, thereby reducing conflicts with fisheries and protected areas. The integration of stakeholder engagement and regulatory streamlining aims to accelerate offshore wind projects while addressing the spatial constraints and socio-economic challenges of fisheries.
The French fisheries sector, integral to coastal livelihoods and cultural heritage, faces mounting pressure from spatial competition, environmental stressors, and socioeconomic challenges [26,27,28]. The French Documents Stratégiques de Façade (DSF) for 2022–2027 prioritize ecological and technical criteria but provide no spatially disaggregated employment or firm participation data for sectoral trade-off analysis [25]. This gap renders the localized economic contributions of fisheries invisible during offshore wind zoning decisions. MSP’s role in fisheries governance is critical for safeguarding access rights, promoting equitable spatial coexistence, and integrating socio-economic valuation beyond traditional catch metrics [29]. The SEBA tool’s capacity to spatially represent fisheries’ economic contributions supports more balanced zoning scenarios and inclusive stakeholder participation, mitigating displacement risks, and fostering coexistence with emerging sectors.
This study employs the SEBA methodology to analyze the spatial economic dynamics of offshore wind and fisheries in France’s North Atlantic-Western Channel region. By producing spatially explicit economic maps, it is intended to elucidate the distribution of economic activities, employment, and firm participation, thereby advancing equitable and sustainable marine governance. The findings demonstrate SEBA’s potential to enhance MSP’s socio-economic integration of MSP, enabling planners to visualize trade-offs, engage stakeholders transparently, and align policies with regional development objectives.
2. Methodology
This study employs a mixed-method approach grounded in the SEBA framework to comprehensively evaluate the socio-economic dimensions of MSP in France, with a particular focus on the North Atlantic Western Channel (NAMO) façade. Originally developed within the BONUS BaltSpace project [13], the SEBA addresses integration challenges in MSP by providing a spatialized representation of economic benefits, stakeholder linkages, and value chains. This study adapts and operationalizes the SEBA to simultaneously analyze two key marine sectors, offshore wind energy and capture fisheries, at both national and regional scales, thereby bridging the gap between ecological spatial data and socio-economic datasets that are often aggregated, non-spatial, or decontextualized.
The SEBA framework follows a structured six-step process: (1) sector analysis, (2) brainstorming, (3) data collection, (4) database development, (5) spatial mapping, and (6) map interpretation. This methodology facilitates an assessment of where and for whom socioeconomic benefits are generated, which is a prerequisite for achieving spatial equity and fostering informed stakeholder dialogue in MSP.
2.1. Sectoral Scope and Analytical Framework
The analysis focused on two sectors: offshore wind energy and capture fisheries. Each sector approached with distinct, yet complementary methods adapted to the SEBA framework.
2.1.1. Offshore Wind Sector
The offshore wind sector analysis comprises two complementary layers addressing distinct scalar questions: (1) Project-level mapping (Saint-Brieuc, Saint-Nazaire, and Yeu-Noirmoutier) reveals how benefits are distributed within developments, local content integration, subcontractor participation, and transnational dependencies, informing project-specific equity audits. (2) National-level mapping (all French offshore wind firms) reveals where ecosystems cluster (Île-de-France headquarters vs. Normandy ports), thereby informing regional policy. This scalar integration is a methodological innovation: prior SEBA studies [13] analyzed single scales, missing nested equity patterns in their analyses.
The offshore wind sector analysis comprises two complementary layers.
- Wind Farm-Specific Enterprise Mapping: This layer targets three major offshore wind projects in the NAMO region: Yeu-Noirmoutier, Saint-Nazaire, and Saint-Brieuc. Firm-level data were collected for each project, categorizing enterprises by nationality and functional role (e.g., developers, EPC contractors, OEMs, consultants, logistics providers). Spatial maps were generated to visualize the distribution of these firms, highlighting transboundary economic linkages, power asymmetries, and the extent of local content integration, defined as the proportion of project employment (FTEs) and contract value accruing to firms within 100 km of turbine sites (following [30]) within project-level planning.
- National/Regional Offshore Wind Ecosystem Mapping: A broader dataset was compiled to map all local enterprises involved in offshore wind across France, classified into eleven functional categories along the value chain, including developers, OEMs, component suppliers, consultants, EPC contractors, O&M service providers, marine logistics, financial institutions, institutional actors, research/training institutes, and tertiary services. Firms active in multiple roles (n=47, 4.5% of dataset) were assigned a dominant category using the following hierarchy: (1) self-reported primary activity in corporate registries (SIRENE database), (2) revenue share if disclosed (≥60% threshold), or (3) majority employee allocation per company profiles. Discrepancies were resolved via consensus review of annual reports. The spatial distribution of these firms was visualized at the regional scale to assess geographic clustering, local content integration, and economic spillovers.
2.1.2. Fisheries Sector
The fisheries sector was analyzed through a multi-dimensional spatial approach that diverges from traditional bioeconomic models. Instead of focusing solely on biomass or catch-effort ratios, this study treats fisheries as a socially embedded, spatially distributed system emphasizing structural vulnerability, market dependencies, and employment dynamics. Key parameters included:
- Regional quantity and economic value of fish landings (2023)
- Temporal changes in fleet structure (2000–2023), focusing on the decline of small-scale vessels
- Financial performance indicators (net profit, gross margin, value-added) from 2016 to 2022
- Employment distribution shifts (2012–2022)
- Spatial distribution of active auction centers (criées)
These indicators were spatially mapped and interpreted to assess economic footprints, infrastructural dependencies, and regional disparities within the fisheries sector, thereby capturing socio-economic legitimacy considerations relevant to MSP.
2.2. Focus Area and Spatial Scale
The study operates primarily at the regional scale, aligning with the French Documents Stratégiques de Façade (DSF) planning framework, which implements the MSP Directive (2014/89/EU). The NAMO region, comprising the coastal departments of Pays de la Loire, Brittany, and Normandy, was selected for the focused application of SEBA because of the spatial overlap between offshore wind developments and traditional fishing activities.
The regional scale was chosen over finer spatial units (e.g., two-digit postal codes) for methodological consistency (regional aggregation was necessary because 73% of fisheries employment data [26] and 65% of offshore wind firm addresses (corporate registries) are reported only at the regional (NUTS-2) level; finer scales would require imputation, introducing >40% uncertainty. Regional units also align with DSF planning boundaries, enabling direct policy application) and data availability, facilitating comparative analysis across sectors, and enabling the detection of intra-national disparities, potential conflict zones, and coexistence opportunities. This scale also aligns with policy frameworks, ensuring that the findings are directly relevant to planning authorities.
2.3. Data Sources and Collection Protocols
Given the absence of a centralized socioeconomic marine data repository in France, this study adopted a multisource, mixed-method data acquisition strategy. Data collection covered both quantitative indicators (e.g., installed capacity, employment, landings) and qualitative descriptors (e.g., firm roles, regional participation), with an explicit focus on transparency, traceability, and policy relevance. Data were cross-verified wherever possible; however, approximately 30% of firm-level entries relied on single sources (corporate websites, EIA annexes) without independent confirmation. Subcontractor lists, particularly for Yeu–Noirmoutier, are likely to underrepresent informal or short-term contractors. These gaps introduce uncertainty into firm participation maps, potentially overstating organized supply chain actors and understating small, local firms. French-language documents were translated into English using DeepL Translate to enhance accessibility.
2.3.1. Offshore Wind Sector Data
Offshore wind data collection focused on three core dimensions: spatial project footprints, industrial value chain composition, and regional economic participation. Key parameters included installed and planned capacity, project phase, technical specifications, stakeholder roles, firm-level characteristics (type, ownership, geography), and regional employment metrics.
Primary data sources included France Énergies Marines, RTE, Ministère de la Transition Écologique, WindEurope, 4C Offshore, regional port authorities, corporate reports (e.g., EDF, Siemens Gamesa), public Environmental Impact Assessments, and industry directories. Where direct firm-level data were unavailable, we inferred missing information from credible reports, procurement records, and public consultation summaries. Data were processed in Python (Cursor platform) for cleaning and structuring and visualized using Tableau Public.
2.3.2. Fisheries Sector Data
Fisheries data covered both economic structure and spatial dynamics, including landings quantity and value by port, fleet size and typology, auction center activity, employment patterns, and financial viability metrics. Primary sources comprised FranceAgriMer, IFREMER, Ministère de la Mer, CRPMEM, EMFF/EMFAF financial reports, port-specific auction data, and STECF datasets. Geolocation was based on port identifiers, auction center coordinates, and vessel registries to assess community dependence and spatial overlaps with offshore wind zones. Structural vulnerability was contextualized using indicators such as vessel decline, shifts towards part-time operation, and reliance on subsidies.
Data acquisition followed sector-specific protocols to accommodate asymmetric reporting granularity. For offshore wind, firm-level data were compiled from corporate registries (SIRENE), Environmental Impact Assessments (Saint-Brieuc, Saint-Nazaire, Yeu–Noirmoutier), industry directories (4C Offshore, WindEurope), and operator disclosures (EDF, EMYN). Where gaps occurred (e.g., incomplete subcontractor lists for 6 of 9 offshore wind projects), we prioritized operator-issued reports and systematically flagged unverified entries (see Section 2, Data Limitations). For fisheries, fleet and economic data were sourced from FranceAgriMer (annual reports 2012–2023) [31], IFREMER (SIH database) [32], and regional fisheries committees (CRPMEM).
2.4. Data Processing and Spatial Visualization
Data cleaning, structuring, and integration were conducted using Microsoft Excel and Python (pandas library), covering SEBA steps 4 to 6 (database development, spatial mapping, and interpretation). Offshore wind data underwent project-level firm mapping, national value chain categorization, and a subcontractor-specific case study for Yeu-Noirmoutier, leveraging rare operator disclosures to analyze local content development.
Spatial visualizations were produced using Tableau Public 2023.3 (free license) with custom NUTS-2 shapefiles (Eurostat, 2023). Firm addresses were geocoded via Nominatim API (OpenStreetMap); ambiguous matches (4.7%; n=22) were manually verified against corporate registries. Dashboards use 2-digit postal code aggregation (median spatial resolution: 1,200 km²). Interactive files and source data - enabling interactive exploration of national firm distributions, project-specific footprints, and subcontractor networks. This open-access approach enhances transparency, reproducibility, and stakeholder engagement compared to prior SEBA implementations relying on proprietary GIS software.
Fisheries sector outputs similarly employed Tableau to visualize auction center distributions, fleet changes, employment shifts, and financial stress markers, producing spatially explicit indicators of socio-economic vulnerability relative to offshore wind developments.
2.5. Mixed-Method Justification
The integration of quantitative spatial economic mapping with qualitative interpretation of sectoral dynamics addresses the limitations of conventional economic assessments that lack spatial resolution and stakeholder specificity. The dual-scale application of SEBA (project-specific and regional) accommodates fragmented and unevenly reported economic data, enabling multi-layered analysis of participation, value distribution, and conflict potential. This mixed-methods design addresses three limitations of prior SEBA applications [13]: (1) single-sector focus (we compare offshore wind vs. fisheries), (2) static GIS outputs (we enable dynamic filtering via Tableau Public), and (3) national-only scales (we nest project-level firm mapping within regional analyses). Quantitative spatial mapping reveals where benefits concentrate;
Formal expert interviews were not conducted due to project timeline constraints. This limits validation of interpretive claims (e.g., stakeholder perceptions of spatial equity) but does not affect factual firm participation mapping, which relies on publicly verifiable registries. Future work should integrate participatory workshops to co-interpret SEBA outputs with affected communities. The study utilized a structured review of diverse secondary sources, including policy documents, corporate disclosures, and workshop proceedings which includes systematically reviewed 47 documents (12 EIAs, 18 corporate annual reports, 9 regional economic impact studies, 8 MSP consultation summaries) published 2015–2023, identified via keyword search (‘firm participation,’ ‘local content,’ ‘subcontractor’) in French government databases and industry repositories.
Conflicting data (e.g., differing subcontractor counts) were resolved by prioritizing operator-issued reports; unresolved conflicts are noted in results. This approach prioritizes transparency and reproducibility but limits stakeholder validation of findings.
The SEBA framework was selected over alternatives such as input-output modeling (which lacks spatial resolution) and cumulative impact assessment (which prioritizes environmental over socioeconomic dimensions). SEBA’s strengths include spatial explicitness, multi-sector comparability, and accessibility to non-technical stakeholders. However, it provides static snapshots rather than dynamic projections, which is a limitation addressed in the discussion.
3. Results
3.1. Fisheries
3.1.1. Fisheries Regional Fish Landings and Revenue (2023)
The spatial distribution of fresh and frozen fish landings and their associated revenues across France in 2023 reveal pronounced regional disparities. Atlantic coastal regions overwhelmingly dominate both catch volume and economic returns (Figure 1).
Brittany stands out as the leading region, with approximately 71,071 tons of fish landed and generating €265 million in revenue, representing the largest share nationally. This dominance reflects Brittany’s longstanding significance in both industrial and artisanal fisheries, supported by dense coastal infrastructure, including multiple auction centers and active fishing fleets, as elaborated in subsequent sections. Normandy follows with 30,969 tons landed and €94 million in revenue. The Pays de la Loire and Nouvelle-Aquitaine regions recorded nearly identical landings of 14,101 and 14,165 tons respectively, yet their revenues differ slightly (€83 million and €81 million), suggesting variations in species composition or market integration strategies, potentially favoring higher-value species in Pays de la Loire.
Conversely, southern regions such as Occitanie (7,081 tons, €40 million) and Provence-Alpes-Côte d’Azur (PACA) (1,009 tons, €6 million) play a marginal role in national fisheries production. These lower figures are likely to result from a combination of ecological constraints, smaller fleet sizes, reduced productivity, and spatial competition from tourism and conservation efforts along the Mediterranean coastline.
The concentration of 82% of national landings in three Atlantic regions (Brittany, Normandy, Pays de la Loire; Figure 1) coincides spatially with 67% of planned offshore wind capacity. This overlap absent in Mediterranean regions generates region-specific trade-offs (fisheries access vs. renewable energy zones) that national MSP frameworks [25] do not spatially disaggregate. Region-specific strategies are therefore necessary to prevent disproportionate burden-shifting onto Atlantic communities. From a SEBA perspective, these uneven spatial patterns highlight the importance of integrating ecological productivity with socio-economic factors to design equitable spatial policies that ensure balanced regional benefits.
3.1.2. Employment Distribution (2012–2022)
Employment data for fishermen in 2022 provide critical insights into the spatial dynamics and structural transformations within the French fisheries sector (Figure 2). Mainland France employed 9,162 full-time equivalents (FTEs) in 2022 marking a 9.5% decline from 10,126 FTEs in 2012 (964 FTEs lost; compound annual decline rate of 1.0% (calculated as [(9,162 / 10,126)^(1/10) - 1] × 100), indicating persistent year-over-year workforce erosion rather than a one-time shock (Figure 3).
The Bay of Biscay zone accounted for the highest employment with 2,978 fishermen, followed by the Celtic Sea and West of Scotland (2,585), the Eastern Channel and North Sea (1,807), and the Mediterranean (1,792). This spatial employment distribution closely mirrors patterns observed in fish landings and revenue, reinforcing the correlation between regional production capacity and job retention.
The overall employment decline is attributable to multiple factors including aging workforce demographics, fleet downsizing, diminished profitability, policy-driven access restrictions, and market volatility. Brittany’s status as a socio-economic fisheries hub is reaffirmed by its substantial revenue generation (€265 million), whereas regions such as Occitanie and PACA maintain minimal employment footprints due to lower biological productivity and fewer active ports.
Additionally, evidence points to fleet modernization, rising fuel costs, and shifts toward part-time or seasonal fishing models as contributing to the erosion of traditional full-time employment, particularly in marginal regions. Within the MSP context, these spatial employment disparities necessitate tailored socio-economic safeguards. Regions with high dependency on fisheries, especially along the Atlantic façade, face heightened vulnerability from spatial reallocations such as offshore wind farm development or marine protected areas (MPAs). Incorporating employment data into SEBA mapping enhances MSP’s capacity to identify socio-economically vulnerable zones, thereby facilitating balanced negotiations between industrial offshore expansion and fisheries sustainability.
3.1.3. Structural Infrastructure and Fleet Evolution (2000–2023)
Between 2000 and 2023, the French fishing sector experienced a significant contraction in both structural infrastructure and fleet size, trends with major implications for socio-economic resilience and marine spatial planning. The total number of vessels declined by approximately 29%, from 8,118 in 2000 to 5,734 in 2023, with the most pronounced reduction occurring in the small-scale fleet (under 12 meters), which decreased from 6,613 to 5,190 vessels (Figure 4). This decline indicates a gradual erosion of artisanal and coastal fisheries, especially in less industrialized or lower-yield regions. Contributing factors include modernization incentives, aging fleet demographics, rising operational costs (notably fuel and maintenance), and increasingly stringent regulatory frameworks such as quota reductions and access limitations. Additionally, low generational renewal and shifting market preferences have further exacerbated this trend.
The spatial distribution of France’s 34 active fishing auction centers (Figure 5) reveals a disproportionate concentration in Atlantic regions, predominantly Brittany and Normandy, while the Mediterranean and southern Atlantic coasts exhibit limited infrastructure density. These patterns bear significant relevance for spatial demand dynamics: concentrated activity in fewer regions may intensify localized spatial pressures on marine ecosystems, while simultaneously releasing capacity in other areas. Consequently, marine spatial planners must integrate fleet and infrastructure trajectories into decision-making processes to ensure equitable benefit distribution and sustainable regional development, particularly as offshore wind energy expansion intensifies spatial competition.
3.1.4. Economic Performance and Financial Dependency (2016–2022)
The economic performance of the French mainland fishing fleet, evaluated through Gross Value Added (GVA), Gross Margin, and Net Profit, reveals a decline in financial viability despite sustained production levels. Between 2016 and 2018, GVA remained relatively stable at over €850 million, with net profits peaking above €140 million in 2017. However, from 2019 onwards, net profits consistently turned negative, enduring persistent losses through 2022, while GVA fluctuated between €700 million and €800 million (Figure 6). Notably, net profit figures exclude direct income subsidies, implying that actual financial losses may be more severe without public support. These data indicate that although fishing operations continue to generate market revenues (reflected in positive gross margins), the sector fails to cover total costs when accounting for depreciation, capital opportunity costs, and other fixed expenditures.
This structural unprofitability renders the sector heavily reliant on state and European Union financial support mechanisms, such as the European Maritime and Fisheries Fund (EMFF). The sector’s dependence on subsidies underscores its economic fragility, suggesting that many fishing enterprises, particularly small- and medium-scale operators, would become economically non-viable without ongoing public funding [33]. From a marine spatial planning standpoint, this financial dependency raises critical concerns regarding long-term sustainability and resilience. Spatial policies that restrict access to productive fishing areas whether through environmental zoning, offshore infrastructure development, or conservation measures must carefully consider the sector’s fragile economic baseline. Accordingly, SEBA frameworks should incorporate economic vulnerability assessments to identify regions and fleets most at risk under potential subsidy restructuring or withdrawal, thereby informing more balanced and sustainable spatial governance.
3.2. Offshore Wind Sector Development and Regional Industrial Integration in France
3.2.1. National Offshore Wind Development Trajectory and Energy Transition Targets
The development of offshore wind farms within France’s Exclusive Economic Zone (EEZ) reflects a strategic alignment with the country’s broader energy transition objectives. Figure 7 provides a comprehensive overview of all offshore wind projects, categorized by their stages of development from public debate and tendering phases to operational status-while distinguishing fixed-bottom and floating technologies and illustrating regional disparities in project maturity. Figure 8 provides additional details.
Energy Capacity Targets: Cumulative but Clustered Progress
Analysis of cumulative energy capacity targets, derived from practical tendering timelines (Figure 9), reveals an accelerated yet uneven trajectory in offshore wind deployment. By the end of 2022, operational capacity was limited to 480 MW, despite initial tender rounds commencing in 2011. This slow start is attributable to permitting delays, regulatory complexities, and early technological dependence on external suppliers.
Projections indicate a sharp increase in capacity additions post-2024, with forecasted cumulative capacities of 1,474 MW by 2024, 2,914 MW by 2025, 3,260 MW by 2030, 4,310 MW by 2031, and reaching between 8,200 and 8,760 MW by 2034. This accelerated trajectory underscores intensified governmental commitment and improved tendering processes, driven by policy imperatives to meet decarbonization targets. However, these projections are contingent upon timely construction, maturation of local value chains, supply chain stability, and grid interconnection capacity-factors susceptible to geopolitical and economic disruptions.
Deployment Status of Offshore Wind Farms: Spatial and Temporal Delays
Despite early tender issuance dating back to 2011-2012 for projects such as Saint-Brieuc, Saint-Nazaire, and Fécamp, operationalization has experienced significant delays. For instance, the Saint-Nazaire project only achieved commissioning in 2022. Current operational capacity between 2022 and 2024 is concentrated in a limited number of sites: Saint-Nazaire (2022), Fécamp (2024), and Saint-Brieuc (2024), with Courseulles-sur-Mer expected by late 2025. Mid-term commissioning (2025–2028) encompasses Dunkerque, Dieppe-Le Tréport, and Îles d’Yeu & Noirmoutier.
Post-2030 deployments primarily involve floating wind farms (e.g., Golfe du Lion, Bretagne Sud), which remain in pilot or pre-commercial stages. These findings highlight a structural lag between tendering and deployment, particularly for fixed-bottom technology, while floating wind projects face additional delays due to technological complexity and infrastructure demands, raising concerns about their contribution toward the 2035 national targets.
3.2.2. National Composition of Firms Involved in Major French Offshore Wind Farms: Out-Sourcing Versus Domestic Dominance in the Value Chain
To evaluate industrial sovereignty and value retention, firm participation across three major offshore wind projects-Saint-Brieuc, Saint-Nazaire, and Yeu-Noirmoutier-was analyzed by country of origin, revealing varying degrees of domestic anchoring and international outsourcing.
Saint-Brieuc Wind Farm: Balanced Leadership with International Anchoring
The Saint-Brieuc offshore wind farm (496 MW) exemplifies a hybrid industrial model characterized by collaborative yet externally weighted supply chains (Figure 10). Ailes Marines, a subsidiary of the Spanish firm Iberdrola, serves as the project owner. Key international contributors include Siemens Gamesa Renewable Energy (Spain) supplying turbines; Atkins (UK) and LICengineering A/S (Denmark) providing foundation design; BAUER Renewables Ltd. (UK) and Nervión Industries (Spain) managing foundations and piling; Prysmian (Italy) and Nexans (France) delivering subsea cables; Hitachi Energy (Switzerland) and GE Grid Solutions (France) supplying substation electrical infrastructure; and Van Oord (Netherlands) conducting marine operations. French entities such as RTE handle grid connection, while IFREMER and IN VIVO Environment undertake environmental impact assessments.
The project also engages a broad network of European consultants and port authorities, illustrating the Europeanized nature of offshore wind supply chains. While France contributes significantly to coordination, ports, grid infrastructure, and environmental expertise, high-value components (turbines, foundations, installation vessels) are predominantly sourced internationally. This integration raises critical policy concerns. Industrial economics literature shows countries with <50% domestic value capture in renewable energy supply chains experience 30–40% lower long-term GDP multipliers [34]. French offshore wind exhibits 35% domestic turbine manufacturing (vs. 65% imports; Figure 10) –below the 50% resilience threshold identified in EU energy security assessments [35] –signaling vulnerability to supply chain disruptions. Quantifying value leakage via input-output modeling is a priority for future research.
Saint-Nazaire Wind Farm: National Anchoring with Strategic International Collaborations
The Saint-Nazaire offshore wind farm (480 MW), France’s first commissioned offshore project, demonstrates strong French industrial anchoring combined with strategic international partnerships (Figure 11). The project owner, Eolien Maritime France (a joint venture of EDF Renewables and EIH SARL), is headquartered in Île-de-France, reflecting state-aligned leadership. French firms contribute notably through RTE (electricity transmission), Eiffage Métal (monopile foundations), SPIE and SPIE Grid Services (substation maintenance and turbine testing), and various port authorities and operational bases.
Complementing this domestic base, international firms such as General Electric Renewable Energy (France/US), Enbridge Inc. (Canada), Global Wind Service (Denmark), DEME Offshore (Belgium), Hitachi Energy (Switzerland), and Prysmian Group (Italy) provide specialized manufacturing, installation, and environmental services. The Pays de la Loire region anchors manufacturing and O&M activities, while advanced offshore engineering and cable systems are sourced from the Netherlands, Denmark, Germany, and the UK. This semi-sovereign industrial configuration illustrates France’s evolving capacity to lead offshore wind infrastructure, albeit with continued reliance on international expertise for high-value components.
Yeu and Noirmoutier Wind Farm: Complex European Integration with Scattered Domestic Anchoring
The Yeu and Noirmoutier offshore wind farm (496 MW), led by EMYN and headquartered in Nantes, epitomizes complex European integration with fragmented domestic industrial participation (Figure 12). French firms such as RTE (design and operation of submarine and land cables), Artelia (electrical connection management), Sodraco International SAS (turbine installation), Atlantique Offshore Energy (substation manufacturing), and several port authorities contribute to project execution.
However, core manufacturing and engineering tasks-particularly turbines, foundations, and substation systems-are heavily internationalized. Key foreign suppliers include Siemens Gamesa Renewable Energy (Spain), Prysmian Group (Italy), Haizea Wind Group (Spain), DEME NV (Belgium), and Dajin Heavy Industry Corporation (China). The involvement of non-EU actors, notably from China, introduces strategic considerations regarding industrial autonomy and supply chain dependencies. While local subcontracting efforts have been made, including over 140 contracts with regional firms as documented in a directory showcasing approximately 100 local companies (Figure 13), high-value manufacturing and engineering remain largely foreign-led. This dynamic poses challenges for France’s long-term industrial competitiveness and domestic innovation in offshore wind.
3.2.3. Regional Participation of Local Firms in the Offshore Wind Industry: A Sectoral Ecosystem Perspective
A spatially resolved inventory of local firms involved in offshore wind development reveals differentiated regional engagement across project development, manufacturing, logistics, consulting, education, and institutional support (Figure 14, Figure 15 and Figure 16).
Dominant Hubs: Brittany, Pays De La Loire, and Occitanie
Brittany and Pays de la Loire emerge as principal hubs with substantial industrial capability and technical specialization. Each region hosts 77 technical and environmental consultancy firms and 71 Original Equipment Manufacturer (OEM) firms, alongside strong participation in operations and maintenance (O&M), component supply, and tertiary services (e.g., 19 firms in Brittany). Brittany and Pays de la Loire collectively account for 261 and 222 firms respectively, making them the most engaged regions nationally. Occitanie ranks fourth with 166 firms, particularly strong in research, education, training, and technical consultancy, indicating a mature offshore wind economy with a focus on knowledge-based services and logistics.
Role-Specific Regional Specialization
Role-specific clusters are evident: Normandy specializes in project development, marine and logistics services, institutional actors, and tertiary services, reflecting its proximity to major offshore zones and regulatory functions. Île-de-France, despite being landlocked, exhibits significant activity in component manufacturing and project development, likely due to corporate headquarters, engineering design, and finance roles. Provence-Alpes-Côte d’Azur (PACA) demonstrates diversified industrial activity across component manufacturing, EPC contracting, and O&M, indicative of a transition from conventional maritime sectors to renewables.
Underrepresented Regions and Gaps in Participation
Inland and less industrialized regions such as Grand Est, Centre-Val de Loire, and Bourgogne-Franche-Comté show minimal offshore wind sector involvement, attributed to geographic constraints and lack of policy incentives. These areas represent untapped potential, especially for non-coastal manufacturing and technical services. Notably, local financial institutions and investors are sparsely represented, with a maximum of five firms in Normandy, indicating a centralized financing model that may limit local value retention and reinvestment. Tertiary services are also underdeveloped outside key regions, potentially constraining project administration and stakeholder engagement capacities.
Implications for Local Economies and Regional Development
The spatial distribution of firms underscores offshore wind as both an energy transition tool and a catalyst for regional economic development. Regions with dense, diverse ecosystems-Brittany, Pays de la Loire, Normandy are positioned to realize benefits including job creation, industrial diversification, revenue retention, skills development, and institutional strengthening. The presence of tertiary services and institutional actors enhances regional resilience by extending value creation beyond physical construction to permitting, compliance, communication, and innovation. Conversely, disparities in firm distribution risk exacerbating spatial inequalities absent targeted policy interventions.
Strategic Insight Into Maritime Spatial Planning and Policy
Marine Spatial Planning (MSP) frameworks must integrate economic geography and industrial capacity to safeguard socioeconomic benefits. The multi-dimensional mapping presented here identifies mature industrial zones requiring marine access and infrastructure, regions needing targeted support, opportunities for cross-regional collaboration linking inland and coastal economies, and guidance for directing regional development funding. A spatially explicit, sectorally diverse understanding of the offshore wind industry is essential for crafting inclusive, sustainable maritime policies that simultaneously advance climate and economic objectives.
3.2.4. Employment Growth and Regional Labor Distribution in the French Offshore Wind Sector
National Employment Growth: Accelerating Workforce Expansion
From 2019 to 2023, full-time equivalent (FTE) employment in the French offshore wind sector nearly tripled, rising from 2,690 to 7,840 FTEs (Figure 17). A 73% surge between 2019 and 2020 reflects increased project approvals, early-stage construction, and port-based manufacturing. Sustained annual growth of approximately 12% in 2022 and 2023 indicates maturation of supply chains and stable long-term employment beyond initial project surges, aligning with scaling deployment and national energy targets.
Regional Distribution of Employment: Coastal Concentration and Industrial Clustering
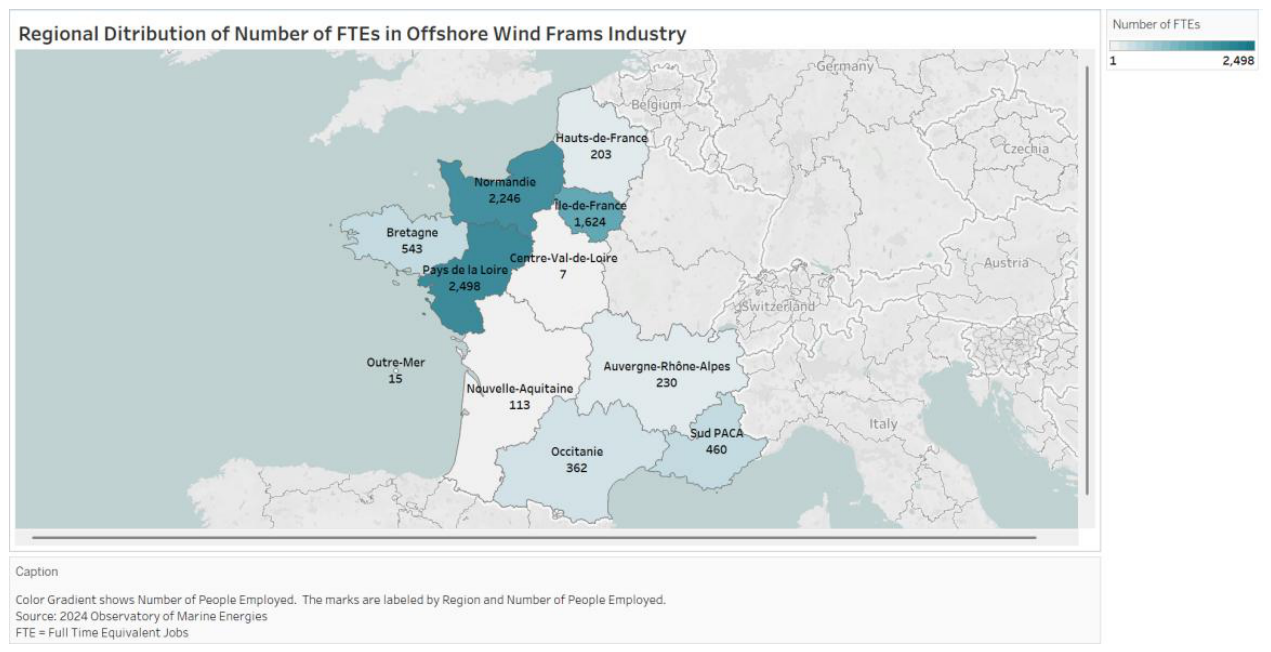
Employment is geographically concentrated in coastal and industrialized regions (Figure 18). Pays de la Loire leads with 2,498 FTEs, driven by manufacturing, port logistics, and offshore infrastructure deployment. Normandy follows closely with 2,264 FTEs, reflecting its role as a logistics and coordination hub. Île-de-France accounts for 1,624 FTEs, despite being inland, likely due to corporate headquarters, engineering, finance, and project management roles. Brittany (543 FTEs) and Sud PACA (460 FTEs) contribute substantively, the former through component manufacturing and the latter through supplier networks. Conversely, regions such as Centre-Val de Loire, Nouvelle-Aquitaine, and Auvergne-Rhône-Alpes show minimal engagement, mirroring earlier findings on firm participation and signaling spatial disparities in workforce opportunities.
Strategic Interpretation: Labor as a Development Indicator
Employment growth outpaces project commissioning, indicating job creation precedes deployment, particularly in manufacturing, planning, and installation preparation. This supports offshore wind’s role as a proactive economic stimulus. Regional employment disparities align with firm distribution, emphasizing dependency on local industrial ecosystems. The significant employment share in Île-de-France highlights the critical role of non-coastal regions in governance, R&D, and finance, often underrepresented in blue economy narratives. Policymakers must balance clustering efficiencies with inclusive workforce development to prevent exacerbation of interregional inequalities, especially as floating wind expands into new geographic areas.
Policy and Planning Implications
Employment trends affirm offshore wind as a viable sector for job creation with pronounced benefits in coastal industrial hubs. However, spatial imbalances necessitate targeted workforce development programs in underrepresented regions, establishment of decentralized skills hubs near future floating wind sites, and integrated planning between regional economic authorities and national energy agencies. Aligning labor strategies with spatial planning and supply chain development will enhance regional integration and sectoral inclusivity, supporting France’s offshore wind transition.
Coexistence Measures at Yeu-Noirmoutier
EMYN reduced turbine rows from eight to five following fisher consultations (EMYN, 2024, p. 12). Spatial analysis shows that 30% of the 496 MW zone remains accessible to vessels <24m, and cable routes avoid the top three fishing grounds by landing value [26].
4. Discussion
4.1. Sectoral Interactions: Socioeconomic and Spatial Analysis
The spatial decoupling between offshore wind employment (68% extra-regional) and fisheries benefits (95% localized) mirrors patterns observed in UK offshore wind ([30]: 60% London-based jobs despite Scottish turbine sites) but contradicts Danish models, where 80% of Horns Rev employment remained within 50 km (Energinet, 2019). France’s centralized corporate geography-Île-de-France hosts 45% of renewable energy headquarters (INSEE, 2023) – structurally disadvantages coastal regions unless MSP explicitly mandates local content thresholds, as implemented in Scotland’s ScotWind leasing (≥25% regional supply chain integration; Marine Scotland, 2022). Without such mechanisms, the NAMO region risks replicating extractive spatial patterns critiqued in environmental justice literature [14] – benefits flow to capital centers while burdens (fishing displacement, visual impacts) remain local.
Mapping offshore wind enterprises at both national and regional scales reveals a significant concentration of economic benefits in regions such as Île-de-France and Pays de la Loire, which are geographically distant from the marine areas hosting turbine installations. This spatial disjunction underscores persistent challenges in achieving territorial equity in the distribution of economic gains. Simultaneously, the fisheries sector is characterized by declining fleet sizes, deteriorating financial viability, and reduced activity at auction centers, signaling not only economic distress but also an escalating risk of spatial marginalization within MSP frameworks.
4.2. Coexistence, Trade-Offs, and Power Asymmetries
MSP in multi-use marine environments must navigate pronounced asymmetries in power between capital-intensive, state-supported industries like offshore wind and historically entrenched, economically vulnerable sectors such as fisheries. In overlapping zones such as NAMO, spatial competition intensifies. Fisheries stakeholders frequently lack the political influence and financial capacity necessary to meaningfully shape MSP decision-making processes; their mandated participation in public consultations is often perceived as tokenistic rather than substantive. The Yeu-Noirmoutier offshore wind project exemplifies a proactive mitigation approach, wherein the developer EMYN engaged local fishers to revise turbine layouts and navigation corridors, reducing turbine lines from eight to five and aligning infrastructure with prevailing currents. Approximately 30% of the wind farm area remains accessible to professional fishers, and submarine cable routes were modified to avoid critical fishing grounds (EMYN, 2024). While this case represents a significant stride toward coexistence, such mitigation remains exceptional and lacks systemic integration within national MSP protocols.
Compensation mechanisms further illuminate sectoral power imbalances. At Yeu-Noirmoutier, financial recompense was provided based on estimated turnover losses, with vessels receiving up to 60% of lost earnings depending on the duration of impact and vessel displacement. Although this approach may mitigate short-term economic losses, it does not address long-term displacement risks or ensure the intergenerational sustainability of fisheries.
Fiscal Distribution and Compensation Mechanisms in Offshore Wind DevelopmentEconomic benefits accruing to local authorities from offshore wind development are formalized through fiscal instruments, including a sector-specific tax and occupation fees for the use of the Domaine Public Maritime (DPM) and Terrestrial Public Domain (DPT). For 2024, the offshore wind tax is set at €19,890 per MW, with occupation fees varying according to infrastructure location. Projects situated within the DPM generate fiscal revenues distributed among coastal municipalities (50%), fisheries committees (35%), biodiversity protection initiatives (10%), and maritime safety (the remainder) [36]. However, installations located within the Exclusive Economic Zone (EEZ) allocate 100% of these revenues to the national government, thereby limiting local benefit retention [37].
While these fiscal mechanisms aim to align economic contributions with spatial impacts, they institutionalize a hierarchy of beneficiaries. Coastal municipalities benefit only when projects are within visual proximity, whereas offshore projects in the EEZ yield no direct economic returns to local communities or fisheries stakeholders, despite these groups bearing environmental and operational externalities.
This fiscal framework lacks a spatial justice perspective; revenues are not systematically reinvested into affected sectors, nor is there an established monitoring system linking fiscal flows to socio-economic outcomes within MSP. Extending the SEBA framework to incorporate fiscal dimensions could facilitate such monitoring by visualizing the spatial distribution of economic benefits relative to zones of impact.
4.3. Role of MSP in Balancing Competing Uses
France’s MSP framework is notable for integrating ecosystem-based management principles and aligning with European Union climate objectives; however, its capacity to mediate competing sectoral interests remains constrained. Offshore wind development benefits from institutional prioritization through strategic zoning, environmental pre-assessments, and expedited permitting processes. In contrast, fisheries participation tends to be reactive and consultative rather than co-productive in MSP decision-making.
Current MSP processes emphasize spatial efficiency but inadequately address distributional equity. The absence of standardized methodologies for assessing socio-economic trade-offs perpetuates the marginalization of low-capital sectors. Tools such as SEBA offer critical potential to rebalance these dynamics by rendering visible the spatial distribution of benefits and burdens through detailed economic mapping.
4.4. Evaluating SEBA’s Effectiveness and Limitations
The SEBA tool effectively maps sector-specific economic benefits and highlights inequalities in benefit distribution, providing valuable spatial insights. Its principal strength lies in identifying geographic concentrations of economic participation and revealing gaps. Nonetheless, SEBA’s utility is constrained by three data gaps: (1) Employment aggregated at NUTS-2 (regional) rather than LAU (municipal) level, preventing intra-regional equity analysis (e.g., coastal vs. inland disparities within Brittany). (2) Subcontractor lists incomplete for 6 of 9 offshore wind projects (only Yeu-Noirmoutier disclosed full supply chain; others withheld commercially sensitive data). (3) Fiscal revenues not spatially tracked (EEZ revenues pooled nationally; [38], Article 5.3). These gaps addressable via regulatory mandates currently limit SEBA’s resolution for community-scale MSP. The absence of a centralized marine sector database in France, particularly concerning employment and subcontracting, restricts comprehensive application.
SEBA’s static design mapping current distributions reflects its original purpose: facilitating stakeholder dialogue via visualized equity gaps [13]. Projecting future distributions requires coupling SEBA with dynamic models. SEBA outputs feed into agent-based models of fleet behavior, simulating employment shifts under 10 GW floating wind scenarios (2030–2035). This hybrid approach SEBA for equity audits, ABM for projections is recommended for next-generation MSP tools. Integration with scenario-based planning tools and participatory GIS platforms could enhance its predictive and policy-relevant functions.
4.5. Gaps in Spatial Data and Planning Practice
A persistent challenge within France’s MSP framework is the insufficiency of spatially explicit socio-economic data. While ecological and technical datasets have become increasingly robust, data related to regional employment, fiscal redistribution, and compensation remain fragmented and opaque. Although localized compensation schemes such as those implemented in Yeu-Noirmoutier are documented, they are neither systematized nor available for comparative analysis.
Furthermore, the centralization of fiscal revenues from offshore wind projects in the EEZ accentuates the disconnect between spatial impacts and economic returns. Without mechanisms to spatially trace economic benefit distribution, MSP risks perpetuating existing inequities rather than redressing them. The SEBA framework, if adapted and expanded, offers a replicable methodology to evaluate spatial equity and institutional accountability, thereby supporting more just and transparent MSP governance.
5. Conclusions
The study critically examined the socio-economic dimensions of Maritime Spatial Planning (MSP) in France, focusing on the spatial and economic interactions between offshore wind development and the fisheries sector. Employing the Spatial Economic Benefit Analysis (SEBA) tool within a mixed-methods, multi-scalar framework, the study elucidated significant disparities in the distribution of economic benefits and revealed systemic challenges undermining equitable marine governance.
Offshore wind emerged as a strategically vital and rapidly expanding sector, yet it remains constrained by institutional inefficiencies such as permitting delays and infrastructure bottlenecks. The uneven domestic industrial participation across projects raises concerns regarding long-term economic sovereignty and value retention. Floating wind technology, while promising, is still nascent, with commercial deployment timelines extending into the 2030s. Mapping of key projects demonstrated spatial concentration of benefits in metropolitan regions distant from turbine sites, highlighting a spatial decoupling between zones of impact and zones of economic gain.
Conversely, the fisheries sector, a socio-cultural mainstay of coastal communities particularly in the NAMO region faces pronounced economic fragility, spatial marginalization, and diminished policy influence. Declining fleet sizes, subsidy dependence, and reduced auction activity reflect structural vulnerabilities exacerbated by limited political leverage and fragmented socio-economic data representation. Fisheries stakeholders’ participation in MSP remains largely consultative and tokenistic, further entrenching asymmetrical power relations.
The juxtaposition of these sectors within MSP underscores entrenched spatial inequities and power asymmetries. Offshore wind benefits from institutional prioritization, robust data support, and formalized fiscal mechanisms, whereas fisheries contend with marginal inclusion and inadequate compensation frameworks that address only short-term losses without securing long-term sustainability. The fiscal regime, particularly the allocation of revenues from projects in the Exclusive Economic Zone (EEZ) exclusively to the national government, institutionalizes a hierarchy of beneficiaries and neglects spatial justice considerations.
The SEBA framework proved instrumental in visualizing these disparities by mapping sector-specific economic benefits and revealing the disconnect between areas of environmental impact and zones of economic advantage. However, limitations such as the scarcity of disaggregated, spatially explicit socio-economic data and the absence of dynamic modeling capabilities constrain its comprehensive application. Integrating SEBA with scenario-based planning and participatory GIS could enhance its policy relevance and predictive power.
Future work should integrate participatory mapping workshops to co-interpret SEBA outputs with fishers, developers, and planners, enhancing social legitimacy. This qualitative validation supports spatial pattern interpretation and alignment with formal planning claims.
Policy implications emphasize the necessity of coupling energy transition strategies with social resilience measures that prioritize small-scale, place-based sectors like fisheries. Strengthening national supply chain anchoring beyond primary contractors and evolving MSP governance from consultative to co-productive processes embedding local knowledge, comprehensive sectoral data, and equity metrics are critical for addressing spatial inequities.
In conclusion, while France’s MSP framework demonstrates increasing ambition and alignment with climate objectives, its incorporation of socio-economic dimensions remains uneven and insufficiently spatially explicit. Without deliberate integration of evidence-based, spatially sensitive tools such as SEBA, offshore wind development risks exacerbating existing spatial inequalities and sectoral exclusion. This study advances a vision of marine governance that is both technically robust and socially just, a prerequisite for sustainable ocean use amid intensifying sectoral competition.
Author Contributions
Conceptualization, L.P., B.G. and J.R.; methodology, L.P. and B.G.; software, L.P.; validation, B.G. and J.R.; investigation, L.P.; resources, B.G. and J.R.; data curation, L.P. and J.R.; writing—original draft preparation, L.P.; writing—review and editing, B.G. and J.R.; supervision, B.G. and J.R.; funding acquisition, B.G. All authors have read and agreed to the published version of the manuscript.
Funding
This study was supported by ISblue project, Interdisciplinary Graduate School for the Blue Planet (ANR-17-EURE-0015), and co-funded by a grant from the French government under the program “Investissements d’Avenir” and Erasmus Mundus Scholarship program.
Institutional Review Board Statement
Not applicable.
Informed Consent Statement
Not applicable.
Data Availability Statement
Data are contained within the article.
Acknowledgments
L.P. gratefully acknowledges the mentorship of Prof. Karim Erzini throughout his IMBRSea journey. L.P. also thanks Adeline Bas and Céline Jacob for their valuable suggestions, and Gaëlle Leloup for her insightful feedback on the interpretation of results. This research was made possible through the financial support of the ISblue Doctoral School and the Erasmus Mundus scholarship program.
Conflicts of Interest
The authors declare no conflicts of interest. The funders had no role in the design of the study; in the collection, analyses, or interpretation of data; in the writing of the manuscript; or in the decision to publish the results.
Abbreviations
The following abbreviations are used in this manuscript:
| BGL | Bretagne Grand Large |
| BNE | Bretagne Nord Est |
| BNO | Bretagne Nord Ouest |
| CAGL | Centre Atlantique Grand Large |
| CNDP | Commission Nationale du Débat Public |
| CRPMEM | Comité Régional des Pêches Maritimes et des Élevages Marins |
| DAM | Directorate of Maritime Affairs |
| DGAMPA | Directorate General for Maritime Affairs, Fisheries and Aquaculture |
| DPM | Domaine Public Maritime (Maritime Public Domain) |
| DPMA | Directorate of Maritime Fisheries and Aquaculture |
| DPT | Domaine Public Terrestre (Terrestrial Public Domain) |
| DSF | Document Stratégique de Façade |
| EEA | European Environment Agency |
| EEZ | Exclusive Economic Zone |
| EDF | Électricité de France |
| EIAs | Environmental Impact Assessments |
| EMFAF | European Maritime, Fisheries and Aquaculture Fund |
| EMFF | European Maritime and Fisheries Fund |
| EPC | Engineering, Procurement, and Construction |
| EU | European Union |
| FAO | Food and Agriculture Organization |
| FEM | France Énergies Marines |
| FTE | Full-Time Equivalent |
| GIS | Geographic Information System |
| GVA | Gross Value Added |
| IFREMER | Institut Français de Recherche pour l’Exploitation de la Mer |
| IMBRSea | International Masters in Marine Biological Resources |
| IUCN | International Union for Conservation of Nature |
| MARXAN | Marine Reserve Design Tool (spatial optimization software) |
| MPA | Marine Protected Area |
| MRE | Marine Renewable Energy |
| MSP | Marine/Maritime Spatial Planning |
| NAMO | North Atlantic - Western Channel (French Maritime Façade) |
| NGO | Non-Governmental Organization |
| OEM | Original Equipment Manufacturer |
| O&M | Operations and Maintenance |
| ORE | Offshore Renewable Energy |
| OWF | Offshore Wind Farm |
| PACA | Provence-Alpes-Côte d’Azur |
| PPA | Power Purchase Agreement |
| RTE | Réseau de Transport d’Électricité |
| SDG | Sustainable Development Goal |
| SEBA | Spatial Economic Benefit Analysis |
| SNML | Stratégie Nationale pour la Mer et le Littoral |
| STECF | Scientific, Technical and Economic Committee for Fisheries |
| TEG | Technical Expert Group (on MSP Data) |
| UNESCO | United Nations Educational, Scientific and Cultural Organization |
| € | Euro |
| VAT | Value-Added Tax |
References
- Ehler, C.; Douvere, F. Marine spatial planning: a step-by-step approach toward ecosystem-based management; UNESCO-IOC, 2009; Available online: https://unesdoc.unesco.org/ark:/48223/pf0000186559.
- European Commission. Directive 2014/89/EU (Maritime Spatial Planning Directive). 2014. Available online: http://data.europa.eu/eli/dir/2014/89/oj.
- Ramos, J.; Soma, K.; Bergh, Ø.; Schulze, T.; Gimpel, A.; Stelzenmüller, V.; Gault, J. Multiple interests across European coastal waters: the importance of a common language. ICES J. Mar. Sci. 2015, 72(2), 720–731. [Google Scholar] [CrossRef]
- European Commission. Directive 2000/60/EC (Water Framework Directive). 2000. Available online: https://eur-lex.europa.eu/eli/dir/2000/60/oj.
- European Commission. Directive 2008/56/EC (Marine Strategy Framework Directive). 2008. Available online: http://data.europa.eu/eli/dir/2008/56/oj.
- Bellanger, M.; Speir, C.; Blanchard, F.; Brooks, K.; Butler, J.R.A.; Crosson, S.; Fonner, R.; Gourguet, S.; Holland, D.S.; Kuikka, S.; Le Gallic, B.; Lent, R.; Libecap, G.D.; Lipton, D.W.; Nayak, P.K.; Reid, D.; Scemama, P.; Stephenson, R.; Thébaud, O.; Young, J.C. Addressing Marine and Coastal Governance Conflicts at the Interface of Multiple Sectors and Jurisdictions. Front. Mar. Sci. 2020, 7, 544440. [Google Scholar] [CrossRef]
- Lebel, L.; et al. Subglobal scenarios. In Ecosystems and human well-being; Capistrano, D., et al., Eds.; Island Press, 2005; Volume 4, pp. 227–258. [Google Scholar]
- Levine, A. S.; Richmond, L.; Lopez-Carr, D. Marine resource management: Culture, livelihoods, and governance. Appl. Geogr. 2015, 59, 56–59. [Google Scholar] [CrossRef]
- Oen, A. M. P.; et al. Stakeholder involvement for management of the coastal zone. Integr. Environ. Assess. Manag. 2016, 12(4), 701–710. [Google Scholar] [CrossRef] [PubMed]
- St. Martin, K.; Hall-Arber, M. The missing layer: Geo-technologies, communities, and implications for marine spatial planning. Mar. Policy 2008, 32(5), 779–786. [Google Scholar] [CrossRef]
- Rodríguez, J. P.; et al. Trade-offs across space, time, and ecosystem services. Ecol. Soc. 2006, 11(1), 28. Available online: http://www.ecologyandsociety.org/vol11/iss1/art28/. [CrossRef]
- Bennett, E.; Peterson, G.; Gordon, L. Understanding relationships among multiple ecosystem services. Ecol. Lett. 2009, 12(12), 1394–1404. [Google Scholar] [CrossRef] [PubMed]
- Schultz-Zehden, A.; Weig, B.; Buchholz, H. Spatial Economic Benefit Analysis: Facing integration challenges in maritime spatial planning. Ocean Coast. Manag. 2019, 173, 65–76. [Google Scholar] [CrossRef]
- Saunders, F.; Gilek, M.; Ikauniece, A.; Tafon, R. V.; Gee, K.; Zaucha, J. Theorizing social sustainability and justice in marine spatial planning: Democracy, diversity, and equity. Sustainability 2020, 12(6), 2560. [Google Scholar] [CrossRef]
- European Commission. MSP platform final report: Maritime spatial planning and fisheries. 2020. Available online: https://maritime-spatial-planning.ec.europa.eu/sites/default/files/msp_and_fisheries_final_report.pdf.
- Zaucha, J.; Gilek, M. BONUS BALTSPACE Deliverable 2.1: Baseline-mapping and refined case study design. 2016. Available online: https://www.baltspace.eu/images/publishedreports/BONUS_BALTSPACE_D2-1.pdf.
- Ramos, J.; Drakeford, B. Blue economy and tourism: is there a potential to create sustainable jobs? In Handbook of research on human capital and people Management in the Tourism Industry; IGI Global Scientific Publishing, 2021; pp. 243–264. [Google Scholar] [CrossRef]
- Soma, K.; Ramos, J.; Bergh, Ø.; Schulze, T.; van Oostenbrugge, H.; van Duijn, A. P.; Buisman, E. The “mapping out” approach: effectiveness of marine spatial management options in European coastal waters. ICES J. Mar. Sci. 2014, 71(9), 2630–2642. [Google Scholar] [CrossRef]
- Quero García, P.; García Sanabria, J.; Chica Ruiz, J. A. The role of maritime spatial planning on the advance of blue energy in the European Union. Mar. Policy 2019, 99, 123–131. [Google Scholar] [CrossRef]
- Surís-Regueiro, J. C.; Santiago, J. L.; González-Martínez, X. M.; Garza-Gil, M. D. An applied framework to estimate the direct economic impact of marine spatial planning. Mar. Policy 2021, 127, 104443. [Google Scholar] [CrossRef]
- Ehler, C. A guide to evaluating marine spatial plans; UNESCO, 2014; Available online: http://unesdoc.unesco.org/images/0022/002277/227779e.pdf.
- Murillas, A.; Garza-Gil, M. D.; Villasante, S.; Pita, C.; Pascual, M. Balancing maritime uses: Tools for integrating socioeconomic information in Marine Spatial Planning. Mar. Policy 2023, 147, 105392. [Google Scholar] [CrossRef]
- Gee, K.; Kannen, A.; Adlam, R.; Brooks, C.; Chapman, M.; Cormier, R.; Wenning, R. Identifying culturally significant areas for marine spatial planning. Ocean Coast. Manag. 2017, 136, 139–147. [Google Scholar] [CrossRef]
- IUCN. Open Standards for the Practice of Conservation Version 4.0; International Union for Conservation of Nature, 2020; Available online: https://conservationstandards.org.
- Ministère de la Transition Écologique. Guide sur la planification maritime. 2022. Available online: https://www.ecologie.gouv.fr.
- FranceAgriMer. L’économie des pêches maritimes et de l’aquaculture en 2022. 2023. Available online: https://www.franceagrimer.fr.
- IFREMER. Observatoire de l’économie des pêches françaises. 2023. Available online: https://wwz.ifremer.fr.
- OECD. The Ocean Economy in 2030. 2021. Available online: https://www.oecd.org/ocean/economy.
- Murillas, A.; Oinonen, S.; Hynes, S.; Galparsoro, I.; Uyarra, M. C.; Borja, A. Integrating ecosystem services into marine spatial planning: Lessons from practical applications. Mar. Policy 2023, 152, 105013. [Google Scholar] [CrossRef]
- Cowell, R.; Ellis, G.; Sherry-Brennan, F.; Strachan, P. A.; Toke, D. Rescaling the governance of renewable energy: Lessons from the UK devolution experience. J. Environ. Policy Plan. 2017, 19(5), 480–502. [Google Scholar] [CrossRef]
- FranceAgriMer. Analyse des données économiques de la pêche française. 2022. Available online: https://www.franceagrimer.fr.
- IFREMER. Données socio-économiques de la filière pêche. 2022. Available online: https://wwz.ifremer.fr.
- BLOOM; Institut Rousseau. Against the current: How public action in France misses the challenges of transition - A summary of public subsidies allocated to the French fishing sector between 2020 and 2022. January 2024. Available online: https://institut-rousseau.fr/.
- Lehr, U.; Mönnig, A.; Missaoui, R.; Marrouki, S.; Salem, G. B. Employment from renewable energy and energy efficiency in Tunisia–new insights, new results. Energy Procedia 2016, 93, 223–228. [Google Scholar] [CrossRef]
- European Commission. Blue economy report. 2023. Available online: https://oceans-and-fisheries.ec.europa.eu/topics/blue-economy_en.
- Ministère de la Transition Écologique. Planification maritime et coexistence des usages: Bilan du débat public. 2024. Available online: https://www.ecologie.gouv.fr/planification-maritime.
- Mer, Eoliennes en. Futurs projets NAMO - AO10 Zone BNO. 2024a. Available online: https://www.eoliennesenmer.fr/planification/futurs-projets-namo.
- Ministère de la Transition Écologique. Présentation des principales orientations de la planification maritime (Dossier de presse, octobre 2024). 2024. Available online: https://www.ecologie.gouv.fr/sites/default/files/documents/20241018_DP_Eolien%20en%20mer.pdf.
Figure 1.
Regional Distribution of Fresh and Frozen Landings and Revenue Generated in 2023 along with French Coast Line.
Figure 1.
Regional Distribution of Fresh and Frozen Landings and Revenue Generated in 2023 along with French Coast Line.
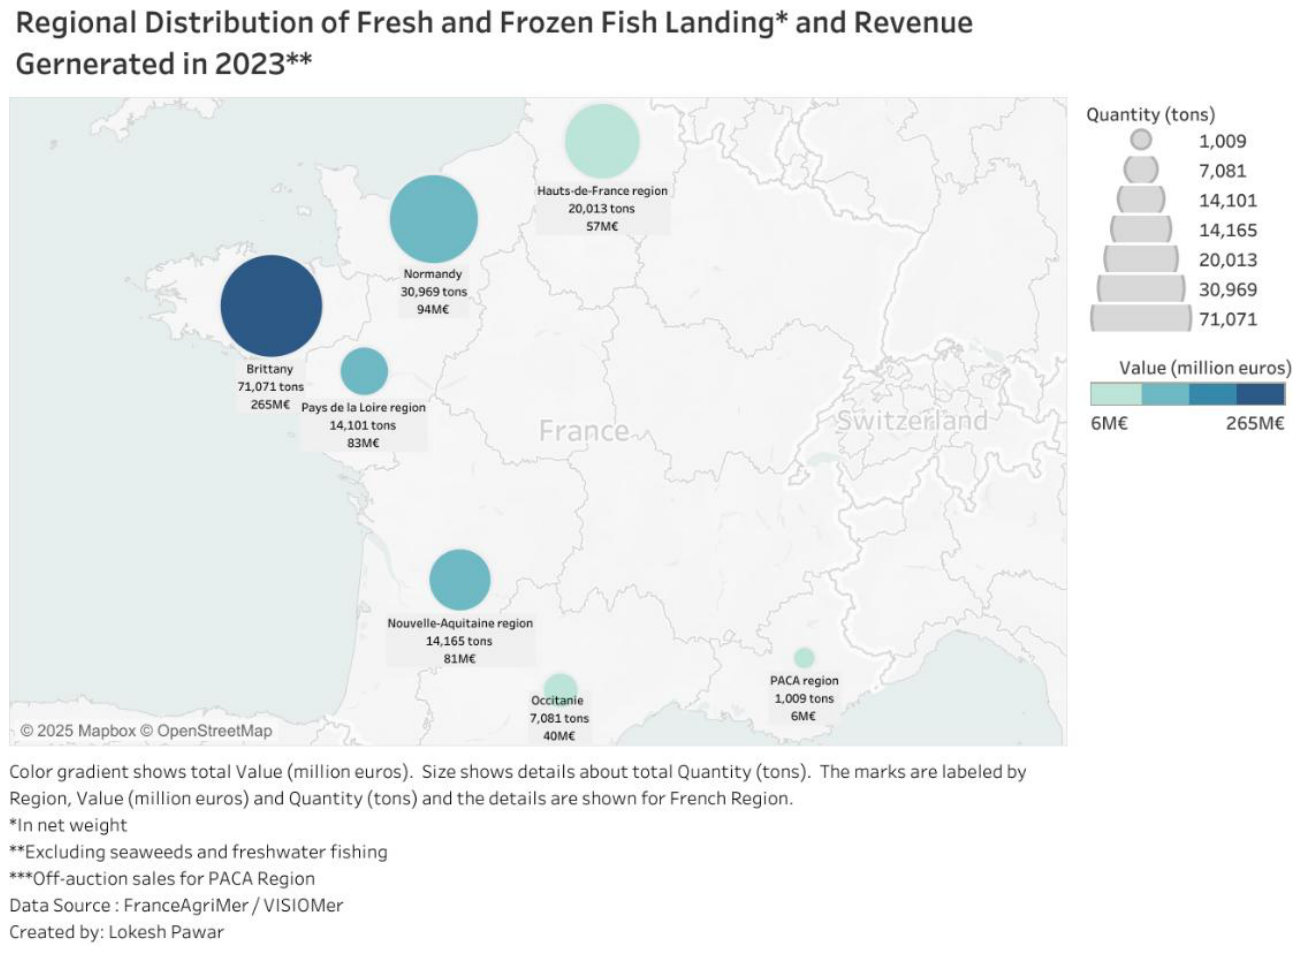
Figure 2.
Regional Distribution of fishermen employed in different French marine zones.
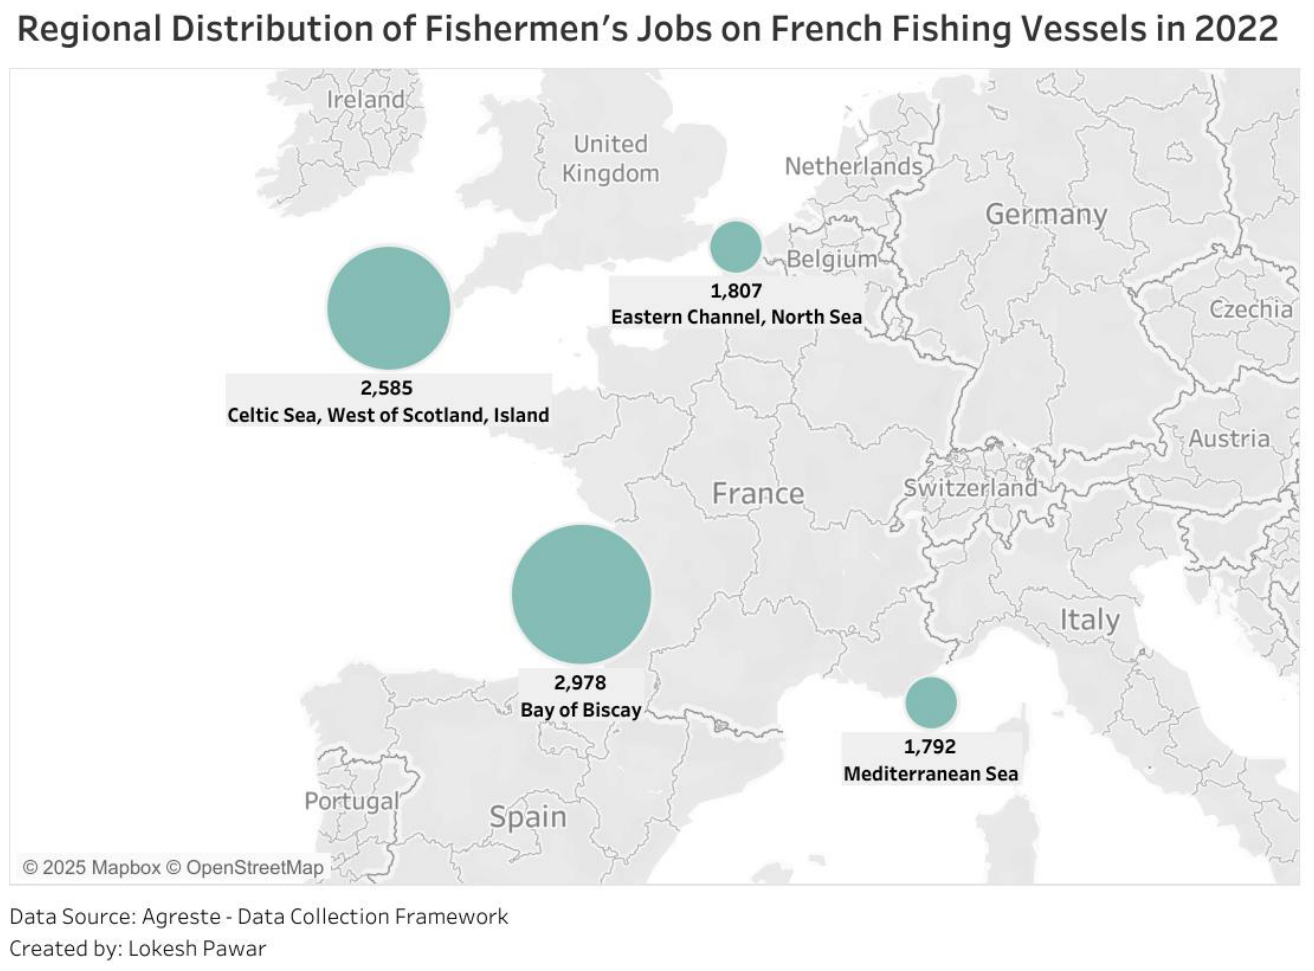
Figure 3.
Region wise Temporal Employment Trend in Capture fisheries i.e., Fishermen on French Vessels (all nationalities).
Figure 3.
Region wise Temporal Employment Trend in Capture fisheries i.e., Fishermen on French Vessels (all nationalities).
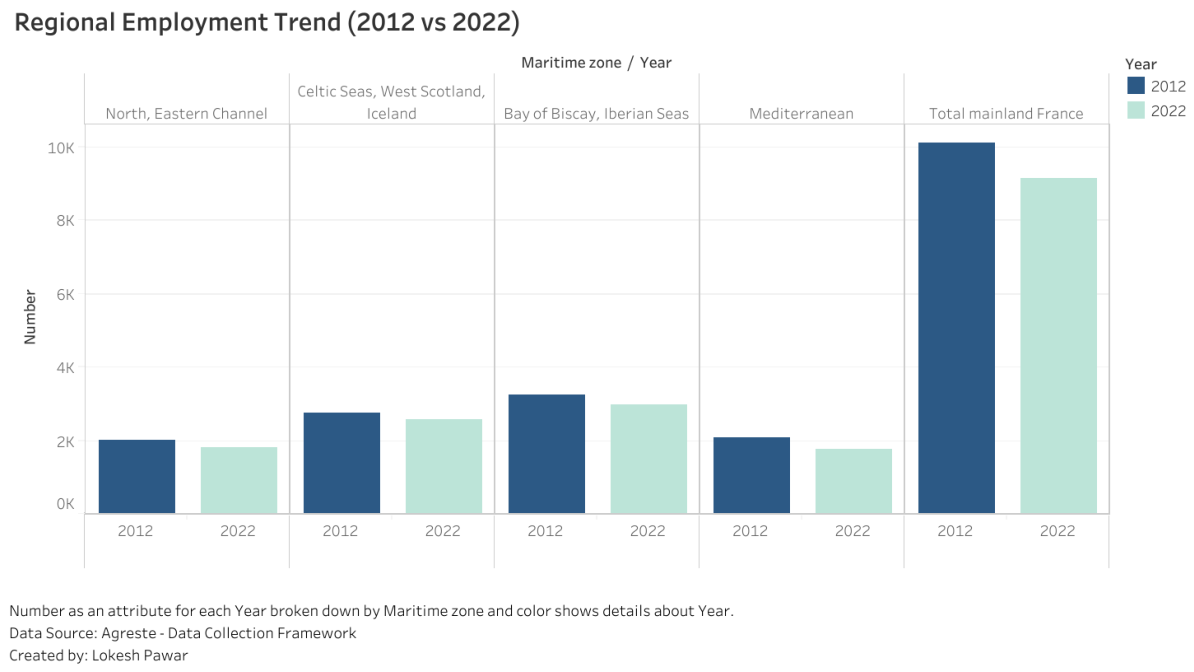
Figure 4.
Temporal Trend of French Fishing Vessels in French region.
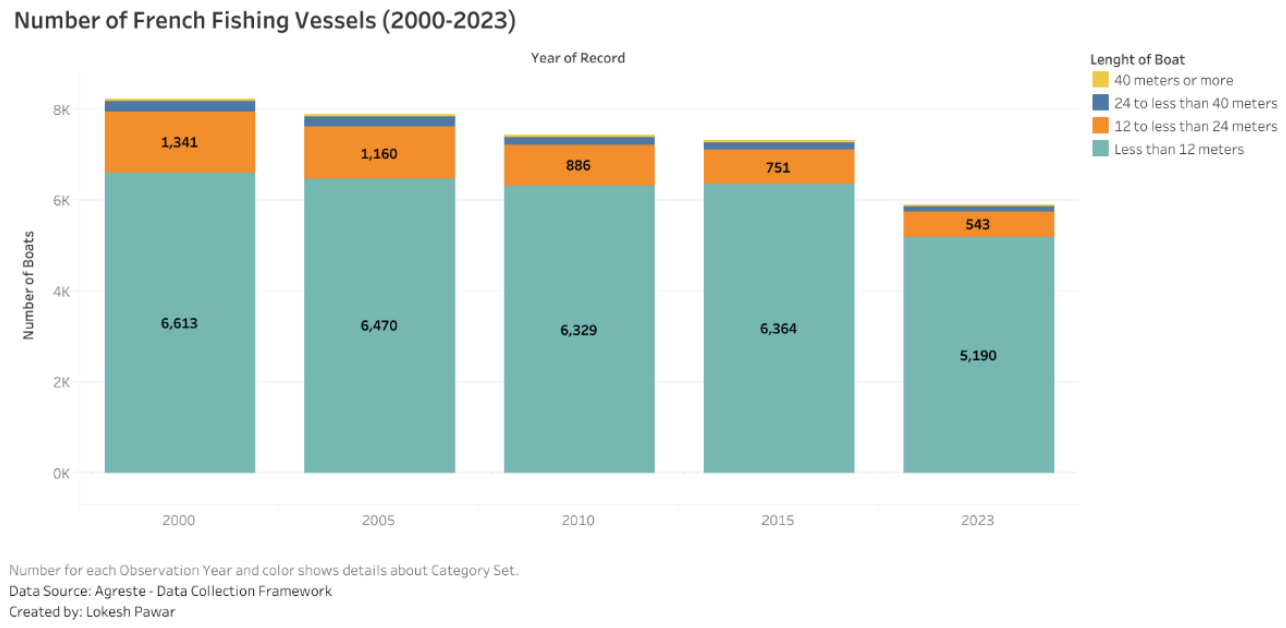
Figure 5.
Regional Distribution of French Auction Centers.
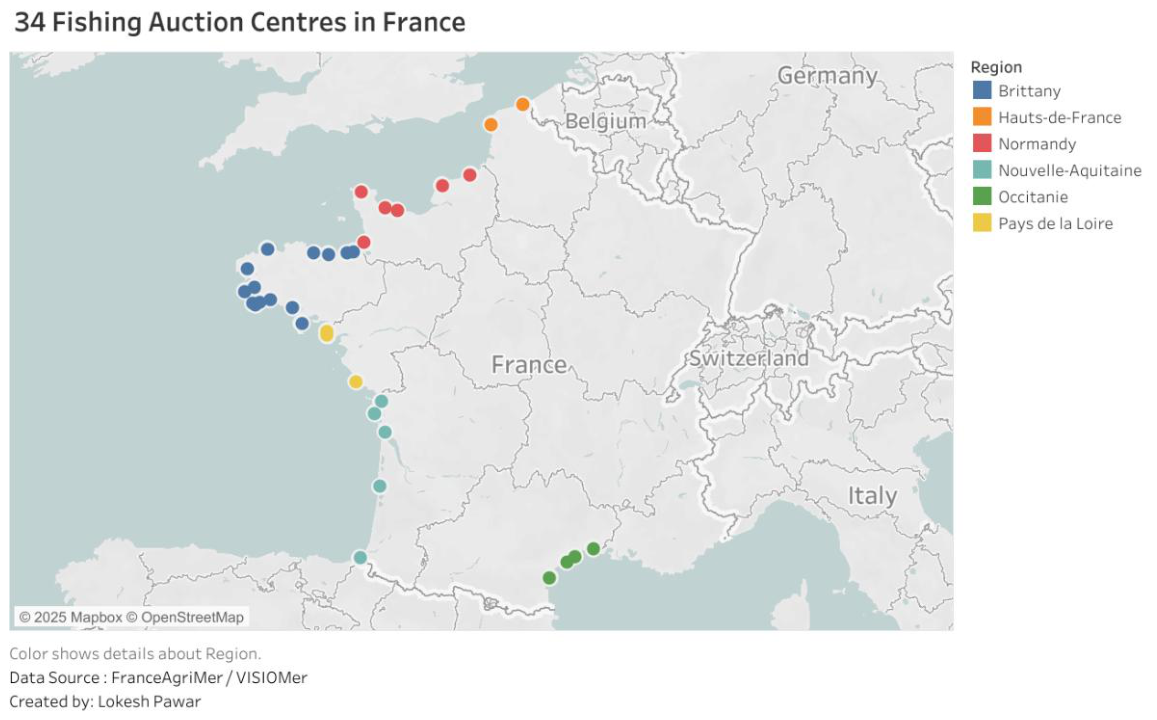
Figure 6.
Economic Performance of Mailand French Fishing Fleet.
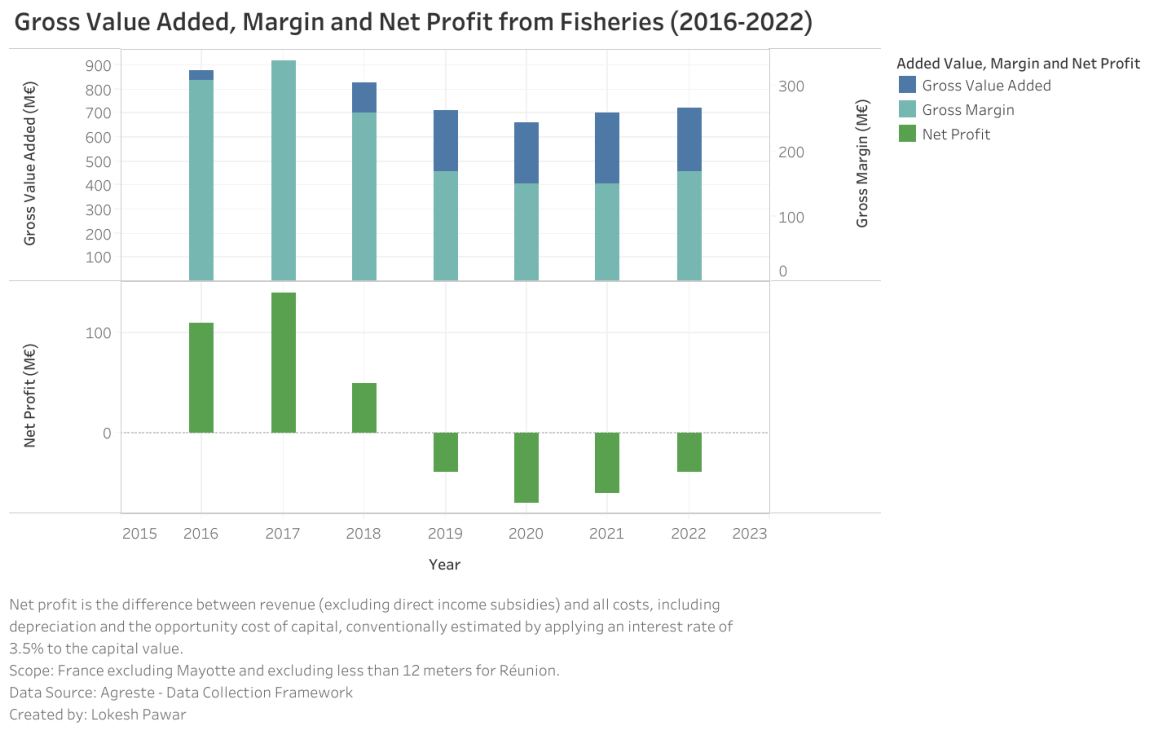
Figure 7.
The illustration presents a comprehensive overview of all offshore wind farm projects within France’s Exclusive Economic Zone (EEZ), classified by their current stage of development ranging from public debate and tendering to operational status. It distinguishes between fixed-bottom and floating technologies, highlighting regional variation in project maturity across coastal zones.
Figure 7.
The illustration presents a comprehensive overview of all offshore wind farm projects within France’s Exclusive Economic Zone (EEZ), classified by their current stage of development ranging from public debate and tendering to operational status. It distinguishes between fixed-bottom and floating technologies, highlighting regional variation in project maturity across coastal zones.
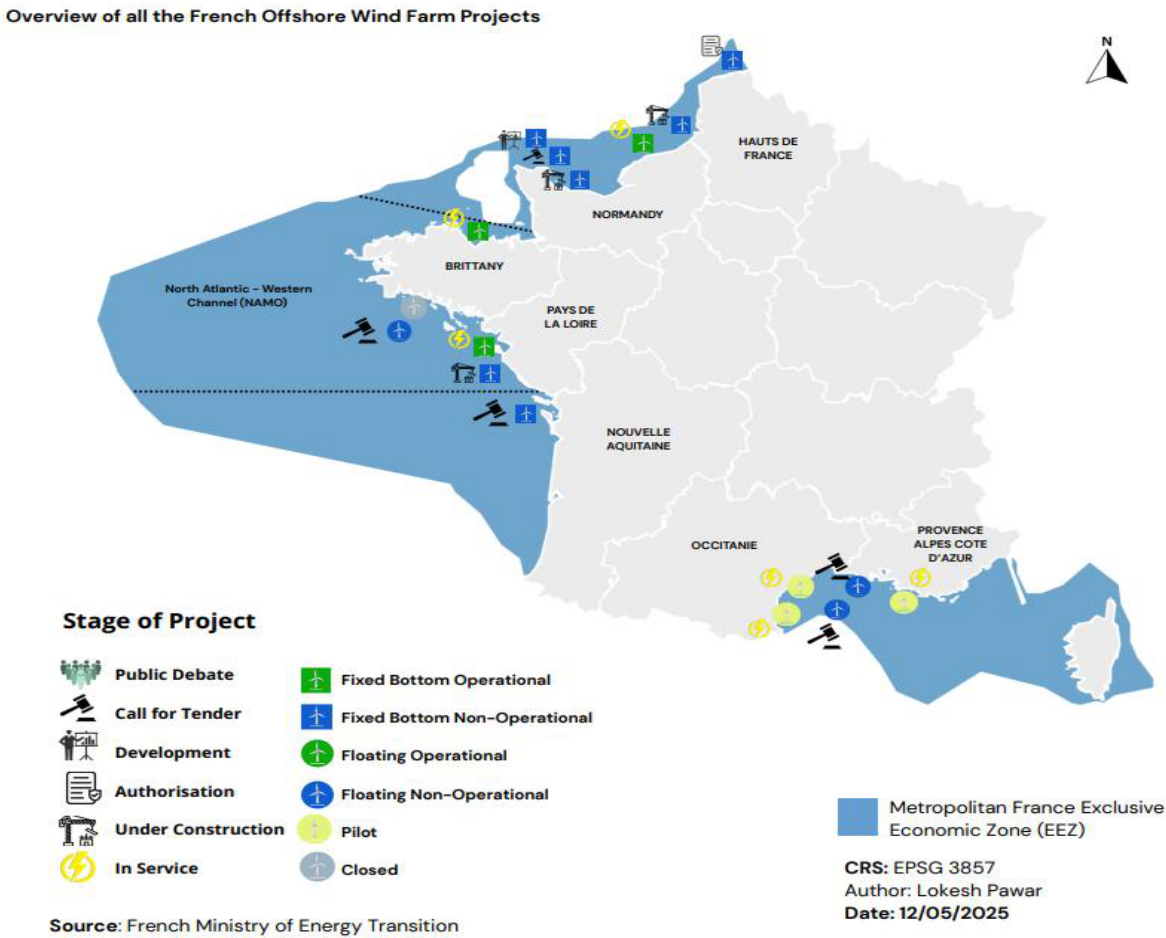
Figure 8.
French Progress in Deploying Offshore Wind Farms.
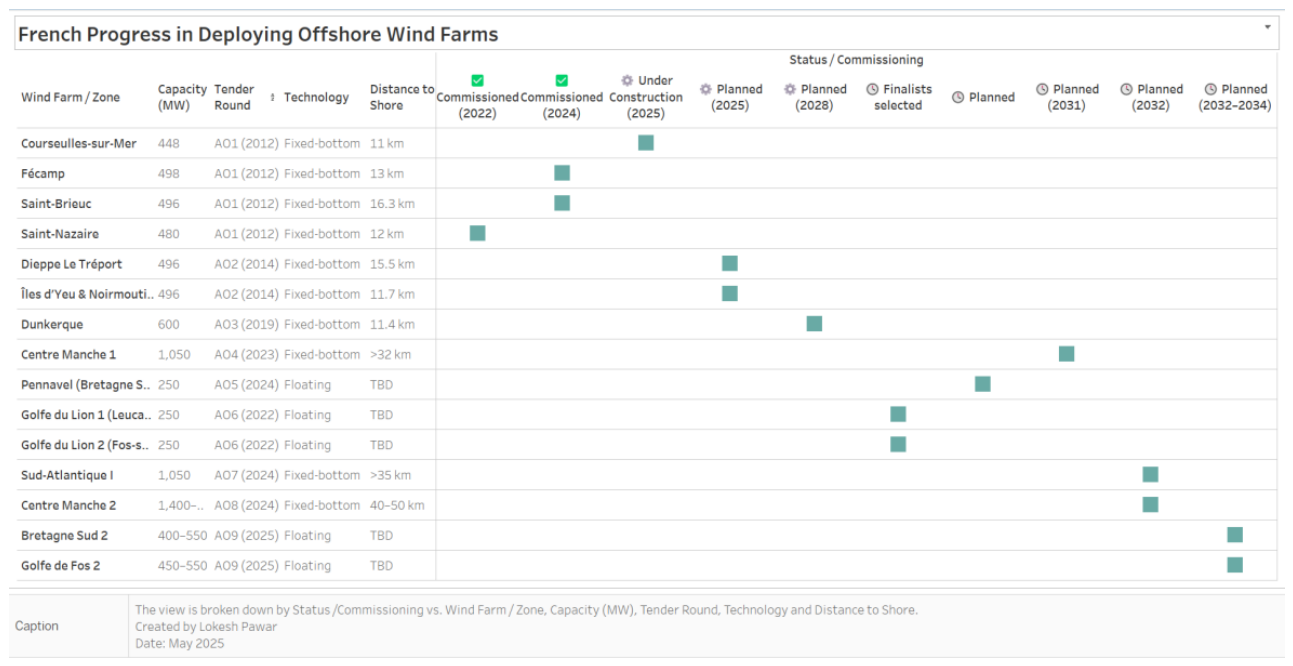
Figure 9.
Achievable Offshore Wind Energy Targets in France (MW/Year).
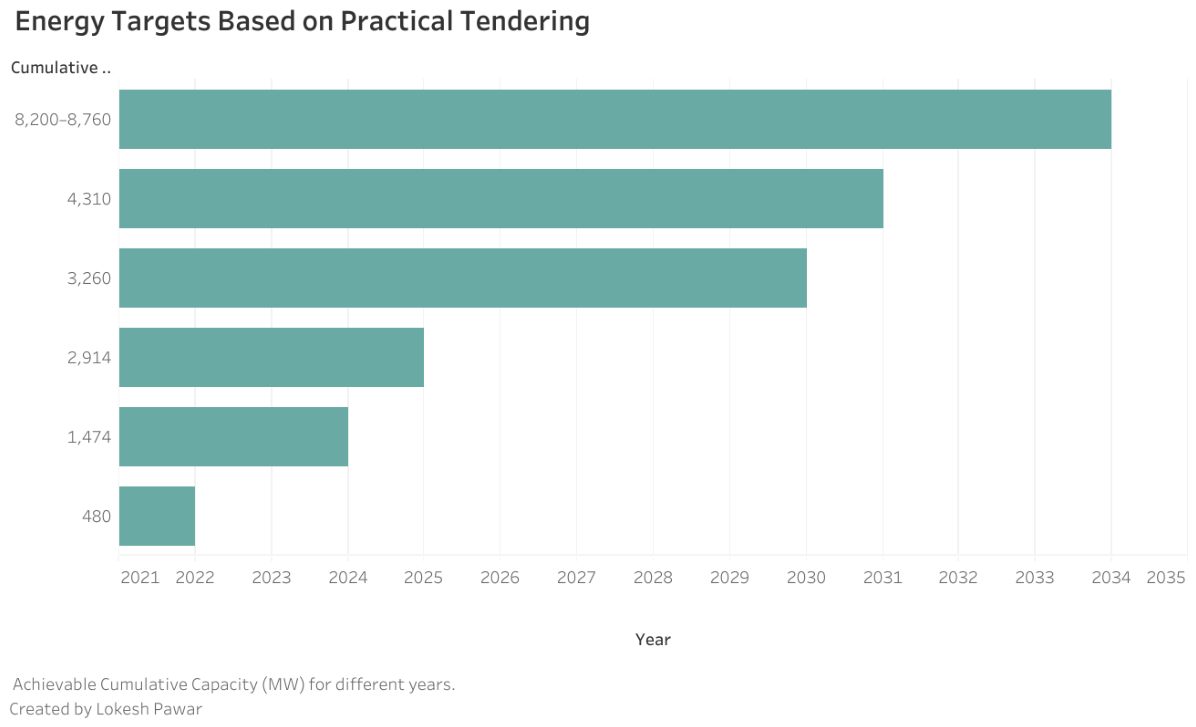
Figure 10.
Geographical distribution of the firms involved in planning, constructing and maintaining of the French offshore wind farm Saint-Brieuc (Note: Canada was excluded from the map visualization to maintain appropriate geographic scale and focus on European firm distribution. The involvement of Canadian firms is still acknowledged in the data analysis).
Figure 10.
Geographical distribution of the firms involved in planning, constructing and maintaining of the French offshore wind farm Saint-Brieuc (Note: Canada was excluded from the map visualization to maintain appropriate geographic scale and focus on European firm distribution. The involvement of Canadian firms is still acknowledged in the data analysis).
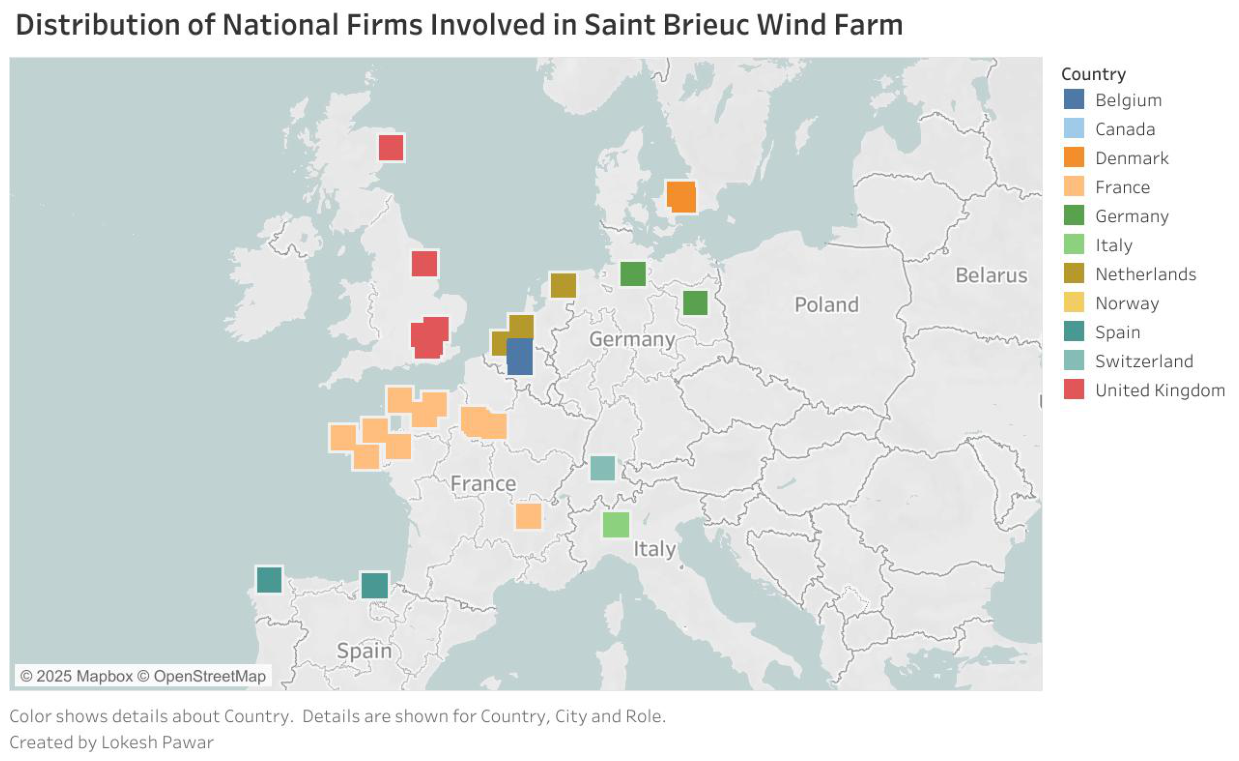
Figure 11.
Geographical distribution of the firms involved in planning, constructing and maintaining of the French offshore wind farm Saint-Nazaire (Note: Canada and USA were excluded from the map visualization to maintain appropriate geographic scale and focus on European firm distribution. The involvement of Canadian firms is still acknowledged in the data analysis).
Figure 11.
Geographical distribution of the firms involved in planning, constructing and maintaining of the French offshore wind farm Saint-Nazaire (Note: Canada and USA were excluded from the map visualization to maintain appropriate geographic scale and focus on European firm distribution. The involvement of Canadian firms is still acknowledged in the data analysis).
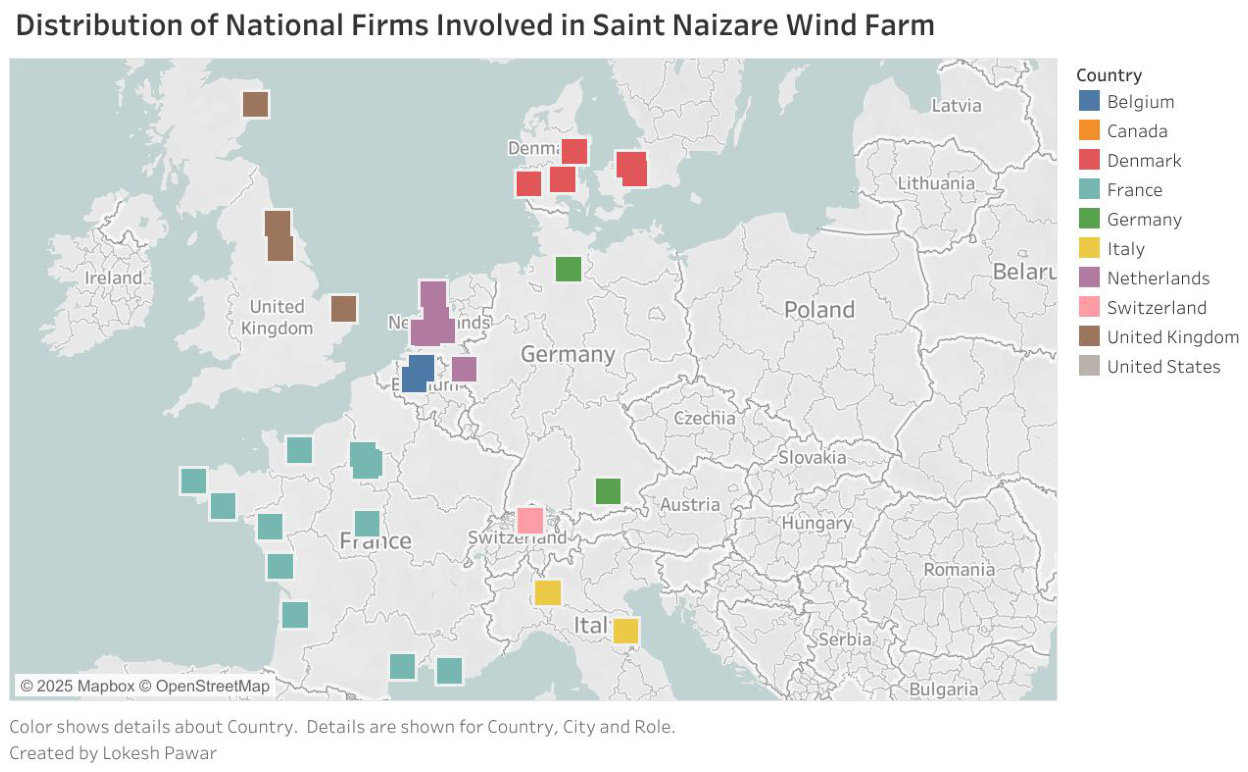
Figure 12.
Geographical distribution of the firms involved in planning, constructing and maintaining of the French offshore wind farm Yeu and Noirmoutier. (Note: China was excluded from the map visualization to maintain appropriate geo-graphic scale and focus on European firm distribution. The involvement of Canadian firms is still acknowledged in the data analysis).
Figure 12.
Geographical distribution of the firms involved in planning, constructing and maintaining of the French offshore wind farm Yeu and Noirmoutier. (Note: China was excluded from the map visualization to maintain appropriate geo-graphic scale and focus on European firm distribution. The involvement of Canadian firms is still acknowledged in the data analysis).
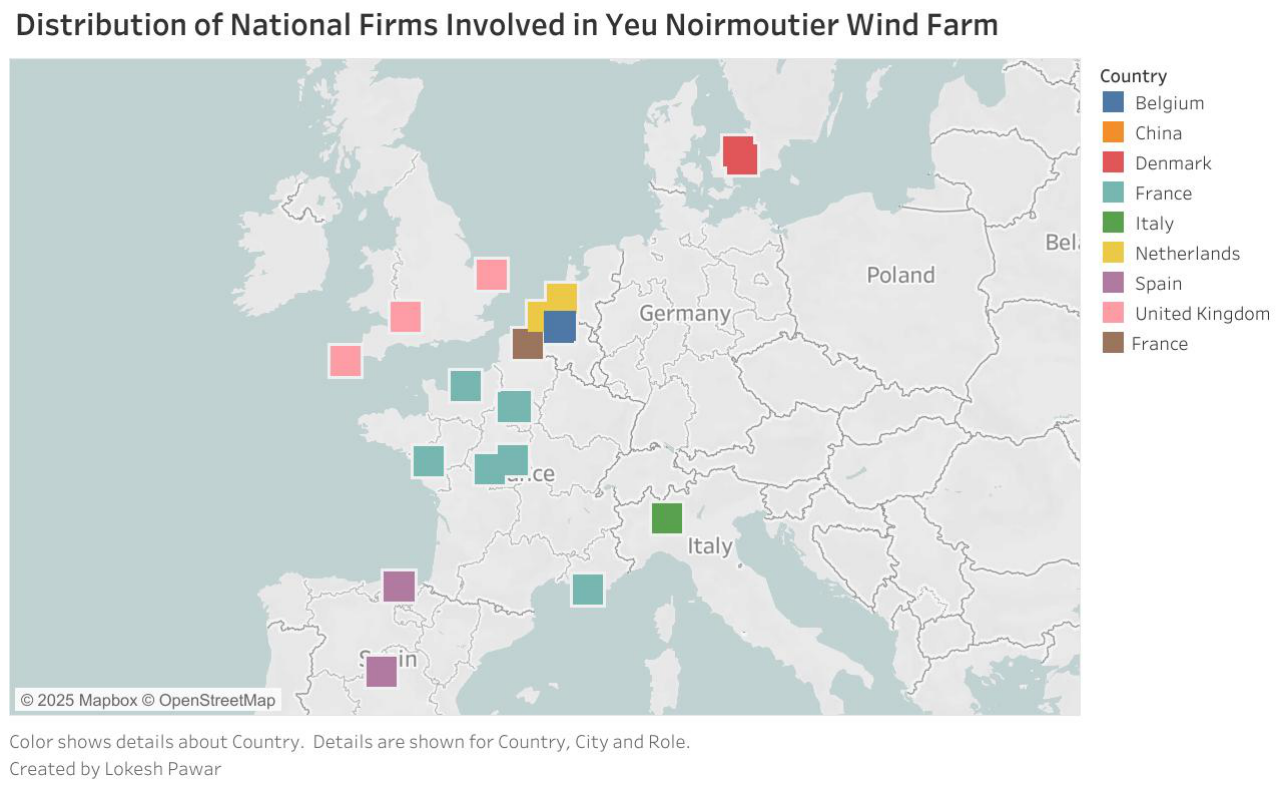
Figure 13.
Local Firms involved in Yeu and Noirmoutier wind farm in Pays de la Loire.
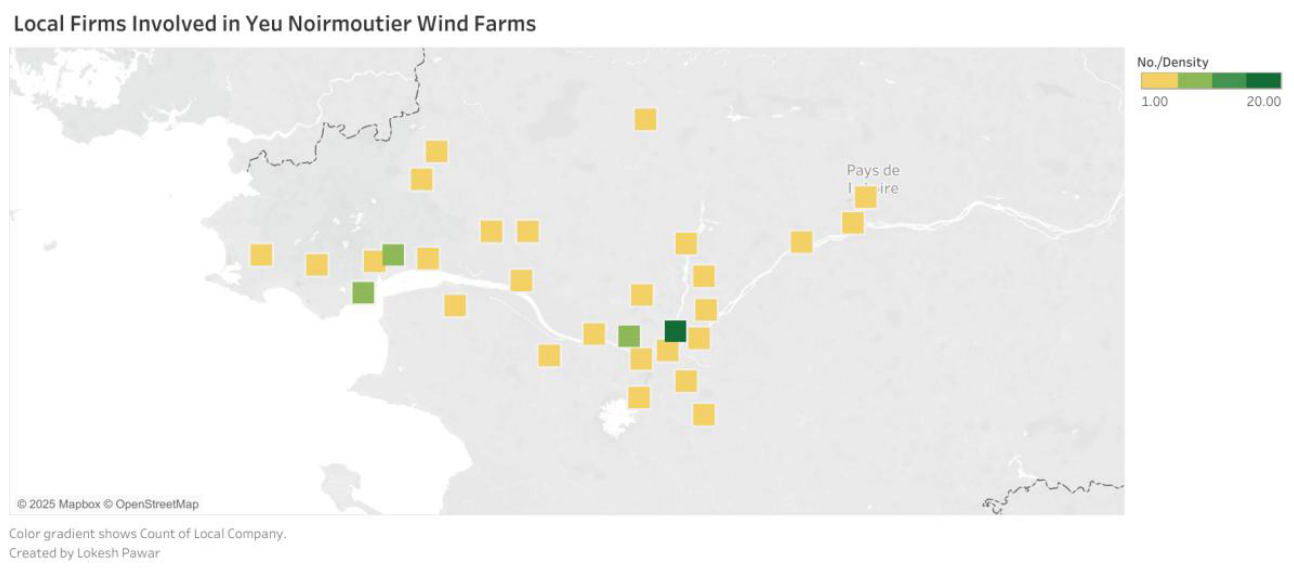
Figure 14.
Regional Distribution of Local Firms by Functional Role in the French Offshore Wind Industry: Project Developers, Original Equipment Manufacturers (OEMs), EPC Contractors, and Component Manufacturers & Suppliers.
Figure 14.
Regional Distribution of Local Firms by Functional Role in the French Offshore Wind Industry: Project Developers, Original Equipment Manufacturers (OEMs), EPC Contractors, and Component Manufacturers & Suppliers.
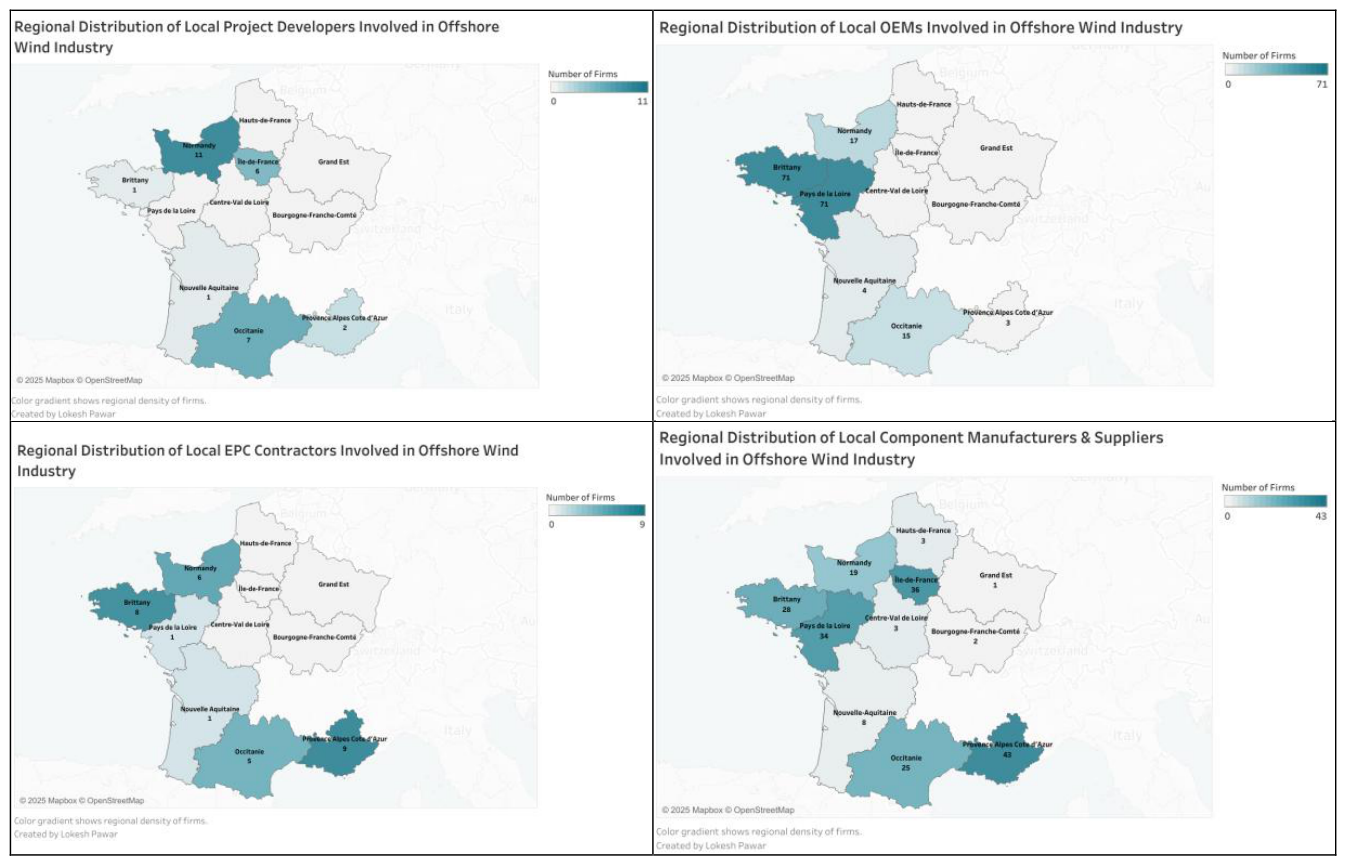
Figure 15.
Regional Distribution of Local Firms in the French Offshore Wind Industry by Service Category: O&M Providers, Marine & Logistics Providers, Financial Institutions & Investors, and Technical & Environmental Consultants.
Figure 15.
Regional Distribution of Local Firms in the French Offshore Wind Industry by Service Category: O&M Providers, Marine & Logistics Providers, Financial Institutions & Investors, and Technical & Environmental Consultants.
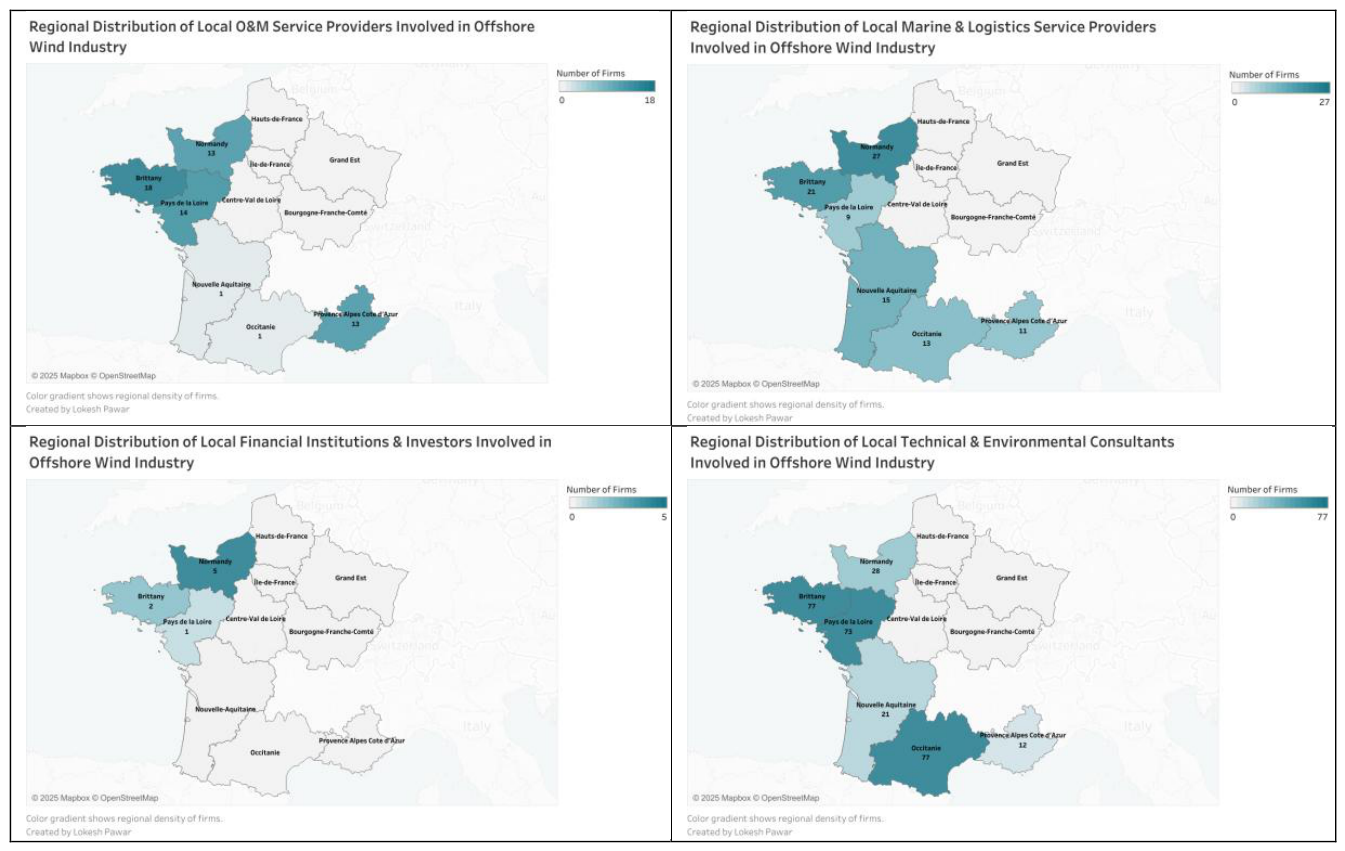
Figure 16.
Regional Distribution of Local Institutions and Supporting Actors in the French Offshore Wind Industry: Research & Education, Institutional Actors, Tertiary Services, and Combined All-Actor Overview.
Figure 16.
Regional Distribution of Local Institutions and Supporting Actors in the French Offshore Wind Industry: Research & Education, Institutional Actors, Tertiary Services, and Combined All-Actor Overview.
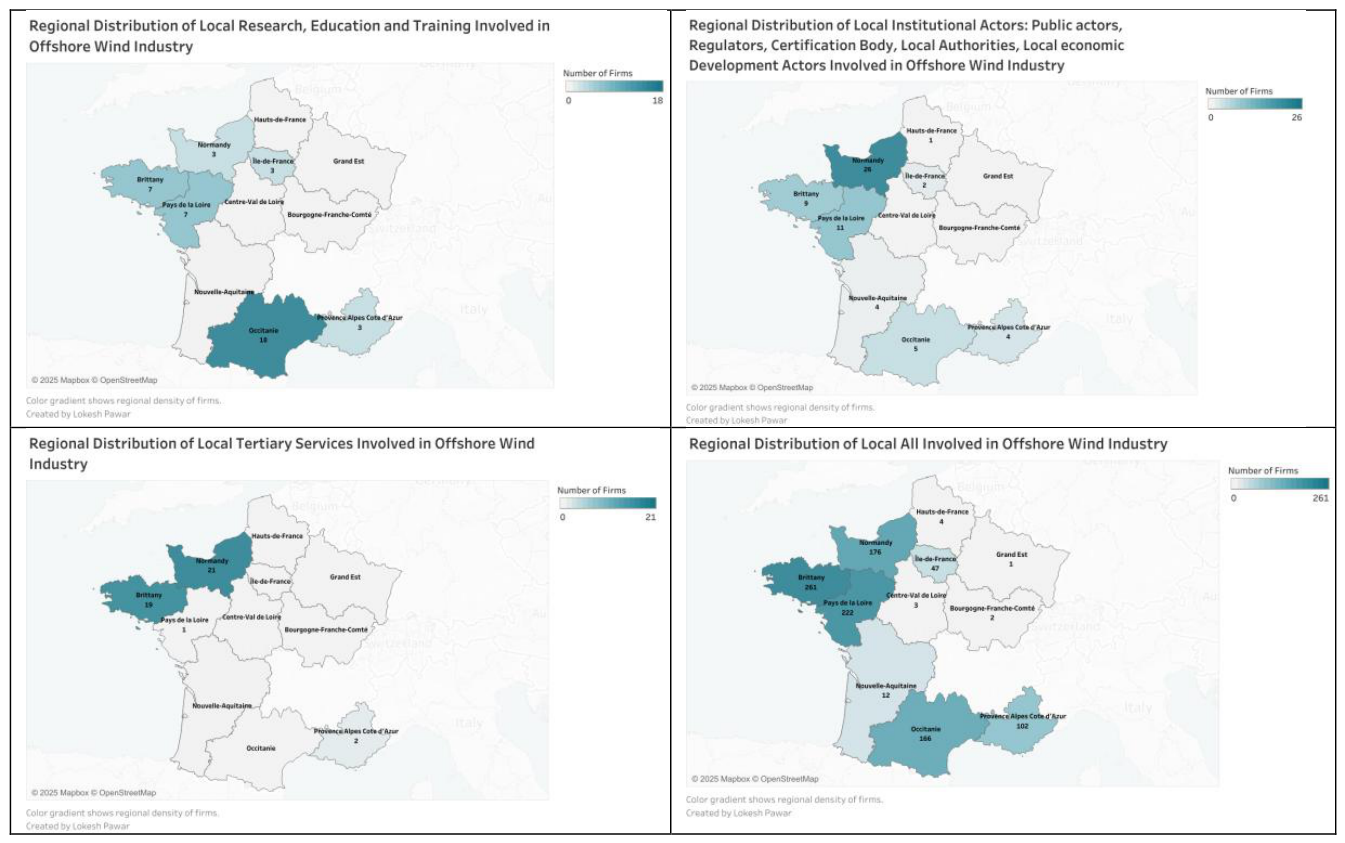
Figure 17.
Yearly Trend in Full-Time Employment (FTEs) in the French Offshore Wind Industry (2019-2023), with Annual Growth Rates.
Figure 17.
Yearly Trend in Full-Time Employment (FTEs) in the French Offshore Wind Industry (2019-2023), with Annual Growth Rates.
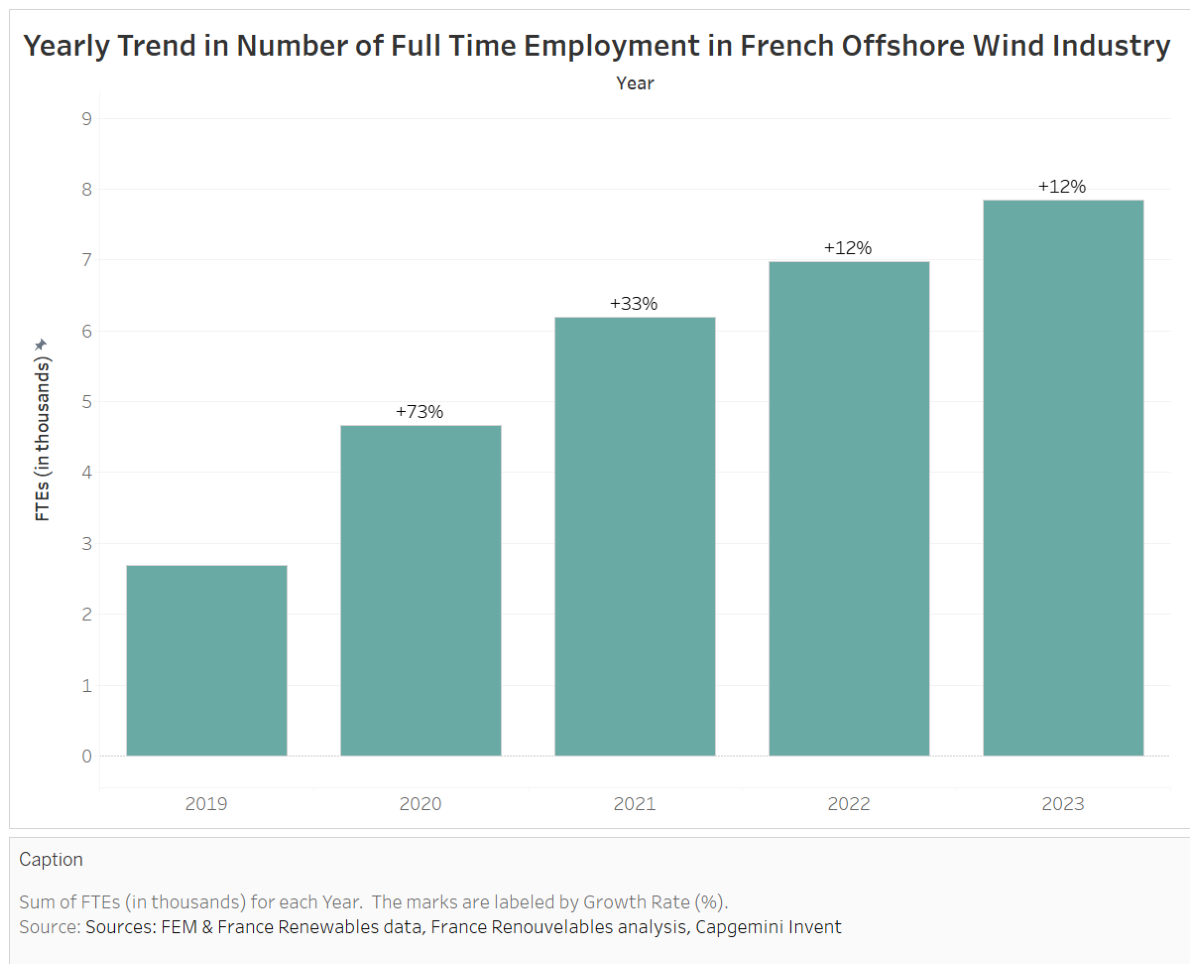
Figure 18.
Regional Distribution of Full-Time Equivalent (FTE) Employment in the French Offshore Wind Industry (2024).
Figure 18.
Regional Distribution of Full-Time Equivalent (FTE) Employment in the French Offshore Wind Industry (2024).
Disclaimer/Publisher’s Note: The statements, opinions and data contained in all publications are solely those of the individual author(s) and contributor(s) and not of MDPI and/or the editor(s). MDPI and/or the editor(s) disclaim responsibility for any injury to people or property resulting from any ideas, methods, instructions or products referred to in the content. |
© 2026 by the authors. Licensee MDPI, Basel, Switzerland. This article is an open access article distributed under the terms and conditions of the Creative Commons Attribution (CC BY) license.
Copyright: This open access article is published under a Creative Commons CC BY 4.0 license, which permit the free download, distribution, and reuse, provided that the author and preprint are cited in any reuse.


