

Submitted:
24 July 2026
Posted:
24 July 2026
You are already at the latest version
Abstract
Fresh paddy transported by barge in the Mekong Delta can accumulate respiration heat during journeys longer than 24 h, accelerating quality deterioration. This study evaluated forced aeration using a 1 m² × 2.5 m laboratory model (approximately 1.4 t) and field trials on a 60 t barge with aerated and non-aerated compartments. Fresh paddy (24.1 ± 1.35% wet basis) was aerated at an average superficial air velocity of 0.053 m s⁻¹, equivalent to 129 m³ h⁻¹ t⁻¹. Grain temperature, moisture content, airflow, static pressure, air enthalpy, and milling quality were measured. In field trials, aeration reduced grain temperature to approximately 29.0 °C after 6 h, close to ambient temperature (29.3 °C), whereas non-aerated paddy reached 37.8 °C. The temperature difference of approximately 10–11 °C was maintained during transportation. Mean specific heat removal was 616 kJ h⁻¹ t⁻¹, and cumulative thermal exposure decreased from 243.8 to 13.1 °C·h, corresponding to 94.6% suppression. Moisture content and most quality indicators did not differ significantly, while chalkiness decreased from 7% to 4%. Forced aeration can therefore stabilize high-moisture paddy during barge transportation and reduce heat-related quality loss.
Keywords:
forced aeration
; fresh paddy
; barge transportation
; grain temperature
; chalkiness
1. Introduction
Vietnam is an agricultural country characterized by a diverse range of crop products such as rice, maize, coffee, and pepper. Among these, rice is considered the most important staple crop, playing a crucial role not only in ensuring national food security but also in the global food market. Accounting for approximately 50% of the national rice production, the Mekong Delta is regarded as the granary of Vietnam, contributing about 90% of the country’s total rice export amount [1,2].
In recent years, the common practice among farmers in the Mekong Delta has shifted toward selling fresh paddy immediately after harvesting [2]. Subsequently, the fresh paddy at high moisture content (MC) is transported by traders to centralized drying and milling facilities within the region. Due to the dense network of canals and rivers and the lower cost of barge transport compared with trucking, road transport is largely impractical; therefore, inland waterway transport along rivers and canals is the main mode of transport [3].
Barge transportation is the primary means of transporting fresh paddy in the Mekong Delta. However, the relatively long transportation duration, beyond 24 hours, leads to quality deterioration, particularly moisture-induced yellowing, caused by heat accumulation within the bulk of paddy on the barge during transportation [4]. Even after being harvested and separated from the plant, paddy grains continue to sustain physiological activities, particularly respiration. This respiration process generates heat and alters the microclimate inside the grain bulk (including temperature, humidity, and gas composition), thereby causing heat accumulation and increasing the temperature of the paddy mass [5]. The energy released during aerobic respiration is approximately 674 kcal per mole of glucose, or about 374 kcal per 100 g of glucose [6,7]. Discoloration is caused by fungi, bacteria, and environmental conditions such as elevated humidity and temperature [8]. The higher the grain temperature during storage or transportation, the more intense the browning reactions become [9]. In addition, uniform moisture distribution and effective temperature management are required to prevent quality degradation [10].
The transportation period from harvesting to delivery at the processing plant and subsequent drying typically ranges from 3 to 7 days, as paddy is often accumulated during the peak harvest season [3]. Transportation-related losses are estimated at approximately 0.3% [11], and this study aims to assess quality losses during this stage in order to identify measures for their reduction. Based on experiences from grain drying and aeration practices, the application of aeration techniques for fresh paddy directly on barges during transportation has been proposed to evaluate the feasibility of this solution.
Existing aeration studies mainly focus on dried or partially dried grains under static storage conditions [12,13]. However, fresh paddy immediately after harvest exhibits significantly higher respiration rates, moisture heterogeneity, and metabolic heat generation, particularly under dynamic transportation conditions. Consequently, the thermodynamic behavior, airflow resistance, and heat removal efficiency observed in conventional storage aeration cannot be directly extrapolated to fresh paddy transported on barges.
Aeration is the process of forcing ambient air through a bulk of grain using a powered fan to enhance grain storability. This technique is widely applied in stored-grain management to modify the microclimate within the grain mass, thereby reducing or preventing the development of harmful organisms by lowering and stabilizing grain temperature [14]. However, due to differences in the moisture content of fresh paddy, which results in higher respiration heat [7], and differences in the aeration air conditions, the results of current studies may not be applicable to aeration of fresh paddy during transportation in the Mekong Delta, Vietnam.
1.1. Objectives
Therefore, this study aims to (i) investigate temperature behavior of fresh paddy under aeration in the experimental model and on barges, (ii) analyze airflow resistance in deep paddy layer, and (iii) evaluate the effect of aeration on grain quality during transportation. Moreover, this research also has strong practical relevance, as it contributes to assessing the feasibility of an aeration-based solution aimed at reducing postharvest losses during the transportation stage.
2. Materials and Methods
The study was conducted with two main components: experiments on a laboratory-scale model and field trials on a barge during transportation. The primary parameter monitored and measured during the experiments was the grain temperature under aeration, which was used to evaluate grain quality in comparison with control samples under non-aerated conditions. In addition, other parameters affecting the aeration process were also monitored and measured, including grain moisture content, temperature and humidity of the aeration air and ambient air, as well as the airflow rate, static pressure, and surface air velocity of the aeration airflow.
The material used in this study are fresh paddy, specifically common varieties cultivated in the Mekong Delta such as OM18, which are characterized by a short growth duration and high yield. After harvesting, paddy typically has a high moisture content 24.1 ± 1.35%, making it susceptible to quality deterioration if aeration and appropriate postharvest handling are not applied promptly. When the moisture content exceeds 15%, the risks of mold growth and insect infestation increase markedly, and the respiration rate of the grains rises significantly, leading to deterioration in quality and storage stability [15].
2.1. Laboratory-Scale Aeration Model
As shown in Figure 1, the aeration model used in this study was designed with fixed dimensions and a constant height of 2.5 m [3,16], corresponding to the height of the fully loaded paddy bulk on a transport barge with a capacity of 60 tons under practical operating conditions. The paddy aeration model was fabricated at an experimental scale with a cross-sectional area of 1 m² and a grain bulk height of 2.5 m, corresponding to a paddy load of approximately 1.4 ton at an initial moisture content of 24.1 ± 1.35%.
Figure 1.
Experimental model (+ 3D) for fresh paddy aeration. 1. Sensors; 2. Paddy; 3. Wall; 4. Static pressure measuring point; 5. Air duct; 6. Blower; 7. Frame; 8. Perforated screen.
Figure 1.
Experimental model (+ 3D) for fresh paddy aeration. 1. Sensors; 2. Paddy; 3. Wall; 4. Static pressure measuring point; 5. Air duct; 6. Blower; 7. Frame; 8. Perforated screen.
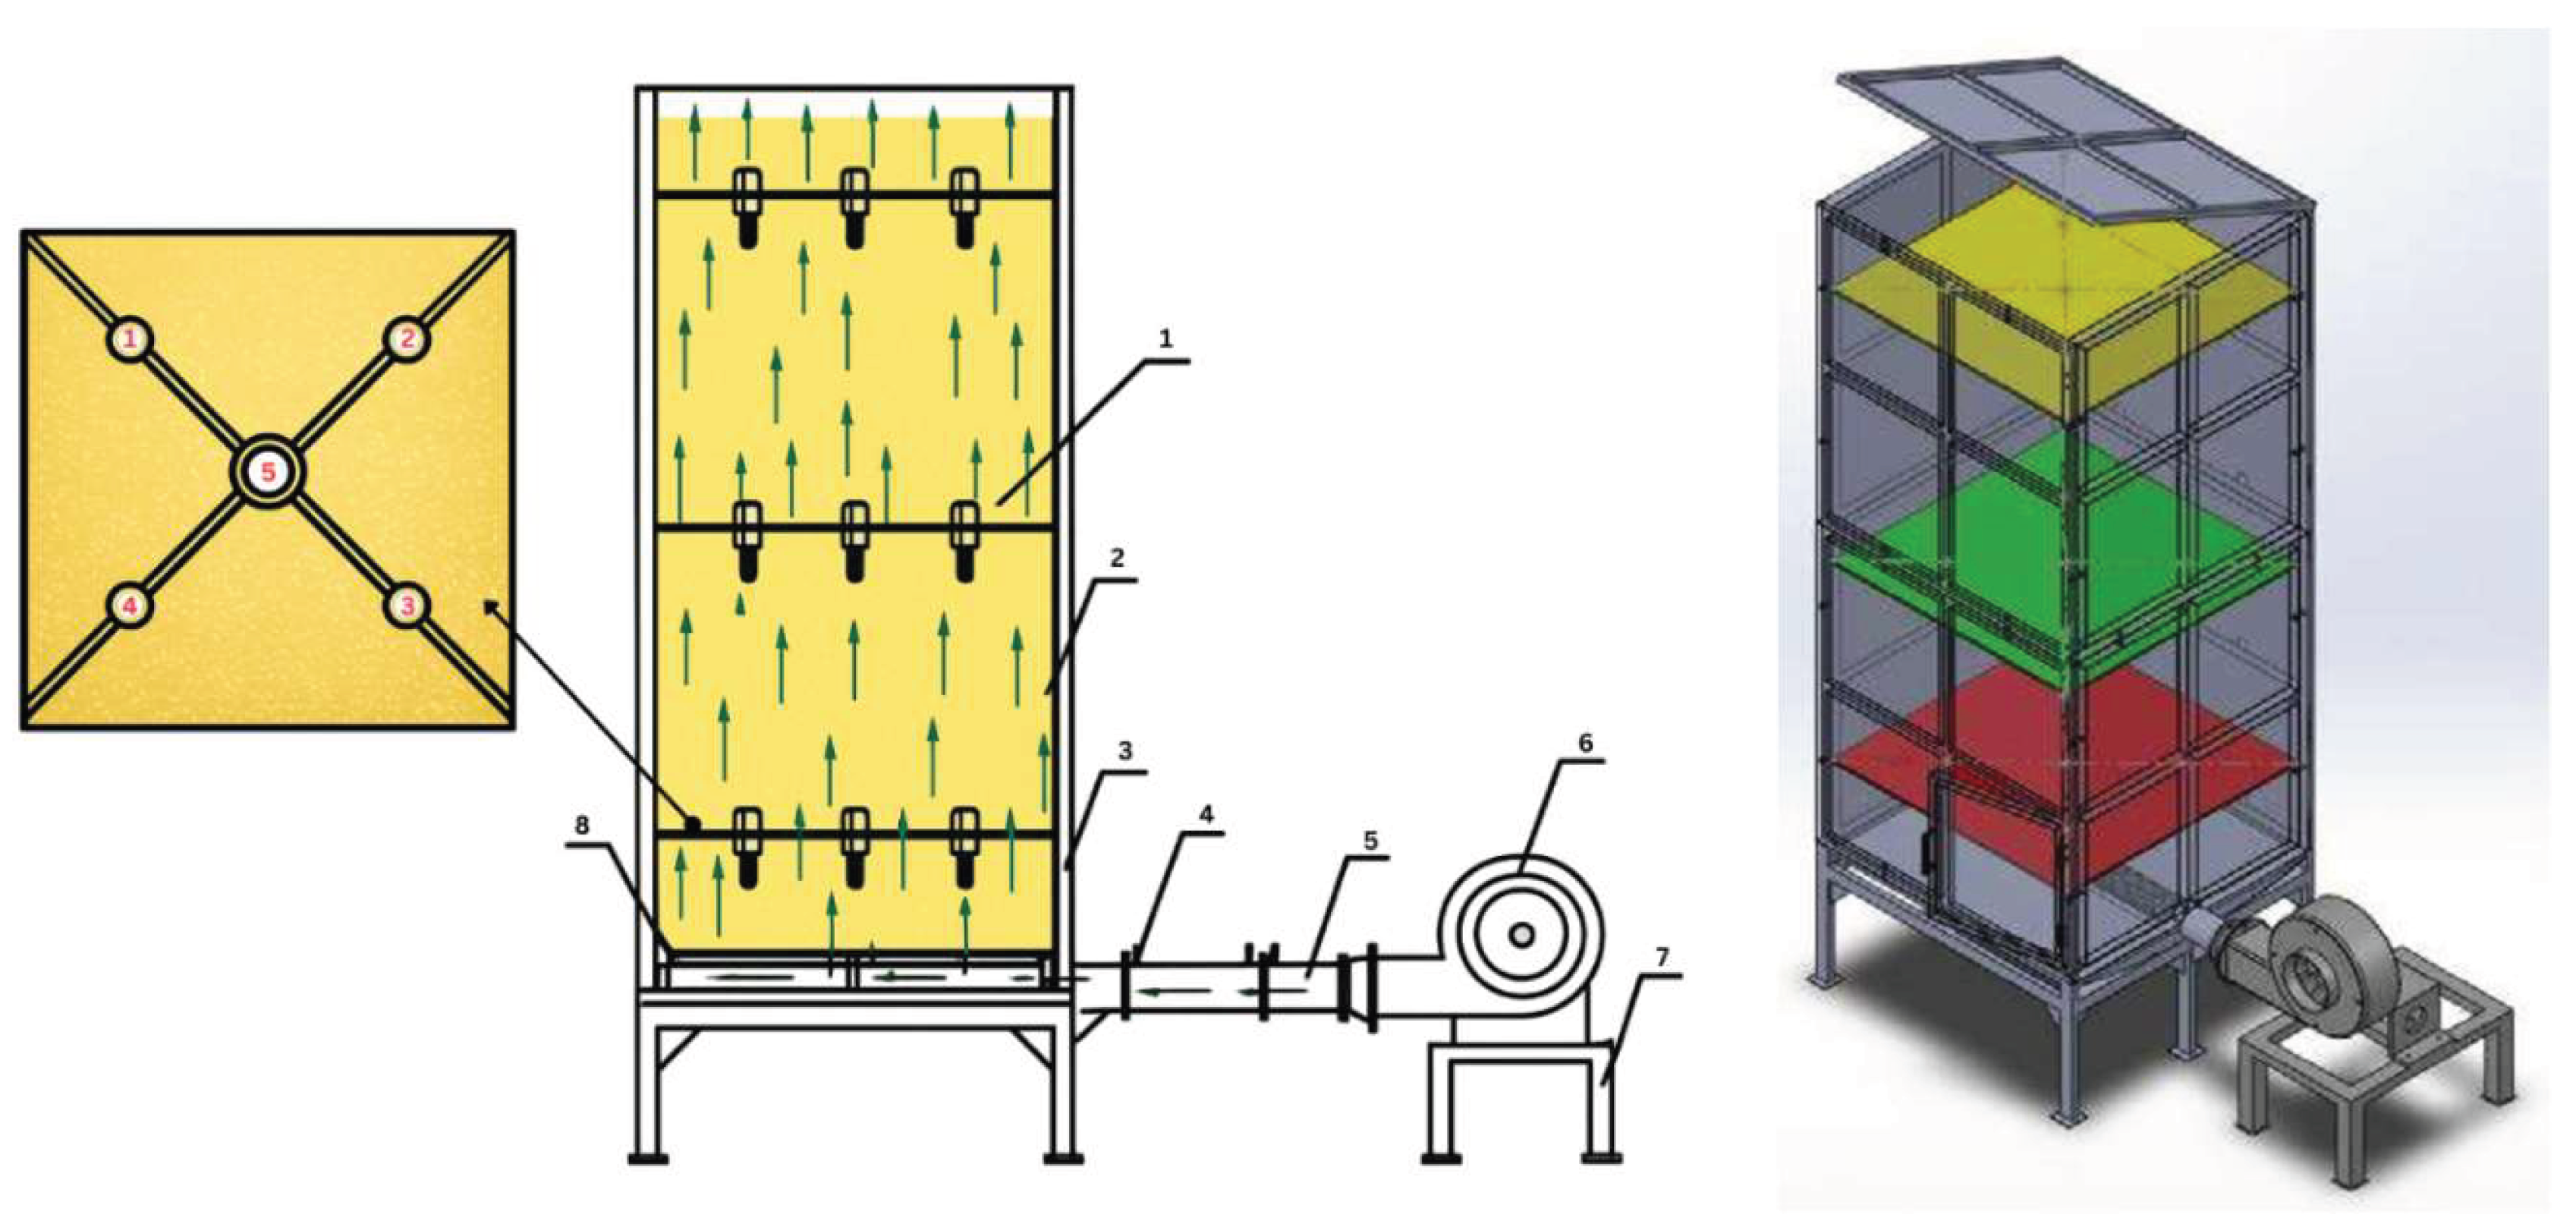
The aeration model consisted of a vertical steel grain bin with a sealed bottom and side sampling ports for observation. The aeration system was equipped with a centrifugal blower that supplied ambient air into the bottom of the bin and directed it upward through the grain bulk. The airflow rate was adjustable and set to a specific level commonly required for grain storage aeration, approximately 120 m³ h⁻¹ ton⁻¹ [12,17]. An air duct and distribution system made of perforated pipes was installed at the bin base to ensure uniform air distribution across the grain cross-section. Grain temperature and relative humidity were monitored using 15 sensors placed in three vertical layers (bottom, middle, and top), with five sensors per layer. All sensors were connected to a data logger for continuous data acquisition and storage, allowing subsequent data transfer for analysis. To minimize confounding effects, the aerated and non-aerated compartments were located on the same barge, sharing identical environmental and transportation conditions.
2.2. Experiments Conducted on a Barge During Transportation
The barge experiment was conducted during paddy transportation over two days, on April 16 and 17, 2025, in the Mekong Delta, Vietnam. For a total load of 60 tons, the barge was divided into two storage compartments: one compartment (A) was aerated, while the other compartment (B) was not aerated and used as the control (Figure 2). This aeration system consists of four main components, including a diesel engine, a centrifugal fan, air ducts, a perforated screen, a supporting frame, and the barge sidewalls.
Operating principle: Paddy was loaded into the barge above the perforated screen with a total load of 60 ton, corresponding to a grain bulk height of 2.5 m at the middle section. Driven by a 12-HP diesel engine, the centrifugal fan supplied aeration airflow that was forced through the grain bulk.
2.3. Measurement, Monitoring Temperature, MC of Grain and Aeration Airflow
Measurement procedures, instrumentation, and evaluation parameters were consistent with those of the model experiment, encompassing temperature, relative humidity, airflow rate, and grain quality after transportation. This setup enabled direct comparison between transportation conditions under the same temporal framework.
Temperature: The temperature inside the grain bulk was continuously monitored using sensors installed at different depths within the paddy layers in the barge (Figure 3), for both with and without aerated compartments. Each treatment in the barge included aerated and non-aerated conditions. A total of 15 temperature sensors were installed at three layers (top, middle, and bottom), with five sensors in each layer. The sensors were connected to a central control display and an automatic data-logging system, Hioki LR8450. In addition, ambient temperature at the experimental site was measured using a Lutron AM-4250A device and a dry–wet bulb hygrometer.
MC of grain: Grain moisture content was measured every 2–3 h using Kett PM-600 and Riceter F511 moisture meters and verified by the oven-drying method (Figure 5 and Figure 6) with 30-g samples dried at 105 °C, with an accuracy of ± 2.64%. Samples were collected using a specialized grain sampler and thoroughly mixed to ensure representativeness of the bulk paddy. Samples were collected at five vertical levels with five sampling points per level in the model, and similarly in the experimental barge, under both aerated and non-aerated conditions. It was calculated using the following formula:
where MC is the moisture content of grain (%); Mw is the mass of wet grain (g); Md is the mass of dry grain (g).
Airflow and static pressure: The air velocity exiting at the surface of the paddy layer in both the model and the barge was measured at multiple points. The static pressure of the airflow through the grain bed in the model was measured at different depths under various airflow rates. The corresponding grain bed heights were 0.5, 1.0, 1.5, and 2.0 m. Pressure was measured using a Lutron AM-4250A anemometer, with a measuring range of 0 – 5000 Pa, a resolution of 1 Pa, and an accuracy of ± 0.3%, combined with a Pitot tube for measuring total pressure. Air velocity was measured using a Mastech MS6252A anemometer with a measuring range of 0.8 – 40 m s⁻¹ and an accuracy of ± 2%.
The static pressure of the airflow through the grain layer was measured and computed based on the following equation [7,18]:
where: P is the static pressure (Pa); h is the height of the grain layer (m); V is the exit velocity of airflow (m/s); a and b are coefficients (a = 25700 and b = 13.2 for paddy).
2.4. Thermodynamic Analysis with Energy Balance and Efficiency of Respiration-Heat Removal
A temperature reduction alone does not fully describe the thermodynamic performance of aeration. Therefore, the results were determined using an energy balance on the paddy bulk [7,19]:
where Qresp is respiration heat generation, Qloss represents passive heat exchange with the surroundings, and Qremoved is the heat carried away by forced airflow.
The energy balance analysis assumes quasi-steady airflow, negligible latent heat of evaporation due to limited moisture removal, and uniform intergranular air properties at the outlet. Heat losses through the barge walls were considered secondary compared with forced convective heat removal.
The enthalpy of the ambient air used for aeration and the exhaust air after aeration were calculated to determine the amount of heat removed during the aeration process, as follow [19]:
where mair is the mass of aeration airflow (kg); hout and hin are enthalpy of outlet and inlet aeration airflow (kJ kg-1).
Enthalpy was evaluated based on air temperature, relative humidity, saturation vapor pressure, and humidity ratio using the following equations [20,21]:
With the compressed wet air (100 ‒ 600 kPa) is still within the low-pressure range, the formula for calculating the enthalpy of wet air at atmospheric pressure is
where ps is the saturation vapor pressure of inter-granular air at temperature T (Pa); w is the humidity ratio of air at dry-bulb temperature T (g kg-1), patm is atmospheric pressure (101,325 Pa); and h is the enthalpy of air (kJ kg-1).
In addition, the temperature-based suppression effectiveness was calculated to quantify the attenuation of temperature rise in the grain bulk relative to the non-aerated condition, based on temperature differences with respect to the ambient temperature, as following equation [14]:
where AATaer is the reduction in temperature in the grain bulk, reflecting the effectiveness of aeration in suppressing heat accumulation (°C.h).
where Ti is the temperature of the grain bulk at the ith measurement (°C); Tamb.i is the corresponding ambient temperature (°C); Δt is the time interval between two consecutive measurements (h).
2.5. Testing of Grain Quality and Economic Evaluation
In evaluating grain quality, in addition to the chalkiness index, other quality parameters were also assessed based on the analysis of paddy samples from the aerated treatment and the non-aerated treatment used as the control. Paddy samples were collected at three vertical levels in both the model and the barge before and after the aeration process. These parameters including moisture content, head rice recovery, whiteness, transparency, protein content, amylose content, and, most importantly, the chalkiness ratio was determined using a milling meter (MM1D), with a range 0.01 - 8.00%.
2.6. Data Analysis
Each experiment was performed three times, with three replicates per treatment. Experimental data were subjected to analysis of variance (ANOVA), and differences among means were evaluated using the least significant difference (LSD) method at the 5% level of significance. The results are expressed as mean ± standard deviation.
3. Results and Discussion
3.1. Temperature Profile of Grain in Aeration Process
The results indicate a clear temperature variation trend between the initial stage and the steady-state stage of the aeration process in the experimental model (Figure 7). Immediately after harvesting, due to intense grain respiration, the initial temperature of the paddy bulk was higher than the ambient temperature, reaching an average of approximately 35.5 ± 0.01 °C. Once the aeration system was operated, the airflow supplied from the bottom of the model rapidly reduced the temperature within the grain bulk. After approximately 4 hours of operation, the average temperature at different layers decreased to 27.1 ± 0.31 °C and remained stable at around 27.8 °C throughout the experimental period.
The paired t-test showed a significant difference in temperature between grain bulk aerated in the model and ambient, with mean values of 27.3 ± 0.53 °C and 30.4 ± 1.88 °C, respectively (t = −6.68, df = 14, p < 0.001). This shows that temperature of grain in the aeration model was significantly lower than ambient temperature under the same paired conditions. The mechanism of this temperature reduction is attributed to the fact that the ambient air, although having a relatively high temperature during hot sunny periods, when passing through the grain bulk not only removes the metabolic heat generated within the paddy mass but is also cooled as it exchanges heat with the water vapor produced by the respiration of the grain bulk.
As shown in Figure 8, the grain temperature on the barge during transportation differed markedly and was statistically significant between the aerated and non-aerated treatments (t-test, p < 0.05). After 6 h of aeration, the grain temperature in the aerated treatment decreased to 29.0 °C, which was comparable to the ambient temperature (29.3 °C) and substantially lower than that in the non-aerated treatment (37.8 °C). Results of the paired t-test confirmed a significant effect of aeration on grain temperature (t = −9.81, p < 0.001), with the aerated paddy exhibiting a substantially lower mean temperature than the non-aerated paddy. This lower temperature range, with a difference of approximately 10 – 11 °C, was maintained throughout the transportation period. In addition, the results indicated that, non-aerated, the grain bulk temperature consistently remained 7.2 – 9.8 °C significantly higher than the ambient temperature, due to the heat generated by grain respiration that was not effectively dissipated (> LSDα=0.05 = 1.577 oC; df_error = 20; MSE = 3.1451). This result is consistent with previous aeration studies, in which the grain temperature was maintained at approximately 11.8 °C lower than the ambient temperature [21].
3.2. Volume, Velocity and Static Pressure of Airflow in Aeration Process
Variations in superficial air velocity and static pressure with grain layer height are observed. As the grain bed height increases from 0.5 to 2.0 m, both the superficial air velocity and the corresponding static pressure increase consistently for all operating conditions. At a grain height of 0.5 m, superficial air velocity ranges from 0.020 to 0.052 m s-1 with static pressure between 5 and 25 Pa, whereas at 2.0 m these values rise to 0.076 – 0.153 m s-1 and 56 – 228 Pa, respectively. This trend indicates that a higher grain layer imposes greater resistance to airflow, requiring higher pressure to maintain adequate air movement through the porous paddy bed.

Table 1.
Superficial air velocity and static pressure versus grain layer height.
| Height of grain layer, m | Superficial air velocity, m s-1 | Static pressure, Pa | Superficial air velocity, m s-1 | Static pressure, Pa | Superficial air velocity, m s-1 | Static pressure, Pa | |
| 2.0 | 0.153 | 228 | 0.117 | 132 | 0.076 | 56 | |
| 1.5 | 0.122 | 140 | 0.094 | 85 | 0.061 | 35 | |
| 1.0 | 0.087 | 74 | 0.066 | 41 | 0.043 | 17 | |
| 0.5 | 0.052 | 25 | 0.037 | 13 | 0.020 | 5 |
In addition, the relationship between static pressure and superficial air velocity demonstrates the typical airflow behavior in granular media (Figure 9). As airflow rate increases, static pressure rises nonlinearly due to frictional losses and inter-particle resistance within the grain mass.
The results confirm that airflow distribution is strongly dependent on grain layer height, and excessive bed depth can significantly increase energy demand for aeration systems. In practice, the engine operates at higher power when the barge is fully loaded.
As airflow rate increases, static pressure rises nonlinearly due to frictional losses and inter-particle resistance within the grain mass. The results confirm that airflow distribution is strongly dependent on grain layer height, and excessive bed depth can significantly increase energy demand for aeration systems.
Experimental results of the aeration system indicated a superficial air velocity of 0.053 m s-1, corresponding to a specific airflow rate of 129 m³ h-1 ton-1. Thus, the required aeration airflow rate for a 60-ton barge was calculated to be 2.2 m³ s-1. This value is also comparable to the specific airflow rate commonly required for aeration in grain storage, which is about 120 m³ h-1 ton-1 [12,17].
3.3. Heat Removal and Temperature-Based Suppression Effectiveness
Based on the measured air temperature and relative humidity, the mean enthalpy values of the ambient air used for aeration and the exhaust air after aeration were 87.4 and 91.2 kJ kg⁻¹, respectively (Figure 10). The enthalpy rise demonstrates that aeration removes heat from the grain bulk. The mean enthalpy increase was 3.8 kJ kg-1 of air, and the specific heat transfer rate (Qremoved) was calculated as 616 kJ h-1 ton-1. However, the enthalpy increase was highest during the first 3 hours of aeration, reaching 14.4 kJ kg-1 of air, corresponding to a specific heat transfer rate (Qremoved) of 2,333 kJ h-1 ton-1. This indicates that the aeration air removed the heat generated by grain respiration from the paddy bulk.
According to the respiration equation, 1 mol of glucose (i.e., 180 g) releases 2,820 kJ during respiration, equivalent to 15.7 MJ kg⁻¹ of glucose [6]. Therefore, the dry mass loss (DML) corresponding to the average heat release of 616 kJ h⁻¹ ton⁻¹ was calculated to be 0.039 kg h⁻¹ ton⁻¹ for fresh paddy at a moisture content of 24.1 ± 1.35%.
The aerated compartment showed a significantly reduced thermal exposure (AATaer = 13.1 °C·h) compared with that for the non-aerated compartment (AAT = 243.8 °C·h), corresponding to the reduction of 94.6% in thermal exposure. Accordingly, the temperature-based suppression effectiveness of heat accumulation generated from respiration was 0.946, indicating that aeration suppressed nearly 95% of the cumulative temperature rise above ambient that otherwise persists non-aerated. After confirming data normality, ANOVA was employed to evaluate the effect of aeration on temperature.
Table 2.
Thermal dynamic performance indicators for on-barge transportation.
| Parameters | Unit | Aerated | Non-aerated |
| Monitoring time | h | 30 | 30 |
| Mean ambient temperature | °C | 30.4 | 30.4 |
| Mean elevation above temperature | °C | -1.3 | 7.8 |
| Maximum grain temperature | °C | 29.0 | 38.6 |
| Thermal expose (AAT) | °C·h | 13.1 | 243.8 |
| AAT reduction | % | 94.6 | |
| Mean heat removed (Qremoved) | kJ h-1 ton-1 | 616 | |
| Peak heat removed (Qremoved, peak) | kJ h-1 ton-1 | 2,333 |
3.4. Grain Moisture Content
Based on the data, the difference in moisture content between the aerated and non-aerated conditions across the top, middle, and bottom layers is relatively small. The average moisture values in the top layer are 23.5% aerated and 22.0% non-aerated, while the middle layer shows 23.4% and 22.9%, respectively. For the bottom layer, the corresponding values are 25.1% aerated and 26.5% non-aerated. Although minor fluctuations appear at individual measurement times, the relatively low standard deviations (0.32 – 1.82) indicate a stable moisture distribution throughout the paddy bulk. Overall, no statistically meaningful difference in moisture content can be observed between the aerated and non-aerated cases.
Table 3.
Variation of moisture content (%) of paddy layers during barge transportation with and non-aerated.
Table 3.
Variation of moisture content (%) of paddy layers during barge transportation with and non-aerated.
| Time | Top layer | Middle layer | Bottom layer | |||
| Aerated | Non-aerated | Aerated | Non-aerated | Aerated | Non-aerated | |
| 4/16/25 4:00 PM | 23.3 | 21.4 | 24.8 | 25.2 | 25.1 | 24.6 |
| 4/16/25 9:00 PM | 25.2 | 21.4 | 21.0 | 21.4 | 24.6 | 25.2 |
| 4/17/25 12:00 PM | 22.8 | 22.0 | 22.8 | 21.4 | 25.5 | 29.3 |
| 4/17/25 5:30 PM | 22.8 | 23.1 | 24.8 | 23.4 | 25.2 | 26.8 |
| Average | 23.5 | 22.0 | 23.4 | 22.9 | 25.1 | 26.5 |
| Std | 0.99 | 0.69 | 1.58 | 1.58 | 0.32 | 1.82 |
In addition, the temporal variation in moisture content is negligible, with only slight changes recorded over the measurement period. This behavior is consistent with the main objective of the aeration process, which is to reduce and control the temperature of the paddy mass rather than to remove moisture. The forced airflow primarily enhances heat exchange and suppresses heat accumulation caused by grain respiration, while its drying effect under the experimental conditions is limited. Therefore, aeration contributes to thermal stabilization of the paddy bulk without significantly altering its moisture content during short-term transportation or storage.
3.5. Grain Quality and Evaluation of Aeration Effectiveness
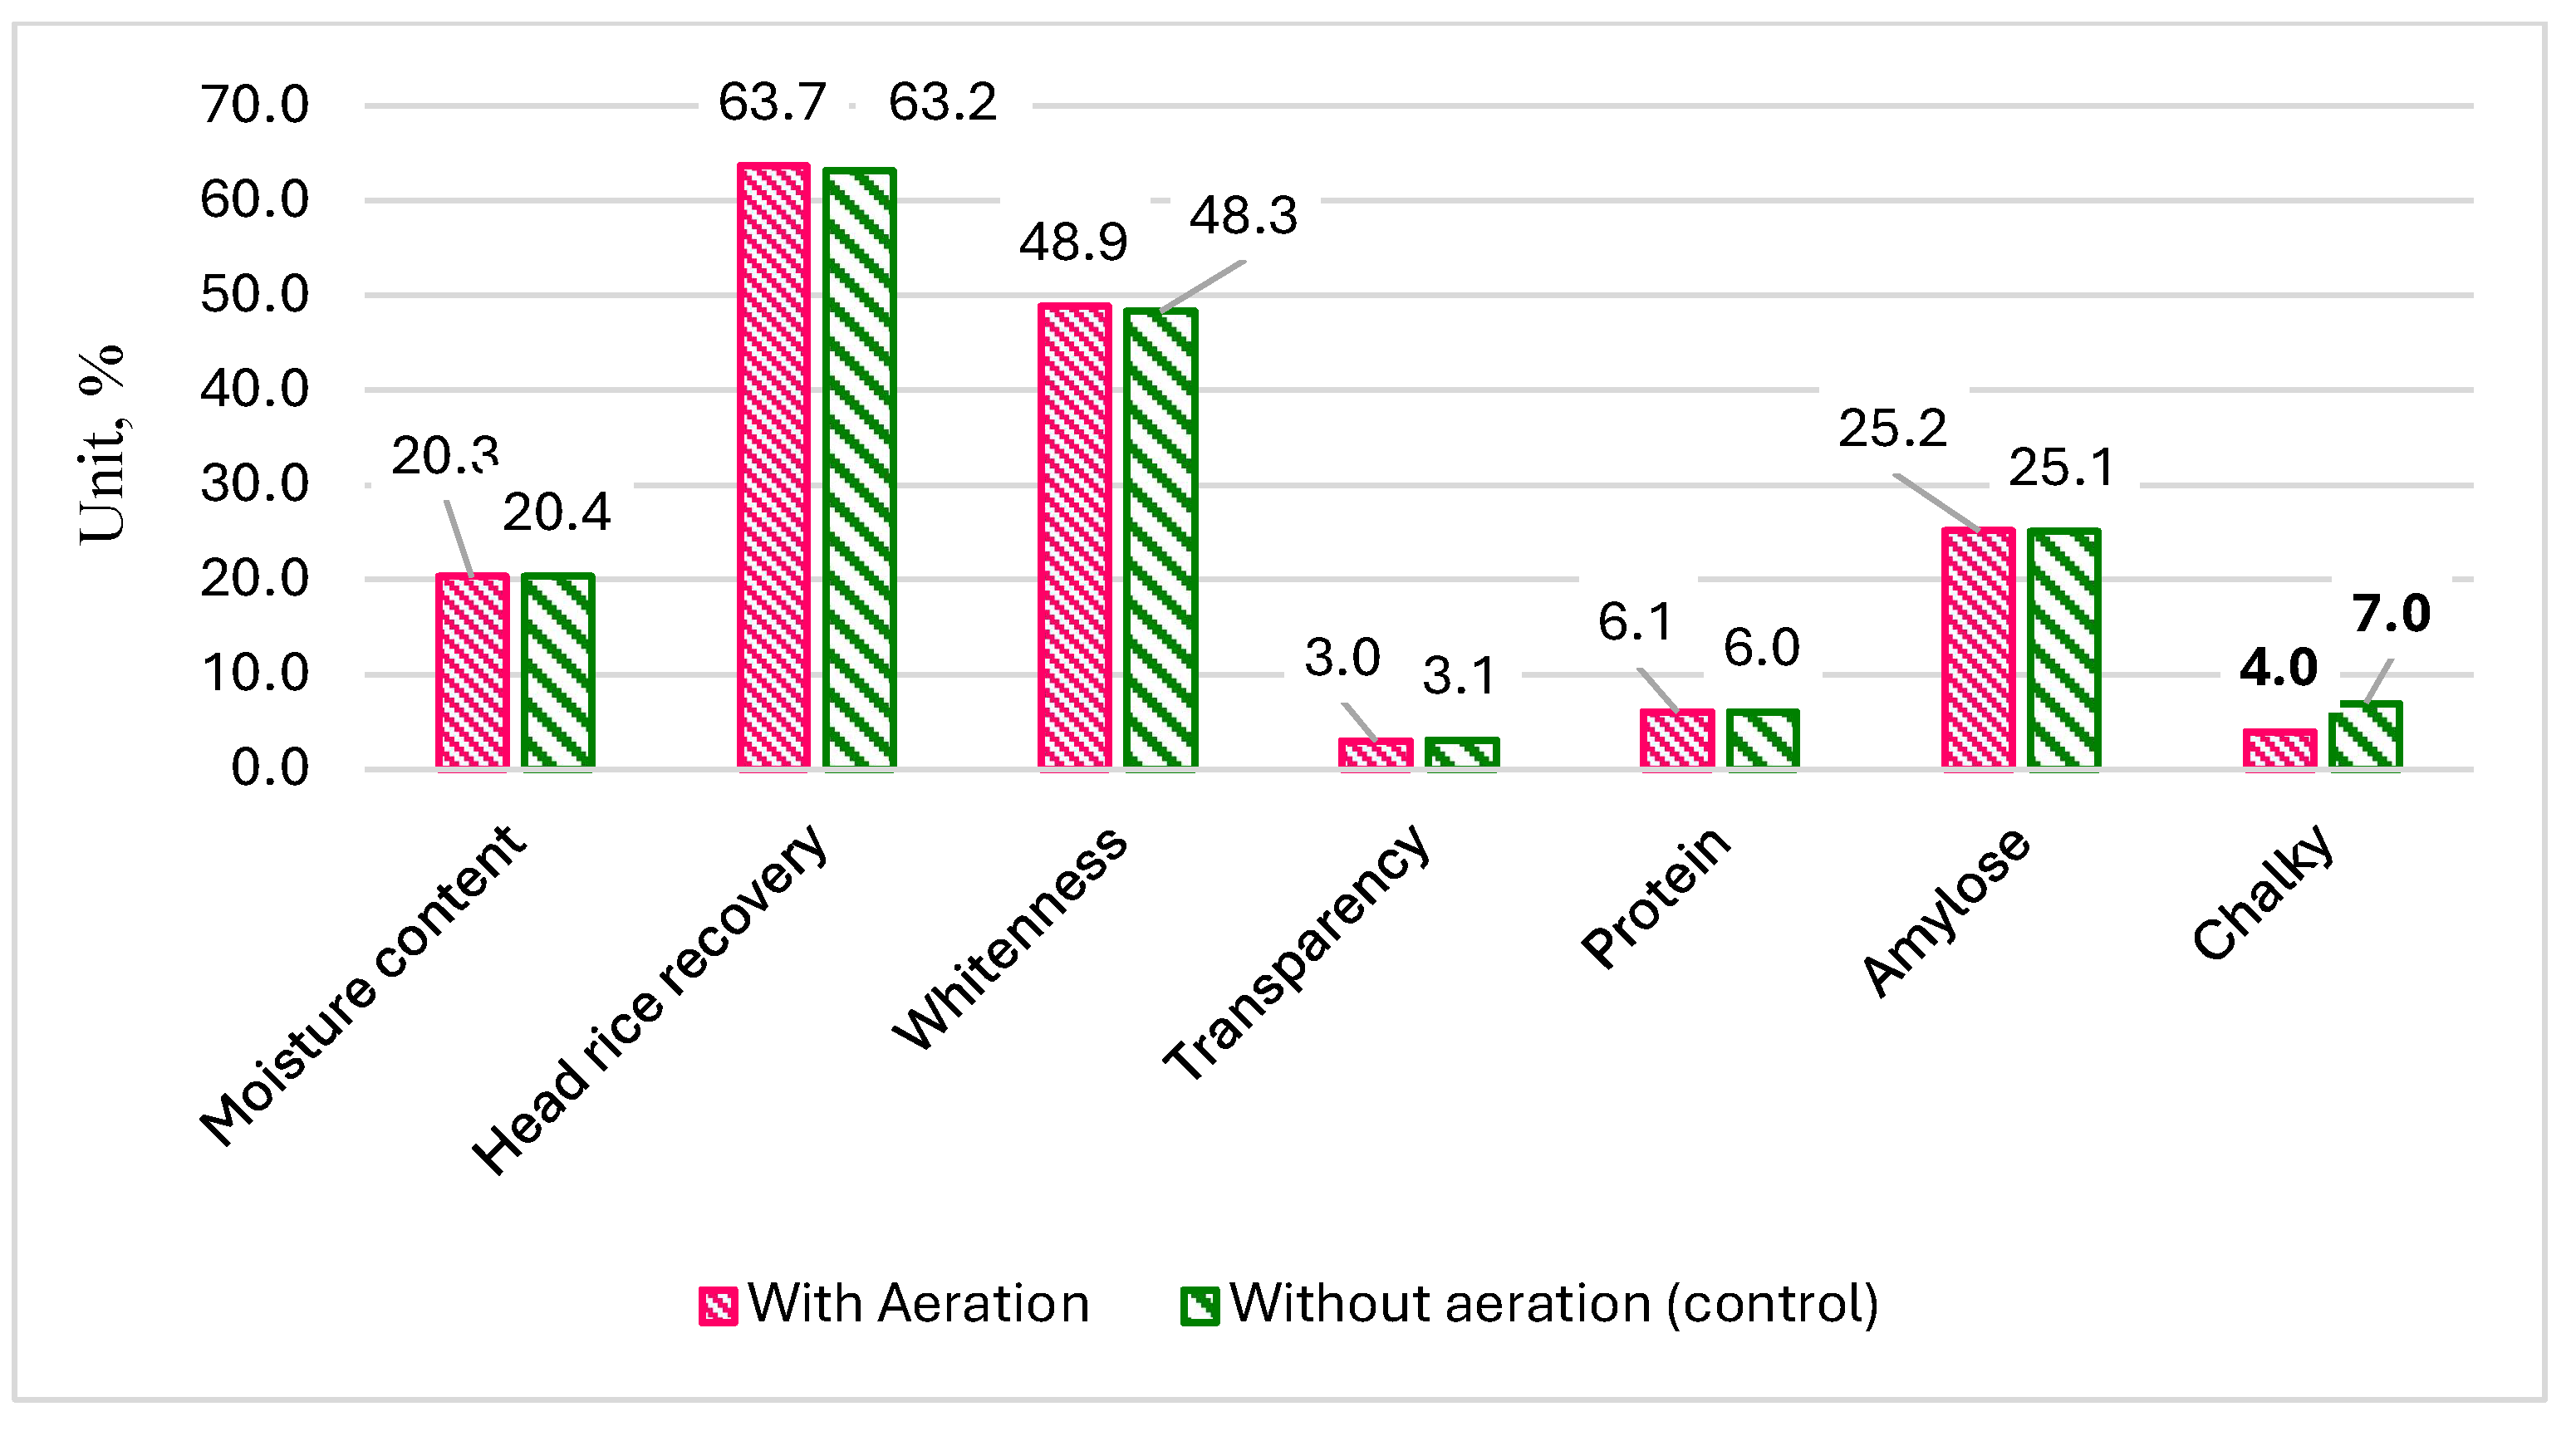
A pronounced difference in the chalkiness indicator was observed between the aerated and non-aerated treatments (4% and 7%, respectively), whereas the other quality parameters did not differ significantly between the two treatments (Figure 11). In practice, a 3% reduction in chalkiness corresponds to an approximately 3% increase in the economic value of milled rice. Based on the current rice price of about 780 USD per ton, and an annual paddy production of approximately 24 million tons, application of this system suggests a considerable potential for reducing economic losses at regional scale.
Chalkiness formation in rice grains is strongly associated with thermal stress and non-uniform starch granule packing during postharvest respiration. Elevated temperatures accelerate enzymatic activity and moisture migration, leading to microstructural disruption within the endosperm. By maintaining the grain temperature close to ambient conditions, aeration suppresses respiration intensity and reduces thermal gradients, thereby mitigating the development of chalky kernels.
In addition, the reduction in chalkiness was also used to evaluate the economic effectiveness of each shipment with a carrying capacity of 60 tons. With an investment cost of the aeration system for 2,000 USD on the barge, a fuel consumption of 1.2 L h⁻¹ for the 12-HP engine driving the blower, and a 1.5% reduction in rice price caused by chalkiness, the net benefit was calculated to be 11.2 USD ton⁻¹. Thus, application of the aeration engineering has a substantial potential for economic efficiency and contribute to reducing postharvest losses during the transportation stage of fresh paddy in Mekong Delta, Vietnam. Furthermore, a sensitivity analysis considering ± 20% variations in fuel cost, rice price, and chalkiness-related price penalties indicates that the aeration system remains economically viable under most realistic market scenarios.
4. Conclusions
This study demonstrated the effectiveness of aeration applied to fresh paddy during barge transportation for controlling grain temperature and mitigating quality deterioration in the Mekong Delta, Vietnam. The temperature of the aerated paddy bulk in both the model and the barge during transportation was lower than the ambient air temperature and the temperature of the non-aerated paddy bulk. Enthalpy analysis confirmed that aeration continuously removed the heat generated by grain respiration from the inter-granular spaces, preventing thermal accumulation within the bulk. By maintaining a lower and more stable thermal condition, aeration effectively suppressed moisture-related browning reactions and microbial activity. Consequently, the chalkiness ratio of aerated grain was lower than that of the non-aerated treatment, contributing to reduced quality loss during transportation and improved commercial value. Overall, this aeration technique shows strong potential for practical implementation in fresh paddy logistics and offers a feasible solution for reducing postharvest losses in the Mekong Delta, Vietnam.
Supplementary Materials
The following supporting information can be downloaded at the website of this paper posted on Preprints.org. Supplementary Data S1: Original and processed experimental data, statistical analyses, thermodynamic calculations, grain-quality results, and economic evaluation for the fresh paddy aeration experiments (Microsoft Excel workbook).
Author Contributions
Conceptualization, Duc Anh Le and Nghi Thanh Nguyen; Methodology, Hieu Van Nguyen and Nghi Thanh Nguyen; Validation, Duc Anh Le and Nghi Thanh Nguyen; Formal analysis, Hieu Van Nguyen; Investigation, Hieu Van Nguyen and Nghi Thanh Nguyen; Resources, Hieu Van Nguyen and Nghi Thanh Nguyen; Data curation, Duc Anh Le and Nghi Thanh Nguyen; Writing – original draft, Hieu Van Nguyen and Nghi Thanh Nguyen; Writing – review & editing, Hieu Van Nguyen and Nghi Thanh Nguyen; Visualization, Duc Anh Le; Supervision, Duc Anh Le; Project administration, Nghi Thanh Nguyen; Funding acquisition, Nghi Thanh Nguyen. All authors have read and agreed to the published version of the manuscript.
Funding
This research was funded by the Ministry of Education and Training, Vietnam, grant number B2024-NLS-01 (Decision No. 1918/QĐ-BGDĐT).
Institutional Review Board Statement
Not applicable.
Informed Consent Statement
Not applicable.
Data Availability Statement
The original contributions presented in this study are included in the article and Supplementary Data S1. Further inquiries can be directed to the corresponding author.
Acknowledgments
The authors thank Nong Lam University Ho Chi Minh City and the Faculty of Engineering and Technology for institutional and technical support. The authors also thank Tran Van Hai, the owner of the fresh paddy transportation barge, for permitting installation and field testing of the aeration system during transportation. During the preparation of this manuscript, the authors used ChatGPT (OpenAI, GPT-5) for language editing and formatting assistance. The authors reviewed and edited the output and take full responsibility for the content of this publication.
Conflicts of Interest
The authors declare no conflicts of interest.
References
- Bich, N.H.; Nghi, N.T. A study on greenhouse gas emissions of paddy cultivation mechanization in Mekong Delta, Viet Nam. Int. J. Adv. Sci. Eng. Inf. Technol. 2023, Vol.13(No. 3). [Google Scholar] [CrossRef]
- Nghi, N.T.; Hieu, N.V.; Joseph, M.S.; Hung, N.V. Assessment of combine harvesters used in rice production in Mekong Delta, Vietnam. IOP Conf. Ser. Earth Environ. Sci. 2025, 1465, 012015. [Google Scholar] [CrossRef]
- Hieu, N.V.; Duc, L.A.; Nghi, N.T. Modeling of fresh paddy aeration on transporting barges in Mekong Delta, Vietnam. J. Agric. Dev. 2024, 23 (Special(issue 1), 188–195. [Google Scholar] [CrossRef]
- Hung, N.V.; Tuan, T.V.; Meas, P.; Tado, C.J.M.; Kyaw, M.A.; Gummert, M. Best practices for paddy drying: case studies in Vietnam, Cambodia, Philippines, and Myanmar. Plant Prod. Sci. 2018. [Google Scholar] [CrossRef]
- Prissa, O.; Hutsolb, T.; Glowackid, S.; Bulhakova, P.; Bakhlukovae, K.; Osokinaf, N.; Nurekg, T.; Horetskah, I.; Mykhailovai, L. Effect of asparagus chitosan-rutin coating on losses and waste reduction during storage. Agric. Eng. 2024, Vol. 28(No.1), 99–118. [Google Scholar] [CrossRef]
- Kretovick, V. L.; Prokhorova, A. P. Respiration intensity of cereal grains as influenced by moisture content and temperature. J. Stored Prod. Res. 2005, 41(2), 123–135. [Google Scholar]
- Brooker, D.B.; Bakker-Arkema, F.W.; Hall, C.W. Drying and Storage of Grains and Oilseeds; Springer Science & Business Media: Berlin, 1992. [Google Scholar]
- Gummert, M.; Nguyen, H. V.; Cabard, C.; Quill y, R.; Aung, Y. L.; Tant, A. M.; Kyaw, M. A.; Labi s, R.; Htwe, N. M.; Singlet n, G. R. Assessment post-harvest l sses and carbn tprint in intensive l wland rice pr ducti n in Myanmar. Sci. Rep. 2020, 10(1), 19797. [Google Scholar] [CrossRef]
- Fatharani, A.; Susanti, D. Y.; WK, J. N. Heat transer analysis in the drying pr cess s rghum rice instant. In Proceedings of the International Conerence on Sustainable Environment, Agriculture and ourism (ICOSEA 2022); Saputr, A. D., Sutiars, L., Masithh, R. E., Le ng, J. C., Keiblinger, K., B rmpichaichartkul, C., Ker, O. S., Shamsudin, R., Eds.; Springer Nature: Lndn, UK, 2022; pp. 424–430. [Google Scholar] [CrossRef]
- Duangkhamchan, W.; Huangsaeng, K.; Kondo, N.; Jaisut, D. Enhancing Paddy Rice Preservation in Small-Scale Barns: Comparative Analysis of Hot Air-Drying Techniques and Ventilation Impact on Quality and Energy Efficiency. Foods 2024, 13, 672. [Google Scholar] [CrossRef] [PubMed]
- Bich, N.H.; Khuyen, N.D.; Chinh, N.V.C. Measurement of losses and evaluation of postharvest technologies in rice production (reference book in Vietnamese); Vietnam National University Press: Ho Chi Minh City, 2019. [Google Scholar]
- Ranalli, R.P.; Howell, T.A.; Gardisser, D.R. Controlled ambient aeration during rice storage II: Effects on rice quality. ASABE Meeting Presentation Paper, California, USA, 2001; No.01-6113. [Google Scholar]
- Khatchatourian, O.A.; Savicki, D.L. Mathematical modelling of airflow in an aerated store under non-uniform conditions. Biosyst. Eng. 2004, Vol.88(No.2), 201–211. [Google Scholar] [CrossRef]
- Navarro, S.; Nyes, R.; Casada, M.; Arthur, F. H. Grain aeration. In Stored product protection; Hagstrum, D. W., Phillips, W., Cuperus, G., Eds.; Kansas State University: Kansas, USA, 2012; pp. 121–134. [Google Scholar]
- Hector, P. C.; Karina, J. V.; González, K. M.; Omar, F. U.; Almeida, B. Determination of Moisture in Rice Grains Based on Visible Spectrum Analysis. Agronomy3021 2022. [Google Scholar] [CrossRef]
- Iguaz, A.; Arroqui, C.; Esnoz, A.; Vlırseda, P. Modelling and Simulation of Heat Transfer in Stored Rough Rice aerated. Biosystems Eng.> (2004) 2004, 89(1), 69–77. [Google Scholar] [CrossRef]
- Hammami, F.; Mabrouk, S. B.; Mami, A. Modeling and Simulation of Heat Transfer in Cereal Storage System. International Conference on Control, Engineering & Information Technology (CEIT’14), 2014. [Google Scholar]
- Sacilik, K. Resistance of Bulk Poppy Seeds to Airflow. Biosyst. Eng. 2004, 89(4), 435–443. [Google Scholar] [CrossRef]
- Syahrul, S.; Sukmawaty, S.; Priyati, A.; Sari, J.; Mirmanto, M. Analysis of Heat Energy on the Drying Process of Paddy Using Fluidized Beds Dryer. IOP Conf. Ser. Earth Environ. Sci. 2021, 913, 012038. [Google Scholar] [CrossRef]
- Zhou, X.; Zhang, H.; Rong, Y.; Fang, J.S.; Xu, Z.; Zhi, X.; Wang, K.; Qiu, L.; Markides, C.N. Comparative study for air compression heat recovery based on organic Rankine cycle (ORC) in cryogenic air separation units. Energy. Vol. 2022, Volume 255, 15. [Google Scholar] [CrossRef]
- Gao, G.; Zhang, X.; Wang, X.; Wu, J.; Li, X.; Xu, R. An adaptive grain-bulk aeration system for squat silos in winter: Effects on intergranular air properties and grain quality. Smart Agric. Technol. 2023. [Google Scholar] [CrossRef]
- Hieu, N.V.; Nghi, N.T.; Vinh, L.Q.; Anh, L.M.; Hung, N.V.; Gummert, M. Developing densified products to reduce transportation costs and improve the quality of rice straw feedstocks for cattle feeding. J. Vietnam. Environ. 2018, 10(1), 11–15. [Google Scholar] [CrossRef]
Figure 2.
Structure of aeration system on the barge. 1. Diesel engine; 2. Blower; 3. Airflow duct. 4. Perforated screen; 5. Supporting frame; 6. Barge wall.
Figure 2.
Structure of aeration system on the barge. 1. Diesel engine; 2. Blower; 3. Airflow duct. 4. Perforated screen; 5. Supporting frame; 6. Barge wall.
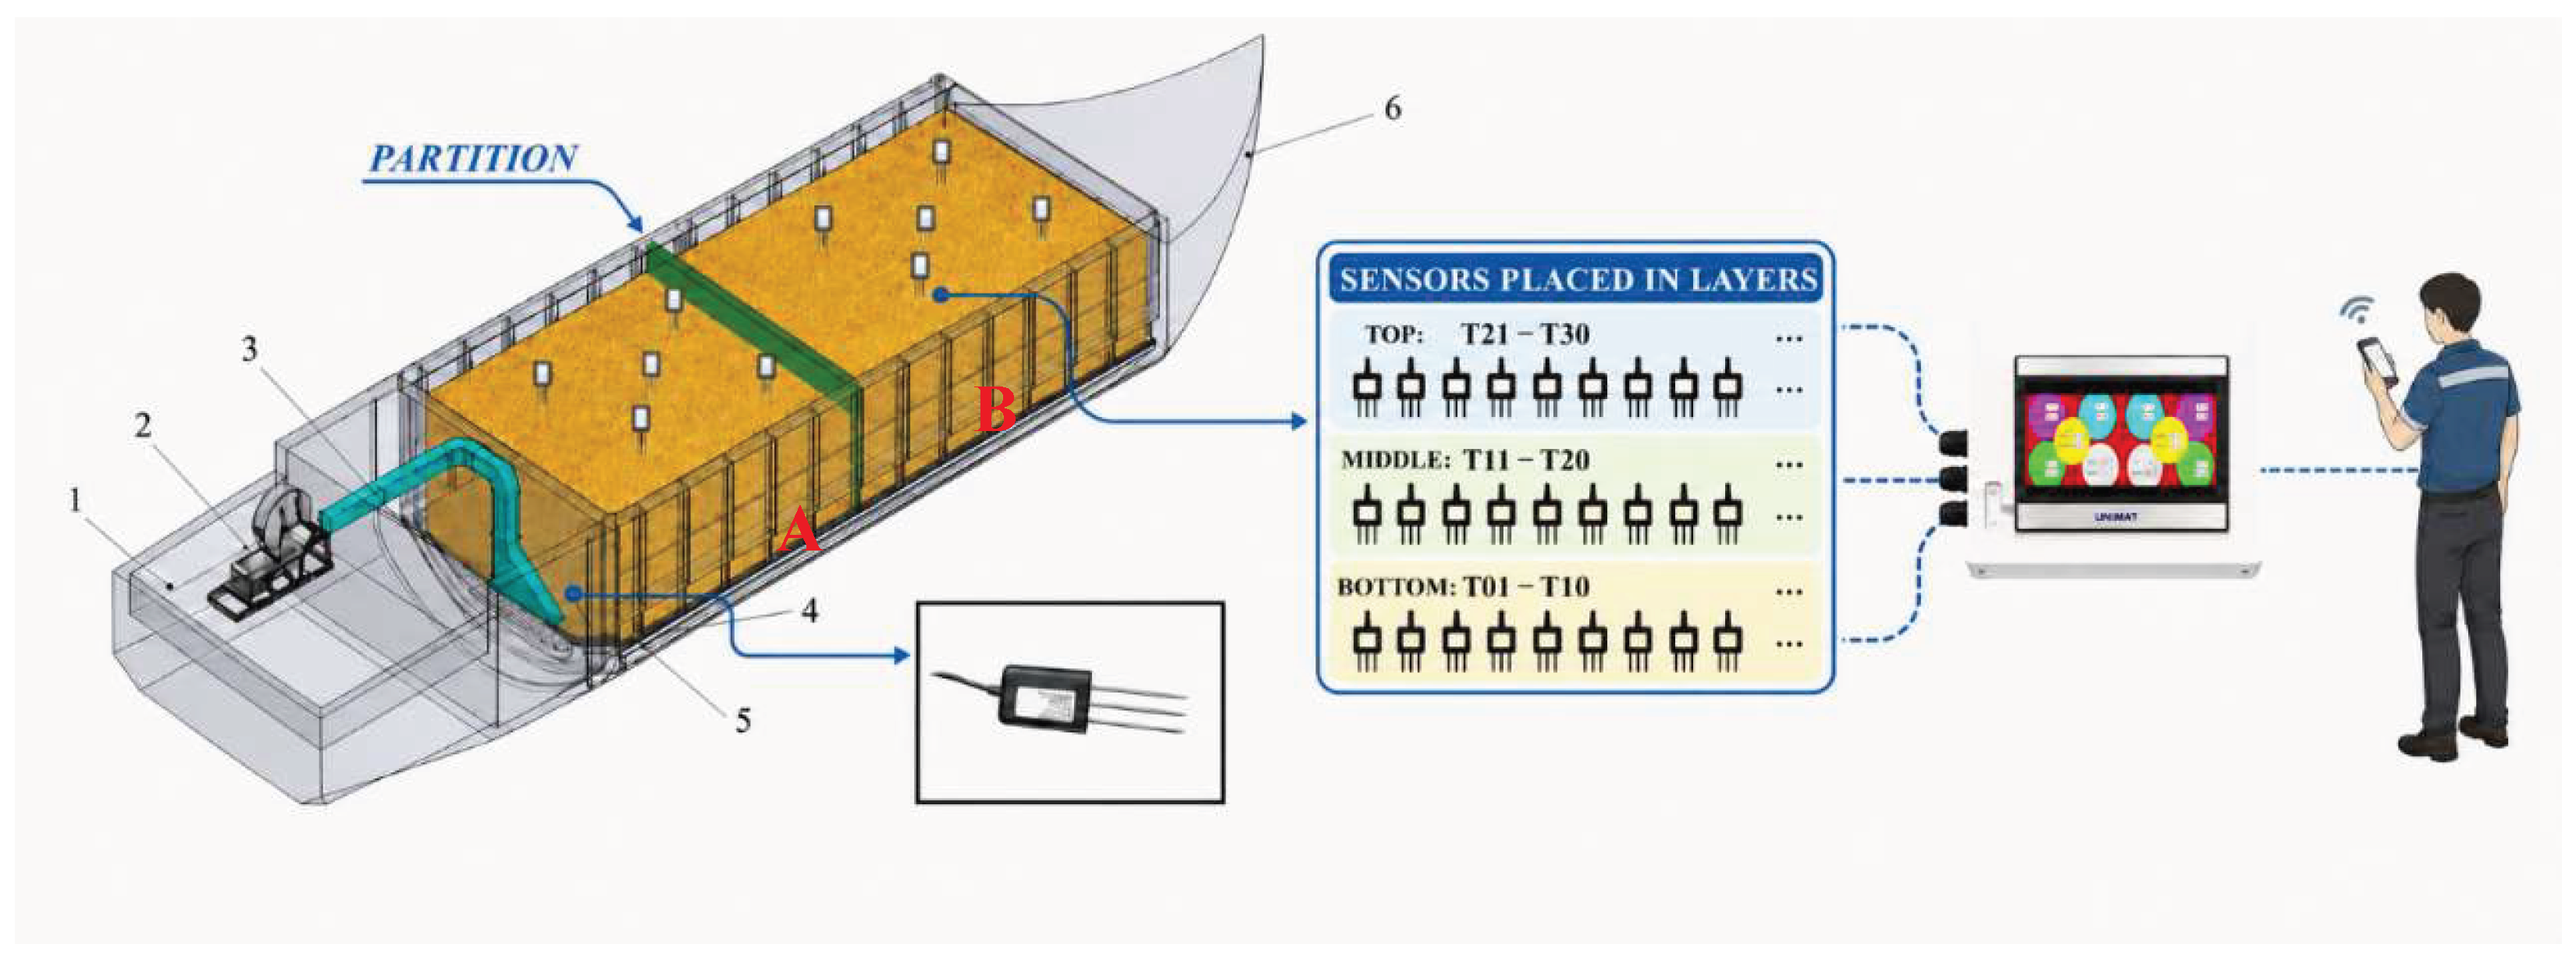
Figure 3.
Experimental barge for paddy.
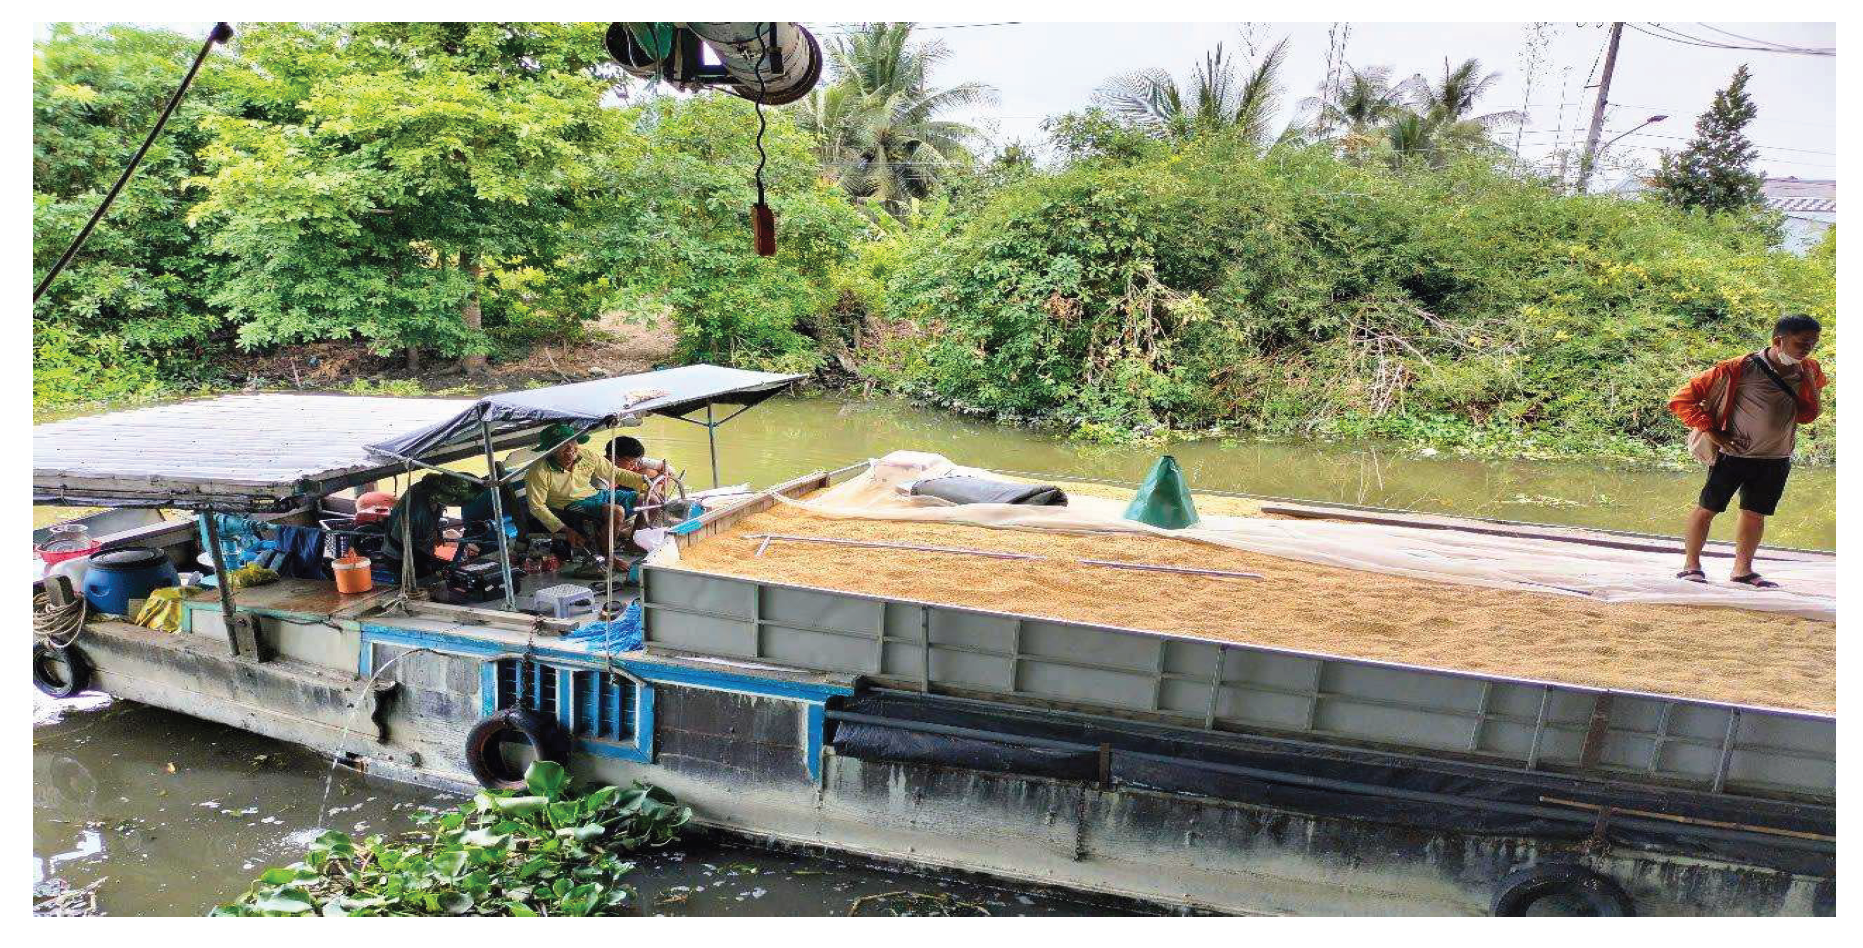
Figure 7.
Temperature difference between aerated grain in the model and ambient air.
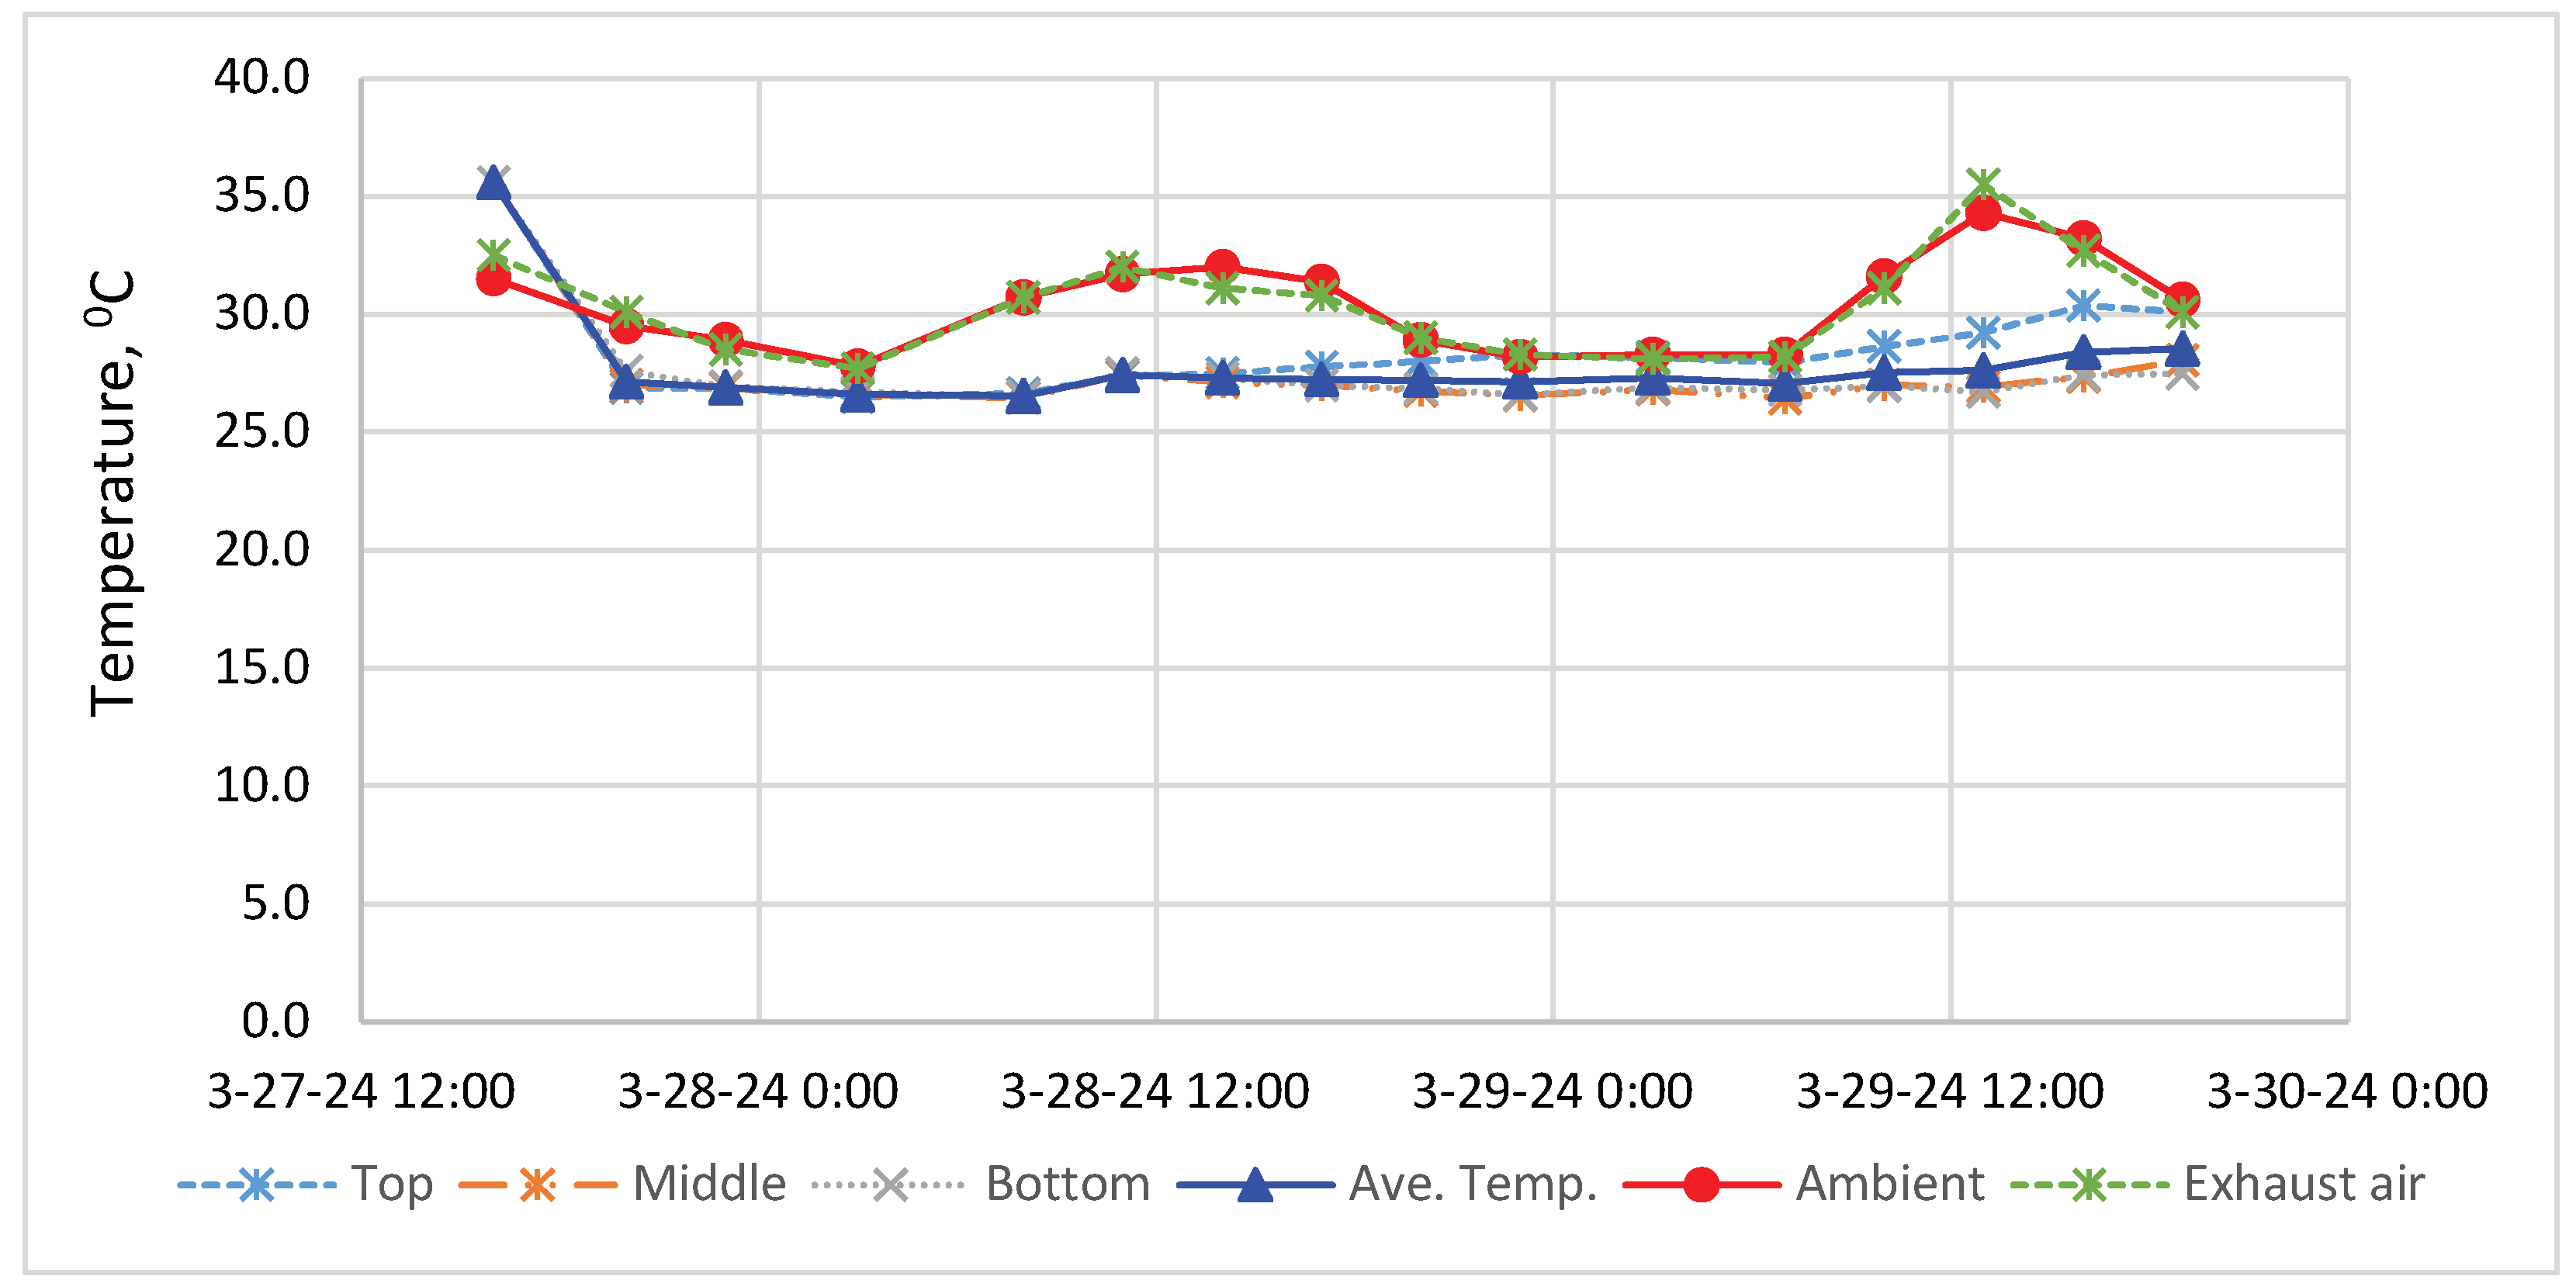
Figure 8.
Temperature profile of grain in barge during aeration.
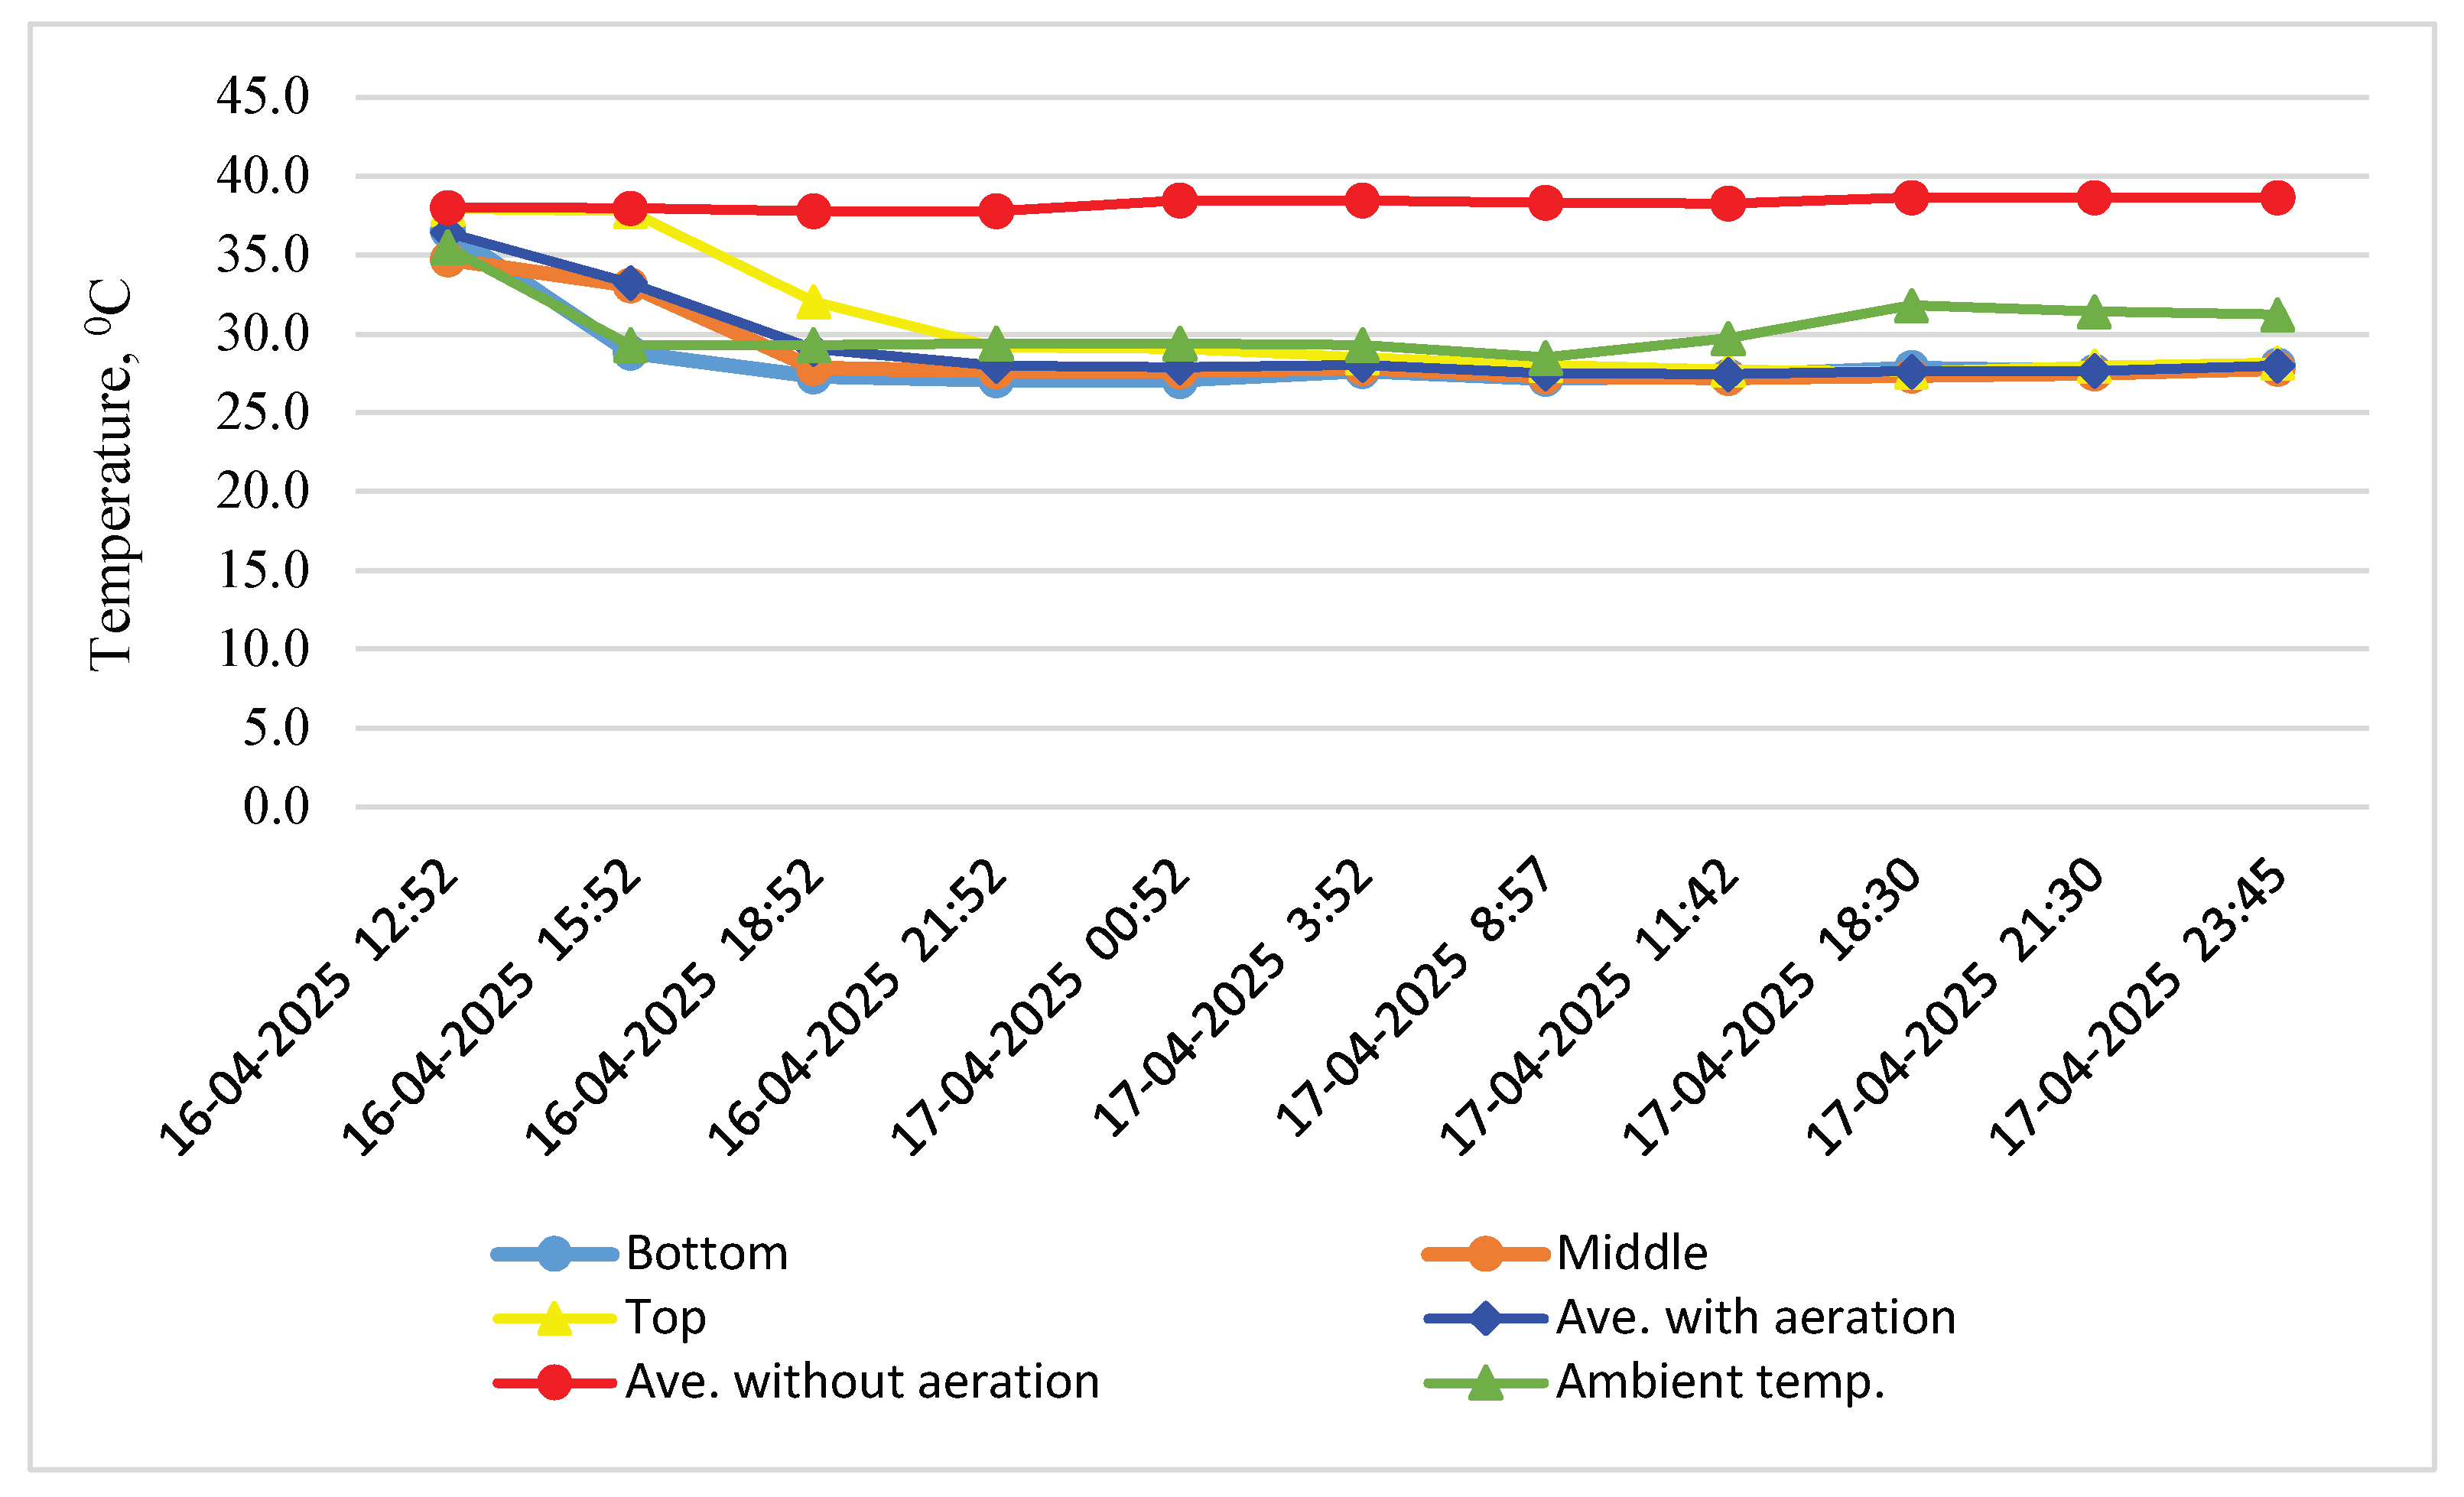
Figure 9.
Relationship between superficial air velocity and static pressure.
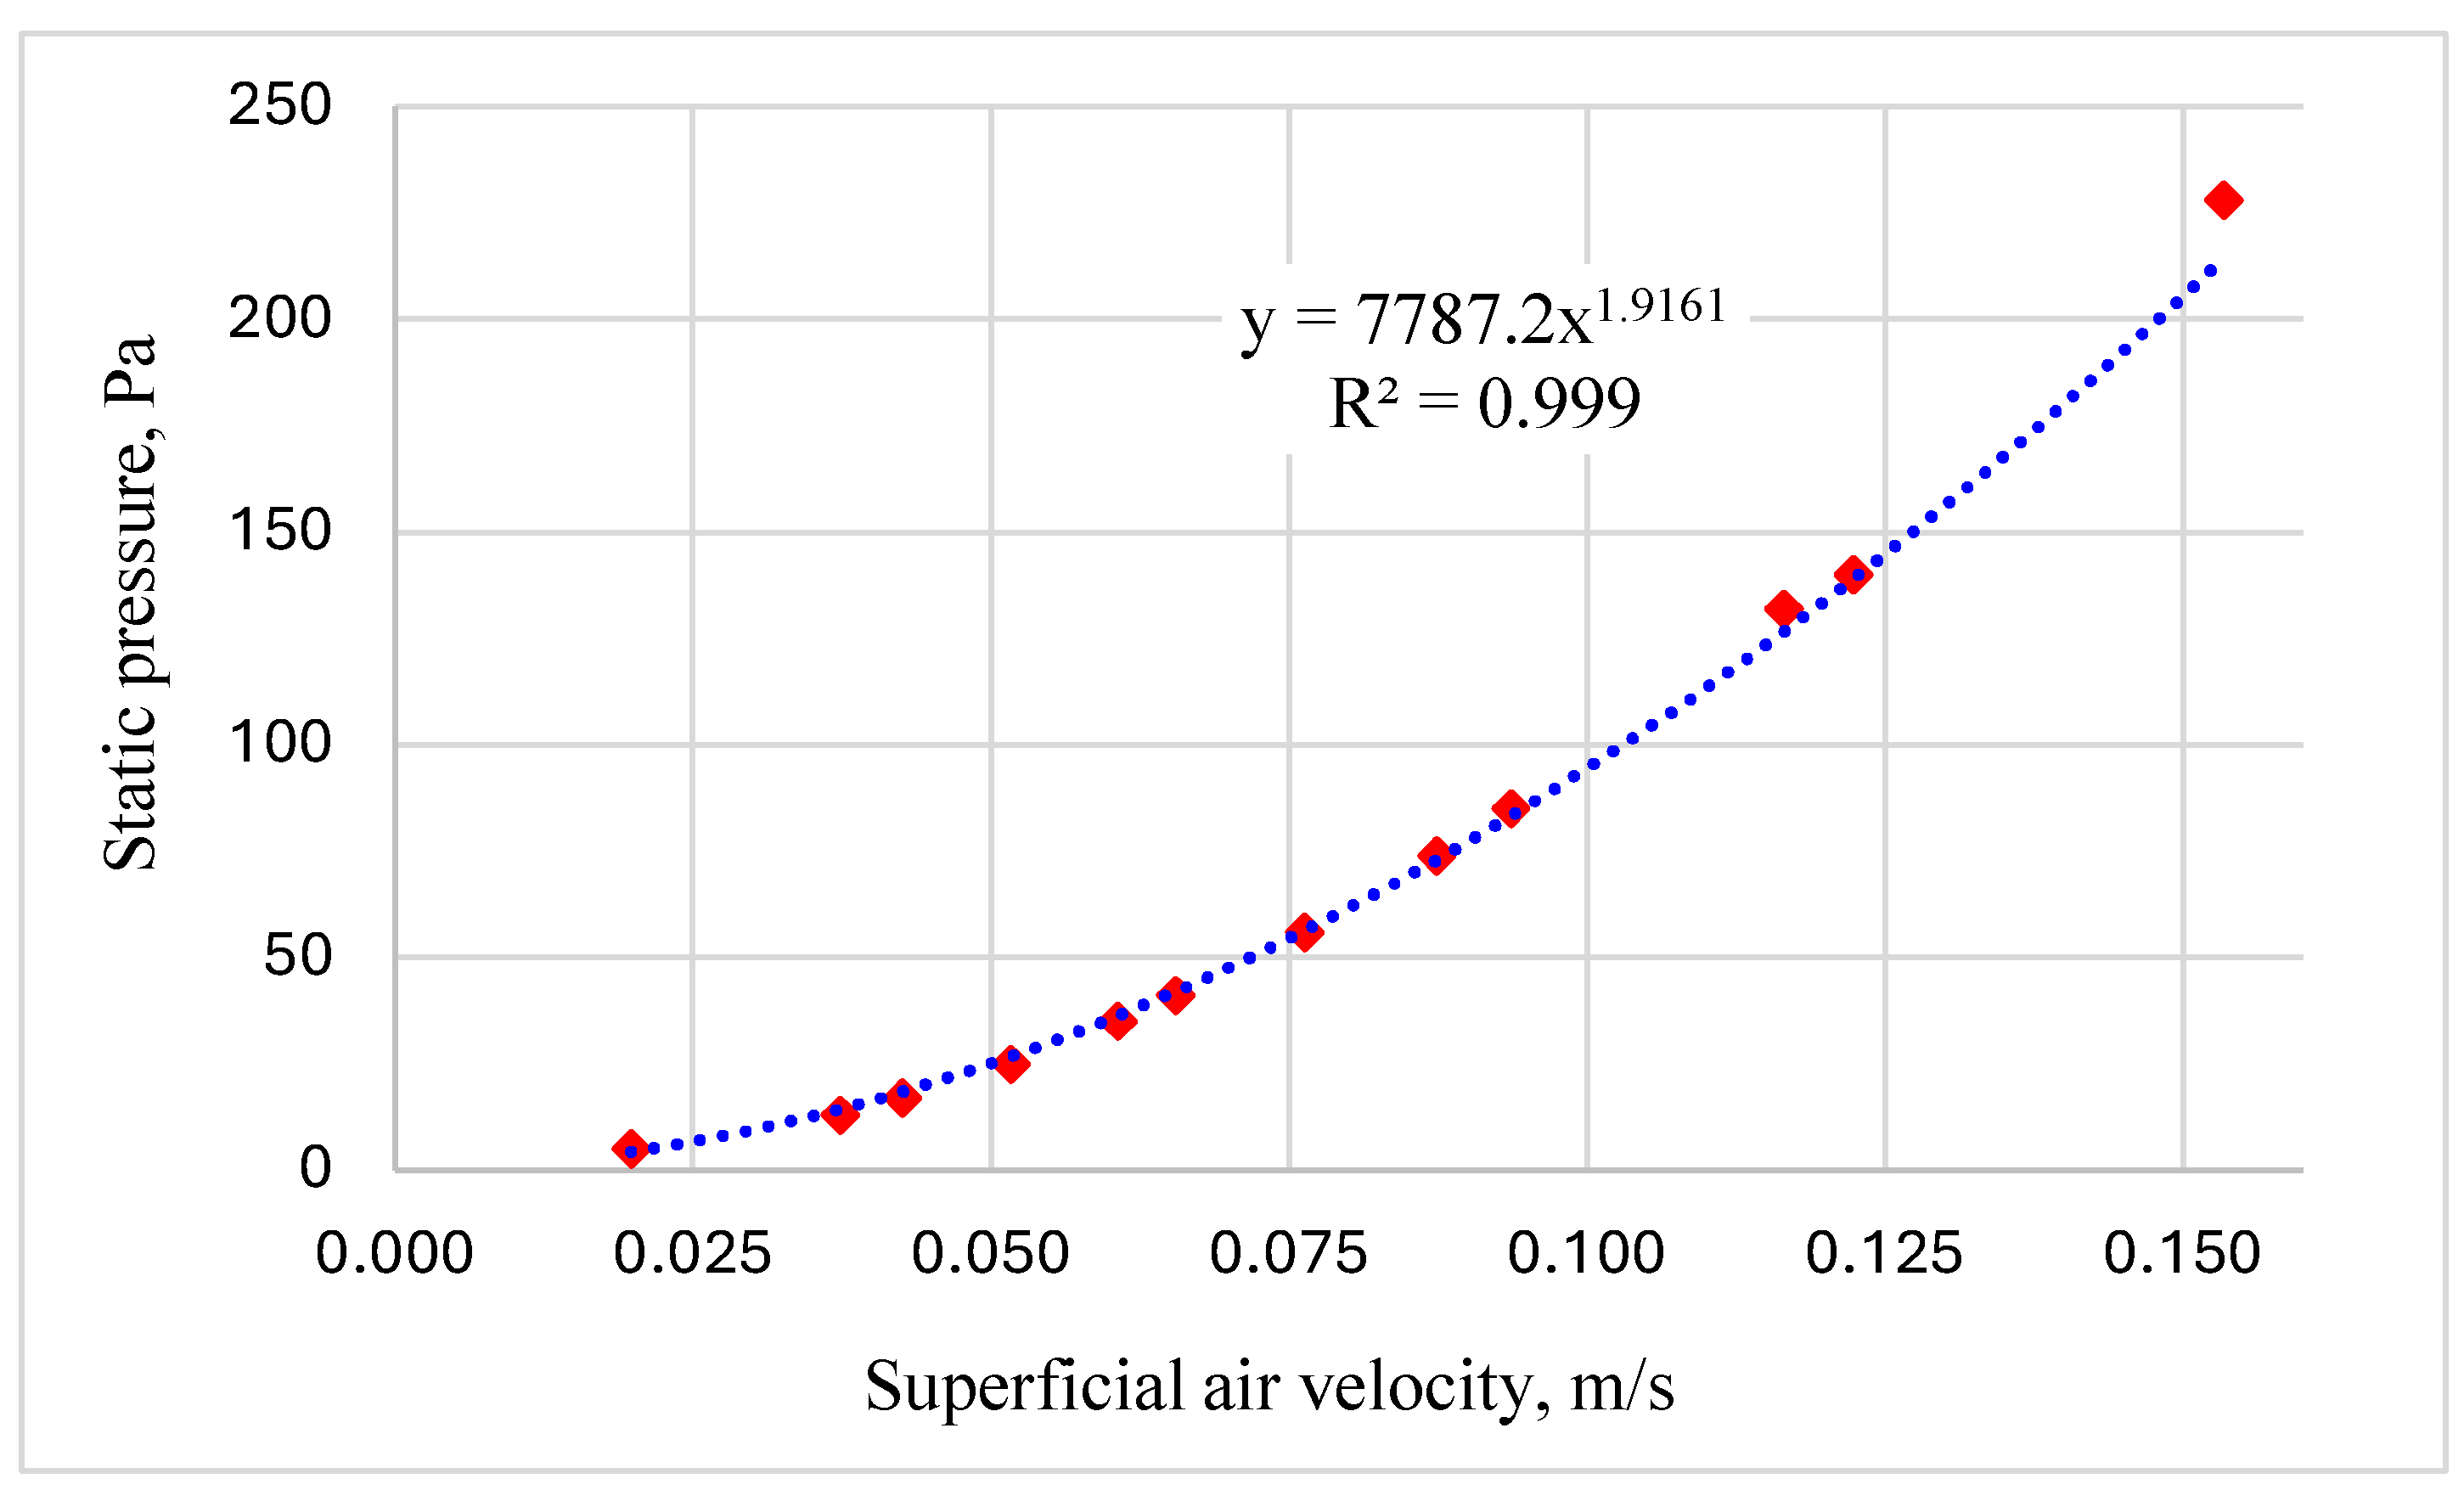
Figure 10.
Temperature, RH and enthalpy of ambient and exhaust air.
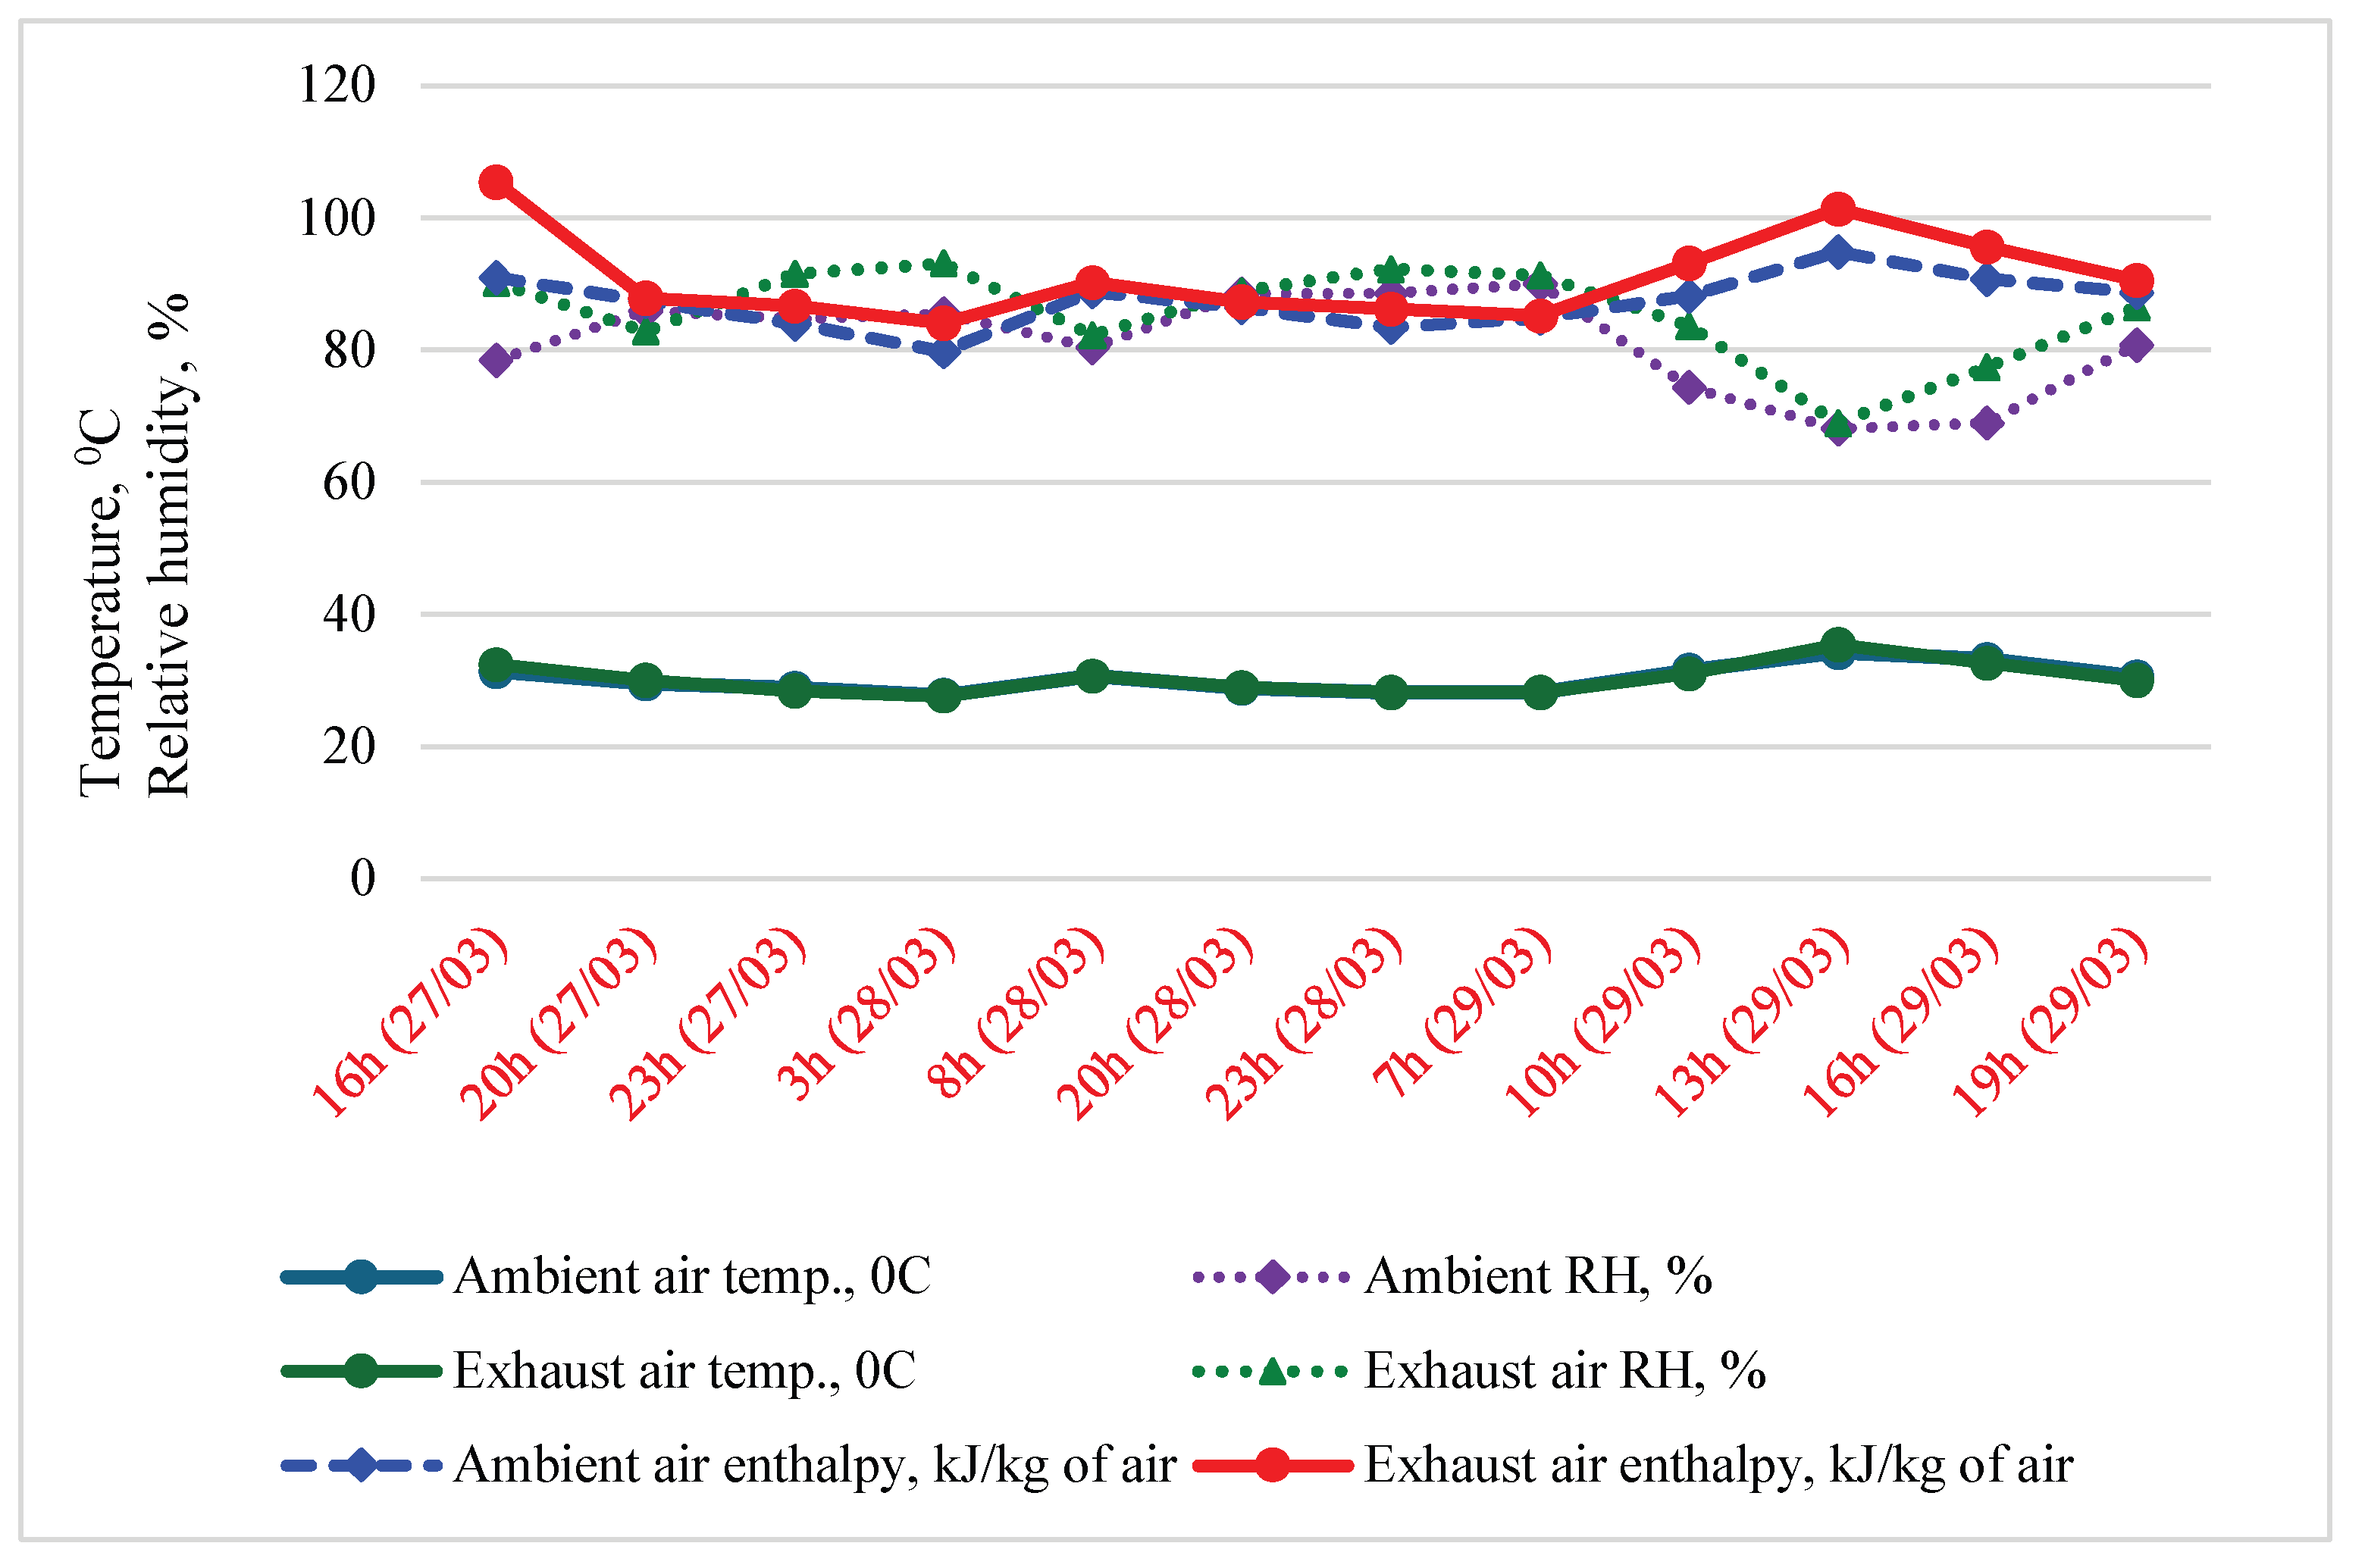
Figure 11.
Influence of aeration on rice grain quality.
Disclaimer/Publisher’s Note: The statements, opinions and data contained in all publications are solely those of the individual author(s) and contributor(s) and not of MDPI and/or the editor(s). MDPI and/or the editor(s) disclaim responsibility for any injury to people or property resulting from any ideas, methods, instructions or products referred to in the content. |
© 2026 by the authors. Licensee MDPI, Basel, Switzerland. This article is an open access article distributed under the terms and conditions of the Creative Commons Attribution (CC BY) license (http://creativecommons.org/licenses/by/4.0/).
Copyright: This open access article is published under a Creative Commons CC BY 4.0 license, which permit the free download, distribution, and reuse, provided that the author and preprint are cited in any reuse.


