
Submitted:
23 July 2026
Posted:
24 July 2026
You are already at the latest version
Abstract
Road traffic accident remains a major public-health and transportation challenge in Bangladesh, while existing studies often rely on isolated datasets, random validation, point predictions, and descriptive rankings that do not distinguish absolute burden from exposure-adjusted risk. This study develops an integrated, leakage-safe, uncertainty-aware, and policy-oriented framework using four nationwide datasets covering population characteristics, accidents, fatalities, injuries, vehicle involvement, and vehicle-specific fatalities across eight administrative divisions from January 2023 to December 2025. Linked division–month and vehicle–division–month panels were constructed with population-normalized indicators, cyclical seasonality, lagged dynamics, rolling variability, and momentum features. Mean and seasonal-naïve baselines, Ridge, Poisson, Tweedie, Random Forest, Extra Trees, Gradient Boosting, Histogram Gradient Boosting, and a hurdle model were evaluated using expanding-window validation and an independent 2025 holdout year. The framework further incorporated empirical-Bayes vehicle-risk stabilization, split-conformal prediction intervals, permutation importance, feature-family ablation, spatial concentration, hotspot persistence, and a transparent policy-priority index. National fatalities remained persistently high, while exposure-adjusted analysis identified Barishal and Sylhet as emerging-risk divisions despite the larger absolute burden in Dhaka and Chattogram. Motorcycles recorded the highest stabilized fatality risk, followed by auto rickshaws and other lightly protected vehicle categories. Random Forest achieved the lowest holdout fatality RMSE of 15.77, outperforming the seasonal-naïve benchmark by 26.7%, although count and regularized models remained competitive. Ablation analysis showed that the temporal-plus-demographic specification generalized better than the fully integrated feature set. The study contributes a reproducible decision-support architecture for seasonal enforcement, vehicle regulation, emergency-response allocation, infrastructure prioritization, and divisional monitoring. Prospective validation remains necessary before full operational deployment.
Keywords:
road safety
; machine learning
; traffic accident prediction
; road traffic fatalities
; intelligent transportation systems
; sustainable transportation
1. Introduction
Road traffic crashes continue to be a major public-health and transportation problem, particularly in low- and middle-income countries where rapid motorization has frequently outrun improvements in infrastructure, enforcement, vehicle regulation, and trauma-care capacity. Crash occurrence and severity result from complex interactions between travel exposure, road and environmental conditions, vehicle characteristics, human behaviour, seasonality and institutional response [1,2,3,4,5]. Road-safety analysis should not be limited to the selection of a highly performing algorithm but also to the preservation of temporal order, exposure accounting, uncertainty quantification and the production of results that can support practical intervention.
The application of machine-learning, deep-learning and data-mining techniques in crash prediction, injury-severity classification, fatality estimation and hotspot detection has been increasing recently [1,2,3,4,5,6,7]. Ensemble and deep-learning models have been reported to have good predictive performance owing to their ability to represent nonlinear relationships and complex interactions among crash-related factors [4,5,6,10,12]. Association-rule mining, descriptive analytics, hybrid data mining and classification frameworks have been used to identify interrelated causes of fatal and injury crashes and to improve interpretation of accident patterns [8,9,15,16,18]. The importance of spatially and temporally explicit road safety analysis is also highlighted in high-resolution urban collision prediction and simulation-based accident modelling [13,17]. Reproducible benchmarking and comparative research have also been made easier by publicly available datasets of road-traffic [20,21].
But there are some limitations with these advances. Many studies conduct standard algorithms on a single dataset and treat better prediction accuracy as the main contribution. It is common practice to perform random train-test splits on temporally ordered crash data, but this may allow future information to affect the training of the model, and lead to optimistic results. Transparent baselines, count-data models, uncertainty estimates, and formal tests of predictive improvement are frequently missing. In many cases, raw accident and fatality totals are often taken as a direct measure of risk although they may be more indicative of population size, traffic exposure, vehicle prevalence and reporting intensity.
These limitations are especially pertinent in Bangladesh. Machine learning has been applied in the past for accident severity and crash analysis [14]. International studies have demonstrated the significance of vehicle type and road-user category for fatality prediction [5,10,19]. However, demographic exposure, monthly division crash outcomes, vehicle involvement and vehicle-specific fatalities have rarely been integrated in a common time frame. This leads to reporting the expected, e.g., high crash numbers in Dhaka or frequent involvement of motorcycles without differentiating between absolute burden and risk normalized by exposure, persistent hotspots and short-term fluctuations, or historically high-risk areas and rapidly worsening areas.
This study fills these gaps by employing an integrated, leakage-safe, uncertainty-aware and policy-oriented framework with nationwide data from January 2023 to December 2025. The framework builds linked division-month and vehicle-division-month panels, includes population-normalized indicators, cyclical seasonality, lagged outcomes, rolling averages, volatility, and momentum, and tests models with expanding-window validation with 2025 held out as a completely independent holdout year. Random Forest, Extra Trees, Gradient Boosting, Histogram Gradient Boosting, a hurdle model for zero-heavy outcomes, Transparent baselines, Ridge, Poisson and Tweedie models. We compare
The novelty of this study does not lie in saying that standard algorithms are new. Instead, it is the integration of temporal validation, count-model baselines, conformal prediction intervals, empirical-Bayes vehicle-risk smoothing, feature-family ablation, hotspot persistence, change-point analysis, spatial concentration measures, and policy-ranking sensitivity into a single reproducible decision-support architecture. These components enable the study to evaluate if complex models offer meaningful improvements over simpler alternatives, and whether identified risks are persistent, emerging or uncertain. The study also translates predicted fatalities, normalized risk by exposure, severity and recent trend into a transparent policy-priority index. The outputs produced are intended to inform division resource allocation, seasonal enforcement planning, vehicle-specific regulation, infrastructure prioritization, and emergency-response improvement. In this regard, the study adds not only another application of machine learning to road-safety data, but an integrated framework for generating validated predictions, uncertainty-aware risk assessment and actionable policy evidence.
2. Materials and Methods
This study developed an integrated, leakage-safe, uncertainty-aware and policy-oriented analytical framework for road accident analysis and risk prediction in Bangladesh. Population characteristics, road accident outcome, vehicle involvement and vehicle-specific fatalities were used to compile monthly data for all eight administrative divisions from January 2023 to December 2025. The methodology (Figure 1) comprised preprocessing of data, multi-source integration, feature engineering, temporal validation, regression and classification benchmarking, uncertainty estimation, hotspot and concentration analysis, model interpretation, and policy-priority assessment. All procedures were implemented in a reproducible pipeline in Python to ensure consistency, transparency and repeatability.
2.1. Data and Design
This study developed an integrated, leakage safe and uncertainty-aware framework for the analysis of road accidents in Bangladesh using monthly data from January 2023 to December 2025. Four datasets were combined: division level population characteristics, monthly accidents, fatalities and injuries, vehicle involvement by type, and vehicle specific fatalities. The analysis included Dhaka, Chattogram, Rajshahi, Khulna, Barishal, Sylhet, Rangpur and Mymensingh.
Two analytical panels were created: a division-month panel and a vehicle-division-month panel. Within the modelling pipeline, division and vehicle names were standardised, duplicates were removed, invalid counts were corrected and missing predictors were imputed. Numeric variables were standardized and categorical variables were one hot encoded.
2.2. Risk Metrics and Feature Engineering
The main division-level outcomes were accidents, fatalities, injuries, and casualties and the vehicle-level outcomes were vehicle counts and vehicle-specific fatalities. Accident and fatality rates per 100,000 people were calculated normalized to population. Additional features were quarter, season, cyclical month terms, lagged outcomes, rolling means, rolling variability and momentum indicators To avoid temporal leakage, all lagged and rolling features were calculated using only previous observations.
Vehicle fatality risk was estimated using empirical-Bayes shrinkage to reduce instability in low frequency categories. We also looked at division-level hotspot persistence, recent risk acceleration, Pettitt change points and spatial concentration with Gini and Herfindahl-Hirschman indices.
2.3. Model Development and Comparison
Regression models were mean and seasonal-naïve baselines, Ridge, Poisson, Tweedie, Random Forest, Extra Trees, Gradient Boosting and Histogram Gradient Boosting. We added a two stage hurdle model for zero heavy vehicle outcomes. Classification models included a most-frequent baseline, logistic regression, random forest, extra trees, gradient boosting and histogram gradient boosting.
For comparison, transparent statistical baselines, count-data methods and nonlinear ensemble methods were picked. The algorithms are not claimed to be novel, the novelty comes from the combination with temporal validation, uncertainty estimation, risk stabilization and policy translation.
2.4. Validation and Performance Evaluation
Data from 2023-2024 were used to develop the model, and 2025 data were held out as an independent holdout year. An expanding-window validation was performed within the training period while preserving the chronological order.
The regression performance was evaluated by MAE, RMSE, and R2. The classification performance was evaluated by accuracy, balanced accuracy, precision, recall, macro F1-score, and confusion matrices. Bootstrap confidence intervals quantified uncertainty of MAE and RMSE, while Diebold–Mariano tests compared the best models to transparent baselines.
2.5. Uncertainty, Interpretation and Policy Analysis
For the best regression models, split-conformal prediction intervals were calculated, giving 90% uncertainty bounds. The added value of demographic, exposure and lagged variables was assessed through feature-family ablation, and model interpretability was assessed using permutation importance.
A policy-priority index was created by combining predicted fatalities, fatalities per 100,000 people, severity, and recent trend. It was tested for robustness with 2000 alternative weight combinations. All analyses, tables, trained models and publication quality figures were generated using a reproducible pipeline in Python.
3. Results and Discussions
3.1. National and Quarterly Road-Safety Trends
Annual results show that road-safety conditions were severe over the study period. As illustrated in Figure 2, reported accidents rose from 5,495 in 2023 to 5,856 in 2024 and then declined slightly to 5,695 in 2025. Deaths rose to 5,480 in 2024 from 5,024 in 2023 and were unchanged at 5,490 in 2025. Injuries, however, plunged from 7,495 to 6,470 and then to 6,424. Therefore, the decrease in the number of reported injuries does not correspond to the same decrease in the number of fatalities, which means that the fatal outcomes of road crashes were consistently high.
Table 1 confirms that the modest decline in accidents during 2025 was not accompanied by a reduction in fatalities. This indicates that crash severity remained a major concern despite fewer reported injuries.
A more detailed quarterly view is provided in Figure 3. The trajectories show significant short-term variation with a high count of accidents, fatalities and injuries during the middle quarters of 2023 and 2024, and a sharp drop in the third quarter of 2024. Results climbed again in the first half of 2025 but fell back toward the end of the year. These fluctuations are concealed by annual aggregation and indicate that quarterly monitoring is required for timing enforcement, road maintenance, emergency-response preparation, and public-awareness campaigns.
3.2. Exposure-Normalized Divisional Fatality Risk
Total absolute crash numbers are highly dependent on population size and traffic exposure. Thus, the average fatalities per 100,000 are compared among divisions in Figure 4. The highest exposure normalized risk was found in Barishal (0.453) followed by Sylhet (0.370) and Rajshahi (0.319). Mymensingh ranked fourth with 0.278, while Dhaka had a lower normalized rate of 0.232, despite a high absolute burden of crashes.
As shown in Table 2, absolute burden and normalized risk are not interchangeable. Dhaka and Chattogram are still high burden areas, while Barishal and Sylhet are in need of attention due to their disproportionately high population adjusted risk.
3.3. Spatial-Seasonal Variation in Fatality Risk
Figure 5 shows that divisional risk varies considerably over the months. Highest seasonal concentration was observed in Barishal (0.693 deaths per 100,000 in June) and high concentrations in the months of March, April, May, July, November and December. Sylhet too had a high risk in April and June, and Rajshahi had a significant peak in June. Khulna and Rangpur stayed generally at lower levels.
The spatial-seasonal heatmap shows that a non-differentiated national intervention strategy may be inefficient. Divisions with recurring seasonal peaks may benefit from targeted enforcement, weather-responsive traffic management, road-surface maintenance, and temporary augmentation of emergency-response capacity during high-risk months.
Table 3 identifies the divisions and months requiring intensified seasonal enforcement, weather-responsive traffic management, and emergency-response readiness.
3.4. Empirical-Bayes Vehicle Fatality Risk
Figure 6. Empirical-Bayes Stabilized Fatality Risk by Vehicle Type Motorcycles had the highest risk of 0.825 fatalities per vehicle involved, followed by auto rickshaws (0.714), ‘Others’ (0.685), easy bikes (0.631) and battery-operated auto rickshaws (0.628). Truck/covered vans and bus/minibuses had lower stabilized risks even with significant involvement in road traffic.
The significance of this finding goes beyond the obvious fact that motorcycles are dangerous. The Empirical-Bayes stabilization reduces the impact of small sample variability and reveals that several classes of vehicles that are lightly regulated or operated informally remain at high risk even after statistical shrinkage. These results support vehicle-specific interventions such as helmet enforcement, rider licensing, speed management, passenger-protection requirements, vehicle-fitness inspection, and improved regulation of informal transport modes.
Table 4 indicates that a number of lightly protected and informally operated vehicle categories continue to pose high risks even after the small-sample instability is minimized. And helmet enforcement, licensing, passenger protection and vehicle-fitness regulation should be priorities in these categories.
3.5. Vehicle–Division Differences
Figure 7 shows that the risk of vehicle fatality varies geographically. The risk of motorcycles was found to be high in most of the divisions, especially in Chattogram, Dhaka, Rangpur and Khulna. The risk of auto-rickshaw was higher in Dhaka, Mymensingh, Rajshahi and Sylhet. The “Others” category had a very high value in Khulna, suggesting that this residual category contains heterogeneous vehicle types and should be disaggregated in future reporting.
The heatmap also shows a duplicate division label, “Dhaka.1”, with abnormal low values. This looks to be a data coding inconsistency rather than a real administrative division. The category needs to be merged with Dhaka before final release or clearly documented as a preprocessing correction. The problem underscores the need for standard coding for both the administration and the vehicle in any operational road-safety database.
3.6. Monthly Divisional Risk Trajectories
As can be seen in Figure 8, normalized fatality risk was not stable over time. Barisal had the highest and most frequent peaks, with values approaching 1.0 fatality per 100,000 in 2024 and exceeding 0.9 in 2025. Sylhet too had sustained highs with multiple peaks. Rajshahi showed a moderate but recurring risk while Dhaka and Chattogram remained relatively stable at lower normalized levels.
These trajectories differentiate persistent or accelerating risk from one-off monthly fluctuations. If a division remains high risk, structural interventions may be warranted; if there is a transient spike, investigation specific to the event may be warranted. The figure therefore offers more policy-relevant evidence than a single average or total.
3.7. Out-of-Time Model Benchmarking
Figure 9 is the comparison of fatality prediction models on the completely unseen 2025 holdout period. For RMSE, Random Forest had the lowest value of 15.77, while Gradient Boosting and Extra Trees had 16.15 and 17.17, respectively. Histogram Gradient Boosting model had an 18.61 score. The scores of the Ridge, Tweedie and Poisson models were 19.16, 19.90 and 20.81 respectively. The seasonal naïve benchmark achieved a score of 21.52, while the mean baseline performed significantly worse with a score of 33.93.
Table 5 shows that ensemble models outperformed transparent baselines, although Ridge and count models remained competitive. Random Forest yielded a reduction of the RMSE by ~26.7% when compared to the seasonal-naive benchmark and ~53.5% when compared to the mean baseline. These gains support the use of nonlinear ensemble methods, but the relatively strong performance of Ridge, Tweedie and Poisson models suggests that transparent and count-based alternatives are still important. The result supports a balanced interpretation: ensemble models improved out-of-time accuracy, but their use should be justified by temporal benchmarking, not assumed superiority.
3.8. Observed Versus Predicted Fatalities
There is an evident positive relationship between observed and predicted fatalities (Figure 10). Most low and medium count observations are reasonably close to the 45 degree reference line, indicating that the model was able to capture broad divisional differences. However, several high-fatality observations were underpredicted, illustrating regression toward the mean.
This pattern suggests that the model is more reliable at identifying relative risk and expected ranges than at reproducing every extreme monthly outcome. Extreme values might also depend on omitted determinants such as unusual weather, road geometry, major events, traffic volume, enforcement intensity, or emergency response conditions.
3.9. Conformal Prediction Intervals
Figure 11 shows the observed and predicted monthly fatalities for the 2025 holdout year with 90% conformal prediction bands. The predicted values tended to go in the direction of the observed outcome, but the intervals were wide. This reflects large uncertainty due to the short study period, monthly aggregation, heterogeneity across divisions, potential variation in reporting and omission of determinants at the road level.
The proposed conformal intervals improve practical interpretability, as they provide a plausible range of future outcomes rather than point estimates only. The width of the framework, however, limits the use of the framework for exact monthly forecasting. In practice the model is better suited for risk screening, resource prioritisation and early warning than for exact numerical prediction.
3.10. Feature Importance
Figure 12 shows that the most significant predictor of number of fatalities was the number of accidents in the previous month. The exposure index and population size were the next most significant predictors. Lagged fatalities, % of population, rolling fatality variability, lagged injuries, and cyclical month effects were also included in the prediction.
The results (Table 6) show that the prediction is sensitive to both recent crash dynamics and demographic exposure. But permutation importance measures predictive dependence and should not be interpreted as evidence of causal effects.
3.11. Feature-Family Ablation
Figure 13 shows the results of feature-family ablation. The temporal plus demographic specification gave the lowest 2025 fatality RMSE of 14.94. Adding lagged features increased RMSE to 16.89, while the temporal-only and fully integrated specifications had RMSEs of 18.46 and 18.61, respectively.
As can be seen in Table 7, the addition of features does not guarantee a better generalization. The best result was obtained with the simpler temporal-plus-demographic specification, supporting an approach of parsimonious modelling.
This is an important result of methodology. The most complex specification did not give the best out-of-time generalisation. Redundant or noisy variables can increase variance and weaken performance on a short monthly panel. This ablation evidence thus supports a parsimonious modelling strategy, and shows that novelty should be evaluated based on added information value, not the number of engineered features.
3.12. Policy-Priority Index
Figure 14 combines predicted fatalities, exposure-Fnormalized risk, severity, and recent momentum into a transparent index of policy priorities. Chattogram was ranked first with a score of 0.675 while Dhaka (0.600), Barishal (0.523) and Sylhet (0.480) followed.
The ranking is different from both the raw-burden and normalized-risk rankings because it considers several dimensions of need. Chattogram and Dhaka will need significant resources given their expected burden, while Barishal and Sylhet will require targeted intervention because of the increased and persistent normalized risk. The index can assist with the deployment of enforcement, the prioritization of infrastructure, emergency planning, and division monitoring, but it must complement, not substitute for, expert judgment.
The ranking (Table 8) is different from both the raw-burden and normalized-risk rankings because it considers several dimensions of need. Chattogram and Dhaka will need significant resources given their expected burden, while Barishal and Sylhet will require targeted intervention because of the increased and persistent normalized risk. The index can assist with the deployment of enforcement, the prioritization of infrastructure, emergency planning, and division monitoring, but it must complement, not substitute for, expert judgment.
3.13. Spatial Concentration of Fatalities
Figure 15 illustrates changes in the geographical concentration of fatalities. The Gini coefficient decreased from 0.276 in 2023 to 0.230 in 2024 and then increased to 0.305 in 2025. A similar pattern was observed for the Herfindahl–Hirschman index, which decreased from 0.155 to 0.147 and then rose to 0.164.
Table 9 shows that the spatial distribution of fatalities changed over time. The increase in both indices in 2025 supports targeted geographical intervention rather than uniform national allocation. The increase in both indices in 2025 suggests that fatalities became more geographically concentrated after being more evenly distributed in 2024. This finding supports targeted geographical intervention rather than uniform nationwide allocation. It also shows that the spatial structure of risk can change over time and should be monitored continuously.
3.14. Emerging-Hotspot Score
Figure 16 combines mean risk, persistence of hotspots, longest duration of hotspots, and recent acceleration. Barishal topped the ratings with a score of 1.000, followed by Sylhet (0.848) and Rajshahi (0.399). Chattogram and Mymensingh got moderate scores, while Khulna and Rangpur were at the bottom.
Table 10 distinguishes persistent and accelerating risk from the absolute burden. “Dhaka remains a high burden division but Barishal and Sylhet have emerged as the strongest exposure-normalized hotspots.
This ranking is a more meaningful interpretation than crash numbers alone. Dhaka is a high-burden division, and Barishal and Sylhet are persistent and accelerating exposure-normalized risks. The distinction is operationally meaningful in that high burden areas require large-scale capacity whereas emerging hotspots require early preventive intervention.
3.15. Overall Contribution, Applicability, and Limitations
The contribution of this study is not only the use of Random Forest or Gradient Boosting, as can be seen in Figure 2, Figure 3, Figure 4, Figure 5, Figure 6, Figure 7, Figure 8, Figure 9, Figure 10, Figure 11, Figure 12, Figure 13, Figure 14, Figure 15 and Figure 16. The key contribution is the integration of exposure normalization, temporal validation, empirical-Bayes stabilization, conformal prediction, ablation analysis, spatial concentration, hotspot persistence and transparent policy ranking within one reproducible framework.
The framework can be used for national and divisional road-safety planning to identify high-burden areas, exposure-adjusted hotspots, risky vehicle categories, high-risk months and uncertainty in future outcomes. Possible applications include seasonal enforcement deployment, helmet and licensing campaigns, vehicle fitness inspection, emergency response allocation and targeted infrastructure investment.
Limitations of the analysis include the three-year study period, monthly administrative aggregation, possible under-reporting, a static population exposure, broad vehicle categories and lack of road geometry, traffic volume, weather, behavioural, enforcement and trauma-care variables. The relationships we observe are predictive rather than causal. Thus, prospective and external validation will be necessary before operational deployment.
4. Findings, Limitations and Future Work
4.1. Findings
The framework generated findings that extend beyond simple rankings of divisions, vehicle types, or algorithm accuracy. By combining exposure normalization, leakage-safe temporal validation, empirical-Bayes stabilization, uncertainty analysis, feature ablation, hotspot persistence, and policy prioritization, the study provides a more rigorous interpretation of road-safety risk in Bangladesh.
i. National road-safety outcomes remained critical throughout 2023–2025. Reported accidents changed only moderately, while fatalities increased and then remained high despite a decline in injuries. This indicates that the fatal severity of crashes did not improve substantially during the study period.
ii. Absolute burden and exposure-normalized risk produced different geographical priorities. Dhaka and Chattogram remained high-burden divisions, whereas Barishal and Sylhet showed the highest population-adjusted and emerging risks. This distinction demonstrates that road-safety policy should not rely only on total crash or fatality counts.
iii. The spatial-seasonal analysis revealed substantial monthly variation across divisions. Barishal showed the strongest recurring peaks, while Sylhet, Rajshahi, and Mymensingh also experienced elevated risk during specific months. These results support division-specific and seasonally timed interventions rather than uniform national measures.
iv. Motorcycles retained the highest empirical-Bayes stabilized fatality risk, but auto rickshaws, easy bikes, battery-operated auto rickshaws, vans, and other lightly protected vehicle categories also remained high risk. The stabilized estimates provide stronger evidence than crude ratios because they reduce instability caused by low-frequency categories.
v. The vehicle–division analysis showed that the risk associated with the same vehicle type varied geographically. This finding suggests that national vehicle regulations should be complemented by division-specific enforcement, infrastructure improvement, licensing, and passenger-protection measures.
vi. The emerging-hotspot analysis distinguished high-burden locations from persistent and accelerating risks. Barishal and Sylhet ranked highest in hotspot persistence, level, and acceleration, whereas Dhaka remained important mainly because of its absolute burden. This provides a more informative basis for early intervention than a simple ranking of total fatalities.
vii. The out-of-time benchmark showed that Random Forest produced the lowest fatality-prediction RMSE, followed by Gradient Boosting and Extra Trees. However, Ridge, Poisson, Tweedie, and seasonal-naïve models remained competitive. The results therefore justify nonlinear models through empirical comparison without claiming that the algorithms themselves are methodologically new.
viii. The observed-versus-predicted analysis showed that the selected model captured broad variation but underpredicted some extreme fatality outcomes. The conformal prediction intervals further demonstrated substantial forecast uncertainty. Accordingly, the model is more suitable for identifying relative risk, plausible ranges, and priority areas than for producing exact monthly predictions.
ix. Permutation importance identified recent accident history, exposure, population size, and lagged fatalities as the most influential predictors. These results indicate that short-term temporal dependence and demographic exposure jointly contribute to fatality prediction, although predictive importance should not be interpreted as causality.
x. The ablation study showed that the temporal-plus-demographic specification outperformed the fully integrated feature set. This finding demonstrates that adding more engineered variables does not necessarily improve out-of-time performance and supports a parsimonious modelling strategy.
xi. The policy-priority index ranked Chattogram and Dhaka highly because of predicted burden, while Barishal and Sylhet remained priorities because of elevated normalized and emerging risk. The ranking therefore integrates burden, severity, exposure, and trend rather than reproducing a simple crash-count hierarchy.
xii. Spatial concentration indices increased in 2025, indicating that fatalities became more geographically concentrated. This supports targeted resource allocation and continuous monitoring of changing regional risk patterns.
Overall, the main contribution is the integrated decision-support architecture rather than the isolated use of standard machine-learning algorithms. The framework combines rigorous temporal benchmarking, uncertainty quantification, stabilized vehicle-risk estimation, feature-family testing, hotspot diagnostics, and transparent policy translation. It can support seasonal enforcement, vehicle-specific regulation, emergency-response allocation, infrastructure prioritization, and division-level monitoring.
4.2. Limitations
Although the framework improves temporal validation, uncertainty assessment, and policy interpretation, the findings should be considered in light of several limitations.
i. The study covers only three years of monthly data, which limits long-term trend analysis and may reduce model stability.
ii. The data are aggregated at the divisional level and do not include road geometry, traffic volume, weather, driver behaviour, enforcement intensity, or emergency-response conditions.
iii. Population was used as a proxy for exposure because vehicle-kilometres travelled and detailed traffic-flow data were unavailable.
iv. Possible under-reporting, inconsistent coding, and broad vehicle categories may affect the accuracy of risk estimates and model outputs.
v. The models identify predictive associations rather than causal effects and were validated in one national context; external and prospective validation is required before operational use.
4.3. Future Work
Future research should extend the present framework to improve predictive accuracy, causal interpretation, and operational usefulness.
i. Longer time series and finer spatial data should be incorporated, including road segments, intersections, traffic volume, weather, enforcement, and emergency-response information.
ii. External and prospective validation should be conducted using data from additional years and regions to assess model transferability, stability, and recalibration requirements.
iii. Future studies should evaluate whether interventions guided by the policy-priority index lead to measurable reductions in crashes, fatalities, and injuries.
5. Conclusions
This study developed a reproducible, leakage-safe, uncertainty-aware, and policy-oriented framework for road accident analysis and risk prediction in Bangladesh using monthly data from January 2023 to December 2025. Rather than presenting standard algorithms as methodological innovations, the study contributes an integrated decision architecture that combines heterogeneous data sources, exposure-normalized risk, temporal validation, empirical-Bayes stabilization, conformal uncertainty, feature ablation, hotspot persistence, spatial concentration, and transparent policy prioritization.
The results showed that absolute burden and normalized risk produced different geographical priorities. Dhaka and Chattogram remained the principal high-burden divisions, while Barishal and Sylhet exhibited stronger persistent and emerging exposure-adjusted risk. Motorcycles retained the highest stabilized fatality risk, but auto rickshaws, easy bikes, battery-operated auto rickshaws, and other lightly protected vehicles also required targeted attention. Spatial-seasonal analysis further demonstrated that risk varied substantially across both divisions and months, supporting geographically and temporally differentiated interventions.
Rigorous out-of-time benchmarking showed that Random Forest achieved the lowest fatality-prediction error, although Gradient Boosting, Extra Trees, Ridge, Poisson, Tweedie, and seasonal-naïve models remained competitive. This confirms that nonlinear models can improve prediction, but also shows that model complexity should be justified through transparent baseline comparison. Conformal intervals revealed substantial uncertainty, and the ablation analysis demonstrated that the temporal-plus-demographic specification generalized better than the fully integrated feature set. These findings support parsimonious model design and caution against assuming that more variables or more complex algorithms necessarily improve performance.
The framework has direct practical relevance for seasonal enforcement, vehicle-specific regulation, infrastructure prioritization, emergency-response allocation, and divisional monitoring. The policy-priority index helps distinguish areas requiring large-scale resources from those requiring early preventive action. However, the outputs should support, not replace, engineering judgement and local institutional knowledge. Longer time series, finer spatial and exposure data, improved vehicle coding, and prospective external validation are required before operational deployment.
Overall, the study advances road-safety analysis in Bangladesh by moving beyond simple descriptive rankings and isolated machine-learning applications toward a validated, interpretable, and actionable decision-support framework.
Author Contributions
Sree Pradip Kumer Sarker contributed to conceptualization, methodology, software, validation, formal analysis, investigation, resources, data curation, writing original draft preparation, writing review and editing, and visualization. Dr. Md. Shahid Mamun provided supervision throughout all stages of the research, including study design, methodology refinement, manuscript review and editing, and overall guidance. All authors have read and agreed to the published version of the manuscript.
Funding
This research received no external funding.
Informed Consent Statement
Not applicable.:
Data Availability Statement
The data supporting the findings of this study are included within the article in the form of tables and figures. The processed datasets used for analysis were compiled from publicly available official statistics published by the Bangladesh Road Transport Authority (BRTA) and BBS population statistics. No additional datasets were generated beyond those presented in this manuscript.
Acknowledgments
The authors gratefully acknowledge the Department of Civil Engineering, Ahsanullah University of Science and Technology (AUST), Dhaka, Bangladesh, for providing academic guidance, research support, and a conducive environment for conducting this study. The authors also acknowledge the BRTA and BBS for making the official road accident and population statistics publicly available, which formed the basis of this research.
Conflicts of Interest
The authors declare no conflicts of interest.
Abbreviations
The following abbreviation are used in this manuscript:
| BBS | Bangladesh Bureau of Statistics |
| BRTA | Bangladesh Road Transport Authority |
References
- Behboudi, N.; Moosavi, S.; Ramnath, R. Recent advances in traffic accident analysis and prediction: A comprehensive review of machine learning techniques. arXiv 2024, arXiv:2406.13968. [Google Scholar]
- Dabhade, S.; Mahale, S.; Chitalkar, A.; Gawhad, P.; Pagare, V. Road accident analysis and prediction using machine learning. Int. J. Res. Appl. Sci. Eng. Technol. 2020, 8, 100–103. [Google Scholar] [CrossRef]
- Chand, A.; Jayesh, S.; Bhasi, A.B. Road traffic accidents: An overview of data sources, analysis techniques and contributing factors. Mater. Today Proc. 2021, 47, 5135–5141. [Google Scholar] [CrossRef]
- Ma, Z.; Mei, G.; Cuomo, S. An analytic framework using deep learning for prediction of traffic accident injury severity based on contributing factors. Accid. Anal. Prev. 2021, 160, 106322. [Google Scholar] [CrossRef] [PubMed]
- Shanshal, D.; Babaoglu, C.; Başar, A. Prediction of fatal and major injury of drivers, cyclists, and pedestrians in collisions. Promet Traffic Transp. 2020, 32, 39–53. [Google Scholar] [CrossRef]
- Tang, J.; Huang, Y.; Liu, D.; Xiong, L.; Bu, R. Research on traffic accident severity level prediction model based on improved machine learning. Systems 2025, 13, 31. [Google Scholar] [CrossRef]
- Ahammad, S.H.; et al. A novel approach to avoid road traffic accidents and develop safety rules for traffic using crash prediction model technique. In Proceedings of the 6th International Conference on Microelectronics, Electromagnetics and Telecommunications (ICMETE); Springer: Singapore, 2023; pp. 367–377. [Google Scholar]
- Kuyumcu, Z.Ç.; Aslan, H.; Yurtay, N. Identifying interrelated factors of fatal and injury traffic accidents using association rules. Turk. J. Civ. Eng. 2023, 34, 55–80. [Google Scholar] [CrossRef]
- Datu, N.H. Road traffic accidents analysis using association rule mining and descriptive analytics. In AIP Conference Proceedings; AIP Publishing: Melville, NY, USA, 2023. [Google Scholar]
- Emu, M.; Kamal, F.B.; Choudhury, S.; Rahman, Q.A. Fatality prediction for motor vehicle collisions: Mining big data using deep learning and ensemble methods. IEEE Open J. Intell. Transp. Syst. 2022, 3, 199–209. [Google Scholar] [CrossRef]
- Yadav, J.; Batra, K.; Goel, A.K. A framework for analyzing road accidents using machine learning paradigms. In Journal of Physics: Conference Series; IOP Publishing: Bristol, UK, 2021. [Google Scholar]
- Gan, J.; Li, L.; Zhang, D.; Yi, Z.; Xiang, Q. An alternative method for traffic accident severity prediction: Using deep forests algorithm. J. Adv. Transp. 2020, 2020, 1257627. [Google Scholar] [CrossRef]
- Hébert, A.; et al. High-resolution road vehicle collision prediction for the city of Montreal. In Proceedings of the IEEE International Conference on Big Data, Los Angeles, CA, USA, 9–12 December 2019. [Google Scholar]
- Labib, M.F.; et al. Road accident analysis and prediction of accident severity using machine learning in Bangladesh. In Proceedings of the 7th International Conference on Smart Computing and Communications (ICSCC); IEEE: Mangalore, India, 2019. [Google Scholar]
- Parathasarathy, G.; et al. Using hybrid data mining algorithm for analysing road accidents data set. In Proceedings of the 3rd International Conference on Computing and Communications Technologies (ICCCT); IEEE: Chennai, India, 2019. [Google Scholar]
- Kumeda, B.; et al. Classification of road traffic accident data using machine learning algorithms. In Proceedings of the IEEE International Conference on Communication Systems and Network Technologies (ICSCN); IEEE, 2019. [Google Scholar]
- Al Mamlook, R.E.; et al. Machine learning to predict freeway traffic accidents based on driving simulation. In Proceedings of the IEEE National Aerospace and Electronics Conference (NAECON); IEEE: Dayton, OH, USA, 2019. [Google Scholar]
- Alam, Z. Improving road safety in India using data mining techniques. In Proceedings of the International Conference on Recent Developments in Science, Engineering and Technology; Springer: Singapore, 2017. [Google Scholar]
- Babaoglu, L.; Babaoglu, C. Prediction of fatalities in vehicle collisions in Canada. Promet Traffic Transp. 2021, 33, 661–669. [Google Scholar] [CrossRef]
- Punjab Emergency Service. Road Traffic Accident Dataset (RTA). 2023. Available online: https://doi.org/10.7910/DVN/4VGTDR (accessed on 11 July 2026). [CrossRef]
- Abid, M.S.; et al. Road Traffic Accident Analysis (Version 1.0). 2026. Available online: https://doi.org/10.5281/zenodo.18184155 (accessed on 11 July 2026). [CrossRef]
Figure 1.
Methodology.
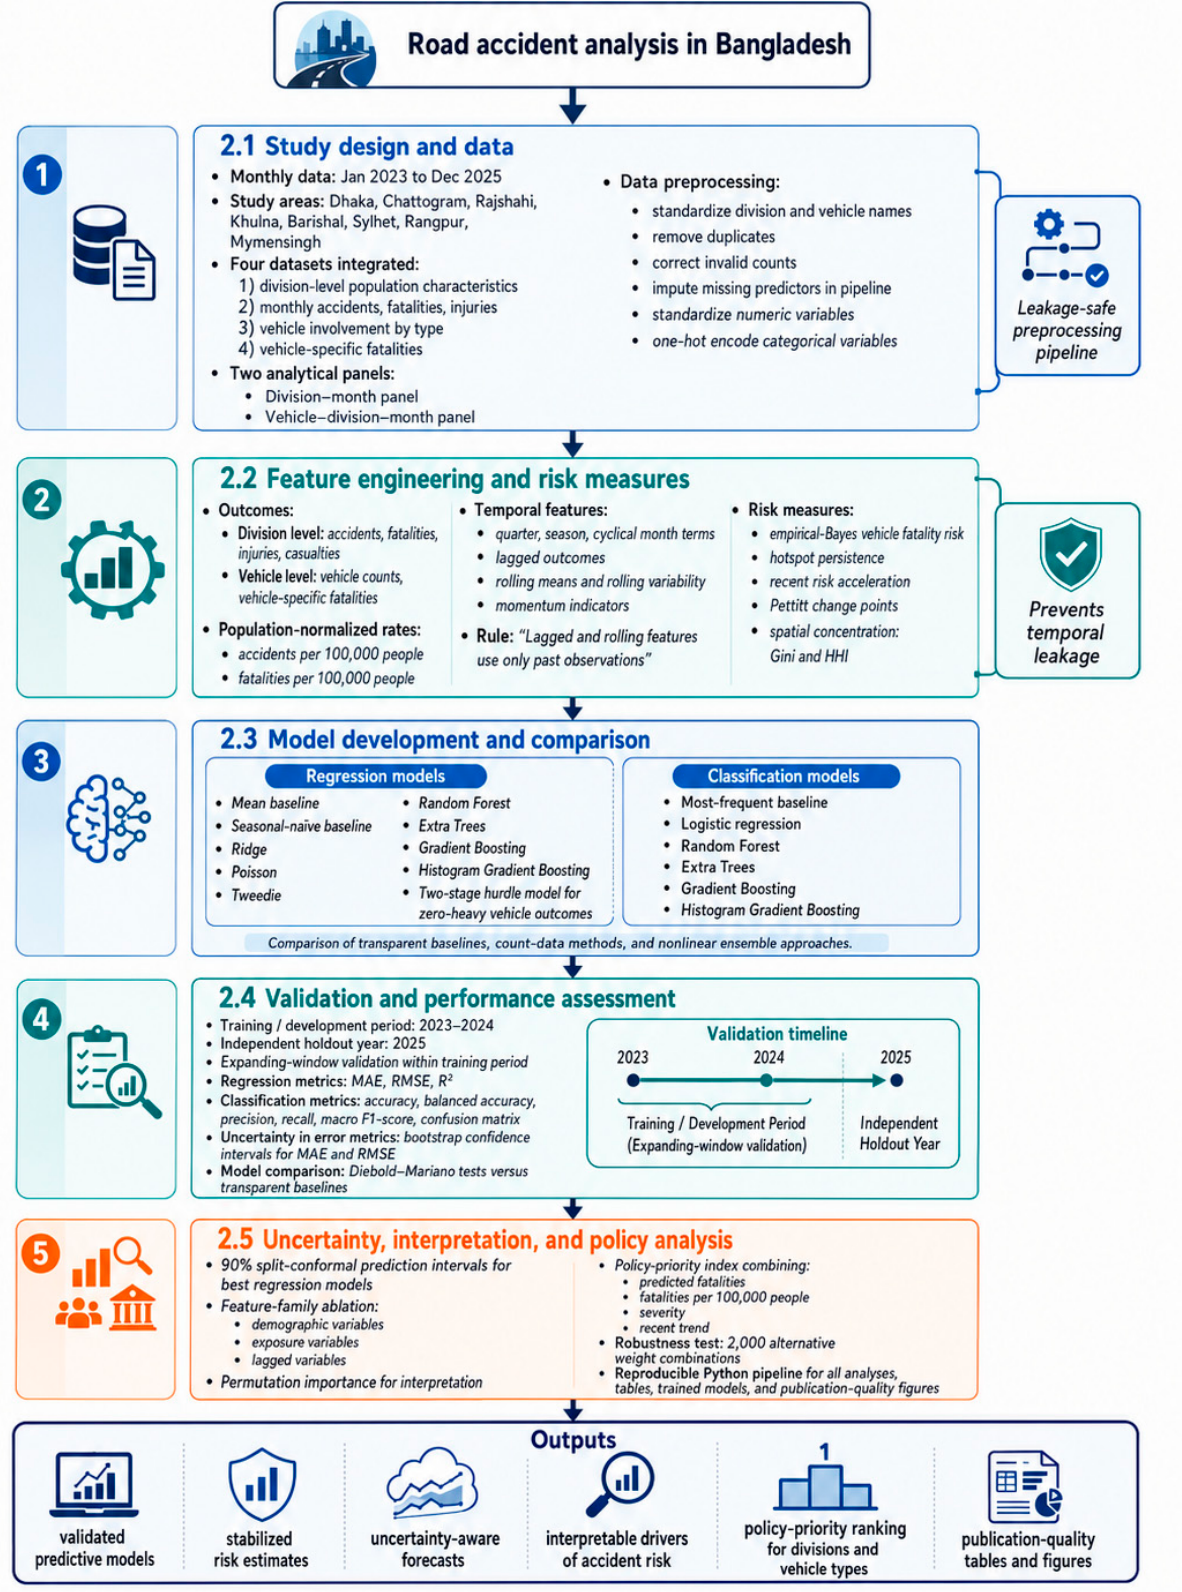
Figure 2.
Annual road accident trends.
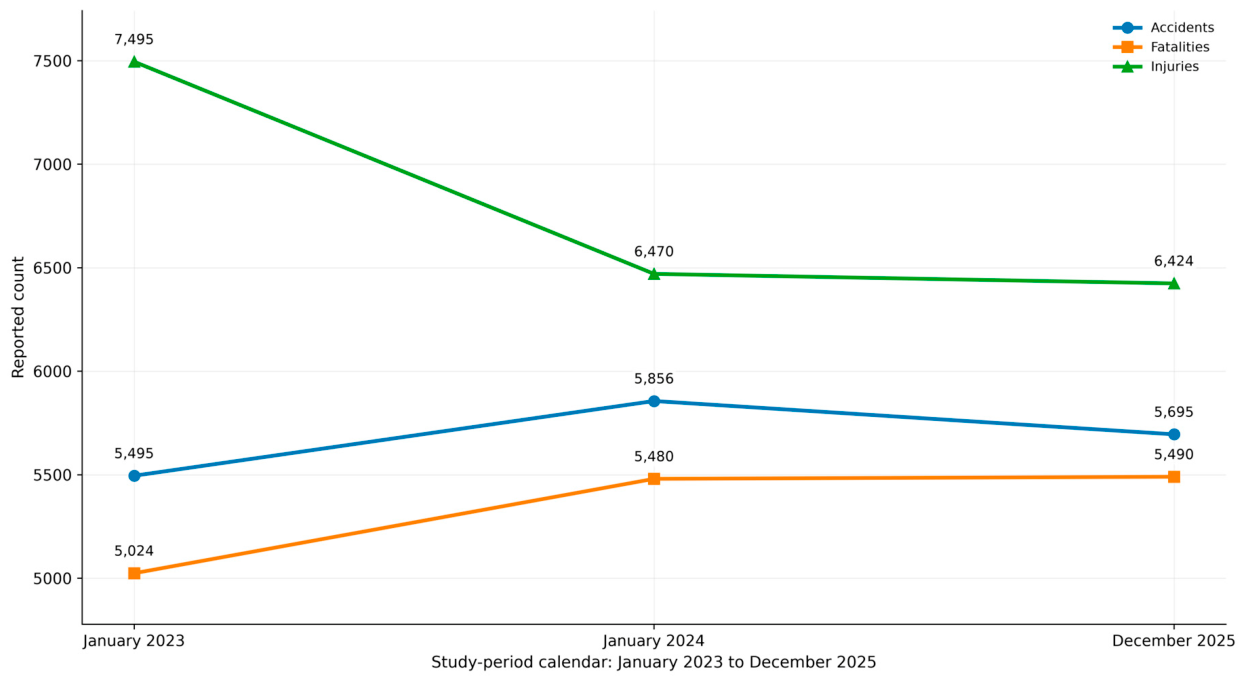
Figure 3.
Quarterly road accident.
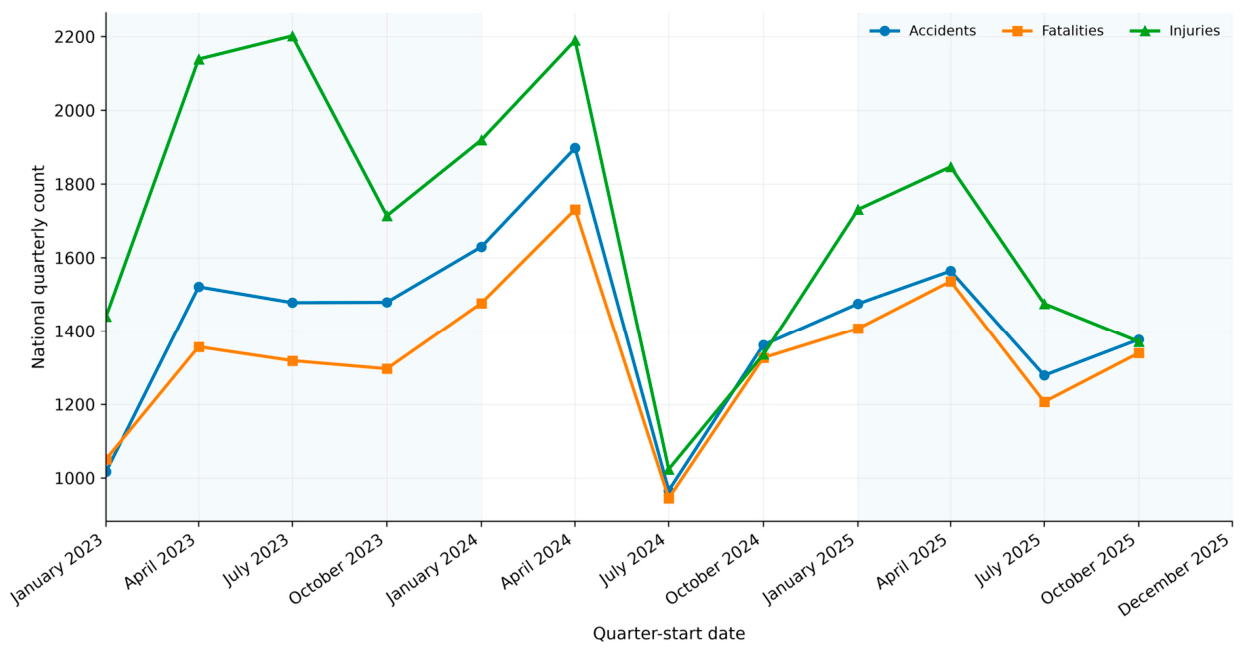
Figure 4.
Exposure-normalized divisional fatality risk.
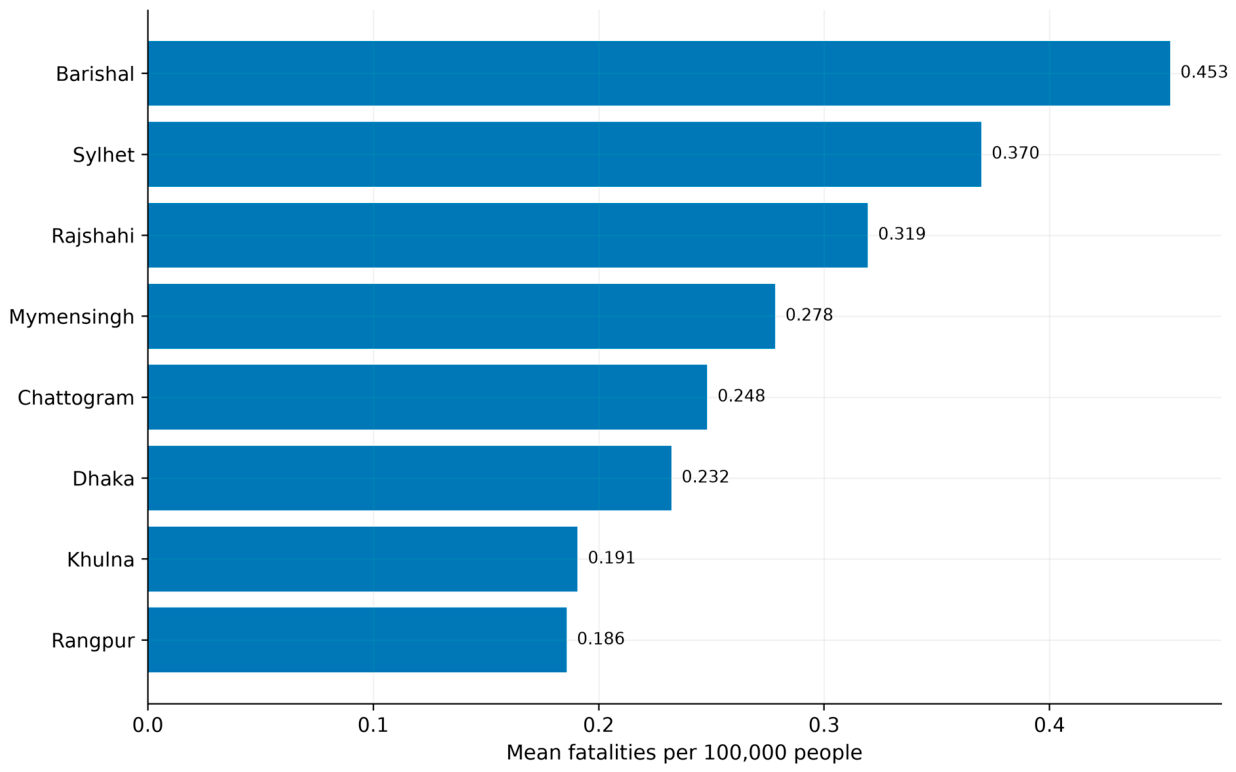
Figure 5.
Divisional risk varies considerably over the months.
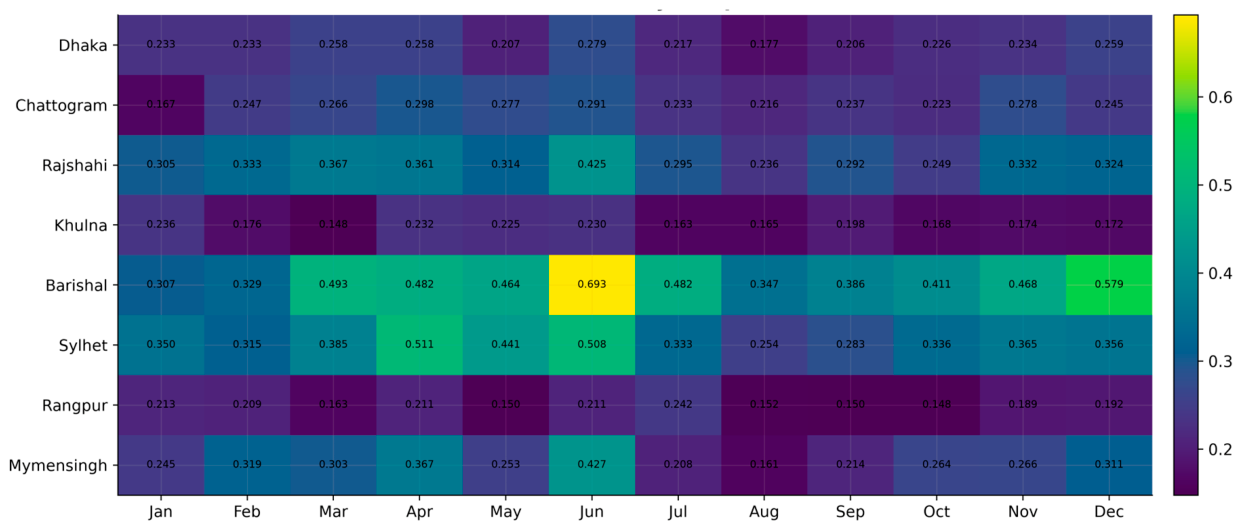
Figure 6.
Empirical-Bayes Stabilized Fatality Risk.
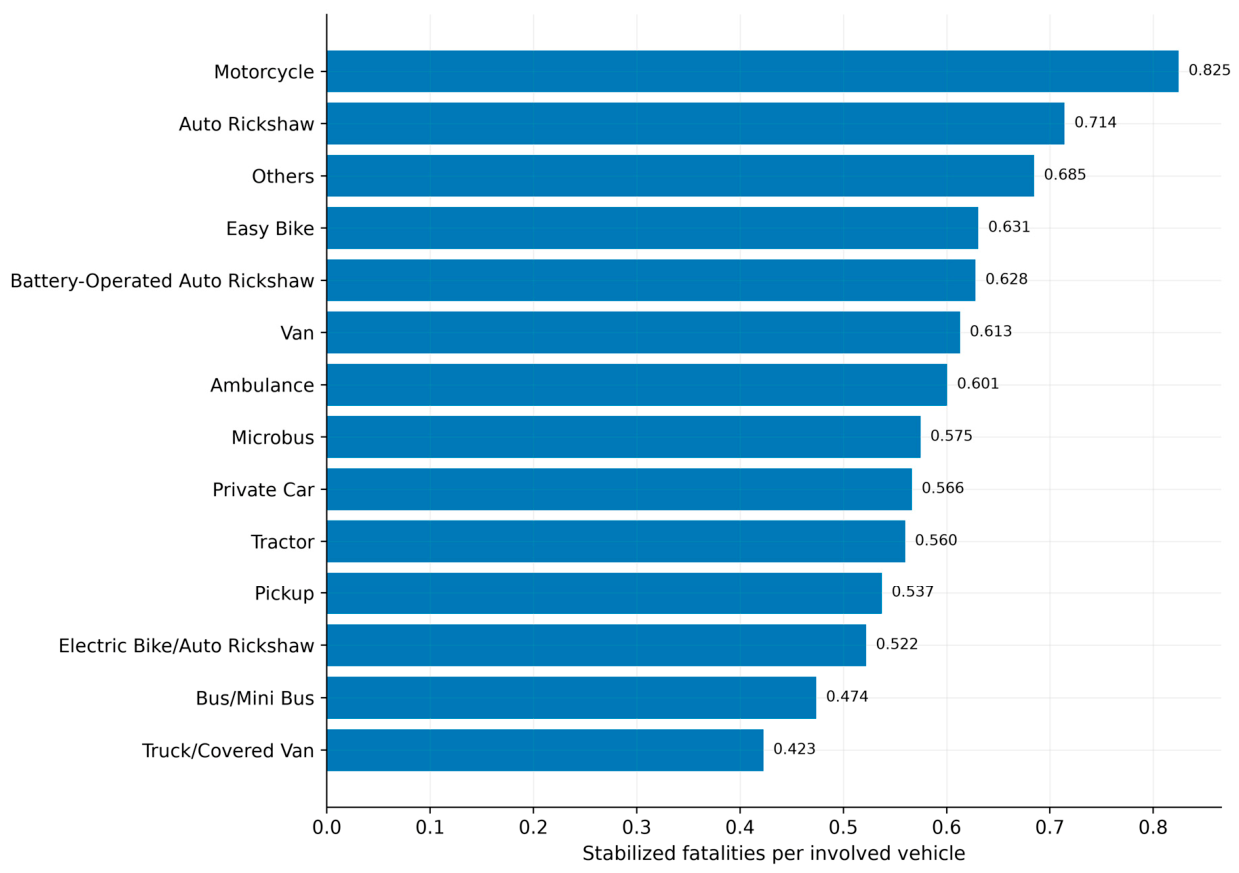
Figure 7.
Risk of vehicle fatality varies geographically.
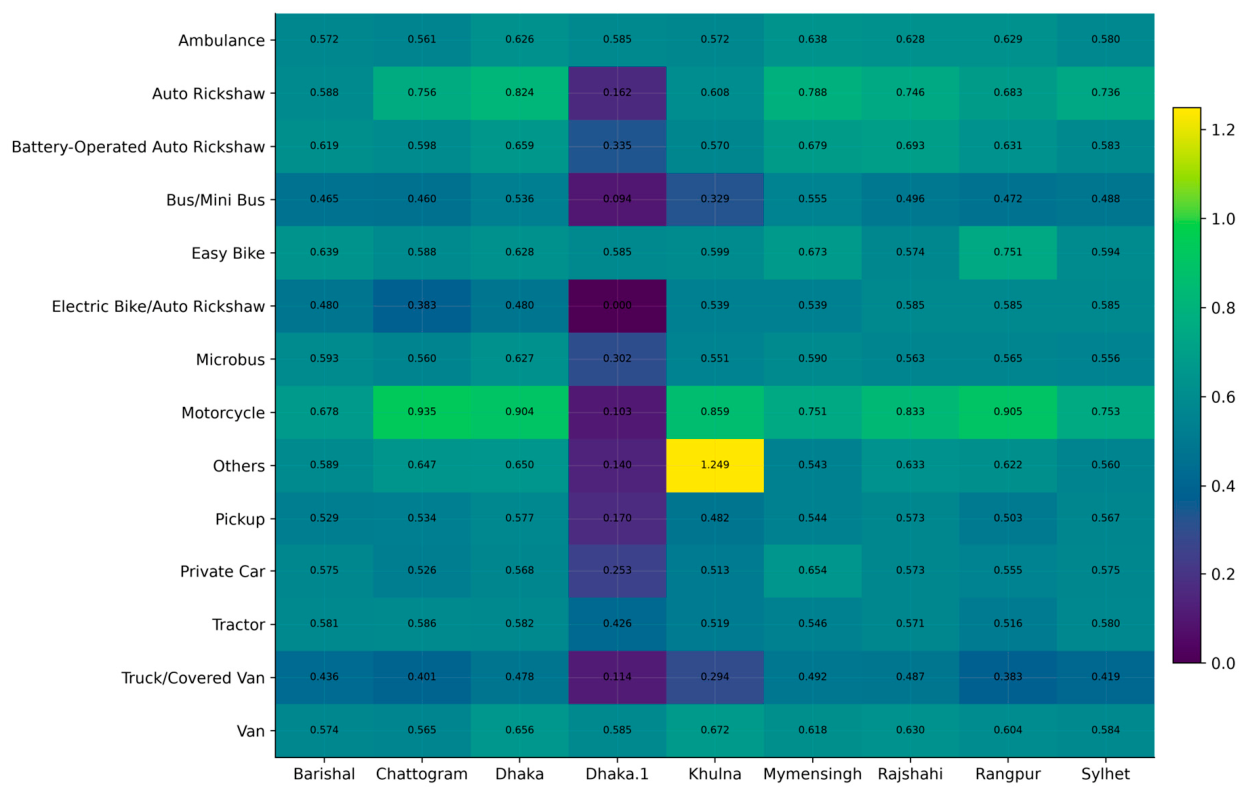
Figure 8.
Divisional Risk Trajectories.
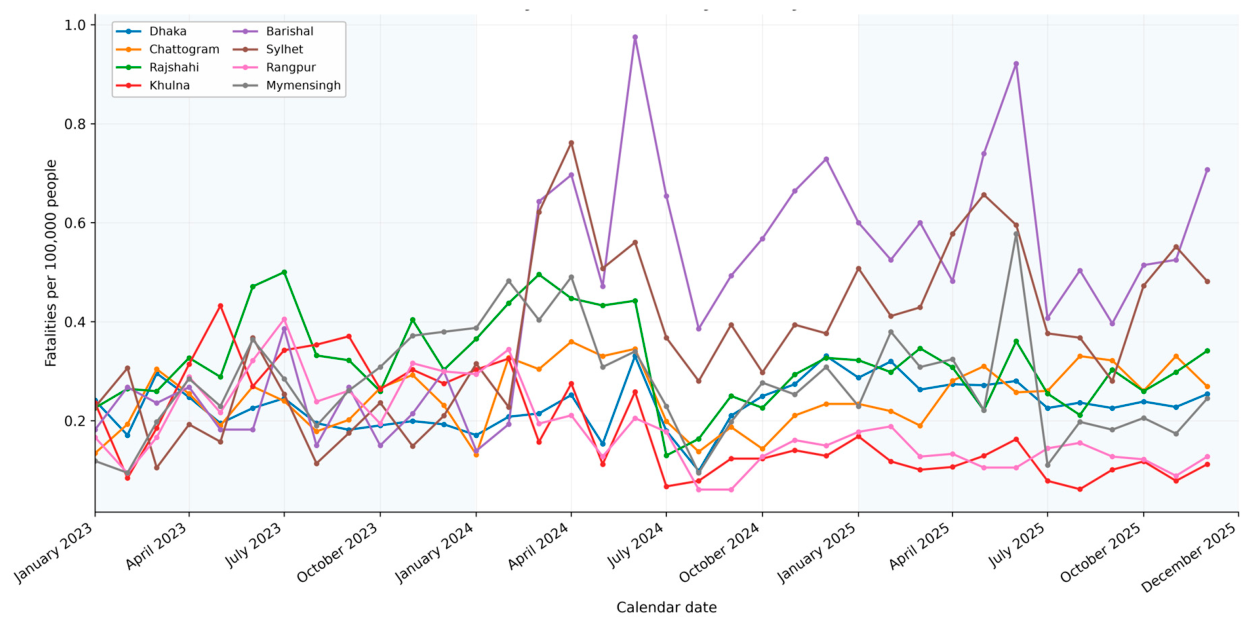
Figure 9.
Comparison of fatality prediction models.
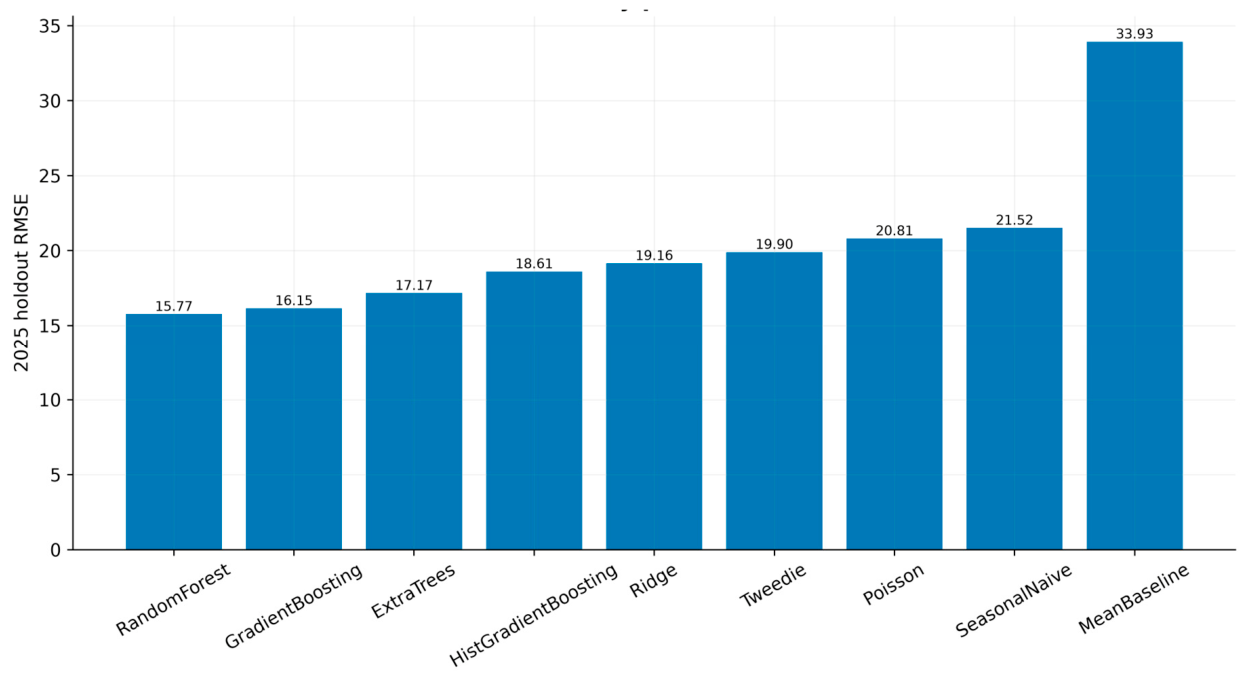
Figure 10.
Observed vs Predicted.
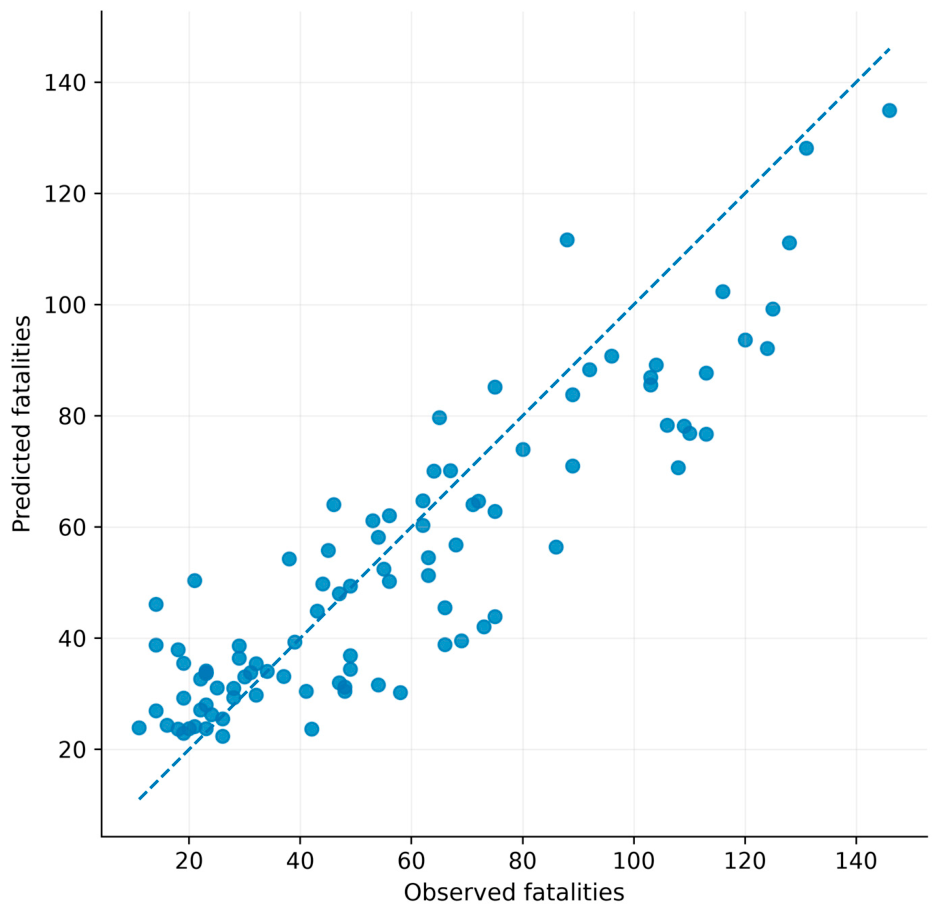
Figure 11.
Conformal intervals.
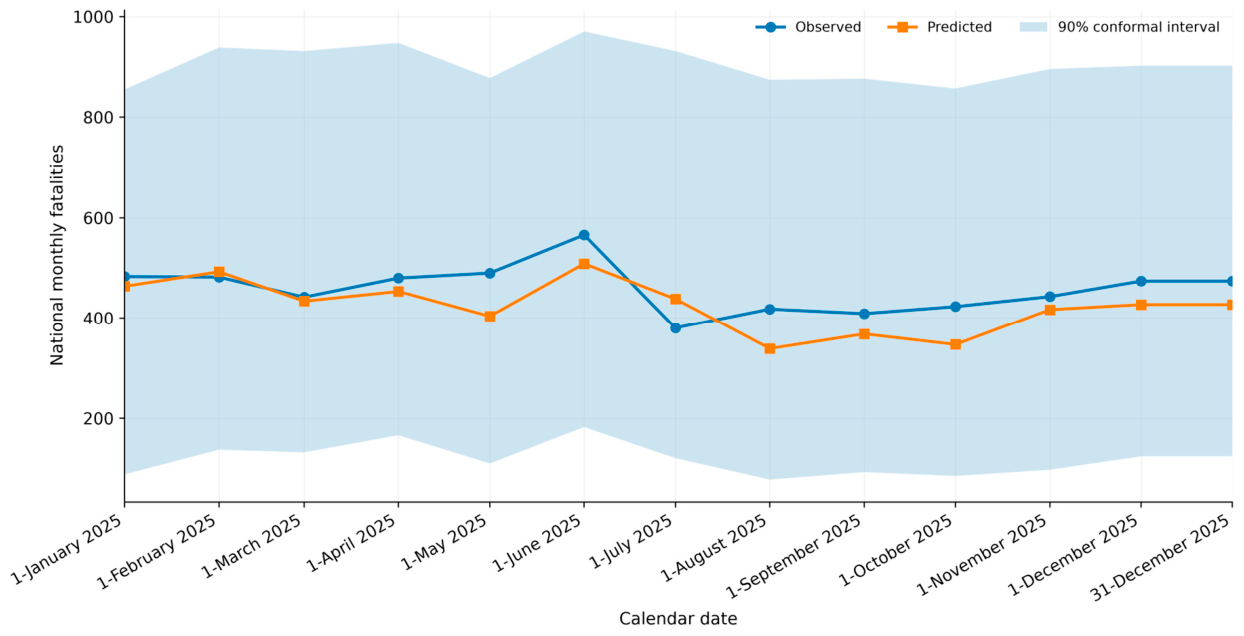
Figure 12.
Feature importance.
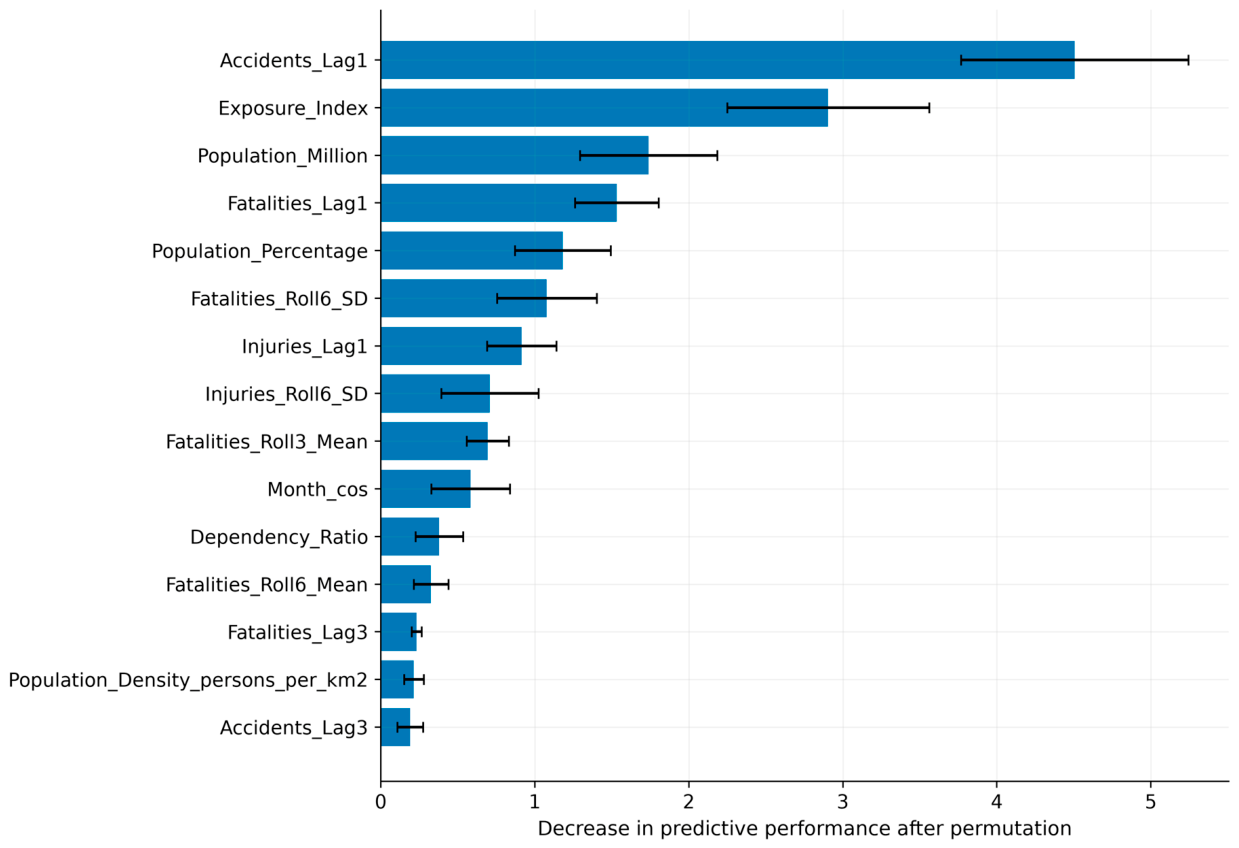
Figure 13.
Ablation study.
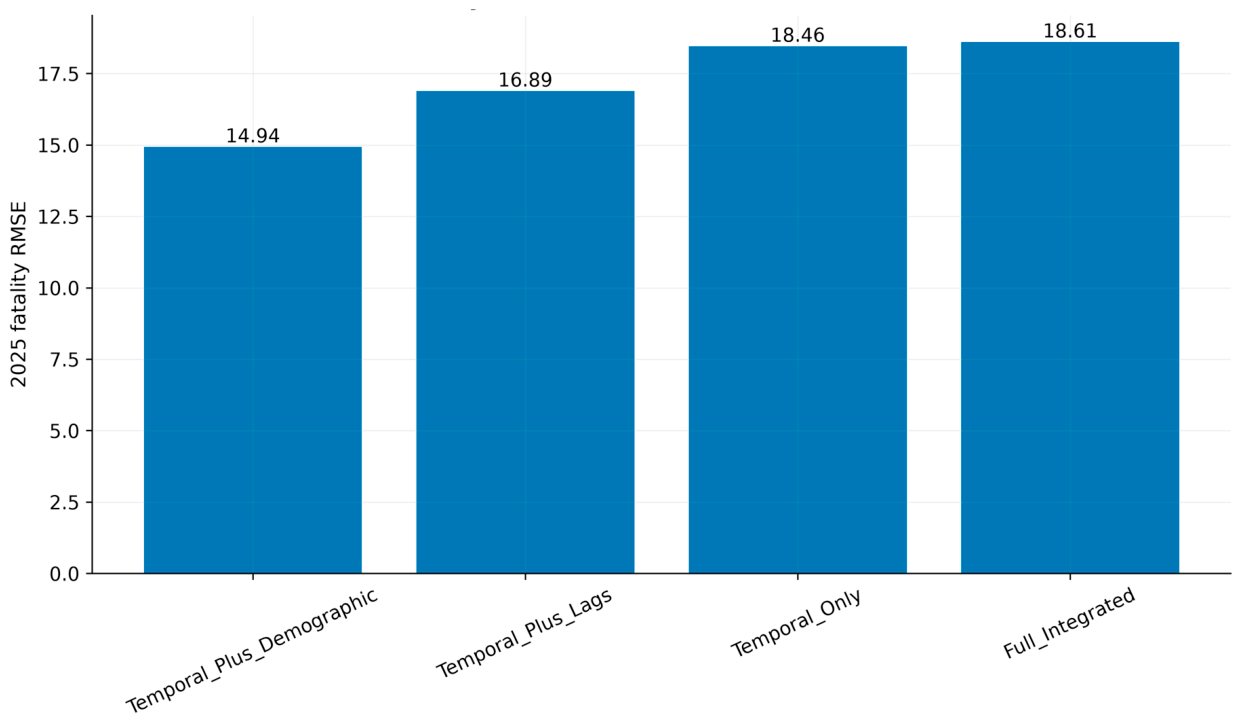
Figure 14.
Policy priority.
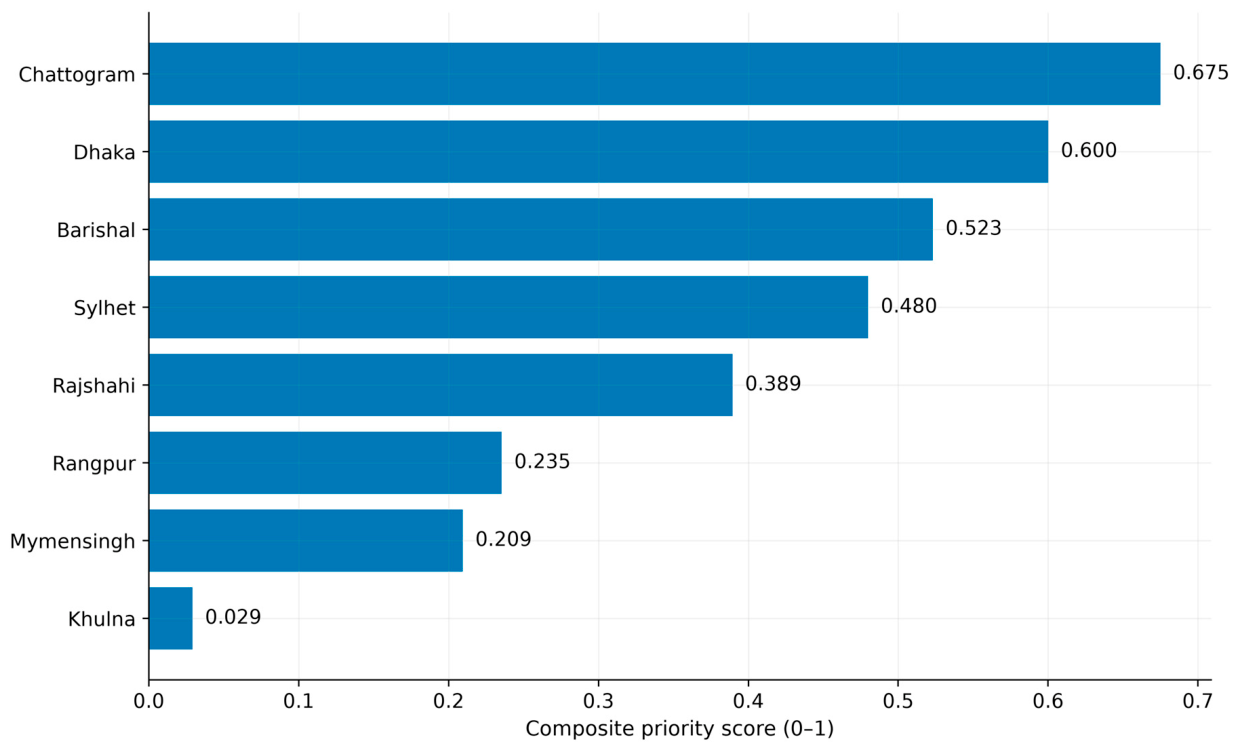
Figure 15.
Spatial concentration.
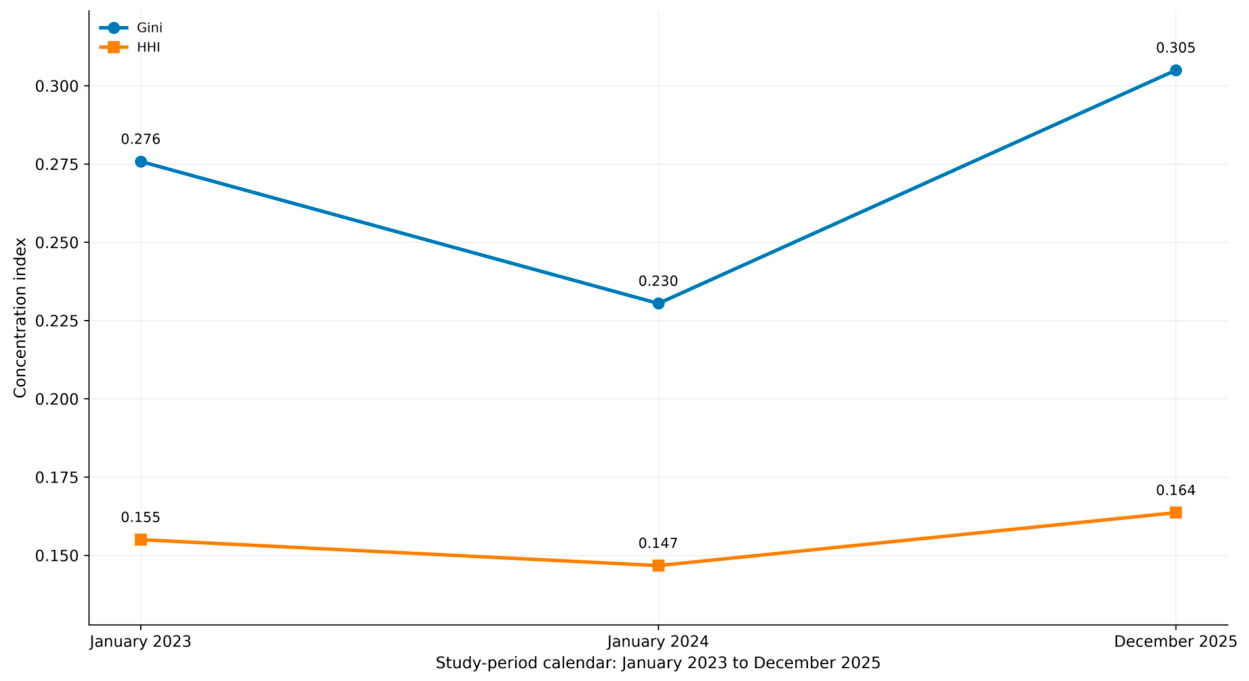
Figure 16.
Emerging hotspot score.
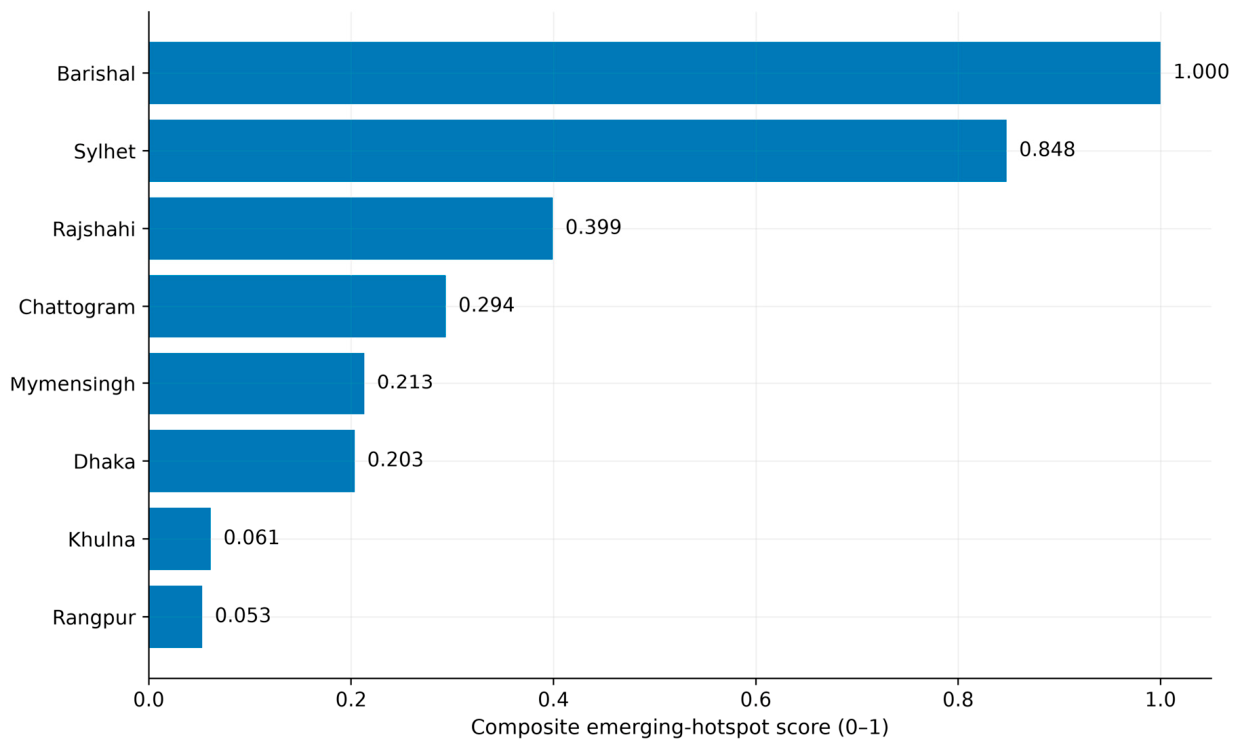

Table 1.
Annual road accident trends (2023-2025).
| Year | Accidents | Fatalities | Injuries |
|---|---|---|---|
| 2023 | 5,495 | 5,024 | 7,495 |
| 2024 | 5,856 | 5,480 | 6,470 |
| 2025 | 5,695 | 5,490 | 6,424 |
Table 2.
Exposure-normalized divisional fatality risk.
| Rank | Division | Mean fatalities per 100,000 |
|---|---|---|
| 1 | Barishal | 0.453 |
| 2 | Sylhet | 0.370 |
| 3 | Rajshahi | 0.319 |
| 4 | Mymensingh | 0.278 |
| 5 | Chattogram | 0.248 |
| 6 | Dhaka | 0.232 |
| 7 | Khulna | 0.191 |
| 8 | Rangpur | 0.186 |
Table 3.
Spatial-seasonal variation.
| Division | Peak month | Peak fatalities per 100,000 |
|---|---|---|
| Barishal | June | 0.693 |
| Sylhet | April | 0.511 |
| Rajshahi | June | 0.425 |
| Mymensingh | June | 0.427 |
| Chattogram | April | 0.298 |
| Dhaka | June | 0.279 |
Table 4.
Leading vehicle categories by stabilized fatality risk.
| Rank | Vehicle type | Empirical-Bayes risk |
|---|---|---|
| 1 | Motorcycle | 0.825 |
| 2 | Auto Rickshaw | 0.714 |
| 3 | Others | 0.685 |
| 4 | Easy Bike | 0.631 |
| 5 | Battery-Operated Auto Rickshaw | 0.628 |
| 6 | Van | 0.613 |
| 7 | Ambulance | 0.601 |
| 8 | Microbus | 0.575 |
Table 5.
Fatality-prediction performance on the 2025 holdout set.
| Rank | Model | RMSE |
|---|---|---|
| 1 | Random Forest | 15.77 |
| 2 | Gradient Boosting | 16.15 |
| 3 | Extra Trees | 17.17 |
| 4 | Histogram Gradient Boosting | 18.61 |
| 5 | Ridge | 19.16 |
| 6 | Tweedie | 19.90 |
| 7 | Poisson | 20.81 |
| 8 | Seasonal Naïve | 21.52 |
| 9 | Mean Baseline | 33.93 |
Table 6.
Leading predictors from permutation importance.
| Rank | Predictor | Relative importance |
|---|---|---|
| 1 | Accidents_Lag1 | Highest |
| 2 | Exposure_Index | High |
| 3 | Population_Million | Moderate–high |
| 4 | Fatalities_Lag1 | Moderate |
| 5 | Population_Percentage | Moderate |
| 6 | Fatalities_Roll6_SD | Moderate |
| 7 | Injuries_Lag1 | Moderate |
Table 7.
Feature-family ablation results.
| Feature specification | 2025 RMSE |
|---|---|
| Temporal + demographic | 14.94 |
| Temporal + lagged | 16.89 |
| Temporal only | 18.46 |
| Fully integrated | 18.61 |
Table 8.
Division-level policy-priority ranking.
| Rank | Division | Priority score |
|---|---|---|
| 1 | Chattogram | 0.675 |
| 2 | Dhaka | 0.600 |
| 3 | Barishal | 0.523 |
| 4 | Sylhet | 0.480 |
| 5 | Rajshahi | 0.389 |
| 6 | Rangpur | 0.235 |
| 7 | Mymensingh | 0.209 |
| 8 | Khulna | 0.029 |
Table 9.
Spatial concentration indices.
| Year | Gini coefficient | HHI |
|---|---|---|
| 2023 | 0.276 | 0.155 |
| 2024 | 0.230 | 0.147 |
| 2025 | 0.305 | 0.164 |
Table 10.
Emerging-hotspot ranking.
| Rank | Division | Emerging-hotspot score |
|---|---|---|
| 1 | Barishal | 1.000 |
| 2 | Sylhet | 0.848 |
| 3 | Rajshahi | 0.399 |
| 4 | Chattogram | 0.294 |
| 5 | Mymensingh | 0.213 |
| 6 | Dhaka | 0.203 |
| 7 | Khulna | 0.061 |
| 8 | Rangpur | 0.053 |
Disclaimer/Publisher’s Note: The statements, opinions and data contained in all publications are solely those of the individual author(s) and contributor(s) and not of MDPI and/or the editor(s). MDPI and/or the editor(s) disclaim responsibility for any injury to people or property resulting from any ideas, methods, instructions or products referred to in the content. |
© 2026 by the authors. Licensee MDPI, Basel, Switzerland. This article is an open access article distributed under the terms and conditions of the Creative Commons Attribution (CC BY) license.
Copyright: This open access article is published under a Creative Commons CC BY 4.0 license, which permit the free download, distribution, and reuse, provided that the author and preprint are cited in any reuse.