

Submitted:
23 July 2026
Posted:
24 July 2026
You are already at the latest version
Abstract
The construction industry plays a pivotal role in the decarbonization process and the transition toward circular economy models. Within a regulatory framework redefined by the EPBD IV Directive—which introduces Life Cycle Global Warming Potential (LC-GWP) as a mandatory indicator for new buildings—this study analyzes the integration of Building Information Modeling (BIM) and Life Cycle Assessment (LCA) to support design decisions aimed at reducing embodied carbon. Addressing challenges highlighted in the literature—such as platform interoperability, inconsistent Environmental Product Declaration (EPD) quality, and a scarcity of practical case studies—a BIM-LCA workflow was developed using Autodesk Revit and One Click LCA, supplemented by a cloud platform to account for elements not modeled in 3D. The method was applied to the design of a nursery school in the Municipality of Montoro, evaluating six material scenarios in terms of Global Warming Potential (stages A1–A3) and supply costs. The results demonstrate that using materials with high recycled content enables the achievement of Class B ratings with minimal cost increases, while an alternative floor slab system allows for Class A certification and superior environmental performance. The study confirms the effectiveness of the BIM-LCA approach as an operational tool for sustainable public design that complies with EPBD IV requirements.
Keywords:
BIM-LCA integration
; Building Information Modeling
; Life Cycle Assessment
; embodied carbon
; EPBD IV
; One Click LCA
; Autodesk Revit
; EPD
; buildings decarbonization
1. Introduction
In recent years, the increase in extreme weather events has made it urgent to drastically reduce carbon dioxide (CO2) emissions, with the goal of achieving a carbon-neutral society and limiting the rise in global temperature to 1.5–2°C. In this context, the construction sector plays a crucial role: at the European level, it accounts for 40% of primary energy demand and 36% of greenhouse gas emissions, while in Italy, the residential sector contributes 27.9% to energy consumption and 24.2% to climate-changing emissions.
Despite the evidence provided by these figures, the issue of embodied carbon—the emissions generated by the production, transportation, and installation of materials—remains largely overlooked, especially in Italy. Traditionally, attention has focused on energy consumption during the operational phase of buildings, neglecting the other stages of the life cycle.
For a comprehensive assessment of a building’s climate impact, it is essential to consider two components:
- Embodied carbon: Estimates from the Green Building Council indicate that more than 50% of emissions from new construction between 2020 and 2050 will be attributable to materials and the construction or renovation phases. Globally, the United Nations Environment Programme (UNEP) estimates that this accounts for approximately 11% of greenhouse gas emissions.
- Operational carbon: This refers to emissions generated during the use, maintenance, and management of buildings, accounting for 28% of global emissions.
In Italy, the demand for construction materials has a significant impact on the landscape: according to Legambiente’s 2021 Quarry Report, there are 4,168 active quarries and over 14,000 that are decommissioned or abandoned. Each year, approximately 29 million m3 of sand and gravel, 26.8 million m3 of limestone, and 6.2 million m3 of ornamental stone are extracted.
To mitigate climate change, it is essential to reduce emissions throughout a building’s entire life cycle, starting with the choice of materials. The construction sector can play a leading role in the transition to a circular economy by leveraging recycling, recovery, and innovation in materials [1]. The 2023 Impact Report by GBC (Green Building Council) Italia [2] represents the first assessment of the impact of certified sustainable construction in Italy. The report’s main objective is to measure, in a concrete and transparent manner, the environmental, economic, and social benefits generated by buildings certified according to LEED and GBC protocols. GBC Italy—a member of the World Green Building Council’s global network—brings together companies, professionals, and institutions with the mission of promoting a culture of sustainable construction and contributing to the decarbonization of the construction sector, which accounts for approximately 37% of global CO2 emissions. The Energy Performance of Buildings Directive (EPBD) [3] is one of the main regulatory instruments adopted by the European Union to improve the energy efficiency of the building stock and reduce greenhouse gas emissions associated with the construction sector. The revision of the directive, approved in 2024, is part of the European climate policies outlined by the European Green Deal and the “Fit for 55” legislative package, which aim to reduce greenhouse gas emissions by at least 55% by 2030 compared to 1990 levels and to achieve climate neutrality by 2050. The EPBD (Figure 1) introduces a series of provisions aimed at progressively improving the energy performance of existing buildings, promoting the construction of nearly zero-emission buildings, and facilitating the integration of renewable energy sources into the building sector [4,5,6].
The main objective of Directive (EU) 2024/1275 [3] is to achieve a zero-emission building stock by 2050, contributing to the decarbonization of the European economy.
Among the key measures introduced are:
- the definition of the concept of Zero Emission Building (ZEB), intended to gradually replace the NZEB model;
- the introduction of minimum energy performance standards (MEPS) for the least efficient buildings;
- the requirement for the gradual improvement of the energy performance classes of the existing building stock;
- the strengthening of policies for deep energy renovation.
The directive also establishes a timeline for the energy transition in the building sector, calling for the improvement of the energy performance of residential and non-residential buildings through progressive retrofitting measures.
The evolution of the EPBD highlights a gradual strengthening of European policies regarding the energy efficiency of buildings. Since the first directive in 2002, which focused primarily on energy certification and minimum performance requirements, there has been a shift toward an increasingly integrated approach that includes the retrofitting of existing buildings, the digitization of buildings, and the goal of climate neutrality.
The evolution of building codes toward increasingly sustainable design and management models—by promoting the integration of energy efficiency, technological innovation, and the reduction of greenhouse gas emissions—has progressively shaped the sector at the European level. In this context, advanced design and environmental assessment tools such as Building Information Modeling (BIM) and Life Cycle Assessment (LCA) play a strategic role in supporting decision-making and facilitating the construction of low-carbon buildings.
Building Information Modeling (BIM) allows for the creation of a dynamic virtual model of a building—not merely a three-dimensional representation, but an advanced repository of information regarding: geometry, materials, structural framework, thermal characteristics and energy performance, systems, costs, safety, maintenance, life cycle, demolition, and decommissioning.
Thanks to this methodology, the building is, in a sense, “constructed” virtually before physical construction begins, through a collaborative process involving architects, engineers, designers, consultants, and energy analysts. This highly strategic approach makes it possible to analyze and evaluate the building’s performance as early as the design phase, thereby improving the quality, efficiency, and control of the construction process.
The main reference standards are:
- UNI EN ISO 19650 – Defines the processes for managing information throughout the entire life cycle of a structure [7].
- UNI 11337 – Defines the requirements for information management, information models, and professional roles in BIM [8].
- BIM Decree (Ministerial Decree 560/2017) – The Italian regulation that introduced the phased mandatory adoption of BIM in public procurement, with thresholds that have been lowered over time until reaching universal mandatory adoption as of January 1, 2025: the use of BIM becomes mandatory for new public construction projects and complex interventions on existing structures with a base bid amount of 1 million euros or more [9].
In Italy, the concept of LOD is defined within the regulatory framework of UNI 11337-4 [10], which addresses the “Evolution and Information Development of Models, Drawings, and Objects.”
LOD (Level of Development), translated as level of development or detail, is a fundamental standard for precisely defining how fully developed a model element is, both from a geometric and an informational standpoint. LOD is essential for ensuring clarity, consistency, and coordination among the professionals involved, thereby avoiding ambiguity and misunderstandings regarding the expected information content at each stage of the process. By defining the various levels, it becomes possible to establish what the model must represent in terms of:
- geometry (shape, position, construction details);
- associated information (materials, performance, technical data, codes, quantities);
- data reliability (forecast, analysis, construction drawings, as-built).
As mentioned earlier, LOD is not merely a graphical detail but encompasses the object’s overall informational value—that is, how usable the data is for specific activities: preliminary estimates, structural calculations, bill of quantities, energy simulations, MEP coordination, maintenance management, etc.
According to the main standards, LOD is described in terms of levels that generally include:
- LOD 100 – Conceptual: symbolic or volumetric representation, with generic and unverified data.
- LOD 200 – Approximate: more defined geometries and preliminary information.
- LOD 300 – Final: elements with reliable dimensions, locations, and properties for design.
- LOD 400 – Construction: information useful for fabrication and construction (construction details, actual components).
- LOD 500– As-built: representation of the actual condition of the completed structure, useful for maintenance and management.
The concept of the life cycle forms the basis of Life Cycle Thinking (LCT), a comprehensive approach that promotes sustainability-oriented decisions across all stages of the product life cycle (Figure 2).
This philosophy gives rise to the most robust technical tool: LCA—Life Cycle Assessment—the quantitative analysis of environmental categories such as climate change (CO2 equivalent), acidification, eutrophication, consumption of abiotic resources, photochemical smog formation, and water consumption.
To provide a precise definition of LCA, we can refer to the one proposed by SETAC (Society of Environmental Toxicology and Chemistry), according to which:
“An LCA is an objective process for evaluating the environmental impacts associated with a process, product, or activity, through the identification and quantification of the energy and materials used and the waste released into the environment […]. The assessment covers the entire life cycle of the product, process, or activity, including the extraction and processing of raw materials, manufacturing, transportation, distribution, use, reuse, recycling, and final disposal” [11].
Each stage generates input flows (materials, energy) and output flows (emissions, waste, byproducts).
The main reference standards are:
- ISO 14040 – “Environmental management – Life cycle assessment – Principles and framework” [12].
- ISO 14044 – “Environmental management – Life cycle assessment – Requirements and guidelines” (which incorporates the previous parts ISO 14041–43) [13].
- UNI EN 15978 – “Sustainability of construction – Assessment of the environmental performance of buildings – Calculation method” [14].
These standards provide the methodological framework that guides how to structure an LCA.
The procedure can be divided into four main phases (Figure 3), in accordance with ISO 14040 and ISO 14044 [12,13]:
1. Goal and Scope Definition – define why the analysis is being conducted, who will use it, and what product or service is being considered; define the functional unit (the reference measure against which input/output data are normalized); define the system boundaries, i.e., which processes and life cycle stages are included.
2. Life Cycle Inventory (LCI) – collection and quantification of incoming and outgoing material and energy flows associated with the system under consideration; creation of a flow diagram illustrating the main stages of the process; collection of primary data (direct measurements), secondary data (literature, databases), and tertiary data (estimates).
3. Life Cycle Impact Assessment (LCIA) – classification: assignment of inventory flows to impact categories (e.g., greenhouse effect, acidification, eutrophication, resource depletion); characterization: quantification of the overall impact using coefficients (e.g., CO2eq for the greenhouse effect); optional normalization and weighting steps.
4. Interpretation and Improvement Assessment – analysis of the results to identify the most critical components of the system; formulation of recommendations to reduce environmental impact, improve efficiency, and increase the product’s durability or recyclability; verification of the study’s completeness, sensitivity, and consistency (in some cases, an external critical review).
The UNI EN 15978:2011 standard [14], Sustainability of construction – Assessment of the environmental performance of buildings – Calculation method, defines the procedures for determining the environmental performance of buildings according to the LCA approach. The standard establishes the calculation method, the rules for reporting results, and the criteria applicable to both new and existing buildings, as well as to renovation projects.
In this standard, the building’s life cycle is divided into five main phases:
1. Production (A1–A3): includes the procurement of raw materials (A1), their transport to production sites (A2), and processing to obtain construction products (A3).
2. Construction (A4–A5): includes the transport of materials from the production site to the construction site (A4) and all activities necessary for the construction of the building (A5).
3. Operation (B1–B7): covers the entire operational phase of the building: use (B1), maintenance (B2), repairs (B3), replacements (B4), renovations (B5), operational energy consumption (B6), and water consumption (B7).
4. End-of-life (C1–C4): includes activities related to decommissioning: deconstruction/demolition (C1), transport to treatment or disposal sites (C2), waste treatment (C3), and final disposal (C4). Emissions generated by these processes fall under this phase.
5. Benefits and Impacts Beyond the System (D): Considers the potential benefits derived from the reuse, recovery, or recycling of end-of-life materials, enabling a circular perspective on the process that transforms the life cycle from linear to circular.
2. State of the Art
While early research on building sustainability focused almost entirely on operational energy efficiency, the most recent literature confirms a paradigm shift toward an environmental assessment that encompasses the entire life cycle of the building. This evolution has been driven both by improvements in the energy performance of buildings—which have progressively reduced the relative weight of operational emissions discussed in §1—and by the tightening of international decarbonization targets [28,29].
Röck et al. [31] demonstrate with empirical evidence that, as operational energy consumption decreases, the contribution of embodied carbon to a building’s overall emissions balance increases significantly: in highly energy-efficient or nearly zero-energy buildings (NZEBs), emissions associated with the production and installation of materials can account for up to 50–80% of total life-cycle emissions. Pomponi and Moncaster [32] emphasize that this share is set to grow further as the energy transition progresses, making the reduction of embodied carbon one of the main unresolved challenges for achieving the construction sector’s climate goals. At the same time, research has highlighted the methodological complexity inherent in assessing embodied carbon. The dependence on the system boundaries adopted, the variability of available environmental data, and the difficulty of integrating these assessments into standard design workflows have represented—and continue to represent—significant obstacles to the widespread adoption of design practices aimed at reducing embodied carbon [15,16]. It is precisely to overcome these obstacles that research has shifted toward the integration of digital modeling tools and environmental assessment methodologies.
The integration of BIM and LCA has established itself as a key strategy for improving the efficiency and reliability of environmental assessments of buildings [16,20]. Early applications relied on manual procedures to extract quantities from the BIM model and subsequently transfer them to software dedicated to environmental assessment, with obvious limitations in terms of time, errors, and poor reproducibility [21,22].
With the evolution of digital technologies, research has shifted toward increasingly automated workflows. Safari and AzariJafari [15], in one of the most cited reviews on the topic, distinguish three main levels of integration: manual approaches, semi-automated systems, and fully automated workflows. Lu et al. [25] and Santos et al. [26] confirm this trend, highlighting how research has progressively focused on the automation of life cycle inventory (LCI), interoperability between software platforms, and the integration of environmental data into BIM models. Parece et al. [17] note that automation is now well established in the phases of quantity takeoff and inventory creation, while applications capable of effectively supporting design decisions remain limited.
In terms of typological classification, the taxonomy proposed by Wastiels and Decuypere [24] remains a well-established methodological framework: the authors identify five types of integration, ranging from the manual export of quantity takeoffs to external LCA software (Type 1) to the incorporation of environmental information directly into BIM objects with assessment conducted in parallel with the project’s evolution (Type 5). This study adopts Type 4—based on LCA plug-ins integrated into the BIM environment—implemented as a hybrid methodology (Figure 4) that includes an additional processing phase on a cloud platform, in line with the recommendations of Obrecht et al. [19] regarding the need to combine automation with expert verification of the data.
A particularly relevant area of research concerns the assessment of embodied carbon in the early design phases, referred to in the literature as BIM-based Embodied Carbon Evaluation (BIM-ECE). The systematic review by Huang et al. [16], based on eighty publications, highlights how decisions made in the preliminary phases have a decisive influence on a building’s future environmental performance, and how BIM-LCA integration can support the comparison of different design alternatives starting from the concept phase. Alzara et al. [30] and Alwan et al. [28] demonstrate the effectiveness of parametric and algorithmic approaches for the rapid evaluation of alternative scenarios, while Alotaibi et al. [29] propose systematic decarbonization strategies for multi-story buildings based on embodied carbon analysis. The quality of embodied carbon assessments depends critically on the reliability of the environmental data used. Environmental Product Declarations (EPDs), prepared in accordance with ISO 14025 [36] and structured for construction products by EN 15804+A2 [37], are currently the benchmark tool for ensuring the objectivity, verifiability, and comparability of environmental impact data. Waldman et al. [33] highlight how the quality of EPDs directly influences the reliability of embodied carbon assessments, while Anderson and Moncaster [34] demonstrate that the variability in values reported in EPDs for the same product can be significant, making careful selection of sources necessary. The integration of digital EPDs with BIM models represents one of the most promising areas of research. Giaveno et al. [35] demonstrate how the dynamic connection between BIM objects and verified environmental data enables the development of a workflow for the continuous monitoring of environmental performance throughout the entire design process, moving beyond the logic of one-off verification and introducing that of iterative improvement. However, the uneven coverage of products in EPD databases—which varies greatly across different geographic contexts—and the limited interoperability between software platforms remain significant challenges [15,16]. From a regulatory standpoint, as mentioned in §1, Directive (EU) 2024/1275 (EPBD IV) [3] introduces the Life Cycle Global Warming Potential (LC-GWP) as a mandatory indicator for new buildings, promoting the gradual integration of life cycle assessments into design and certification processes. Guízar Dena et al. [18] propose one of the first BIM-LCA frameworks explicitly developed to support compliance with this requirement, highlighting the need to harmonize the system boundaries adopted in EPDs with those required by the directive and to develop cross-validation strategies between different tools. At the same time, the European Level(s) framework [38] and the most recent research on Whole Life Carbon [40] confirm the need to adopt integrated methodologies capable of covering all life-cycle stages, from Module A1 to Module D.
A review of the literature reveals a widespread consensus on the potential of BIM-LCA integration as an operational tool for reducing the embodied carbon in buildings. However, structural challenges have emerged that continue to limit the adoption of such approaches in professional practice.
The first challenge concerns interoperability between BIM software, environmental databases, and LCA platforms [15,25,26]. Although numerous automated workflows have been developed, the transfer of information—particularly via the IFC format—continues to be a major source of error and uncertainty, as the technical nomenclature used in BIM models does not align with that of EPD databases, necessitating manual reconciliation [23,24].
The second challenge concerns the quality and availability of environmental data. Despite the growing use of EPDs, product coverage remains incomplete and varies significantly across different geographic contexts [33,34]. Studies conducted using academic licenses or limited versions of LCA software are also hindered by access to limited EPD libraries, which require the use of generic profiles instead of product-specific data. The third critical issue concerns the prevalence of methodological studies over real-world application case studies [16,17]. Much research focuses on the development of theoretical frameworks, while applications involving actual buildings—using product-specific environmental data and a systematic comparative analysis of alternative material scenarios—remain limited.
Finally, there is a significant lack of studies explicitly focused on compliance with the requirements of EPBD IV and on the assessment of LC-GWP within the Italian regulatory context, where the application of the Minimum Environmental Criteria (CAM) imposes additional compliance constraints compared to the general European framework [3,18,40].
A review of the literature reveals four main scientific gaps that this study aims to address directly.
First, BIM-LCA applications developed within the European regulatory framework following the introduction of EPBD IV remain limited, particularly with regard to the adoption of the national benchmarking system and compliance with the CAMs currently in force in Italy. This study explicitly adopts One Click LCA’s “Italy All Buildings Type 2025” benchmark and the CAM framework (Ministerial Decree of June 23, 2022) as regulatory references, ensuring full consistency with the requirements of EPBD IV and with national regulations.
Second, challenges persist regarding the automated integration of BIM models, EPDs, and environmental assessment platforms. The workflow developed in this study—based on the One Click LCA plug-in integrated into Autodesk Revit, with an integration phase on a cloud platform for components not modeled in 3D (rebar, membranes, finishes) —proposes a hybrid solution that significantly reduces manual reconciliation efforts while maintaining compatibility with CML and PEF characterization methods consistent with European regulations. The integration of additional LCI data for unmodeled structural elements represents a specific contribution to the completeness of the inventory compared to the standard practice described in the literature [16,17]. Third, most studies focus on methodological frameworks, while there are still relatively few case studies based on actual public buildings with product-specific EPD data. This study applies the BIM-LCA workflow to a newly constructed daycare center—a building type of significant public interest classified as Use Class III by the 2018 NTC—by developing six material implementation scenarios compared both in environmental terms (GWP A1–A3) and economic terms (supply cost). This environmental-economic trade-off approach directly addresses the gap in the integration between LCA and Life Cycle Costing (LCC) highlighted by Safari and Azari-Jafari [15] and by Parece et al. [17], and provides the designer with a unified decision-making tool that transforms environmental data into a design parameter on par with cost and structural strength. Finally, the research systematically explores different material optimization strategies—from the use of materials with a high recycled content to the replacement of traditional construction systems with EPS formwork solutions—quantifying their impact on the building’s environmental performance class. The goal is to demonstrate that moving from Class C to Class A in embodied carbon benchmarking is an achievable goal with limited cost increases, thereby validating the argument that the decarbonization of public buildings is a practical, actionable strategy and not merely a theoretical objective.
3. Materials and Methods
The main objective is to define an operational workflow capable of linking the digital building model to the assessment of embodied carbon, thereby supporting decision-making during the design phases.
3.1. System Boundaries
The embodied carbon analysis was developed using a “Cradle-to-Gate” system boundary (Figure 5), limited to the material production phase (modules A1–A3). This choice was made to ensure greater reliability and consistency of the data, since most available EPDs provide certified information only for these modules. Furthermore, this approach allows for an objective comparison of different technological solutions and materials, avoiding uncertainties related to the transportation, maintenance, and end-of-life phases.
3.2. Selection of the Methodology and Tools to Be Applied
The methodology adopted in this study is based on “In-Tool” integration between parametric design and life cycle assessment. This approach aims to overcome data fragmentation by transforming the BIM model from a simple geometric representation into a dynamic information database capable of providing real-time environmental feedback.
The integration was achieved by following a workflow that involves the direct extraction of quantities from the digital model. This methodological choice ensures data consistency and enables rapid comparative analyses (optioneering), which are essential for guiding design decisions toward low-impact solutions from the preliminary stages onward.
The following software tools were used for the operational implementation of this methodology:
- Autodesk Revit:
Used as a BIM authoring platform, the software enabled the creation of the building’s digital model. The accuracy of the LCA analysis is closely related to the level of detail in the modeling and the correct definition of material parameters within Revit families.
- One Click LCA:
This is an Autodesk Revit add-in that automatically extracts all relevant information—such as material names, categories/classes, geometric data, and associated units of measurement—from the BIM model. This significantly speeds up the process of filling out the “building materials” query in the One Click LCA software, allowing users to work directly within Revit to perform comprehensive LCA analyses on the materials used in the project. In addition, the plug-in offers the ability to perform rapid assessments to compare material alternatives and identify the most sustainable ones as early as the design phases without modifying the model’s geometry in Revit. [41]
The choice of this plug-in resulted from a comparative evaluation with other industry-leading solutions, particularly Tally. Although Tally is a native Revit plug-in that is highly effective for real-time analysis, it relies primarily on Sphera’s GaBi database and the TRACI methodology; while scientifically rigorous and compliant with ISO 14040 standards, this database is optimized primarily for the North American market. [42]
On the contrary, we chose to adopt One Click LCA because of its superior compliance with European and Italian regulations. Unlike the approach based on generic average data, this software provides access to an extensive database of Environmental Product Declarations (EPDs) certified according to the EN 15804 standard [37], allowing for an accurate reflection of the performance of materials actually available on the local market, using impact assessment methods such as CML and PEF that are consistent with European regulations. This feature ensures full compliance with the Minimum Environmental Criteria (CAM) and the objectives of the EPBD directive, guaranteeing that emission factors are consistent with the national production chain.
Finally, while One Click LCA’s “cloud” system requires a step outside the authoring software, it offers much more flexible data management and reporting tools compared to Tally’s rigid structure.
3.2.1. BIM Modeling
The BIM model (Figure 6) provided for the case study was developed in Autodesk Revit with a Level of Detail (LOD) of 200–300. Although the main geometries (foundations, columns, beams, floor slab, building envelope) were clearly defined, the requirements of a rigorous LCA analysis necessitated a post-processing phase to transform the design model into an accurate Life Cycle Inventory (LCI).
To ensure maximum fidelity to the actual construction, data automatically extracted from Revit was integrated with analytical estimates calculated based on the project’s technical specifications. This process made it possible to include in the calculation those elements that are not typically modeled in 3D:
- Structural Components and Substructures:
The quantity of steel for the reinforcement of framed structures and foundations was estimated, in addition to the electro-welded mesh in the floor slabs, the reinforcement for the roof joists, and the metal support profiles for the ventilated facade.
- Insulation and Protective Coatings:
The volume of thermal insulation and bituminous membrane in the foundations was calculated.
- Finishes and Ancillary Works:
Estimates were made for the quantities of plaster mesh, bonding primers, and paints for surface finishes, basing the calculations on theoretical coverage rates applied to the modeled surfaces.
3.2.2. One Click LCA Plug-In
The operational integration between the BIM environment and the analysis software was achieved by installing the dedicated plug-in, downloaded from the Autodesk App Store. Once modeling in Revit is complete, the tool enables a workflow that can be managed directly within the authoring software interface or exported to the One Click LCA cloud platform.
3.2.2.1. LCA in Autodesk Revit
Upon starting the analysis, the first step involved defining the basic parameters in the Settings section. At this stage, the key methodological decision was whether to extract quantities based on materials (Material Quantities) or family types (Family Type Quantities). This setting is crucial because it defines the granularity of the extracted data. At the same time, the system of units of measurement and the reference regulatory databases for the assessment were configured.
The “Materials” section is at the heart of the mapping process. One Click LCA aggregates the world’s leading EPD (Environmental Product Declaration) databases.
The procedure followed included:
- Automatic Recognition:
the plug-in automatically recognizes the categories, families, types, and materials present in the Revit model, organizing them into a summary table or list.
- Assignment of Environmental Profiles:
An EPD was assigned to each identified material. In cases where exact data from the manufacturer was unavailable, approximations were made using generic EPDs provided by the One Click LCA database, selected based on their consistency with the technical and physical characteristics of the materials assumed in the project.
The results are primarily expressed in terms of Global Warming Potential (GWP) through quantitative indicators and graphs. Quantitative indicators can be expressed using two complementary units of measurement:
- Metric tons of CO2e:
which indicate the absolute impact of the total materials included in the project.
- kg CO2e/m3 (or equivalent unit):
which represent the carbon intensity of each individual material, allowing for a comparison of the environmental efficiency of different products regardless of the quantity used.
To make the data easier to understand at a glance, One Click LCA uses a color-coding system based on a scale ranging from green to red. This visualization is based on two benchmarking parameters:
- Impact Quintile:
indicates the distribution of the total impact among the various elements of the project. The color red highlights a “Very High” value—that is, the components that contribute most to the building’s overall carbon footprint.
- Intensity Quintile:
this parameter compares the selected material with the average of similar products in the global database.
Light green and green indicate materials with above-average environmental performance (low impact per unit).
The colors orange and red indicate materials whose production results in high emissions compared to market standards.
This dual interpretation allows the designer to take targeted action: reducing the quantities of materials with a high “Impact Quintile” or replacing materials with a high “Intensity Quintile” with more sustainable alternatives (e.g., switching from traditional concrete to concrete with supplementary cementitious additives).
3.2.2.2. Cloud-Based LCA and Project Configuration
To overcome the limitations of the geometric model and improve the accuracy of the analysis, the data was synchronized with the One Click LCA cloud platform. This web-based environment allows for more advanced data management and the manual integration of those components that, as previously mentioned, had not been modeled in Revit (rebar, mesh, finishes).
The project configuration procedure in the cloud consisted of the following steps:
1. Creation of the “Design”:
A specific project variant (Design) was created and assigned an identifying name. This allows, in a subsequent phase, for the comparison of different solutions for the same building.
2. Definition of the Regulatory and Timeline Framework:
The reference construction phase was selected in accordance with international standards (RIBA/AIA), thereby defining the project’s lifecycle. The British RIBA Plan of Work (Royal Institute of British Architects) is the most widely used system in Europe because it divides the project into eight numbered stages. Stage 3—Developed Design—was selected; this choice was dictated by the need to work on an information model in which the spatial and structural decisions were already established but still open to material optimizations.
3. Selection of the Calculation Tool:
It is necessary to define the reference standard for EPDs (Environmental Product Declarations).
The EN 15804 standard is the European standard governing the preparation of environmental product declarations for construction products, and its evolution has led to two different assessment levels:
- Life Cycle Assessment Level(s) (EN 15804 +A1):
This represents the previous version of the standard. It includes 7 main impact indicators (including GWP, ODP, AP, and EP). Many historical EPDs in databases are still based on this standard.
- Life Cycle Assessment Level(s) (EN 15804 +A2):
This is the most recent update (mandatory for new EPDs starting in 2022). It introduces a broader and more precise set of indicators, with a total of 13 main impact indicators and additional supplementary indicators. In particular, GWP (Global Warming Potential) is broken down into more detailed subcategories (Fossil, Biogenic, LULC).
A comparative analysis of the two assessment standards shows that the results (Table 1) calculated according to EN 15804 +A2 are consistently lower than the values obtained using EN 15804 +A1. This variation is not due to changes in the quantities of the BIM model, but rather to the different sensitivity of the characteristic factors in the EN 15804 +A2 standard and to the different accounting methods for biogenic impacts and end-of-life modules (C and D). Where EPDs were not available in the EN 15804 +A2 version, the software performed a conversion based on updated proxy databases. However, in cases where the EPD refers exclusively to the +A1 standard and it was not possible to apply these conversions or find data compatible with the new sets of indicators, the impact according to the EN 15804 +A2 standard is not calculated. Consequently, to ensure the completeness of the assessment and the comparability of the data, the set of results obtained using the EN 15804 +A1 standard is taken as the primary reference, as it ensures full coverage of the analyzed products.
3.2.2.2.1. Scope and Type of Analysis
To ensure compliance with the European Level(s) framework and the comparability of data, the following parameters must be selected:
- Predefined scopes (if available)
EU Levels
- Project type
New construction, entire building; Renovation of an existing building; Expansion of an existing building; Interior design project; Component-only assessment; Other type of analysis.
- Type of load-bearing structure
Undetermined/uncertain; Concrete frame; Steel frame; Other/mixed frame; Existing frame; Not applicable.
- Included Parts. Select all applicable parts
Foundations and substructure; Structure and envelope; Finishes and other materials; Outdoor areas; Utilities.
3.2.2.2.2. Data Validation and Mapping
After configuring the design, the work begins in earnest with the import of data via the Revit plug-in. This phase serves as a true digital “bridge”: the calculation software receives the complete list of modeled materials and components, attempting to interpret each entry to associate it with the corresponding EPD (Environmental Product Declaration) in its databases.
- However, this process is not always immediate. When reading data from Revit, some automatic associations may fail. This happens because the technical language of the BIM model and that of the environmental databases do not always align perfectly. In these cases, the process requires targeted manual intervention to carefully select the most appropriate EPDs.
- Once this meticulous association process is complete, the software transforms what was once a simple list into a structured and intelligent list. The data is no longer just a sequence of materials but is organized according to functional categories:
- foundations and subsoil, exterior walls and facade, columns and load-bearing walls, interior and non-load-bearing walls, floor slabs and horizontal elements, other materials, doors and windows, finishes, exterior areas, and construction systems.
- This breakdown is essential: it allows us to “read” the building by its components, making it clear how each macro-category contributes to the overall environmental assessment and ensuring that the final calculation accurately reflects what was designed in the BIM model.
- To complete the methodological framework and enable accurate parameterization of the results, the building’s dimensional and temporal data were defined:
- Buildable Area:
The project covers an area of approximately 820 m2. This figure serves as the common denominator for the entire analysis, as it allows for the normalization of total impacts and the calculation of results in kgCO2e/m2, facilitating comparison with international benchmarks.
- Calculation Period:
The 50-year study period was selected in accordance with Use Class III as defined by the NTC 2018 (Technical Standards for Construction, Ministerial Decree of January 17, 2018) [43], which classifies preschools as buildings of significant public interest. This choice ensures compliance with the durability requirements set forth by the CAM Edilizia (Ministerial Decree of June 23, 2022) [44] and adheres to the DNSH (Do No Significant Harm) protocols, ensuring that the Cradle-to-Cradle assessment reflects the actual life cycle of a modern school facility, designed to withstand the test of time and remain functional over the long term.
- Annual energy consumption:
The project calls for the installation of a photovoltaic system consisting of 63 panels. Assuming these are high-efficiency panels with an estimated power output of 450 W per panel, the system would achieve a total peak power of approximately 28.3 kWp.
The final phase of the analysis takes the form of a summary dashboard that aggregates the overall data derived from the BIM model and the EPD databases, providing a holistic view of the building’s environmental impact. The results page is organized into various analytical and graphical sections, designed to facilitate the interpretation of data in accordance with international standards.
- Summary Indicators and Rating Systems
The top portion of the screen displays absolute and normalized Key Performance Indicators (KPIs).
It shows total emissions expressed in metric tons of CO2e and the corresponding annual impact per square meter (kgCO2e/m²/year), a key parameter for comparing the project’s overall efficiency.
An economic assessment based on the Social Cost of Carbon (SCC) is provided; the calculation is based on a reference value of €50 per metric ton of CO2e. This parameter allows the project’s impact to be communicated not only as technical and scientific data but also as an economic responsibility toward the community.
A benchmarking system (Carbon Heroes) is included, which ranks the building on a color-coded scale, comparing the project’s performance with national and international averages for the same building type.
3.2.2.2.3. Life-Cycle Assessment by Level(s) Compliant with EN 15978
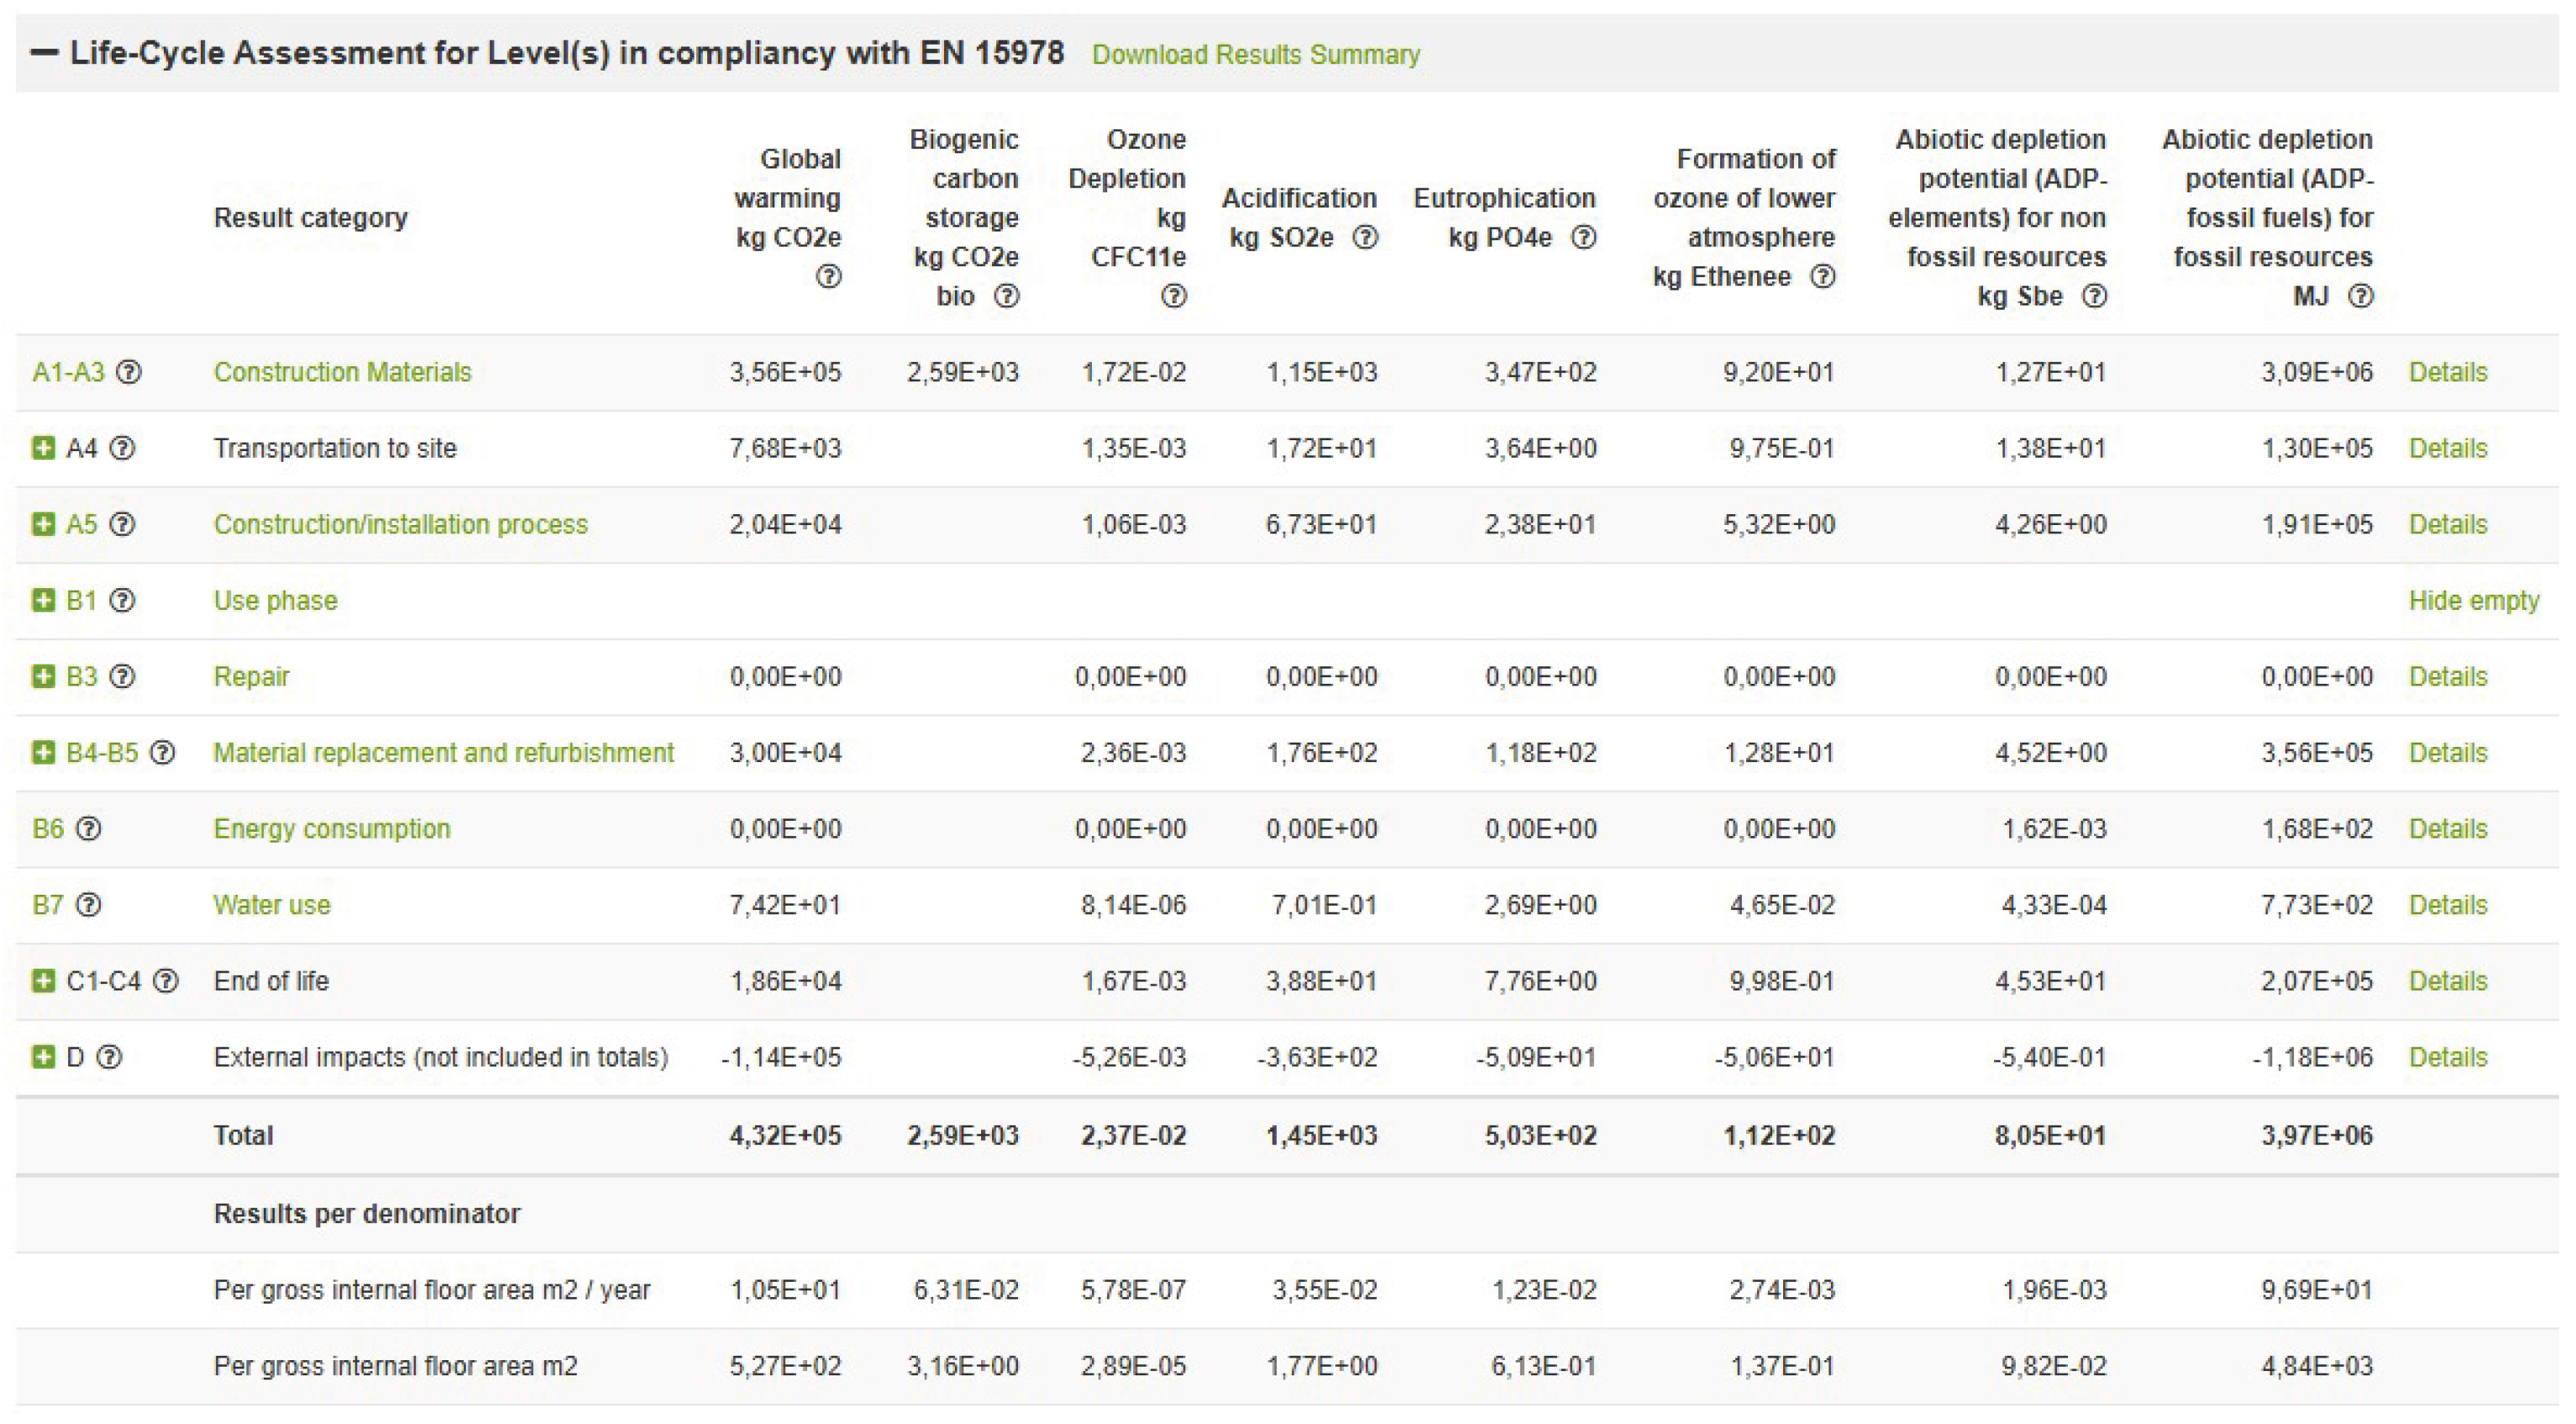
The technical core of the page consists of an analytical table (Table 2) compliant with EN 15978 [14]. The data are broken down by impact categories (GWP, ODP, AP, EP, etc.) and distributed across the various life cycle stages:
- Production Stage (A1–A3)
- Construction Phase (A4-A5)
- Use Phase (B1-B7)
- End-of-Life Phase (C1-C4)
- Module (D)

Table 2.
Results of the different life cycle stages (One Click LCA).
 |
3.2.2.2.4. Graphical Representation and Breakdown of Impacts
The results are supported by a set of dynamic graphs that allow for the visual identification of the distribution of the environmental load.
The pie charts (Figure 7) show the percentage breakdown of emissions both by life cycle stages and by functional classifications (foundations, structure, floor slabs, etc.).
The bar charts (Figure 8) provide a visual comparison of the various environmental indicators, highlighting at which point in the building’s life cycle the greatest challenges or the greatest savings are concentrated.
3.2.2.2.5. Materials Analysis
The software generates a detailed list of the selected materials, specifying the corresponding environmental impact values for each one. This section is not simply a static list, but an interactive interface designed to guide the designer toward more sustainable choices (Figure 9):
- Visual Indicators (Impact Clouds)
Each material is marked with a colored bubble that serves as an immediate indicator of its environmental impact. The color-coding system allows users to instantly identify critical issues: a red bubble indicates the materials with the highest impact, while shades shifting toward green indicate components with lower emissions.
- Grouping of Elements
To maximize clarity, the software automatically groups elements of the same type into a single entry, allowing users to assess the overall impact of a specific material category (for example, all C25/30 concrete) on the entire building structure.
- Support for Sustainable Alternatives
A particularly advanced feature of the tool is its ability to suggest alternatives with lower carbon dioxide emissions. Alongside the materials, the software indicates which products or variants in the database could be selected to reduce the total carbon footprint, thereby facilitating a process of continuous project improvement.
3.3. Economic Assessment
At the same time, an economic estimate was conducted regarding the supply of materials. The inclusion of economic data addresses a twofold strategic need:
1. Trade-off analysis: to identify technical solutions that have a high environmental impact but low costs—or vice versa—in order to guide decisions toward resource optimization.
2. Overall sustainability assessment: This enables a multidisciplinary comparison in which improvement proposals are evaluated not only for their ability to reduce the carbon footprint but also for their financial viability and constructability.
Market research was conducted to determine an average unit price for each material specified in the project. This value was obtained by integrating current price lists, regional price indices, and direct quotes from manufacturers, which were appropriately compared and standardized to establish a representative economic benchmark on a national scale. Subsequently, a bill of quantities was prepared for each major functional component of the building structure.
By multiplying the geometric quantities derived from the project (areas, volumes, weights) by the determined average unit prices, it was possible to assess the economic impact of the individual components of the project. Finally, summing the partial costs made it possible to determine the total construction cost of the building.
4. Case Study
The case study analyzed concerns the design for the expansion of the “A. Manzi” school complex (Figure 10), aimed at creating a daycare center in the municipality of Montoro (AV). The project stems from the need to increase the number of available spots for children aged 0 to 36 months, thereby helping to improve access to educational services and promote social inclusion. The project involves a new extension, but one that is functionally, spatially, and structurally independent from the existing building.
4.1. The Existing Building
The existing building (Figure 11) is a single-story structure above ground and consists of three sections seamlessly joined together, shaped like an “arrow with a curved front,” constructed of reinforced concrete with a brick-and-concrete floor slab and a flat, non-accessible roof. The site features:
- Direct access from Provincial Road No. 90;
- A front area designated for parking along protected pedestrian paths;
- An undeveloped green area at the rear, designated for the new construction.
4.2. The New Building
The design proposal for the new structure is located in the rear portion of the lot (Figure 12), on an undeveloped green area, in compliance with:
- Property line setbacks;
- Setbacks from windowed walls;
- Urban planning and landscape restrictions.
The design moves beyond the notion of the preschool as a mere childcare facility, defining it instead as a structured educational environment in which the physical space becomes an active element of the pedagogical process.
The layout is divided into three functional blocks:
- Block A: infant section
- Block B: general services (reception, administration, staff, kitchen)
- Block C: toddler section
The three buildings are connected by a linear circulation system that opens onto an internal courtyard with a garden, designed to serve as a transitional space between the interior and exterior and as an extension of educational activities (Figure 13).
This layout provides:
- Functional clarity;
- Control over traffic flow;
- Separation between children’s areas and service areas;
- Visual continuity with the outdoor environment.
The design proposal is sized for a maximum of 50 children, divided into:
- 10 infants (0–15 months)
- 40 toddlers (15–36 months)
In compliance with the provisions of Campania regional regulations (Regional Council Decisions No. 107/2014 and No. 490/2015) [45,46], which stipulate:
- A minimum of 6 m2 of indoor space per child;
- A minimum of 10 m2 total per child (indoor + outdoor).
4.2.1. The BIM Model
Using the provided Revit model as a reference, the building’s design composition is illustrated below (Figure 14):
- a single above-ground level, with a clear interior height of 3 m;
- Inverted beam foundation (90x40x30) insulated with EPS panels and a bituminous membrane;
- Reinforced concrete frame structure (columns 30x30, 30x60, 30x110; beams 30x50);
- Traditional exterior wall, 45 cm thick (plaster, brick, glass wool, brick, plaster);
- Exterior wall with a ventilated facade, 46 cm thick (plaster, brick, glass wool, ventilated facade substructure, cladding panel);
- First-floor slab made of concrete-filled brick, 46 cm thick (hollow brick, precast joist, reinforced screed, EPS insulation, fill screed);
- For the floor installation, a cement mortar screed and vinyl flooring are planned;
- Interior partition wall made of drywall, 10 cm thick;
- Rooms in blocks A and C feature glazed emergency doors and windows; block B is equipped with windows; emergency doors are present in only two rooms; each room has a drywall suspended ceiling;
- Roof slab constructed with 38 cm thick EPS formwork (EPS formwork, reinforcement, screed, reinforced screed, PIR insulation, vapor barrier, bituminous membrane);
- Metal sheeting for mounting photovoltaic panels;
- Crowning bands for the roof slab.
4.2.2. One Click LCA Application
4.2.2.1. Design Scenario (Design Materials)
The Design Scenario represents the baseline case for the analysis. In this configuration, the materials specified during the design phase—as described earlier—were considered by associating EPDs of materials with generic characteristics or those as consistent as possible with the design materials. The objective of this scenario is to define the initial value of the CO2 equivalent emissions embodied in the materials (Embodied Carbon), against which all subsequent improvement scenarios will be compared.
4.2.2.2. Implementation Scenario 1 (Materials with Recycled Content)
In the first Implementation Scenario, the EPDs of the materials used in the design scenario were replaced with EPDs for materials containing a percentage of recycled content. The design configuration and construction system remain unchanged; only the type of EPD associated with the materials varies. This scenario allows for the evaluation of the influence of recycled content on CO2 emissions during the production phase.
4.2.2.3. Implementation Scenario 2 (EPS Floor Slab—Materials with Recycled Content)
In this scenario, the EPDs for materials with recycled content introduced in Implementation Scenario 1 were retained, but changes were made to the construction system of the first-floor slab. Specifically, the precast hollow blocks and joists were replaced with EPS (expanded polystyrene) formwork, a solution already specified in the design for the roof slab. The objective is to compare, using materials with the same recycled content, the traditional brick-and-concrete system with a lightweight solution using EPS formwork, evaluating their impact on embodied emissions. The use of the Solaio Plastbau® Metal system (Figure 15) represents an advanced solution for the industrialization of traditional concrete-and-brick floor slabs, combining high thermal performance with structural lightness. The system is based on high-density EPS (Sintered Expanded Polystyrene) formwork panels, made self-supporting through the longitudinal integration of shaped galvanized metal profiles that allow for formwork installation at wide center distances, drastically reducing the time and costs of shoring on-site. Thanks to the panel’s variable geometry, it is possible to adjust both the thickness of the thermal insulation and the height of the structural concrete joist, ensuring continuous insulation that eliminates structural thermal bridges. Plastbau® Metal technology also optimizes the integration of building services through pre-formed honeycomb cavities within the foam and facilitates the finishing stages of the soffit; the presence of metal flanges flush with the EPS allows for secure mechanical fastening of drywall panels or proper adhesion of specific plasters, while ensuring high standards of seismic safety thanks to the overall reduction in the building’s permanent masses.
4.2.2.4. Implementation Scenario 3 (EPS Floor System—Project Materials)
Scenario 3 replicates the same modification to the floor system introduced in Implementation Scenario 2 (replacement of hollow-core slabs and precast joists with EPS formwork), while retaining the EPDs of the materials used in the Project Scenario.
This makes it possible to isolate the effect of the technological change to the floor system alone, without the influence of recycled material content, and to compare the traditional system with the lightweight system.
4.2.2.5. Implementation Scenario 4 (EPS Load-Bearing Masonry—Design Materials)
In this scenario, while retaining the EPDs of the materials used in the Design Scenario, the building’s vertical construction system was modified. The exterior walls were replaced, and their structural function was redefined, shifting from a reinforced concrete frame structure to load-bearing masonry constructed using EPS formwork. The analysis allows for an assessment of the environmental impact resulting from the change in the structural system, while keeping the type of material constant. The Muro Plastbau®-3 construction system (Figure 16) is an industrialized technological solution based on the use of disposable EPS 150 formwork panels with improved thermal performance (λD = 0.031 W/mK), designed for the construction of load-bearing walls in reinforced concrete with continuous reinforcement. From a structural standpoint, the module consists of two polystyrene panels joined by B450C steel trusses, which provide the component with the self-supporting strength necessary to withstand the pressure of the concrete and allow for the secure placement of the supplementary horizontal and vertical reinforcing bars.
The system’s flexibility allows for adjusting the thickness of the exterior and interior insulation, achieving excellent thermal performance with U-values as low as 0.11 W/m2K, while simultaneously eliminating all linear thermal bridges. In addition to high energy efficiency and compliance with Italy’s Minimum Environmental Criteria (CAM), the system optimizes construction phases thanks to the panels’ light weight, which facilitates handling and speeds up installation, effectively transforming the construction process from a traditional, artisanal approach to a precision industrial assembly process, compatible with a variety of surface finishes, from reinforced skim coats to ventilated facades.
From a structural standpoint, the wall’s load-bearing capacity relies exclusively on the cast-in-place concrete. Consequently, the structural thickness of the wall corresponds to the thickness of the reinforced concrete core, which is subject to specific evaluation during the preliminary design phase.
The wall thickness was selected using a preliminary verification criterion based on the geometric slenderness ratio, defined as:
where h represents the floor-to-floor height and t the thickness of the concrete core.
Typically:
- h/t ≤ 15 : good (robust) behavior
- 15 ≤ h/t ≤ 20 : acceptable, but requires verification
- h/t ≥ 20 : wall too slender, requires thorough verification
This parameter allows for an initial assessment of the wall’s behavior with respect to instability phenomena and second-order effects, and is particularly significant for vertical compression members subject to flexural compression. High values of the h/t ratio are, in fact, associated with greater slenderness and therefore greater sensitivity to unstable phenomena.
The Technical Standards for Construction do not prescribe an explicit limit for the h/t ratio, but require the stability of structural members to be verified through the evaluation of second-order effects and effective buckling lengths, in accordance with the provisions of Eurocode 2.
4.2.2.6. Implementation Scenario 5 (EPS Floor Slab – Load-Bearing EPS Masonry—Materials with Recycled Content)
Implementation Scenario 5 represents the most advanced and integrated approach. In this case, the EPDs for materials containing recycled content (Implementation Scenario 1) were retained, and both technological modifications introduced in Implementation Scenarios 2–4 were applied:
- Replacement of the first-floor slab with EPS formwork;
- Replacement of the exterior wall panels with load-bearing masonry using EPS formwork, resulting in a transition from a reinforced concrete frame structure to a load-bearing masonry system.
This scenario allows for an assessment of the combined effect of using materials with recycled content and optimizing the structural system; it represents the configuration with the potentially best performance in terms of embodied CO2 emissions.
4.2.3. Comparative Analysis of Material Quantities and Supply Costs
The following Figure 17 and corresponding Table 3 present a quantitative and economic comparison of the various design scenarios developed during the analysis. Specifically, they show the quantities of the main building components used in each design configuration, along with their corresponding supply costs. This comparative analysis highlights the variations in material quantities resulting from the introduction of alternative construction solutions—such as the use of materials containing recycled content and EPS systems—by correlating changes in the quantities used with trends in total costs. The bar chart also provides a concise overview of the differences between the scenarios, facilitating the interpretation of how individual construction elements affect material requirements and the overall cost of Project.
5. Results and Discussion
A comparison of the scenarios developed shows that CO2 emissions associated with the production phase (A1–A3) are influenced by both the choice of materials and the technological and construction solutions adopted.
5.1. Design Scenario (503 kg CO2e/m2, Class C)
The data for the Design Scenario reveal an emissions profile characterized by a total cradle-to-grave life cycle impact of 432 metric tons of CO2e, corresponding to a carbon intensity of 10.54 kg CO2e/m2/year. In terms of benchmarking against the “Italy all building types 2025” parameters, the building falls into Class C with a value of 503 kg CO2e/m2. The economic impact of these emissions can be quantified as a Social Cost of Carbon of €21,616. An analysis of the distribution of impacts shows that the material production phase (A1–A3) is the most significant, accounting for 86% of the total carbon footprint.
For the purposes of this study, which focuses on the A1–A3 system boundary, the overall result recorded is 3.56 × 10⁵ kg CO2e.
Looking in detail at the building components for the A1–A3 production phase, the greatest impacts are concentrated in:
- Horizontal structures (beams, floor slabs, and roofs): 36% of the impact;
- Vertical structures and facades: 30% of the impact;
- Foundations and substructures: 28% of the impact.
Within these groups, the materials with the highest emission values were identified: concrete, glass wool insulation (despite its 50% recycled content), rock wool panels, and drywall. These were identified as the key variables to address in the implementation scenarios. Conversely, materials with low-to-medium emission values were kept unchanged in subsequent simulations to isolate the effectiveness of strategies for the composition of the components with the greatest impact.
In parallel with the environmental analysis, an independent economic assessment was conducted for the supply of materials alone, which amounts to €331,655.27.
5.2. Implementation Scenario 1(372 kg CO2e/m2, Class B)
The first optimization scenario analyzed, called Implementation Scenario 1, focused on replacing the previously identified critical materials with alternatives characterized by a high content of recycled raw materials or originating from less carbon-intensive supply chains. Specifically, the main changes made concern:
- Concrete: a mixture containing 50% fly ash was selected, reducing the share of Portland cement clinker.
- Insulation systems: the entire insulation package of the previous scenario (consisting of glass wool and rock wool) was standardized and replaced with rock wool with 50% recycled content.
- Dry finishes: the standard plasterboard has been replaced with a high-performance environmental variant containing 90% recycled gypsum.
In terms of global emissions (Cradle-to-Grave), this scenario resulted in a significant reduction in impact, from the previous 503 kg CO2e/m2 of the design scenario to a value of 372 kg CO2e/m2. This change represents an approximately 26% reduction in the specific carbon footprint. This result is particularly significant because it allows the building to make a class leap in the "Italy all buildings types 2025" benchmarking, positioning itself at the upper limit of Class B and almost reaching the threshold of Class A (set at < 370 kg CO2e/m2).
Considering the system boundary with respect to the production phase A1-A3 only, consistently with the main objective of the thesis, the value of the global warming potential (GWP) is set at 2.45 x 10⁵ kg CO2e.
Compared to the 365 tonnes (3.56 x 10⁵ kg CO2e) recorded in the project scenario for the same phase, a net reduction of 111 tonnes of CO2e is observed.
The effectiveness of this strategy is confirmed by the following summary indicators:
- − Total impact (life cycle): overall emissions drop to 319 tonnes of CO2e.
- − Annual Carbon Intensity: a decrease to 7.78 kg CO2e/m2 / year is recorded.
- − Social Cost of Carbon: it is reduced to €15,951.
In parallel with the environmental analysis, the independent economic assessment conducted for the supply of materials alone showed a cost of €335,112.93. The comparison with the project scenario cost (€331,655.27) shows a modest increase of approximately 1%, despite an environmental benefit of 26%.
This result demonstrates that, even with the same construction solution and geometric configuration, the sole choice of circular production chains and materials with a high recycled content can substantially alter the overall environmental balance, with an extremely small economic impact compared to the benefits obtained.
Implementation scenarios 2 and 3 explore the impact of modifying the floor system, including replacing the prefabricated formwork and beams with EPS formwork. The two cases were studied to isolate the effectiveness of the technological change with respect to the choice of materials (materials with recycled content vs. design materials).
5.3. Implementation Scenario 2 (372 kg CO2e/m2, Class B)
Implementation Scenario 2 maintains the use of the high-recycled content materials already introduced in Scenario 1 (concrete with 50% recycled fly ash, insulation and gypsum), intervening exclusively on the technological solution of the first floor slab.
From an environmental perspective, the results show a value of 372 kg CO2e/m2 (Class B), confirming a total impact of 319 tonnes of CO2e and an annual carbon intensity of 7.77 kg CO2e/m2/year.
Limiting the analysis to the A1-A3 production phase only, the global warming potential is 2.39 x 10⁵ kg CO2e.
This value highlights a further reduction compared to Scenario 1 (which recorded 2.45 x 10⁵ kg CO2e), suggesting that the combination of recycled materials and the technological lightweighting of the EPS floor maximises the environmental benefit.
From an economic point of view, the valuation of the supply alone for this scenario is €337,761.54.
5.4. Implementation Scenario 3 (496 kg CO2e/m2, Class C)
Implementation Scenario 3 applies the same technological modification (EPS first floor slab) but restores the use of materials without the optimised recycled percentages.
The results return a specific carbon footprint of 496 kg CO2e/m2 (Class C), with a total of 427 tonnes of CO2e.
For the A1-A3 production phase, the global warming value is 3.44 x 10⁵ kg CO2e.
The comparison with the Project Scenario (3.56 x 10⁵ kg CO2e) highlights that the variation of the floor system alone brings about a marginal reduction (around 3% on phase A1-A3), confirming that the change in construction technology, if not accompanied by an improvement in the environmental performance of the materials, has a limited impact on the emission balance.
The economic value of the supply for this scenario is €334,622.43
The most significant comparison emerges between the Design Scenario and Implementation Scenario 2. The latter represents the optimum design, in which the system modification (from brick-cement to EPS) is combined with the adoption of materials with a high recycled content.
In terms of global warming, for the A1-A3 production phase alone, the reduction goes from 3.56 x 10⁵ kg CO2e to 2.39 x 10⁵ kg CO2e. This radical reduction of approximately 117 tons of CO2e (equal to a 33% decrease) is the result of a winning synergy: EPS reduces the mass involved, while concrete with 50% fly ash and recycled insulation reduce the material's intrinsic impact.
The most significant aspect is the supply cost. Given such a drastic reduction in emissions, the financial outlay goes from €331,655.27 to €337,761.54. A mere 1.8% increase in cost therefore allows for a 26% improvement in the global benchmark (going from 503 to 372 kg CO2e/m2), bringing the building from Class C to Class B.
5.5. Implementation Scenario 4 (491 kg CO2e/m2, Class C)
Implementation Scenario 4 represents a structural paradigm shift compared to previous models, involving the transition from a reinforced concrete frame structure to a load-bearing masonry system made with EPS formwork. In this simulation, the materials used in the Design Scenario were retained to isolate the effectiveness of the change in vertical construction system alone. The data shows a specific carbon footprint of 491 kg CO2e/m2 (Class C), with a total lifecycle impact of 420 tonnes of CO. The annual carbon intensity stands at 10.23 kg CO2e/m2/year. Focusing the analysis on the system boundary of production phase A1-A3, the global warming potential is equal to 3.37 x 10⁵ kg CO2e.
From an economic perspective, the evaluation of the supply of materials alone for this structural configuration appears to be the most competitive of all those analyzed, with a value of €306,991.70. The comparison between Implementation Scenario 4 and the previous configurations allows us to draw relevant conclusions on the effectiveness of the different mitigation strategies:
- − Comparison with the Project Scenario: a reduction in GWP (A1-A3) of approximately 19 tonnes of CO2e is observed (from 3.56 x 10⁵ to 3.37 x 10⁵ kg CO2e). This reduction, despite maintaining the design materials, is greater than that achieved in Scenario 3 (only modification of the floor slab), confirming that optimizing the vertical structural system has a greater impact on the overall emissions balance than the horizontal component alone.
- − Comparison with Implementation Scenario 1: despite the radical structural change of Scenario 4, Scenario 1 (which maintains the frame structure but uses recycled materials) is significantly more efficient, with a GWP (A1-A3) of 2.45 x 10⁵ kg CO2e. This data highlights how the choice of low-carbon materials (concrete with fly ash and recycled insulation) guarantees a greater emission reduction (approximately 92 tonnes less than Scenario 4) than structural shape optimization alone.
- − Comparison with scenarios 2 and 3: Scenario 4 performs better environmentally than Scenario 3 (3.37 x 10⁵ vs 3.44 x 10⁵ kg CO2e), but does not reach the excellence of Scenario 2 (2.39 x 10⁵ kg CO2e), which integrates both technological lightening and supply chain quality.
From an economic point of view, however, Scenario 4 is the most economically advantageous solution, offering a saving of approximately €24,600 compared to the project scenario.
5.6. Implementation Scenario 5(344 kg CO2e/m2, Class A)
This represents the most technologically advanced configuration of the entire analysis, representing the optimal synthesis of material selection strategies and morpho-structural innovation. In this variant, the building adopts a construction system entirely based on EPS formwork, including both the transition to load-bearing masonry (tested in Scenario 4) and the replacement of the brick-concrete floor with an EPS formwork system. These structural modifications were combined with the use of materials with a high recycled content (50% fly ash concrete, recycled rock wool insulation, and 90% recycled plasterboard). The integration of these solutions allows Scenario 5 to achieve excellent environmental performance, reaching 344 kg CO2e/m2 and firmly positioning itself in Class A (threshold < 370 kg CO2e/m2). The total impact over the entire life cycle drops to 293 tonnes of CO2, with an annual carbon intensity of 7.14 kg CO2e/m2/year. Meanwhile, the Social Cost of Carbon reaches a low of €14,644. Focusing the analysis on the A1-A3 system boundary, the global warming potential reaches the lowest research value, 2.10 x 10⁵ kg CO2e. From an economic perspective, the valuation of the materials supply alone amounts to €315,592.18, a 4.48% reduction compared to the project scenario, demonstrating how environmental optimization can also be accompanied by economic benefits.
5.7. Overall Results
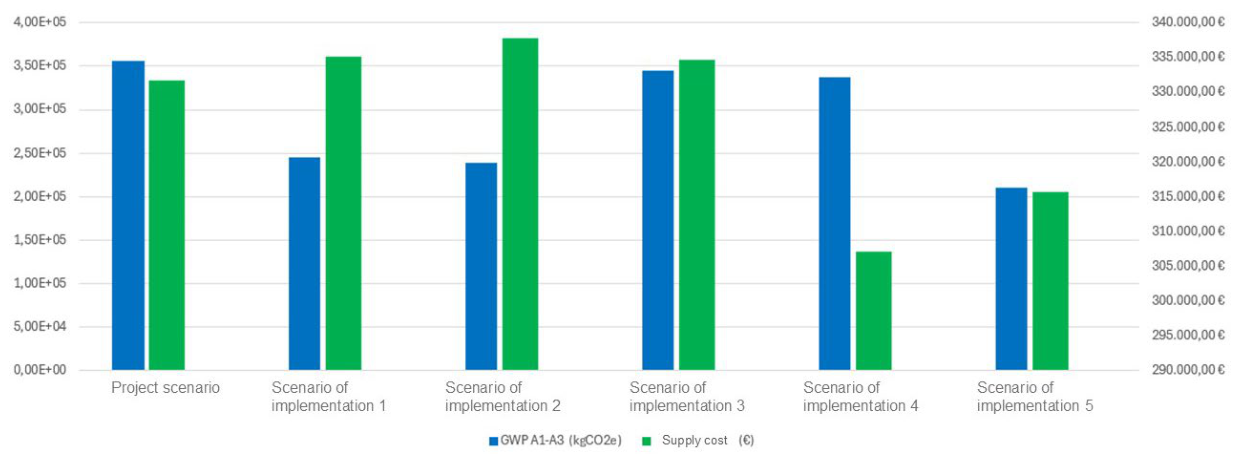
The transition from the Design Scenario to Scenario 5 marks the most significant performance leap of the entire research. With an impact of 503 kg CO2e/m2 (Class C), Scenario 5 reaches 344 kg CO2e/m2, guaranteeing access to Class A. In the A1-A3 production phase, a 41% reduction in global warming potential is recorded. This result is achieved with a 4.48% reduction in material supply costs, demonstrating that Class A is also an economically sustainable objective. Scenarios 1 and 2 had already introduced recycled materials, reducing the impact to 372 kg CO2e/m2 (Class B). Scenario 5 further improves this performance thanks to the change in construction system (EPS load-bearing masonry). Compared to Scenario 2 (which used recycled materials but on a frame structure), Scenario 5 saves an additional 29 tonnes of CO2e in phases A1-A3. Scenarios 3 and 4 explored the use of EPS (for floors or the entire structure, respectively) but with project-specific materials, remaining confined to Class C. Scenario 5 reduces emissions by over 127 tonnes of CO2e compared to Scenario 4. From this, it can be said that adopting innovative technologies such as EPS formwork is a partial operation if it is not supported by a selection of cementitious mixtures and recycled insulation. All the data relating to the scenarios analysed have been collected in a summary table (Table 4), which reports the benchmarking values, the environmental class, the Global Warning Potential (GWP), the emission variations, the supply costs and the economic variation. The comparison between the scenarios was also represented using a bar graph (Chart 2), which correlates the GWP values of phases A1–A3 and supply costs. This representation allows for an immediate highlighting of the trade-off between environmental and economic performance.
Figure 18.
Comparison of GWP and economic values.
6. Conclusions and Future Developments
This work investigated the potential and critical aspects of integrating Building Information Modeling (BIM) and Life Cycle Assessment (LCA) methodology, applied to the case study of the nursery school in the Municipality of Montoro.
The use of specialized software and in-tool plug-ins such as One Click LCA integrated into Autodesk Revit has proven to be a fundamental support for designers, allowing them to automate quantity takeoffs and rapidly evaluate various material and technological alternatives right from the preliminary stages. However, the analysis highlighted that the effectiveness of these tools requires precise references to be correctly mapped with Environmental Product Declarations (EPDs) within the LCA database.
In this regard, an operational limitation related to the nature of software licenses emerged. This research used an academic license, which provides access to a library of EPDs that is limited in number and type compared to commercial versions. To obtain results that reflect the true carbon footprint of an executive project, it is essential to have product-specific EPDs. These often must be uploaded manually if they are not present in the standard database or inaccessible due to the license. This process requires validation by software operators, with waiting times that can extend several weeks, potentially slowing down the professional workflow.
A comparative analysis of the developed scenarios shows that the most balanced and immediate intervention strategy is Implementation Scenario 1. This scenario, maintaining the reinforced concrete frame structure of the original project unchanged but adopting materials with a high recycled content, allows for a significant reduction in embodied carbon dioxide with a minimal increase in supply costs (approximately 1%). This approach allows the building to achieve a Class B environmental benchmark. However, Implementation Scenario 2 appears to be the most technically efficient solution in terms of emissions: by also modifying the material nature of the floor slab, a further reduction in CO2 is achieved, laying the foundation for achieving a Class A rating, demonstrating how replacing components with medium emissions is key to achieving the most ambitious sustainability targets.
In parallel, the research explored a complete overhaul of the construction system through the use of EPS formwork for both the floor slab and the load-bearing walls. This analysis arose from the desire to explore the potential of a single-brand technology, assessing its overall environmental and economic impact. This experiment confirmed that technological innovation can offer effective responses to the challenge of decarbonization, offering designers integrated, highly efficient solutions.
In conclusion, the work carried out demonstrates that BIM-LCA integration transforms environmental data into a design parameter on a par with cost and structural resistance.
As a future development, the research could extend to the analysis of the entire life cycle of the project (Cradle-to-Grave LCA), including the use (B) and end-of-life (C) phases, as well as the integration of Life Cycle Costing (LCC). In this context, the evolution of the BIM model would be crucial through an important methodological implementation: the systematic IT enrichment of digital objects already in the modeling phase.
To make the connection with LCA tools (such as One Click LCA) more immediate and autonomous, it is strategic to transform the BIM model into a true "integrated database." To this end, it is essential to ensure the presence of all the elements and components that constitute the building in the 3D model, without osmosis, to ensure that the materials calculation is accurate and complete. The following specific parameters must then be inserted into the metadata of each object:
- − The unit cost of the material, essential for automating economic evaluation and trade-off analyses between sustainability and budget;
- − The reference to the Minimum Environmental Criteria (CAM), an essential parameter for regulatory compliance and orientation towards low-impact materials;
- − Data relating to the Environmental Product Declaration (EPD), in this case it is essential to encourage the use of products whose certifications – resulting from LCA analyses conducted on the individual product – broaden the boundaries of the system beyond the production phase alone (A1-A3), including certain data on the construction phases (A4-A5), use (B1-B7), end-of-life (C1-C4), and on Module D (recovery, recycling and reuse potential).
This implementation would allow the software to automatically map and aggregate the environmental profiles of individual components without requiring manual entry or external database searches during the entire building analysis. This would dramatically reduce processing times and input errors, ensuring a dynamic and instantaneous assessment of embodied carbon and circularity from the very early design stages.
The ultimate goal remains to validate fully circular building models, where reducing emissions represents the first step towards zero-impact architecture, capable of combining environmental ethics, operational efficiency, and economic feasibility.
Author Contributions
Conceptualization, G.D.R. and V.G.; methodology, G.D.R.; software, V.G.; validation, G.D.R.; formal analysis, V.G.; investigation, V.G..; resources, G.D.R. and V.G.; data curation, G.D.R. and V.G..; writing—original draft preparation, V.G..; writing—review and editing, G.D.R.; visualization, V.G.; supervision, G.D.R.. All authors have read and agreed to the published version of the manuscript.
Funding
This research received no external funding.
Abbreviations
The following abbreviations are used in this manuscript:
| EPBD IV | Energy Performance of Buildings Directive IV |
| LC-GWP | Life Cycle Global Warming Potential |
| BIM | Building Information Modeling |
| LCA | Life Cycle Assessment |
| EPD | Environmental Product Declaration |
| CO2 | Carbon Dioxide |
| UNEP | United Nations Environment Programme |
| GBC | Green Building Council |
| LEED | Leadership in Energy and Environmental Design |
| ZEB | Zero Emission Building |
| NZEB | Nearly Zero Energy Building |
| MEPS | Minimum Energy Performance Standards |
| LOD | Level of Development |
| LCT | Life Cycle Thinking |
| SETAC | Society of Environmental Toxicology and Chemistry |
| LCI | Life Cycle Inventory |
| LCIA | Life Cycle Impact Assessment |
| IFC | Industry Foundation Classes |
| BIM-ECE | BIM-based Embodied Carbon Evaluation |
| CML | Centrum voor Milieukunde Leiden (Leiden Environmental Science Centre Method) |
| PEF | Product Environmental Footprint |
| CAM | Italian Minimum Environmental Criteria (Criteri Ambientali Minimi) |
| LCC | Life Cycle Costing |
| EPS | Expanded Polystyrene |
| PIR | Polyisocyanurate |
| RIBA | Royal Institute of British Architects |
| AIA | American Institute of Architects |
| KPI | Key Performance Indicator |
| SCC | Social Cost of Carbon |
| ODP | Ozone Depletion Potential |
| AP | Acidification Potential |
| EP | Eutrophication Potential |
| DNSH | Do No Significant Harm |
| kWp | Kilowatt Peak |
| NTC | Technical Standards for Construction (Norme Tecniche per le Costruzioni) |
| AV | Avellino (Province of Avellino, Italy) |
| λD | Design Thermal Conductivity |
| GHG | Greenhouse Gas(es) |
| DOAJ | Directory of Open Access Journals |
| TRACI | Tool for the Reduction and Assessment of Chemical and Other Environmental Impacts |
References
- Nanni, G.; Legambiente Scientific Office. The construction sector facing a new challenge: the decarbonization of construction. Legambiente Report. 2022. Available online: https://admin.legambiente.it:8080/wp-content/uploads/2022/11/La-decarbonizzazione-delle-costruzioni_report2022.pdf.
- GBC Italy. Impact Report 2023. 2023. Available online: https://gbcitalia.org/wp-content/uploads/2023/06/Impact-Report-GBC-Italia_20230613.pdf.
- Directive (EU) 2024/1275 of the European Parliament and of the Council of 24 April 2024 on the energy performance of buildings (recast). Off. J. Eur. Union 2024, L 2024/1275.
- Directive 2002/91/EC of the European Parliament and of the Council of 16 December 2002 on the energy performance of buildings. OJEU L 1; 4 January 2003.
- Directive 2010/31/EU of the European Parliament and of the Council of 19 May 2010 on the energy performance of buildings (recast). 2010, OJ L 153.
- Directive (EU) 2018/844 of the European Parliament and of the Council of 30 May 2018 amending Directive 2010/31/EU and Directive 2012/27/EU. 2018, OJ L 156. [PubMed]
- UNI EN ISO 19650-1:2019; Organisation and digitisation of information relating to buildings and civil engineering works, including Building Information Modelling (BIM) – Information management using BIM – Part 1: Concepts and principles. Italian National Standards Body (UNI).
- UNI 11337-1:2017; Building and civil engineering works – Digital management of construction information processes – Part 1: Models, documents and information objects for products and processes. UNI.
- Ministry of Infrastructure and Transport. Ministerial Decree n. 560/2017 – Methods and timing of the progressive introduction of electronic modelling methods and tools for construction and infrastructure; (BIM Decree). 2017.
- UNI 11337-4:2017; Building and civil engineering works – Digital management of construction information processes – Part 4: Evolution and information development of models, documents and objects. UNI.
- Circular Guide. The Circular Economy Business Manual. Available online: https://circularity.com/wp-content/uploads/2022/05/UD-3.3-LCA.pdf.
- ISO 14040:2006; Environmental management – Life cycle assessment – Principles and framework. International Organization for Standardization.
- ISO 14044:2006; Environmental management – Life cycle assessment – Requirements and guidelines. International Organization for Standardization.
- Sustainability of buildings – Assessment of the environmental performance of buildings – Calculation method. UNI EN 15978:2011; UNI / CEN.
- Safari, K.; AzariJafari, H. Challenges and opportunities for integrating BIM and LCA: Methodological choices and framework development. Sustain. Cities Soc. 2021, 67, 102728. [Google Scholar] [CrossRef]
- Huang, B.; Zhang, H.; Ullah, H.; Lv, Y. BIM-based embodied carbon evaluation during building early-design stage: A systematic literature review. Environ. Impact Assess. Rev. 2025, 112, 107768. [Google Scholar] [CrossRef]
- Parece, S. M.; Resende, J. R. P.; Rato, V. BIM-based life cycle assessment: A systematic review on automation and decision-making during design. Build. Environ. 2025, 282, 113248. [Google Scholar] [CrossRef]
- Guízar Dena, A. J.; García Hípola, M.; Fernández Bandera, C. A BIM–LCA framework for whole-life carbon assessment under EPBD: Scope alignment, functional unit robustness, and cross-tool validation. Appl. Sci. 2026, 16(6), 2637. [Google Scholar] [CrossRef]
- Obrecht, T. P.; Röck, M.; Hoxha, E.; Passer, A.; Habert, G. Review of BIM and LCA integration approaches and their applications in the built environment. Sustainability 2020, 12(14), 5534. [Google Scholar] [CrossRef]
- Xue, K.; Hossain, M.U.; Ma, M.; et al. BIM-integrated life cycle assessment for circular economy in buildings. Sustainability 2021, 13(3), 1310. [Google Scholar] [CrossRef]
- Soust-Verdaguer, B.; Llatas, C.; García-Martínez, A. Critical review of BIM-based LCA method to buildings. Energy Build. 2017, 136, 110–120. [Google Scholar] [CrossRef]
- Antón, L. A.; Diaz, J. Integration of life cycle assessment in a BIM environment. Procedia Eng. 2014, 85, 26–32. [Google Scholar] [CrossRef]
- Nizam, R. S.; Zhang, C.; Tian, L. A BIM based tool for assessing embodied energy for buildings. Energy Build. 2018, 170, 1–14. [Google Scholar] [CrossRef]
- Wastiels, L.; Decuypere, R. Identification and comparison of LCA-BIM integration strategies. IOP Conf. Ser. Earth Environ. Sci. 2019, 323(1), 012101. [Google Scholar] [CrossRef]
- Lu, K.; Jiang, X.; Tam, V. W. Y.; et al. A systematic review of the integration of building information modeling into life cycle assessment. Build. Environ. 2022, 221, 109260. [Google Scholar] [CrossRef]
- Santos, R.; Costa, A. A.; Silvestre, J. D.; Pyl, L. A critical review on BIM and LCA integration using the ISO 14040 framework. Build. Environ. 2022, 213, 108865. [Google Scholar] [CrossRef]
- Abbasi, S.; Noorzai, E.; Gharouni Jafari, K. Trade-offs between operational and embodied carbon in sustainable buildings. J. Clean. Prod. 2022, 368, 133161. [Google Scholar]
- Alwan, Z.; Jones, P.; Holgate, P. IFC-based embodied carbon benchmarking in building design. Energy Build. 2022, 261, 111969. [Google Scholar]
- Alotaibi, A.; Mosly, I.; Alqahtani, F. Decarbonisation strategies for multi-storey buildings through embodied carbon assessment. Sustainability 2022, 14(19), 12618. [Google Scholar]
- Alzara, M.; O'Brien, W.; Woo, J. BIM-based embodied carbon assessment using parametric workflows. Buildings 2021, 11(12), 579. [Google Scholar]
- Röck, M.; Ruschi Mendes Saade, M.; Balouktsi, M.; et al. Embodied GHG emissions of buildings – The hidden challenge for effective climate change mitigation. Appl. Energy 2020, 258, 114107. [Google Scholar] [CrossRef]
- Pomponi, F.; Moncaster, A. Scrutinizing embodied carbon in buildings: The need for a standardized approach. J. Clean. Prod. 2018, 173, 157–166. [Google Scholar]
- Waldman, B.; Huang, M.; Simonen, K. Embodied carbon in construction materials: A framework for quantifying data quality in EPDs. Build. Cities 2020, 1(1), 625–636. [Google Scholar] [CrossRef]
- Anderson, J.; Moncaster, A. Embodied carbon of concrete in buildings, part 1: Analysis of published EPD. Build. Cities 2020, 1(1), 198–217. [Google Scholar] [CrossRef]
- Giaveno, S.; Osello, A.; Garufi, D.; Santamaria Razo, D. Embodied carbon and embodied energy scenarios in the built environment: Computational design meets EPDs. Sustainability 2021, 13(21), 11974. [Google Scholar] [CrossRef]
- ISO 14025:2006; Environmental labels and declarations – Type III environmental declarations – Principles and procedures. International Organization for Standardization.
- Sustainability of construction works – Environmental product declarations – Core rules for the product category of construction products. EN 15804+A2:2019; CEN.
- European Commission. Level(s): A common EU framework of core sustainability indicators for office and residential buildings; Publications Office of the European Union, 2023. [Google Scholar]
- Zhang, Y.; Sattar, S.; Cook, D.; Johnson, K.; Fung, J. Systematic review of embodied carbon assessment and reduction in building life cycles. In NIST Technical Note 2284; National Institute of Standards and Technology, 2024. [Google Scholar]
- Ammar, A. S.; Abrahams, G.; Costa, A. R. Whole life cycle carbon in construction: A systematic review of policy, planning and assessment tools (2012–2024). Energy Build. 2026, 360, 117366. [Google Scholar] [CrossRef]
- One Click LCA, “One Click LCA –Integration for Autodesk Revit”. Available online: https://oneclicklca.com/hubfs/One%20Click%20LCA%20Integration%20for%20Autodesk%20Revit%20(2).pdf.
- Monetti, F. BIM-LCA integration for the calculation of the GWP parameter: the case study of the FCA bodywork building in Mirafiori. Master's Thesis in Civil Engineering, Polytechnic of Turin, Turin, 2021. Available online: https://webthesis.biblio.polito.it/19685/1/tesi.pdf.
- Ministry of Infrastructure and Transport. Ministerial Decree 17 January 2018 – Update of the “Technical Standards for Construction” (NTC 2018). 2018. [Google Scholar]
- Ministry for Ecological Transition. Decree of 23 June 2022 – Minimum Environmental Criteria for the awarding of the design and execution service for building works. 2022. [Google Scholar] [CrossRef] [PubMed]
- Campania Region. Regional Council Resolution no. 107 of March 24, 2014 – Approval of the Guidelines for the Energy and Environmental Sustainability of Buildings in Campania. 2014. [Google Scholar]
- Campania Region. Regional Council Resolution no. 490 of 27 October 2015 – Update of the Guidelines for the Energy and Environmental Sustainability of Buildings in Campania. 2015.
Figure 1.
Timeline of EPBD Directives and Transposition into Italian Law (Source: Clara Peretti).
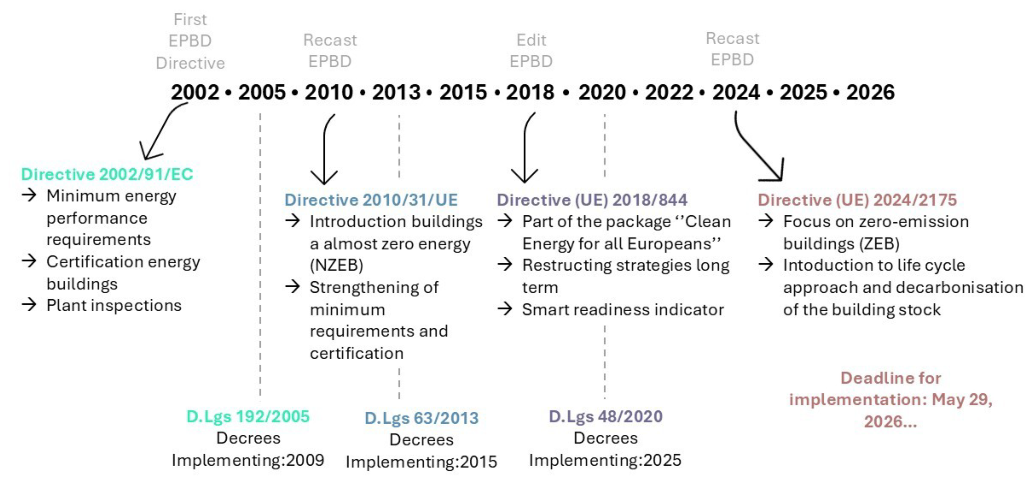
Figure 2.
Life Cycle Assessment (Source: zeroCO2).
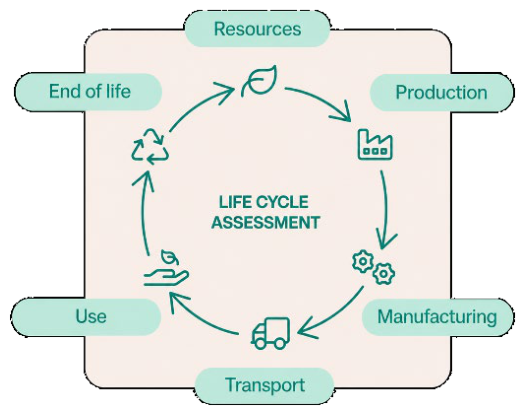
Figure 3.
The four phases of the LCA process (Source: BGREEN TECHNOLOGIES).
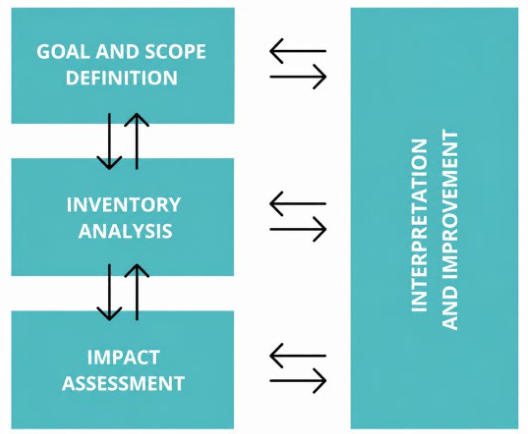
Figure 4.
Hybrid BIM-LCA Methodology.
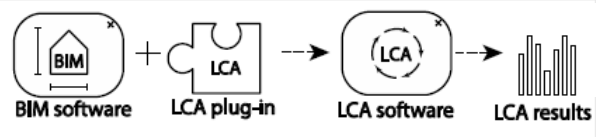
Figure 5.
System Boundary (Source: GBC Italia).
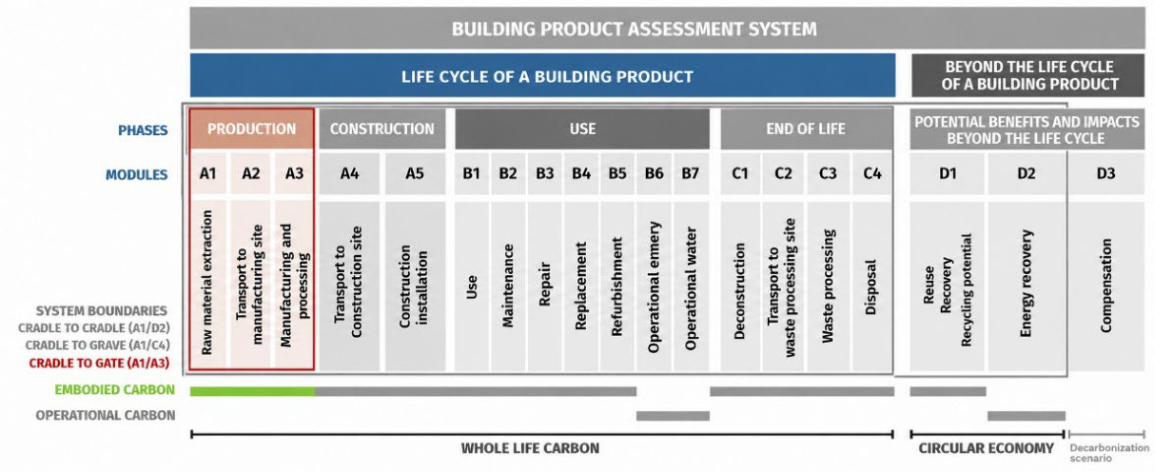
Figure 6.
BIM Model (Revit).
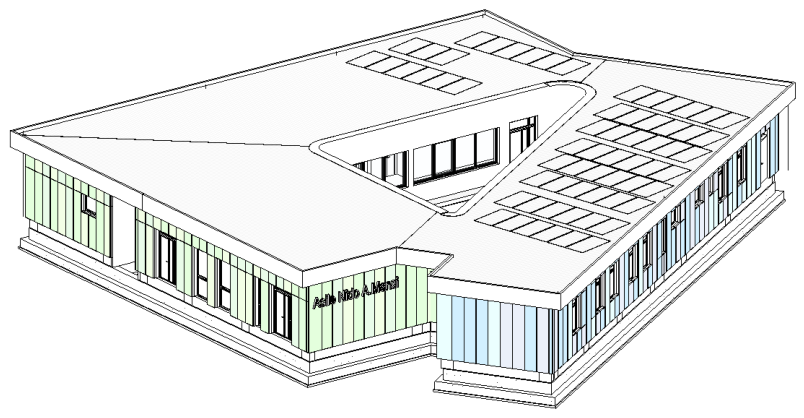
Figure 7.
Graphs showing the percentage breakdown of emissions by life cycle stages (left) and by functional classifications (right).
Figure 7.
Graphs showing the percentage breakdown of emissions by life cycle stages (left) and by functional classifications (right).
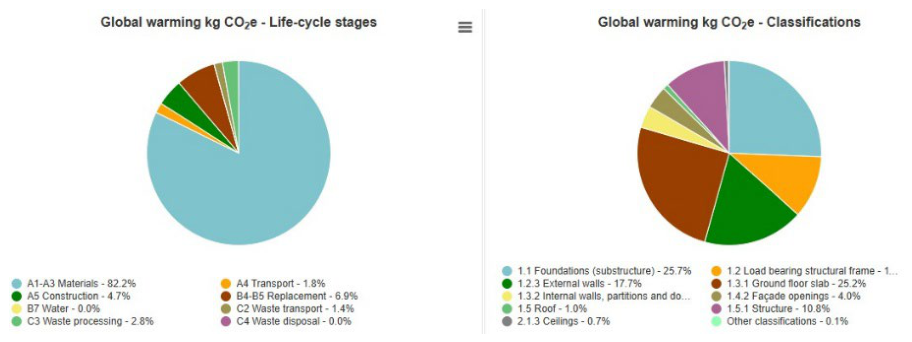
Figure 8.
Comparison graph between environmental indicators.
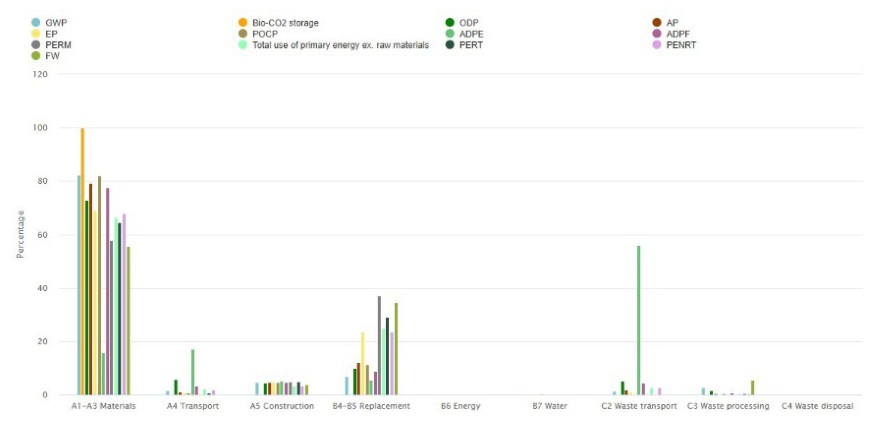
Figure 9.
Material Analysis.
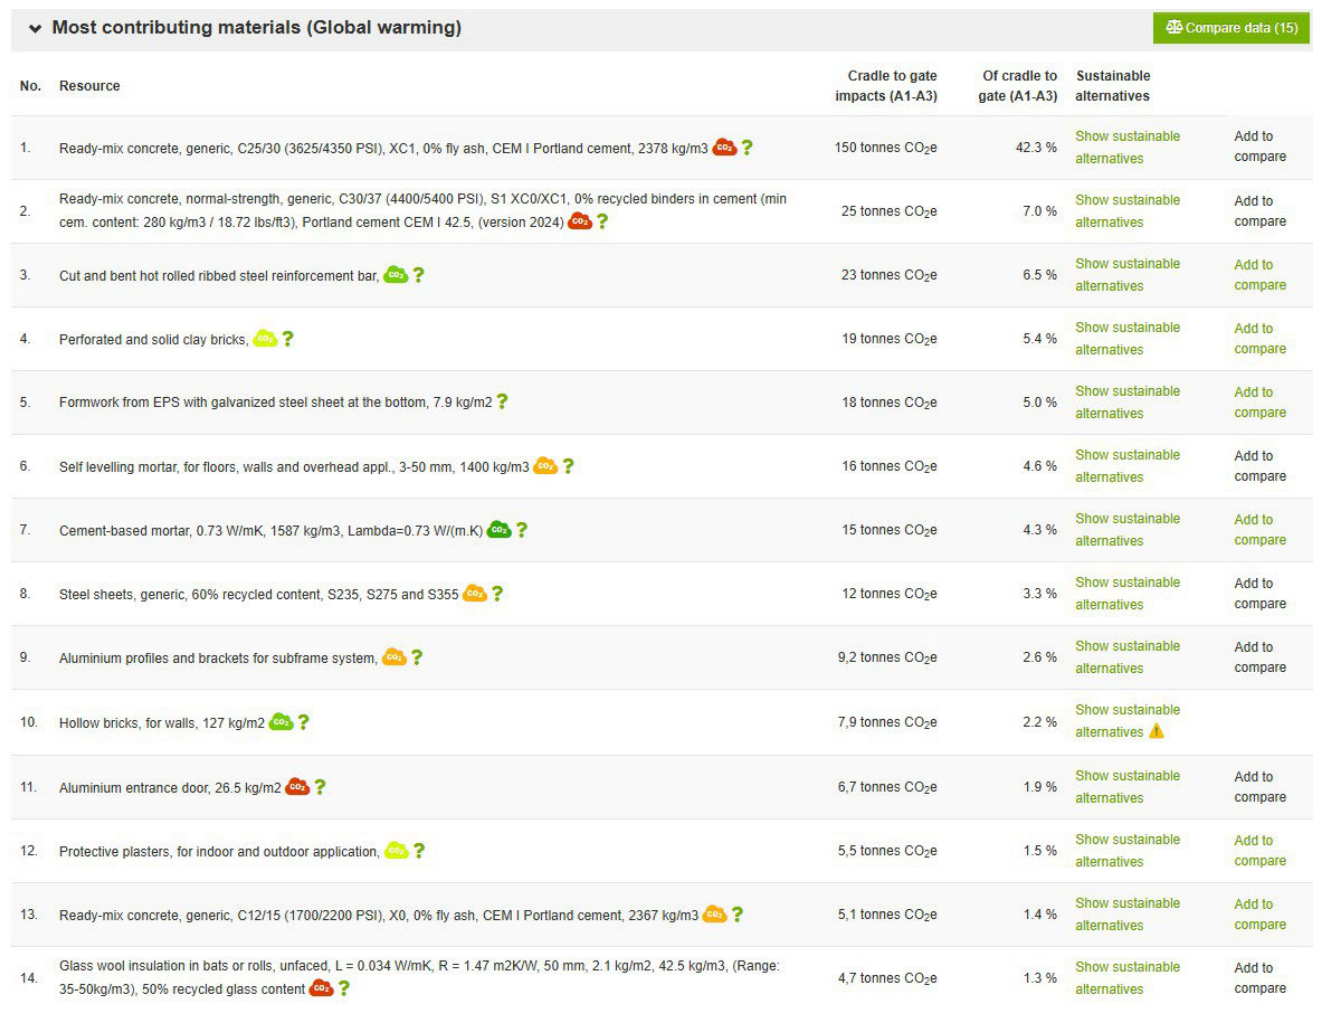
Figure 10.
Design for the Expansion of the School Complex.
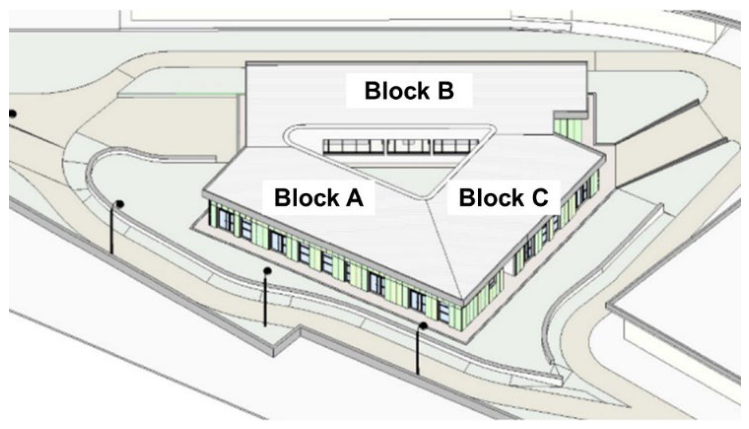
Figure 11.
Overview of the existing building (source: Google Earth).
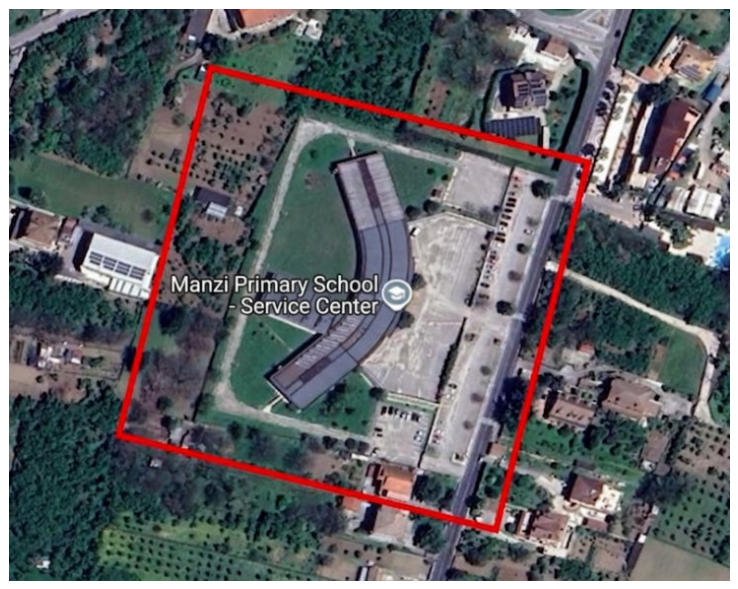
Figure 12.
Overview of the Design Concept.
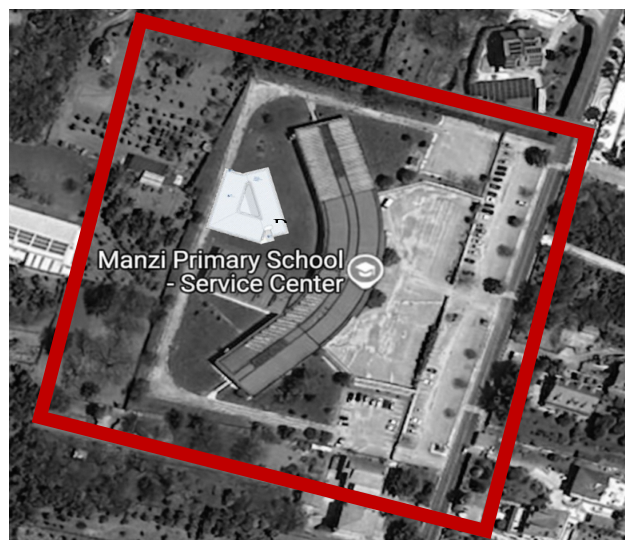
Figure 13.
Ground Floor Plan.
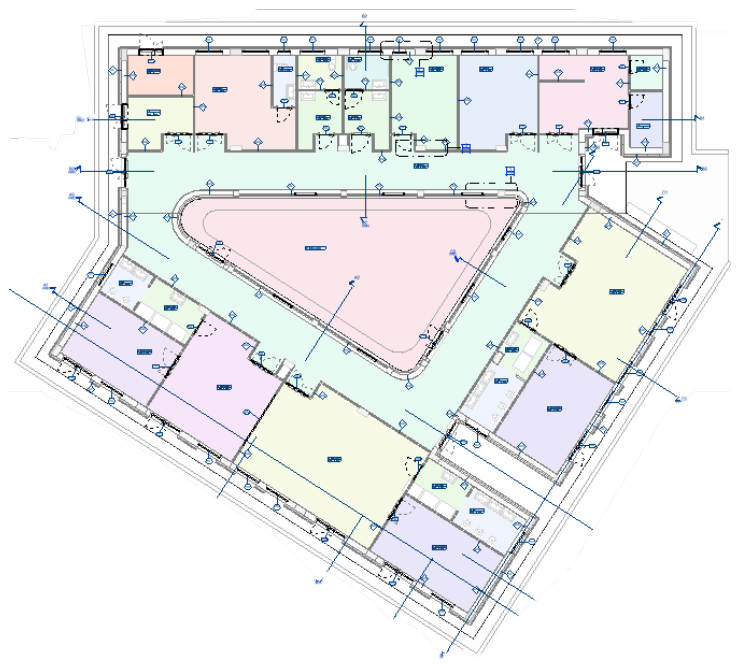
Figure 14.
Project Stratigraphies.
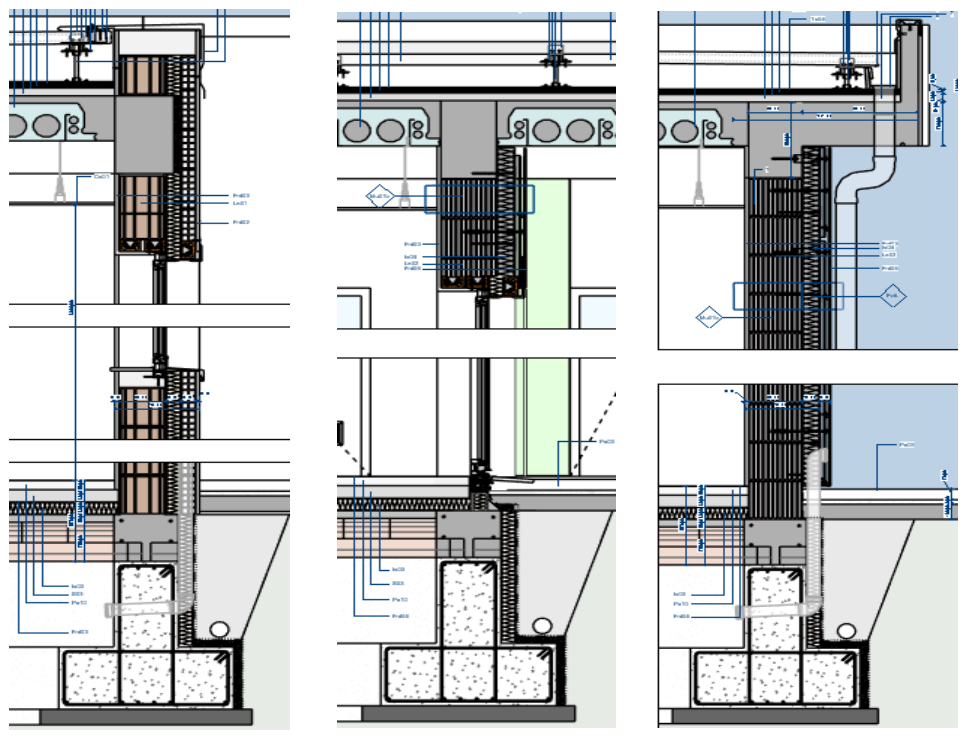
Figure 15.
Plastbau® Metal Floor System (Source: POLIESPANSO srl).
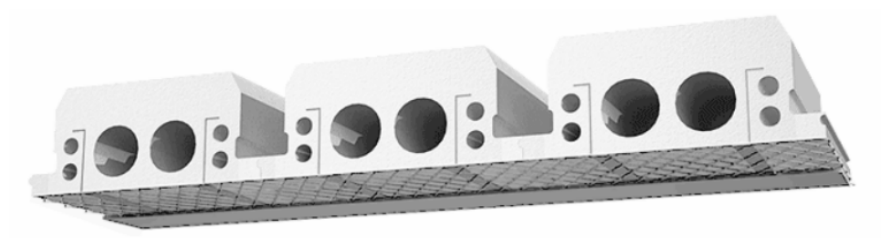
Figure 16.
Plastbau®-3 Wall (Source: POLIESPANSO srl).
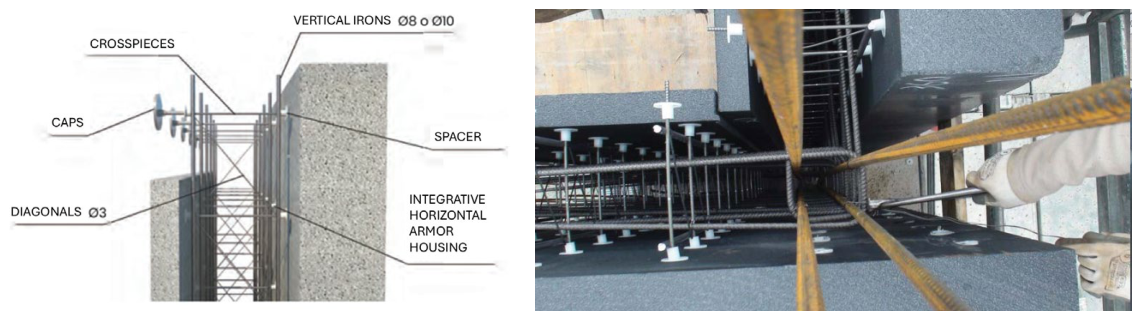
Figure 17.
Comparative Analysis of Material and Cost Quantities for the different scenarious.
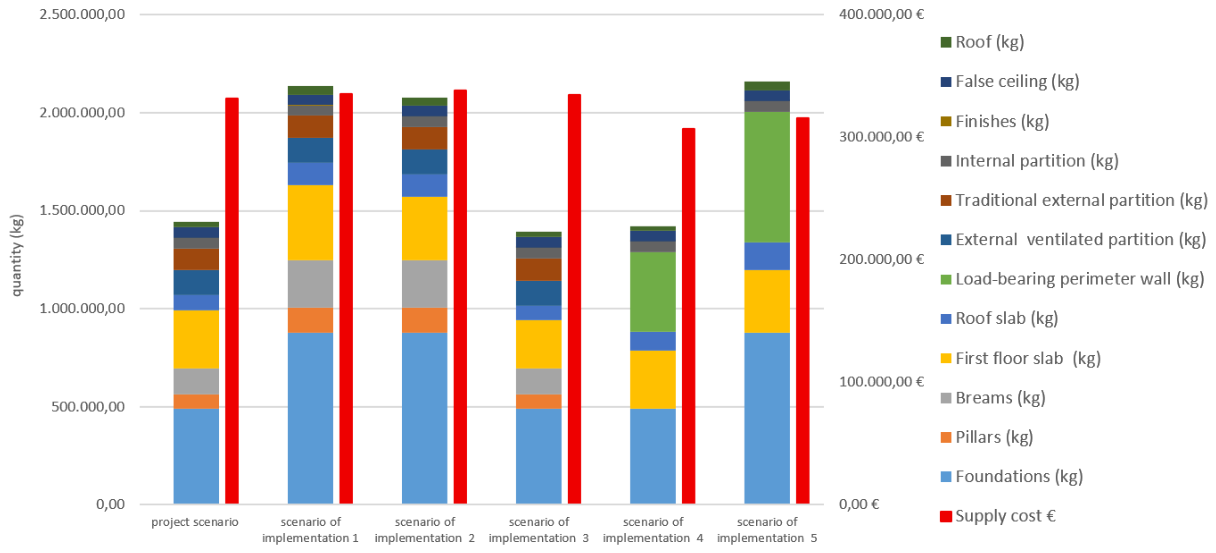
Table 1.
Comparison of Results Between EN 15804 +A1 and EN 15804 +A2.
| Scenario | EN 15804 +A1 [kgCO2e] | EN 15804 +A2 [kgCO2e] | Percentage variation [%] |
|---|---|---|---|
| Project (baseline) | 432.312 | 337.469 | -21.94 |
| Implementation 1 | 319.029 | 244.260 | -23.44 |
| Implementation 2 | 318.619 | 251.595 | -21.04 |
| Implementation 3 | 426.515 | 340.281 | -20.22 |
| Implementation 4 | 419.613 | 340.831 | -18.78 |
| Implementation 5 | 292.873 | 245.196 | -16.28 |
Table 3.
Material and Cost Quantities.
| Scenario | Foundations (kg) | Pillars (kg) | Beams (kg) | First floor slab (kg) | Roof slab (kg) | Load-bearing perimeter wall (kg) | External ventilated partition (kg) | Traditional external partition (kg) | Internal partition (kg) | Finishes (kg) | False ceiling (kg) | Roof (kg) |
|---|---|---|---|---|---|---|---|---|---|---|---|---|
| Project scenario (baseline) | 490508,65 | 71922,4 | 135084,4 | 296374,265 | 73351,04 | 0 | 128182,1575 | 112237,98 | 54531,87 | 349,4575 | 54361,49 | 26288,53 |
| Scenario of implementation 1 | 877861,65 | 128390,4 | 241142,4 | 380660,05 | 114733,04 | 0 | 128182,16 | 112237,98 | 54531,87 | 349,46 | 54361,49 | 43692,53 |
| Scenario of implementation 2 | 877861,65 | 128390,4 | 241142,4 | 322048,68 | 114733,04 | 0 | 128182,16 | 112237,98 | 54531,87 | 349,46 | 54361,49 | 43692,53 |
| Scenario of implementation 3 | 490508,65 | 71922,4 | 135084,4 | 244133,9 | 73351,04 | 0 | 128182,16 | 112237,98 | 54531,87 | 349,46 | 54361,49 | 26288,53 |
| Scenario of implementation 4 | 490508,65 | 0 | 0 | 296374,27 | 97551,04 | 401754,68 | 0 | 0 | 54531,87 | 305,5 | 54361,49 | 26288,53 |
| Scenario of implementation 5 | 877861,65 | 0 | 0 | 320594,25 | 138933,04 | 666804,68 | 0 | 0 | 54531,87 | 305,5 | 54361,49 | 43692,53 |
Table 4.
Summary table.
| Scenario | Name | Benchmarking (kgCO2e/m2) | Class | GWP A1-A3 (kgCO2e) | Emission Variation (%) | Supply Cost (€) | Economic Change (%) |
|---|---|---|---|---|---|---|---|
| Project (baseline) | project material | 503 | C | 3.56 x 10⁵ | - | 331,655.27 | - |
| Implementation 1 | material with recycled content | 372 | B | 2.45 x 10⁵ | -31.20% | 335.112,93 | +1% |
| Implementation 2 | material with recycled content + EPS insole | 372 | B | 2.39 x 10⁵ | -32.90% | 337,761.54 | +1.80% |
| Implementation 3 | project material + EPS floor | 496 | C | 3.44 x 10⁵ | -3.40% | 334,622.43 | +0.90% |
| Implementation 4 | project material + EPS masonry | 491 | C | 3.37 x 10⁵ | -5.30% | 306,991.70 | -7.40% |
| Implementation 5 | material with recycled content + EPS floor + EPS masonry | 344 | TO | 2.10 x 10⁵ | -41.00% | 315,592.18 | -4.48% |
Disclaimer/Publisher’s Note: The statements, opinions and data contained in all publications are solely those of the individual author(s) and contributor(s) and not of MDPI and/or the editor(s). MDPI and/or the editor(s) disclaim responsibility for any injury to people or property resulting from any ideas, methods, instructions or products referred to in the content. |
© 2026 by the authors. Licensee MDPI, Basel, Switzerland. This article is an open access article distributed under the terms and conditions of the Creative Commons Attribution (CC BY) license (http://creativecommons.org/licenses/by/4.0/).
Copyright: This open access article is published under a Creative Commons CC BY 4.0 license, which permit the free download, distribution, and reuse, provided that the author and preprint are cited in any reuse.