

Submitted:
23 July 2026
Posted:
24 July 2026
You are already at the latest version
Abstract
Miniaturized tests can offer significant material and time savings while still providing representative results comparable to macro-scale tests for relevant applications. Moreover, in challenging fields like hazardous materials research in nuclear, chemical, and similar industries, miniaturized testing presents an even more compelling and practical solution to counter safety, specimen preparation, and material disposal constraints. With an emphasis on optimization to guarantee maximum stress concentration, and that a uniform stress distribution, and random location of failure, always occur within the gage, this study investigates the bending fatigue behavior of meso-scale Krouse specimens. Initially theoretical and finite element analyses were performed for geometry optimization. Subsequently, the optimized geometry was experimentally validated through constant amplitude, load controlled bending fatigue tests with stress ratio, . Both theoretical framework and experimental validation confirmed the effective optimization of the specimen design for stress behavior. Furthermore, the S-N curve generated from the experiments demonstrated consistent patterns when compared with analytical and literature data, proving the validity of the optimized specimen design. The scientifically validated specimen design serves as a novel and innovative approach that could be applied in applications where small size, and bending loads are critical.
Keywords:
bending fatigue
; meso-scale
; krouse-specimen
; repeated loading
; constant amplitude loading
1. Introduction
The phenomenon of fatigue failure dates to the 1800s when the cause of railway axle failures was identified as cyclic stress. Subsequently, the fatigue of numerous real-world examples was brought to the limelight including bridge structures, and automobile engines. Other moving component mechanisms such as, aircraft wings and fuselage, nuclear reactor components which are under oscillating loading conditions and many more also experience significant fatigue loading. After extensive investigations and laboratory testing of metals to failure, the German engineer August Wohler eventually developed the S-N diagram to characterize the behavior of materials under cyclic loading which is widely used to this day to determine metal fatigue strength and life cycles to failure [1,2,3,4]. Since then, a great deal of scientific research and development had been carried out to investigate the fatigue failure mechanism [5,6,7] as well as testing procedures and standards such as axial fatigue testing, bending fatigue testing, rotating bending fatigue test most popularly known as R.R Moore bending fatigue testing, cantilever bending fatigue test and so on [8,9,10,11,12,13,14]. For this study, cantilever bending fatigue test procedure is applied following the ASTM standard B593-21 [14].
Miniaturization has popped up in the analytical world with vast applications in not only material characterization, but also in manufacturing, industrial and environmental research with a view to curtailing processing cost, time, and manufacturing complexities [15,16]. But miniature specimen come with their own challenges and the appropriateness and effectiveness of the miniaturization concepts needed to be convincingly justified. L Bergonzi et al. [17] analyzed miniature sized specimens compatible with Mach3D fixtures in comparison to full size ISO 6892 standard specimen and found that the stress-strain curve exhibited identical patterns for both groups of specimens, with maximum 3.7% deviation in tensile strength which provided experimental validation of the miniaturization concept. J Džugan et al. [18] proved the advantage of miniaturization through mini tensile test and demonstrated the excellent trends in determination of the mechanical characteristics of sheet metal such as strain-hardening coefficients assessment, strain rate sensitivity, and plastic strain ratio between Mini-Tensile (MT), and standard sized samples. In context of economic benefits, manufacturing ease and qualitative aspects, S. Karnati et al. [19] performed a comparative study to figure out the similarities and differences between meso-scale and ASTM E8 specimen as well as to justify the use of MT specimen in various characterizations. While the variance in ultimate strength and strain at break were explained to be expected due to geometric sensitivity and presence of inclusions from the microstructure, the comparability of the pre yielding region of the stress-strain curves proved the feasibility of using MT specimen alongside the existing ASTM E8 standards [20].
Besides mini tensile tests, miniaturization has also been proven to be justifiable in fatigue testing, offering greater relevance in terms of time and cost efficiency. Although the application in this area remains limited, a few studies are noteworthy. Notably, T. Hirose et al. [21] investigated diametral strain-controlled fatigue tests between mini and normative specimen where the mini specimen showed a higher fatigue strength than that of normative specimen. Later, J. Sempruch et al. [22] executed the same concept in an ultrasonic high cycle fatigue testing machine and found equivalent results with that of conventional servo-hydraulic fatigue machine at reduced timeframes which saved on test costs. While all of these works were implemented in axial and rotating bending fatigue conditions, H. Ghadimi et al. [23] and D. Yang et al. [24] further executed this high frequency fatigue test concept in a pure bending fatigue test by using flat thin specimen instead of round stock. This allowed to leverage the cost effectiveness and rapidness of the fatigue test as well as study geometric sensitivity with the help of theoretical analysis, numerical simulation, and experimentation.
As miniaturization becomes prevalent, some past investigations have argued that size can affect fatigue strength if there is a stress gradient prominent in the specimen due to certain unusual geometric features such as holes, notch, fillets etc. and can be amplified by variances in surface finish [25,26]. Intrinsically, the presence of peculiar geometric patterns, although unavoidable in the practical world, cause unwanted stress-concentration zones, leading to the perceived reduction in the material strength [27]. C. Sun et al. [28] also identified some of the benefits of the notched geometry which provides a contrarian perspective on the use of these geometric features. In their analysis, they reasoned that the specimen having notched features exhibits higher fatigue strength due to its smaller control volume than normal specimen, resulting in fewer inclusions or defects that would adversely affect fatigue behavior. However, this phenomenon can be specific to aspects such as different materials exhibiting differing sensitivity to size in determining fatigue properties [29] ; specimen shape and design variables that could dominate fatigue strength [30] ; surface condition, where poor finishes from manufacturing process as well as the test procedures significantly affect the fatigue performance [31]. Upon taking all of these factors into consideration, the current study aimed at obtaining an optimized specimen geometry in the meso-scale regime and ensure minimal stress concentration points and uniformity of stress distribution across the gage. Meso-scale was chosen as it can yield an optimal balance between resource efficiency and data representativeness.
With respect to geometry, the Krouse shape has recently appeared as a leading choice in bending fatigue tests due to its consistency of stress distribution across the gage area by reducing stress concentration points and thereby providing reliable data on material properties. Additionally, recent research has highlighted the benefits of this method for metal characterization, especially in bending fatigue tests on flat sheets, as it allows for the analysis of a larger volume of material compared to gage sections of uniform cross-section. M.M Parvez et al. [32,33] used dual gage Krouse specimen in his fatigue test of additively manufactured material as it provides a larger surface area to increase control volume which would enable higher volumes of surface and microstructural defects to be captured, interrogated, and analyzed, thereby generating representative data. Krouse type fatigue differs when compared to axial fatigue testing, requiring less force to achieve the same stress amplitudes and using less expensive testing machines as demonstrated by Z. R Williams [34]. Researchers have also demonstrated the application of Krouse specimen in their respective analyses at multiple size scales [35,36,37,38]. Gohil et al. [39] , Berchem et al. [40] and Haidyrah et al. [41] experimented with Krouse specimen in sheet metal and nuclear materials respectively to determine bending fatigue properties with the application of stress-life (S-N) approach. This ongoing research attempts for a holistic strategy for geometry optimization by further scaling down test specimen size into the meso-scale regime [42], and advocating for mitigating manufacturing and specimen preparation constraints and thereby creating a cost effective and time-efficient fatigue test process that could be used in a wide range of processes and materials investigations.
2. Materials, Assumptions and Methodology
2.1. Materials
The material analyzed as an example to support the current study was 17-4PH, which is a stainless steel that finds broad applicability in aerospace, plastic molding dies, and chemical processing components due to its remarkable corrosion resistant property [43]. It is a precipitation hardening SS comprised approximately 17% chromium and 4% nickel, providing an outstanding combination of high strength, and hardness as well as a surface finish that is not affected by significant oxidation effects. The chemical composition of the steel received through Mill Test Certificate (MTC) from the vendor is listed in Table 1. The commercially purchased steel was in the solution annealed (condition A) state, allowing for easy machinability with a 34 HRC and grain size finer than 10.5, that would theoretically lead to improved fatigue resistance and performance characteristics [43,44].
2.2. Assumptions
Despite the extensive initiatives taken during the analysis to acquire consistent results; this analysis makes some typical assumptions as described below which help to simplify the interpretation and calculation throughout the testing and experimentation.
- The material used in this test is homogeneous and isotropic in terms of composition and properties.
- The material follows Hooke’s law within the elastic range.
- In spite of polishing to achieve a high surface finish, surface defects such as scratches, voids, oxides might exist in a minimal amount which has negligible effects that are beyond the scope of this study.
- The load applied in a test cycle is uniform and constant.
- As the complete setup has been designed and manufactured for a pure bending test, any internal shear effect, torsional or axial load is negligible.
- The residual stress effect in material from prior manufacturing is not considered.
- Due to geometric variations in portions of the specimen, the calculated stress concentration is assumed as approximate.
- The tolerance in dimensions and thickness of the specimen is within 2%.
- Specimen is treated as a cantilever beam and follows the Elastic-static theory also known as Euler- Bernoulli hypothesis [45] which states that plane sections of the beam remain in plane after bending and cross section remains normal to the neutral axis.
- The frictional effect between moving components in practical test setup is negligible.
- The test is performed at room temperature that is assumed to remain constant throughout the test at 10 Hz frequency.
2.3. Methodology
2.3.1. Preliminary Specimen Geometry
Preliminary specimen geometry, a modified version of ASTM suggested standard for Krouse type bending fatigue [14] was created by using SolidWorks 2023 (Dassault Systèmes-SolidWorks Corporation) as indicated in Figure 1. The overall dimensions and volume were estimated to be one-fourth of the closest comparable ASTM bending type specimen, which categorizes this design into the meso-scale specimen regime [42]. Additionally, the holes present in ASTM geometry for clamping and loading have been avoided to eliminate undesirable stress concentration at those highly notch sensitive features as well as to simplify the specimen manufacturing and preparation process. Inclusion of these features adds additional manufacturing operations and introduces tolerance and surface finish complexities particularly in miniaturized designs, which this research wishes to counter.
The geometric parameters shown here have been optimized through iterative refinement using FEA simulations. Specifically, the arc and clamping area have been configured for providing sufficient reinforcement against reaction forces, hence alleviating the stress concentration in the clamped section and to transfer and locate the maximum stress concentration regions to the gage. With approximated to a certain value, (the gage width) is the controlling variable for optimizing the gage region, such that changing automatically adjusts the gage length and Apex A (the loading point).
2.3.2. Theoretical Study
In the design optimization process of fatigue specimen, a theoretical study is essential to reduce excessive empirical iterations and the need for superfluous physical prototyping. Theoretical calculations leveraged by this study provided preliminary benchmarks to carry the analysis forward through simulated data and supporting empirical evidence. This also provides other researchers with the methodology to create and optimize their own miniature Krouse type geometries to address their own unique needs.
Stress and Deflection Calculation
The theoretical analysis of this study focuses on the gage section, considering it as a cantilever beam which is fixed at one end and deflects at the other end when subjected to a load P as shown in Figure 1(b).
In this case, per ASTM, the simple beam equation can be used to calculate maximum bending stress [14]. Additionally, several other researchers have derived the forthcoming equations for maximum stress and deflection in a triangular shape based on cantilever beam theory [37,39,40,46,47].
where, and , , , , and are maximum stress, deflection, load, gage length, gage width, specimen thickness and Modulus of elasticity of the material respectively. These notations are mentioned according to ASTM standard terminology relating to fatigue and fracture testing from the “E1823-23” standard document [48].
Even though proper care has been taken in specimen design to avoid certain features, due to the nonuniform gage section of Krouse geometry, there will still be an effect of the geometric stress concentration factor. Moreover, regardless of 17-4PH steel being ductile, in fatigue testing to high cycles with the application of cyclic loading, dynamic stress concentration exists due to notch sensitivity at filleted sections. Neuber and Kuhn established the following relationship between this geometric stress concentration , notch sensitivity, and fatigue stress concentration [1,49,50].
Geometric stress concentration data compiled by numerous experts are available in literature in the form of charts and tables for basic geometric shapes such as stepped flat bar, grooved shafts, notched and filleted rectangular bars etc. [51,52,53,54]. For more complex shapes, the mathematical function as shown in Equation (4) plus a list of coefficients is suggested in Peterson’s and Machine design-An Integrated approach [1,51] and is assumed to be the closest match for analyzing stress concentration in the current Krouse design.
where is calculated by measuring the major and minor width ( and in Figure 1) in the respective fillet throughout the Krouse cross-section. The calculated stress concentration factor was further approximated and justified through FEA simulation to target maximum accuracy in stress calculation. The coefficients and are obtained through interpolation based on the data available in the literature.
Material notch sensitivity, is defined in terms of Neuber’s constant, and notch (fillet in this case) radius is stated in Equation (5) through the Kuhn-Hardrath formula [1,49].
The Neuber’s constant, can be determined from the ultimate strength of the material using the charts available in literature [1,55]. By substituting and values into Equation (3), fatigue stress concentration is determined. Finally, Equation (1) is revised to the following form to calculate the maximum bending stress.
Endurance Strength Calculation
Endurance strength refers to the stress level that a material can withstand for an infinite fatigue cycle without experiencing failure. In the context of S-N curve, endurance limit exhibits the knee point past which a material will experience no failure in its lifetime of repeated load cycling. Generally, the endurance strength of the material is estimated with respect to its ultimate strength [1]. For example, if steel’s UTS is less than 1400 MPa, the estimated endurance strength, = . This estimation is based on standard fatigue-test specimens through static testing. In actual applications, several other factors such as size effect, type of loading, surface finish, environmental impact and finally reliability factor must be considered. So, by multiplying all those factors with estimated endurance strength, the corrected endurance strength is obtained using the following equation.
The factors in Equation (7) are calculated by using the formula in the book “Machine design-An Integrated approach [1] and are described in the forthcoming sections.
=loading factor. In a bending fatigue test, loading factor is always 1. So, =1.
is the size factor that needs to be considered for larger specimen size where diameter exceeds 8 mm. However, in this study, as we are dealing with meso-scale flat specimen, an approximate equivalent diameter is calculated by using the formula,
where, is the cross-sectional area of the specimen stressed above 95% of its maximum stress compared to a rotating beam specimen. By calculating this, is found to be 2.04 which is less than 8. So, in this current study, =1.
The surface factor data is available in literature with respect to the ultimate strength of the material but the relationship in Equation (9) has been established by Shigley et al. to determine specific results in actual applications [55].
In the current study, surface factor is calculated as = 0.69, using the Equation (9) by selecting the coefficient and exponent from table available in Shigley and Mischke, Mechanical Engineering Design, 5th ed., McGraw-Hill, New York, 189, p.283 for machined specimen.
The temperature factor is 1 for this case as the test is performed at room temperature.
Finally, assuming 99% reliability on used material strength, =0.814. The corrected endurance strength Se derived from Equation (7) is then used as a knee point in the S-N curve.
Theoretical Life Cycle Calculation
To create an estimated S-N curve, theoretical life cycle is calculated by using Equation (10).
where, is fatigue strength at any cycle and , are the constants determined by the boundary conditions considering fatigue strength, = at low cycle, 1=103 while = , at high cycle, 2=106. Low cycle fatigue strength for bending is estimated as a fraction of ultimate stress and defined as =0.89 [56,57]. Logarithmic form of Equation (10) is,
Equivalent Reversible Stress
The current analysis is based on repeated loading with the amplitude ratio of , however, the typical S-N curve is only applicable for completely reversible loading () with zero mean stress effect. Therefore, an equivalent reversible stress must be determined due to the presence of combined mean and alternating stress effect during this fatigue failure. Modified Good-man correction was considered in this analysis, which is demonstrated by the Equation (14), where and are alternating and mean stress components, while and are the endurance strength and ultimate strength respectively.
Figure 2 shows that the modified Good-man line is created by linking ultimate strength at abscissa () and endurance strength at ordinate as suggested in the modified goodman diagram. Consequently, the extended line connecting ( and multiple fluctuating stress points (, towards ordinate represents the equivalent reversible stress (). This is because the point where it intersects at axis has zero mean stress () which meets the requirement of traditional S-N curve. Accordingly, Equations (10) and (14) are modified, replacing or by to calculate respective equivalent reversible stress components and life cycles which are used in creating the S-N curve. and are calculated applying actual fatigue stress concentration factor . Additionally, the mean fatigue stress concentration factor =1 is considered in the situation of local yielding where, maximum stress exceeds the yield strength (Sy) [57].
3. Geometry Optimization and Design Finalization
3.1. Geometry Optimization Using FEA
Finite element analysis was performed on 4 separate geometries of the specimen for the optimization and to illustrate the stress propagation within the gage section by using SOLIDWORKS 2023 software (Dassault Systèmes - SolidWorks Corporation). As the core focus is to maximize the gage region (and thereby the effective interrogation volume of the material being tested), other geometric features like the larger width of the gage trapezoid have been configured and fixed by optimization through these simulations. The gage width 2.0 mm, 2.5 mm, 3.0 mm, and 3.5 mm were analyzed to observe uniformity or lack thereof of the stress evolution within the gage volume. Figure 3 represents all 4 geometries along with the respective demonstration of stress-distribution.
Looking at 4 distinct demonstrations, 2.5 mm gage exhibits more balanced distribution than other three geometries. The 2.0 mm width tends to shift stress concentration towards the clamping side and concentrates the maximum stress concentration to a smaller cross section, while the 3.5 mm width shows a tendency to concentrate towards the loading end. This will tend to initiate and propagate fatigue failure within much narrower regions of the gage while exhibiting non-uniformity in stress distribution across the gage.
So, it can be stated that lowering or increasing the width beyond a point does not support gage volume maximization, but it raises the risk of failure always occurring at a narrow location which goes against this research desire to maximize the gage volume.
A boundary condition in above analysis has been applied to eliminate stress concentrations from the clamped section by restricting all the degrees of freedom of movement, ensuring full utilization of the cantilever beam fixture thereby neglecting the shear effect, although internal shear effect exists in a limited amount. To maintain the consistency of analysis across all geometries and mesh independence, a solid mesh of tetrahedral elements (uniform size) was chosen, with the stress variation among the number of nodes and elements kept below 2%. A 15N constant load was applied for this optimization, and the loading area has been determined according to the position of the triangle’s apex for each individual geometry based on the width of the gage.
3.2. Numerical Validation of Optimized Geometry
Both theoretical and numerical investigations suggested that geometry containing 2.5 mm gage width (Figure 3b) can be utilized as an optimized Krouse fatigue specimen for further investigations.
The optimized geometry is expected to outperform compared to existing ASTM fatigue specimens in multiple ways. One of the standout advantages of this optimized geometry is that it has significantly removed stress concentration effect by maximizing gage volume, appropriately reinforcing the notches and hence uniformly distributing stress concentration throughout the gage. To validate this statement, stress concentrations in gradually varying cross-sections of optimized geometry were determined by utilizing relevant equations (Equations (3)-(5)) and charts [58] and subsequently compared the stress concentration and notch effects of the optimized geometry with ASTM design as presented in Table 2. It shows that optimized geometry completely eliminated the stress concentration of holes by removing these features and additionally, the stress concentration in the filleted section has been reduced by approximately 20% compared to ASTM design.
To verify the functionality of this optimized geometry, its peak stress maps were compared with those of other geometries assessed in this study by finite element simulations as illustrated in Figure 4. Von-mises stress contour indicates that, with similar loading and boundary conditions, even a slight variation in geometry in the gage length and width considerably affected the maximum stress propagation. The plot shows that optimized geometry experienced only 1.3% variation in maximum stress distribution, whereas other geometries exhibited 12% and 26% variation across the gage respectively, reflecting the effectiveness of the gage optimization and proving the 2.5 mm width as a balanced geometry.
4. Experimental Methodology
4.1. Specimen Preparation
Premised on FEA optimization results, the specimen geometry incorporating a 2.5 mm gage width was selected as final design as illustrated in Figure 5. This configuration provided the most uniform stress distribution across the gage section while maximizing the effective material volume in the gage for fatigue interrogation. The remaining geometric features were retained from the preliminary design, resulting in a specimen that satisfies both the dimensional constraints of the meso-scale test and the mechanical requirements for reliable bending fatigue characterization. The optimized specimens were prepared using a Wire -electric Discharge Machine (W-EDM) from commercially purchased 17-4PH stainless steel block. As the machining of miniature specimen is quite challenging in terms of dimensional accuracy and minimizing surface roughness, initially some test cuts were performed to acquire a suitable combination of machining parameters such as pulse, peak current, feed and wire speed etc. [59]. Moreover, to avoid an oxide layer along the profile, this machining process featured an initial rough cutting pass followed by three finishing passes as suggested by Karnati et. al. [19].
Machined specimens underwent some micro and macro polishing [60] to remove any subsequent oxide layers and surface imperfections while maintaining dimensional tolerances. These manual polishing processes were performed in two sequential stages; primarily, 400 and 600 grit emery paper was applied to remove the oxide build up, detrimental burrs and tooling scratches. Subsequently, 800, and 1200 grit sandpaper were deployed to ensure a high surface finish with minimal stress concentration points.
4.2. Test Setup
Figure 6 outlines the schematic presentation of a miniature fatigue test apparatus which was developed for experimental validation of optimized geometry. The set-up comprises some key components such as (i) a voice coil actuator, (ii) a laser displacement sensor, and (iii) specimen mount including clamps, fixtures, and a load cell. The 3-inch diameter linear voice coil actuator possesses the continuous stall force capacity of 133.8N with maximum allowable coil winding temperature of 155 ℃ that makes it best fit for the high cycle fatigue test application. The wider portion of the specimen is secured in a fixed jaw while the loading end is clamped to a movable block which travels along the sliding guide rail and is attached to the actuator. A 25 lb. capacity load cell (FUTEK LCM 100) is mounted right after the moving jaw for accurate measurement of the load applied on the specimen. The power is supplied to the motor using a DC310S benchtop power supply.
4.3. Operating Procedure
The control of fatigue tester follows conventional fatigue test control methods. It uses two sensors, a Laser Displacement Sensor and a Load Cell, to measure the movement of the specimen as well as the force applied on the specimen. The displacement and load information are processed onboard the Pi, which allows for feedback control via a C script. This same C script pipes the collected data over USB to a windows machine, as well as generating a square wave to drive the actuator itself.
For driving the actuator, the Raspberry Pi creates a square wave using the pigpio library in C. This allows for hardware timed PWM (Pulsed Width Modulation) on a Raspberry Pi to ensure an accurate frequency of the resultant square wave. The square wave is then fed into an H Bridge, using the DRV8833 IC, allowing the motor to be moved forward and backwards, with the H Bridge changing the polarity across the motor.
5. Result and Discussion
5.1. Mechanical and Fatigue Properties of 17-4 PH Optimized Geometry
Since the specimen was miniaturized, the actual mechanical properties of 17-4PH were determined through a mini-tensile testing machine developed by PINE (Product Innovation and Engineering LLC [61] to find the equivalence with standard data. Subsequently, these basic properties were used for the determination of endurance strength along with fatigue life cycle constant (a), fatigue strength exponent (b), surface characteristics and endurance strength correction factors of the optimized specimen by using Equations (7)–(13) and relevant charts and figures from literature as summarized in Table 3.
5.2. Experimental Validation of Optimized Geometry
The constant amplitude, load controlled fatigue tests were performed based on repeated loading conditions with a stress ratio , .
The applied load and measured displacement amplitudes remained stable during the test for the majority of fatigue cycle, indicating consistent mechanical behavior within the elastic regime as demonstrated in Figure 7. Then in the plastic regime, as the crack initiated, a gradual increase in displacement amplitude was observed due to the reduction in the structural stiffness [62]. Continued crack propagation resulted in a rapid rise in displacement amplitude before complete failure of the specimen (Figure 7). The test was automatically terminated when the displacement monitored and measured by the displacement sensor exceeded the predefined threshold value.
Figure 8 shows that in all fractured specimens, crack initiation and final fracture occur within the gage section randomly at different location-left, center, and right side of the gage. This observation proves the excellent agreement with the finite element prediction of maximum stress distribution across the gage section as presented in Section 3.1.
The experimentally observed failure locations confirmed the effectiveness of the geometry optimization process and demonstrated that selected specimen design provides a well-defined fatigue interrogation region. By promoting the crack initiation and propagation within the central gage section, the optimized geometry minimizes boundary induced effects and allows more representative characterization of the material’s fatigue behavior. The randomness of the failure initiation locations and propagation directions also support the gage volume optimizations. These results validate the suitability of the proposed meso-scale specimen for reliable bending fatigue characterization.
5.3. Experimental Results and Discussion
Specimens were tested using staircase method for bending fatigue characterization of the proposed meso-scale specimen geometry in this study. All tests were conducted at load-controlled conditions at a frequency of 10 Hz and room temperature. The temperature of the specimen and components of the test apparatus were monitored using a FLIR infrared thermal camera. and the maximum recorded temperature remained below 30◦C. This indicates that self-heating effects were negligible and that the measured fatigue response was not significantly influenced by thermal degradation.
The applied load and corresponding displacement data were continuously recorded using a Python-based data acquisition system and subsequently processed using MATLAB. Figure 9 and Figure 10 present the relationships between load versus displacement and Load versus number of cycles to failure, respectively. A positive correlation was observed in load-displacement response, such that increasing load resulting in higher peak displacement amplitudes. On the contrary, the load-cycle relationship demonstrated the expected inverse trend characteristic of fatigue behavior, where increased load levels caused reduced fatigue life. Fitted curve shows that linear regression relationship yielded coefficients of determination () of approximately 0.85 for both datasets, indicating good consistency among the experimental measurements.
To generate Wohler S-N curve, the measured peak displacement values were first converted to maximum bending stress using the stress-displacement relationship (Equation (15)) derived by combining Equations (1) and (2). Because the fatigue tests were conducted at a stress ratio of (), the calculated maximum stresses were subsequently transformed into equivalent fully reversed stresses using Goodman criterion to account for mean stress effects as explained in Equivalent Reversible Stress Section.
Equation (14) was rearranged to obtain Equation (16), which was used to determine equivalent stress amplitude for each test. These stress amplitudes are then plotted against the corresponding number of cycles to failure for constructing the S-N curve as presented in Figure 11.
The generated S-N curve exhibits the expected fatigue behavior of metallic materials, with fatigue strength decreasing as the number of cycles to failure increases. Although some scatter is observed in experimental data, the coefficient of determination (2) of 0.76 is still comparable with other studies performed on similar Krouse specimen [34] and overall trend remains consistent with conventional fatigue characterization and established theories.
As shown in Figure 12 the experimental results were further compared with the literature fatigue data studied and reported by Leybold in a technical note of NASA [63]. This standard dataset was widely used to compare the fatigue performance of additively manufactured 17-4PH steels in multiple studies [64,65,66]. However, direct quantitative comparison may not be appropriate in this regard due to significant differences in test methods, specimen geometry and size, and the loading mode. For example, literature fatigue data studied by Leybold on wrought 17-7 PH were obtained from axial fatigue test of conventionally sized specimens, whereas present work employed a miniaturized specimen subjected to cyclic bending. Nevertheless, such comparisons provide useful qualitative insight into the performance and reliability of the proposed fatigue characterization approach. The comparison indicates that the literature data exhibited about 27% higher strength than 17-4 PH tested in this study. Several factors may contribute to this difference, including loading mode, stress gradients inherent to bending fatigue, specimen dimensions, surface conditions, and manufacturing related effects which are the scopes of further detailed studies. Despite these differences, both datasets exhibit similar S-N behavior and comparable fatigue-strength degradation trends, proving the validity of proposed methodology.
Figure 12 also demonstrates a good agreement of this experimental dataset with that of theoretical predictions developed in the present work. Based on the endurance limit at 106 cycles, The theoretical model predicted a fatigue strength of about 330 MPa, while the experimentally obtained endurance strength was roughly 400 MPa, representing a difference of nearly 18%. This variation is expected with the reasoning that the theoretical model assumes idealized loading and boundary conditions, whereas the experimental set-up includes clamping effects, load-transfer mechanisms, contact interactions, and other practical factors that influence stress concentrations within the specimen. Moreover, this discrepancy provides a conservative basis for fatigue design. The experimentally observed improved endurance limit manifests that the optimized specimen geometry and testing approach yield a fatigue performance superior to the minimum capability estimated by the analytical model. This conservative approach is specially advantageous for real life engineering applications, where underprediction of fatigue strength is generally preferred over overprediction to mitigate the risk of unexpected fatigue failure while in service.
To summarize, the experimental results generally agree with the classic S-N curve and standard method confirming the optimal meso-scale specimen geometry for fatigue behavior. The concordance found between experimental measurements, numerical predictions and published data demonstrates that the proposed specimen geometry is capable of generating reliable fatigue life data with substantially lower specimen sizes, material volumes and costs. These results confirm the viability of the improved shape for bending fatigue characterization and suggest the potential for future applicability to high-throughput and high-cycle fatigue testing, and material screening.
6. Conclusions
In this study, a novel meso-scale Krouse type fatigue specimen and test set-up were successfully developed and validated through a systematic design and optimization strategy, together with the practical experimentation. Specimen geometry was determined through theoretical analysis and subsequently refined using finite element analysis to maximize the effective gage region to ensure a more uniform stress distribution throughout the fatigue interrogation volume. Optimized design successfully moved stress concentration away from the clamping and loading zones and localized fatigue damage within the specified gage-section.
The effectiveness of the proposed geometry was verified both by numerical simulations and the experimental testing. Finite element analysis justified uniform stress distribution within the gage section, whereas experimental observations confirmed the crack initiation and final fatigue fracture within the optimized region. The experimentally observed failure locations were in good agreement with the numerical predictions, and thus, the geometry optimization methods and accompanying testing methodology were validated.
Furthermore, experimentally determined load-displacement, load-life relationships, and generated S-N curve exhibited consistent trends with conventional fatigue behavior. Comparison with theoretical predictions and literature data for 17-4PH stainless steel further confirmed the ability of the proposed miniaturized specimen geometry to generate meaningful fatigue-life data. The experimentally determined endurance strength was found to exceed the theoretical prediction by approximately 18%, confirming the safe deployment of the optimized meso-scale fatigue characterization approach to real life engineering applications. Additionally, from a manufacturing and economic perspective, the elimination of features in conventional specimen such as holes and notches contributed to the cost effectiveness of the design by minimizing extra machining complexities and fabrication time. The collective validation techniques and associated observations can adapt the optimized specimen as a practical and scientific solution of fatigue test for application in both research laboratories and manufacturing industries, particularly in additive manufacturing, automobile, aerospace, nuclear and medical sectors, which require rapid and small-scale testing with high fidelity data.
7. Future Works
The authors recommend progressing this research by evaluating the applicability of the proposed specimen geometry across a broader range of materials and manufacturing processes. Further investigations on the influence of loading frequency, dimensional tolerances, clamping mechanism, and various loading modes would further strengthen the appropriateness of the suggested methodology. Manufacturing sensitivities, possible edge defects and notch formation in the adjacent features of the geometry during sample preparation to be justified. Finally, comparative studies with conventional fatigue specimens of different shapes and sizes are encouraged to comprehensively evaluate the performance, scalability, and robustness of the proposed meso-scale specimen design alongside establishing correlations among different fatigue characterization approaches for its meaningful adoption and standardization.
Author Contributions
Conceptualization, M.B.U., and S.P.I.; methodology, M.B.U., T.P.; software, T.P.; Experimental validation, M.B.U., S.P.I., T.P., and F.L.; formal analysis, M.B.U., and M.M.P.; investigation, M.B.U., and M.M.P.; resources, F.L.; data curation, M.B.U., T.P.; writing—original draft preparation, M.B.U.; writing—review and editing, M.B.U., S.P.I., T.P., M.M.P, and F.L.; visualization, M.B.U.; supervision, S.P.I., and F.L.; project administration, F.L., and S.P.I.; funding acquisition, F.L. All authors have read and agreed to the published version of the manuscript.
Funding
This project was funded by the Department of Energy, contract #DE-SC0018879; Kummer Student Program (KSP) at Missouri University of Science and Technology, and Product Innovation and Engineering, LLC. The authors express sincere gratitude for their financial support.
Data Availability Statement
The data relevant to current study is presented in the article. Further inquiries can be directed to the corresponding author.
Conflicts of Interest
The authors declare no conflicts of interest.
References
- Norton, R.L. Machine design: An integrated approach. J. Manuf. Syst. 1998. [Google Scholar] [CrossRef]
- History of Fatigue Analysis
- Curve, S. Stress-Life ( S-N ) Approach; 2022; pp. 1–31. [Google Scholar]
- Base, T.K. Durability Knowledge booklet. [CrossRef] [PubMed]
- Methods, F.A.; Cause, D.R. Exploring Failure Analysis Methods | IMR Test Labs Fatigue Analysis Methods for Determining Root Cause; 2021; pp. 1–4. [Google Scholar]
- Kurotani, Y.; Tanaka, H. Fatigue fracture mechanism of amorphous materials from a density-based coarse-grained model. Commun. Mater. Springer US 2022, 3, 4–6. [Google Scholar] [CrossRef]
- Ji, L.; Zou, S.; Shen, M.; Xin, Y. Radio frequency underwater discharge operation and its application to Congo Red degradation. Plasma Sci. Technol. 2012, 14, 111–7. [Google Scholar] [CrossRef]
- MATERIAL TESTING MACHINE.
- Definition, B.; Initiation, C.; Propagation, C.; Fatigue, F.F. Experiment: Fatigue Testing; Engineering.; pp. 1–8.
- Digital Display [Internet]. 2004. Available online: www.instron.com.
- Lieurade, H.P.; Degallaix, S.; Degallaix, G.; Gauthier, J.P. Fatigue Tests. Struct. Compon. Mech. Tests Behav. Laws 2010, 125–92. [Google Scholar] [CrossRef]
- Standard Practice for Presentation of Constant Amplitude Fatigue Test Results for Metallic Materials 1. [CrossRef]
- Standard Test Method for Strain-Controlled Fatigue Testing 1. [CrossRef]
- Standard Test Method for Bending Fatigue Testing for Copper-Alloy Spring Materials 1. [CrossRef]
- Vysetti, B. Current Advances in the Miniaturization of Analytical Instruments-Applications in Cosmochemistry, Geochemistry, Exploration, and Environmental Sciences [Internet]. 2016. Available online: https://www.spectroscopyonline.com/view/current-advances-miniaturization-analytical-instruments-applications-cosmochemistry-geochemistry-exp.
- Pagano, C.; Fassi, I. Introduction to Miniaturisation; 2017; pp. 1–22. [Google Scholar] [CrossRef]
- Bergonzi, L.; Vettori, M.; Moroni, F.; Musiari, F.; Pirondi, A. Experimental validation of miniaturized specimen developed to perform uniaxial tensile test on high performance materials. In IOP Conf Ser Mater Sci Eng; IOP Publishing, 2021; Volume 1038, p. 012070. [Google Scholar] [CrossRef]
- Džugan, J.; Rund, M.; Prantl, A.; Konopík, P. Mini-tensile specimen application for sheets characterization. In IOP Conf Ser Mater Sci Eng; Institute of Physics Publishing, 2017. [Google Scholar] [CrossRef]
- Karnati, S.; Isanaka, S.P.; Zhang, Y.; Liou, F.F.; Schulthess, J.L. A Comparative Study on Representativeness and Stochastic Efficacy of Miniature Tensile Specimen Testing. In Mater Perform Charact; ASTM International, 2022; p. 11. [Google Scholar] [CrossRef]
- Test Methods for Tension Testing of Metallic Materials [Internet]; ASTM International: West Conshohocken, PA, 2024. [CrossRef]
- Hirose, T.; Sakasegawa, H.; Kohyama, A.; Katoh, Y.; Tanigawa, H. Effect of specimen size on fatigue properties of reduced activation ferritic/martensitic steels. J. Nucl. Mater. 2000, 283–287, 1018–22. [Google Scholar] [CrossRef]
- Sempruch, J. APPLICATION OF MINI SPECIMENS TO HIGH-CYCLE FATIGUE TESTS [Internet]. Available online: https://www.researchgate.net/publication/268063607.
- Ghadimi, H.; Jirandehi, A.P.; Nemati, S.; Guo, S. Small-sized specimen design with the provision for high-frequency bending-fatigue testing. In Fatigue Fract Eng Mater Struct; John Wiley and Sons Inc, 2021; Volume 44, pp. 3517–37. [Google Scholar] [CrossRef]
- Yang, D.; Tang, S.; Hu, Y.; Nikitin, A.; Wang, Q.; Liu, Y.; et al. A Novel Model of Ultrasonic Fatigue Test in Pure Bending. Mater. MDPI 2022, 15. [Google Scholar] [CrossRef] [PubMed]
- Findley, W.N. RESEARCH NOTE: AN EXPLANATION OF SIZE EFFECT IN FATIGUE OF METALS. [PubMed]
- Kelly, D.A.; Morrison, J.L.M. EFFECT OF SPECIMEN SIZE AND PREPARATION CARBON STEEL TESTED IN ROTATING BENDING AND IN TORSION ON THE FATIGUE STRENGTH OF A PLAIN. [CrossRef] [PubMed]
- Benedetti, M.; du Plessis, A.; Ritchie, R.O.; Dallago, M.; Razavi, N.; Berto, F. Architected cellular materials: A review on their mechanical properties towards fatigue-tolerant design and fabrication. In Materials Science and Engineering R: Reports; Elsevier Ltd., 2021. [Google Scholar] [CrossRef]
- Sun, C.; Song, Q. A method for predicting the effects of specimen geometry and loading condition on fatigue strength. In Metals (Basel); MDPI AG, 2018. [Google Scholar] [CrossRef]
- Tomaszewski, T. Statistical size effect in fatigue properties for mini-specimens. In Materials; MDPI AG, 2020. [Google Scholar] [CrossRef] [PubMed]
- Hagnell, M.K.; Khurshid, M.; Åkermo, M.; Barsoum, Z. Design implications and opportunities of considering fatigue strength, manufacturing variations and predictive lcc in welds. In Metals (Basel). MDPI; 2021. [Google Scholar] [CrossRef]
- Jimenez-Martinez, M. Manufacturing effects on fatigue strength. In Eng Fail Anal; Elsevier Ltd., 2020; p. 108. [Google Scholar] [CrossRef]
- Parvez, M.M.; Chen, Y.; Karnati, S.; Coward, C.; Newkirk, J.W.; Liou, F. A displacement controlled fatigue test method for additively manufactured materials. In Applied Sciences (Switzerland); MDPI AG, 2019. [Google Scholar] [CrossRef]
- Parvez, M.M.; Pan, T.; Chen, Y.; Karnati, S.; Newkirk, J.W.; Liou, F. High cycle fatigue performance of lpbf 304l stainless steel at nominal and optimized parameters. In Materials; MDPI AG, 2020. [Google Scholar] [CrossRef] [PubMed]
- Williams, Z.R. Krouse Fatigue for Metals with Elevated Mean Stress. 2020. [Google Scholar] [CrossRef] [PubMed]
- Haidyrah, A.S.; Newkirk, J.W.; Castaño, C.H. Weibull statistical analysis of Krouse type bending fatigue of nuclear materials. In Journal of Nuclear Materials; Elsevier, 2016; Volume 470, pp. 244–50. [Google Scholar] [CrossRef]
- Theory, B.; Saheli, M. Elastic Modulus Determination of Krouse Specimens through Resonance using Simple. 2019. [Google Scholar] [CrossRef]
- Shokrieh, M.M.; Esmkhani, M.; Haghighatkhah, A.R.; Zhao, Z. Flexural fatigue behavior of synthesized graphene/carbon-nanofiber/epoxy hybrid nanocomposites. Mater. Des. Elsevier Ltd. 2014, 62, 401–8. [Google Scholar] [CrossRef]
- Ramkumar, A.; Gnanamoorthy, R. Effect of nanoclay addition on the displacement-controlled flexural fatigue behavior of a polymer. J. Mater. Sci. 2010, 45, 4180–7. [Google Scholar] [CrossRef]
- Professor , A. Experimental and FEA Prediction of Fatigue Life in Sheet Metal (IS 2062) Dr. Piyush Gohil, 2 Hemant N Panchal*, 3 Siddiqi Mahmud Sohail, 4 Devang V Mahant [Internet]. International Journal of Applied Research & Studies. 2013. Available online: http://www.ijars.in.
- Berchem, K.; Hocking, M.G. A simple plane bending fatigue and corrosion fatigue testing machine. In Meas Sci Technol.; Institute of Physics Publishing, 2006. [Google Scholar] [CrossRef]
- Haidyrah, A.S.; Castaño, C.H.; Newkirk, J.W. AN EXPERIMENTAL STUDY ON BENDING FATIGUE TEST WITH A KROUSE-TYPE FATIGUE SPECIMEN; American Nuclear Society, 2014. [Google Scholar]
- Michopoulos, J.G.; Iliopoulos, A.P.; Steuben, J.C.; Kittur, M.; Phan, N.; A Salem, A.; et al. Multiscale Data Driven Methodology for Accelerating Qualification and Certification of Additively Manufactured Parts. In Encyclopedia of Materials: Metals and Alloys; Elsevier, 2022; pp. 223–44. [Google Scholar] [CrossRef]
- Atlas. Atlas Quality Management Scope: National Doc: Information Notice Stainless Steel 630 (17-4PH) Grade Data Sheet Grade 630 (17-4PH). [CrossRef]
- Rahman, A.; Isanaka, S.P.; Liou, F. A Comprehensive Study of Cooling Rate Effects on Diffusion, Microstructural Evolution, and Characterization of Aluminum Alloys. In Machines; Multidisciplinary Digital Publishing Institute (MDPI), 2025. [Google Scholar] [CrossRef]
- Williams, A. Structural analysis: In theory and practice. In Structural Analysis: In Theory and Practice; 2008. [Google Scholar] [CrossRef]
- Oore, S.; Oore, M. Uniform strength for large deflections of cantilever beams under end point load. Struct. Multidiscip. Optim. 2009, 38, 499–510. [Google Scholar] [CrossRef]
- Available online: https://mechanicalc.com/reference/beam-analysis.
- ASTM. E1823-23 Standard; Terminology Relating to Fatigue and Fracture Testing.
- Kuhn, P.; Langley, H.F.H.; Laboratwy, A.; Field, L.; Washington, V.; Hardrath, P.F. An engineering method for estimating notch-size effect in fatigue tests on steel. 1952. [Google Scholar]
- 50. Herbert Leybold Langley Research Center Langley Field BA, Herbert Leybold BA. UNDER CONSTANT-AMPUTUDE LDADING UNDER CONSTANT-AMPLITUDE LOADING. 1960. [Google Scholar]
- pilkey-w-d-peterson-s-stress-concentration-factors-3rd-ed_compress.
- Roark, R.J. (; Raymond, J.; Young, W.C. (; Warren, C.; Budynas, RG (Richard G. Roark’s formulas for stress and strain; McGraw-Hill, 2002. [Google Scholar]
- Budynas, Richard G.; Nisbett, J. Keith. Charts of Theoretical Stress-Concentration Factors K * t. 2011. [Google Scholar]
- Sorem, J.R.; Rolovic, D., JR. Updated Stress Concentration Factors for Filleted Shafts in Bending and Tension [Internet]. 1996. Available online: http://asmedigitalcollection.asme.org/mechanicaldesign/article-pdf/118/3/321/5747513/321_1.pdf.
- JEdward, Shigley; Mischke, C.R. Standard handbook of machine design; McGraw-Hill, 1996. [Google Scholar]
- JUVINALL, R.O.B.E.R.T. C.; MARSHEK, K.U.R.T. M. Fundamentals of Machine Component Design.
- Budynas, R.G.; Nisbett, JKeith; Shigley; JEdward. Shigley’s mechanical engineering design; McGraw-Hill, 2011. [Google Scholar]
- Charts of Theoretical Stress-Concentration Factors K * t
- Khan, A.A.; MBtMA; NBtM. Relationship of Surface Roughness with Current and Voltage During Wire EDM. J. Appl. Sci. 2006, 6, 2317–20. [Google Scholar] [CrossRef]
- Parvez, M.M.; Patel, S.; Isanaka, S.P.; Liou, F. A novel laser-aided machining and polishing process for additive manufacturing materials with multiple endmill emulating scan patterns. In Applied Sciences (Switzerland). MDPI; 2021. [Google Scholar] [CrossRef]
- Product Innovation and Engineering LLC. n.d. Available online: https://mopine.com/.
- Ritchie, R.O. Mechanisms of fatigue-crack propagation in ductile and brittle solids. Int. J. Fract. 1999. [Google Scholar] [CrossRef]
- Leybold, H.A. AXIAL-LOAD FATIGUE TESTS ON 17-7 PH STAINLESS STEEL UNDER CONSTANT-AMPLITUDE LOADING. 1960. [Google Scholar] [PubMed]
- Concli, F.; Bonaiti, L.; Gerosa, R.; Cortese, L.; Nalli, F.; Rosa, F.; et al. Bending fatigue behavior of 17-4 ph gears produced by additive manufacturing. In Applied Sciences (Switzerland); MDPI AG, 2021. [Google Scholar] [CrossRef]
- Yadollahi, A.; Shamsaei, N.; Thompson, S.M.; Elwany, A.; Bian, L.; Mahmoudi, M. FATIGUE BEHAVIOR OF SELECTIVE LASER MELTED 17-4 PH STAINLESS STEEL. [CrossRef] [PubMed]
- Maccioni, L.; Fraccaroli, L.; Borgianni, Y.; Concli, F. High-Cycle-Fatigue Characterization of an Additive Manufacturing 17-4 PH Stainless Steel. [CrossRef] [PubMed]
Figure 1.
Preliminary Specimen Sketch including gage section.
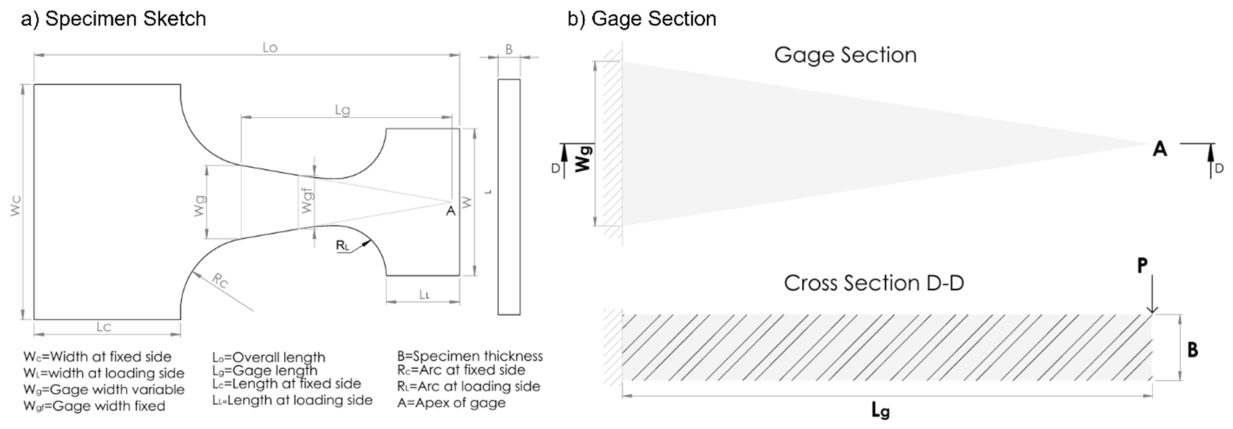
Figure 2.
Determination of Equivalent Reversible Stress using Modified Good-Man Diagram.
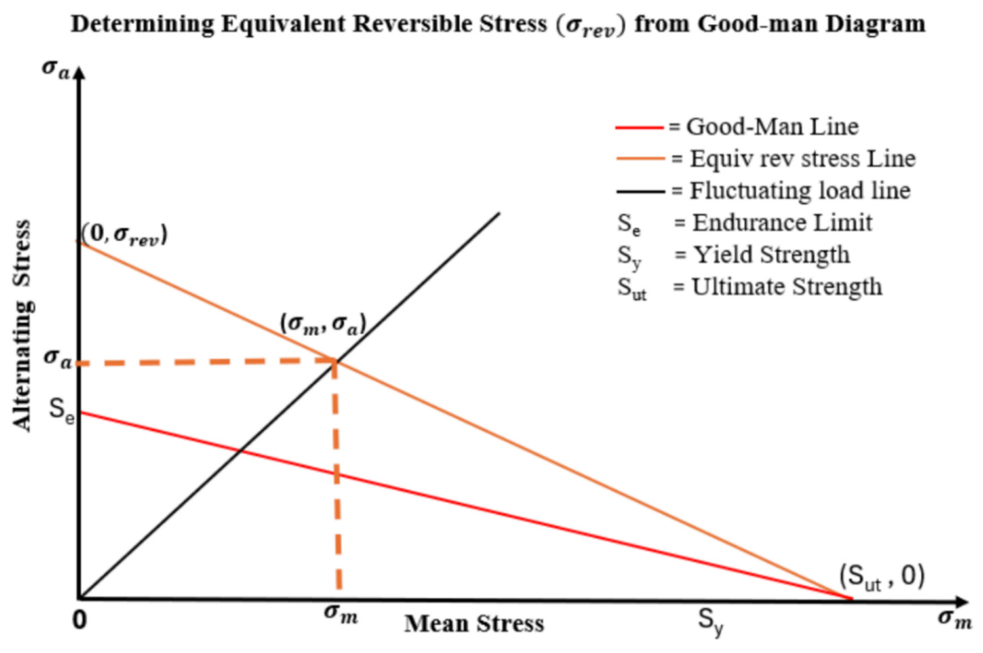
Figure 3.
Effect of Gage Width on the Maximum Stress Distribution within the Gage Section.
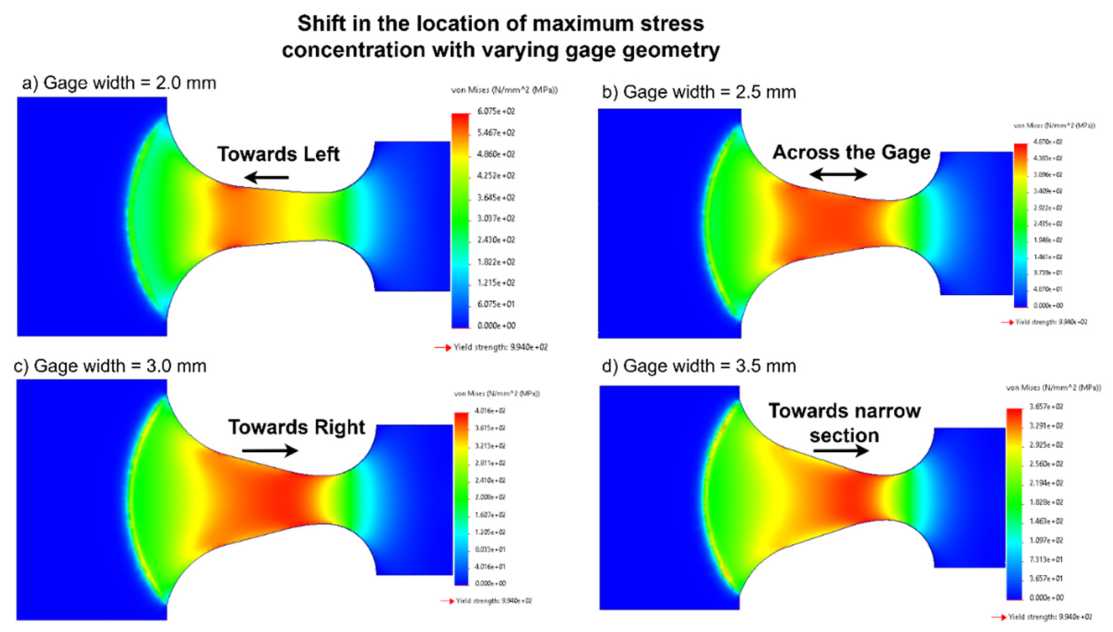
Figure 4.
Variation in Stress Gradient across the gage in Different Geometry (Based on FEA Data).
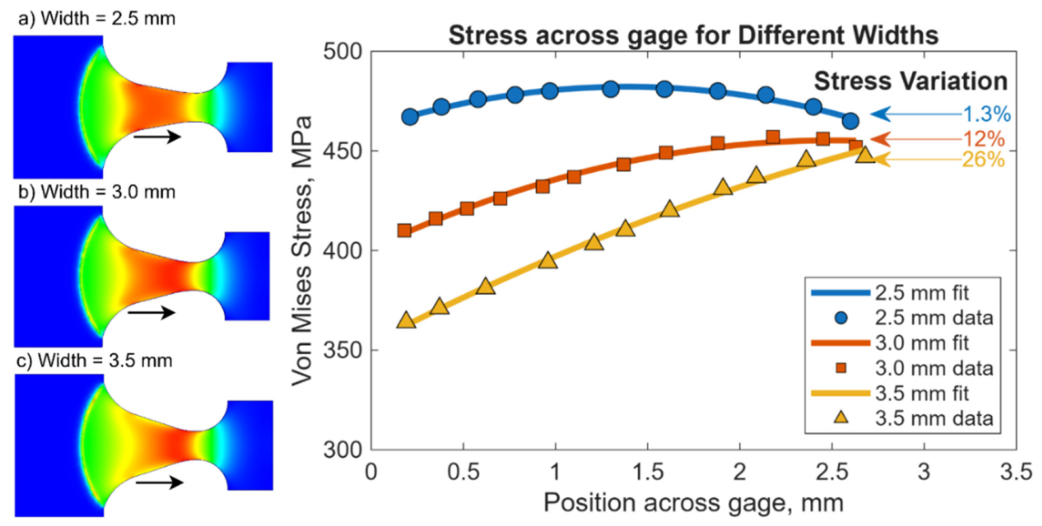
Figure 5.
Meso-Scale Optimized Specimen; a) Drawing of the optimized geometry, b) Machined Specimen.
Figure 5.
Meso-Scale Optimized Specimen; a) Drawing of the optimized geometry, b) Machined Specimen.
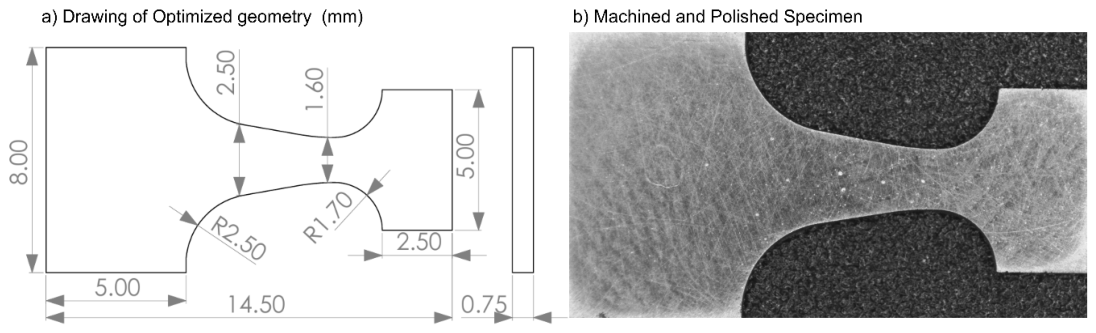
Figure 6.
Schematic of Fatigue Test Apparatus.
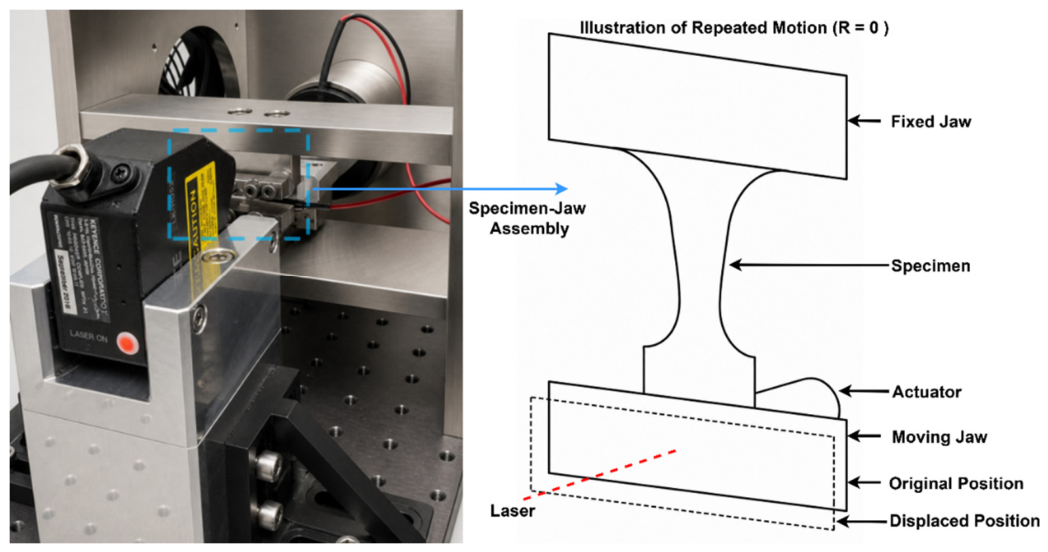
Figure 7.
Fatigue behavior of 17-4PH Optimized Specimen at different load a) 50 N; 0.226mm; b) 55 N; 0.253 mm, c) 57 N; 0.302 mm, and d) 62 N; 0.370 mm.
Figure 7.
Fatigue behavior of 17-4PH Optimized Specimen at different load a) 50 N; 0.226mm; b) 55 N; 0.253 mm, c) 57 N; 0.302 mm, and d) 62 N; 0.370 mm.
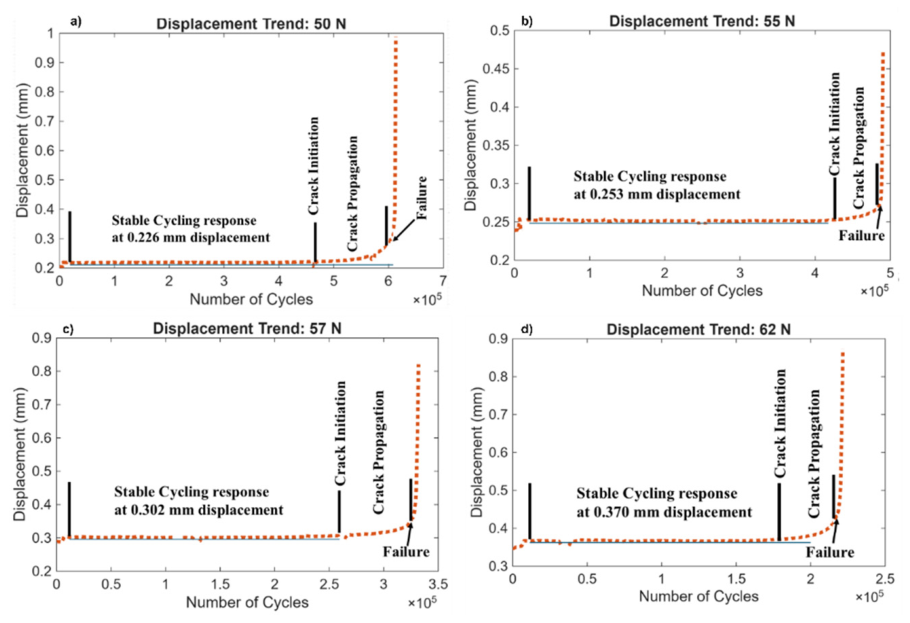
Figure 8.
Fractured 17-4 PH specimen and randomness in failure location across the gage.
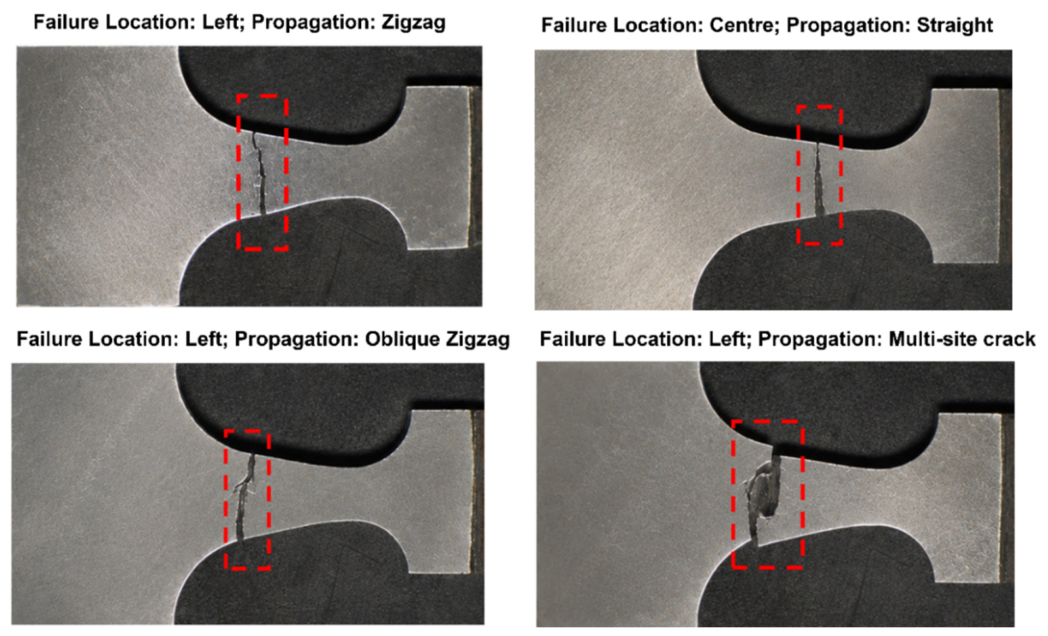
Figure 9.
Load vs Peak Displacement of 17-4PH using Optimized Geometry.
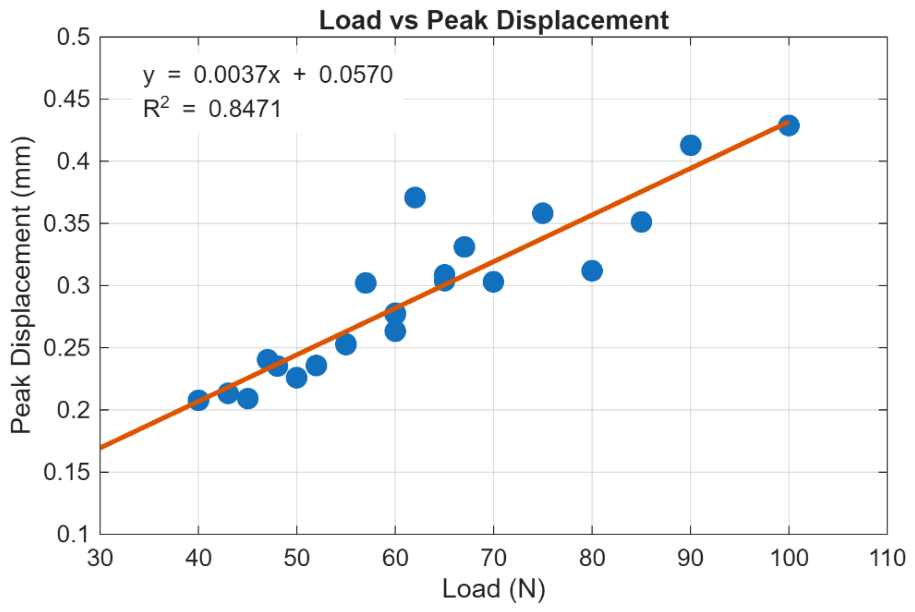
Figure 10.
Load vs Number of Cycles of 17-4PH using Optimized Geometry.
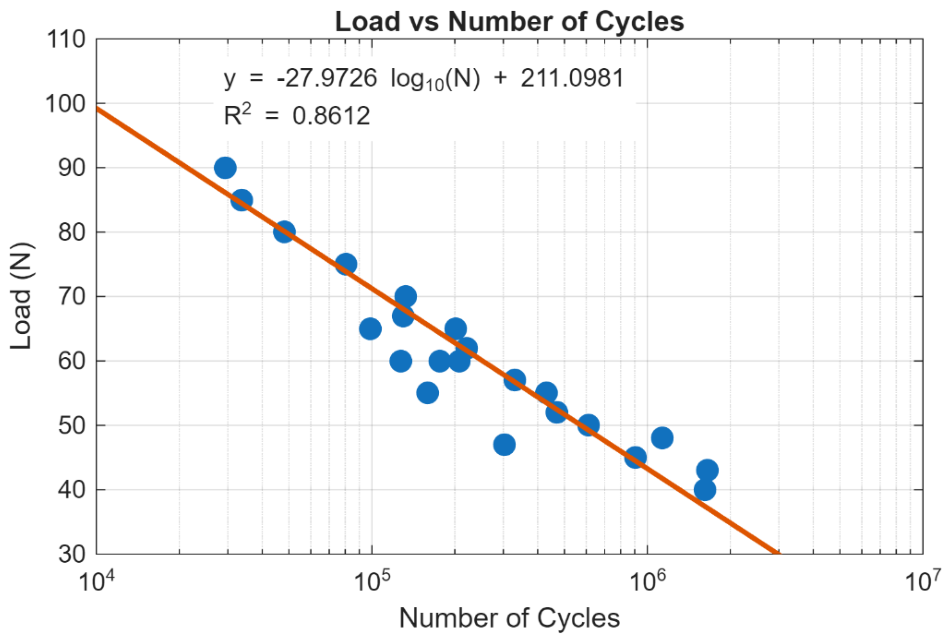
Figure 11.
S-N Curve of 17-4PH experimented on optimized geometry.
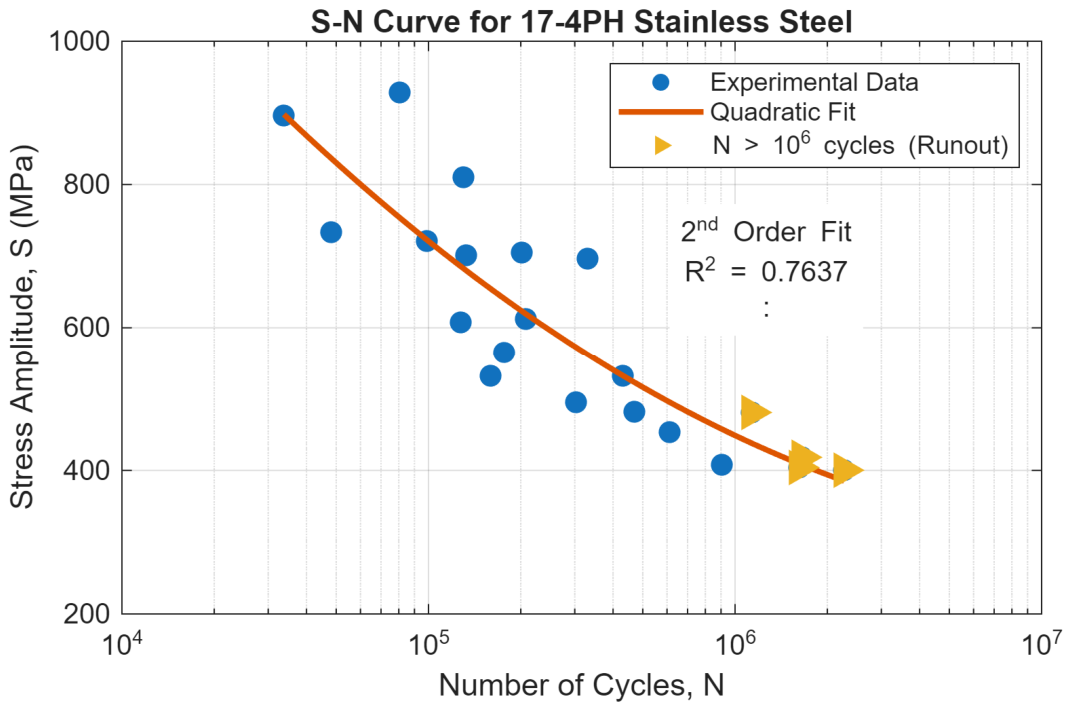
Figure 12.
S-N Curve comparison among experimental, theoretical, and Literature data.
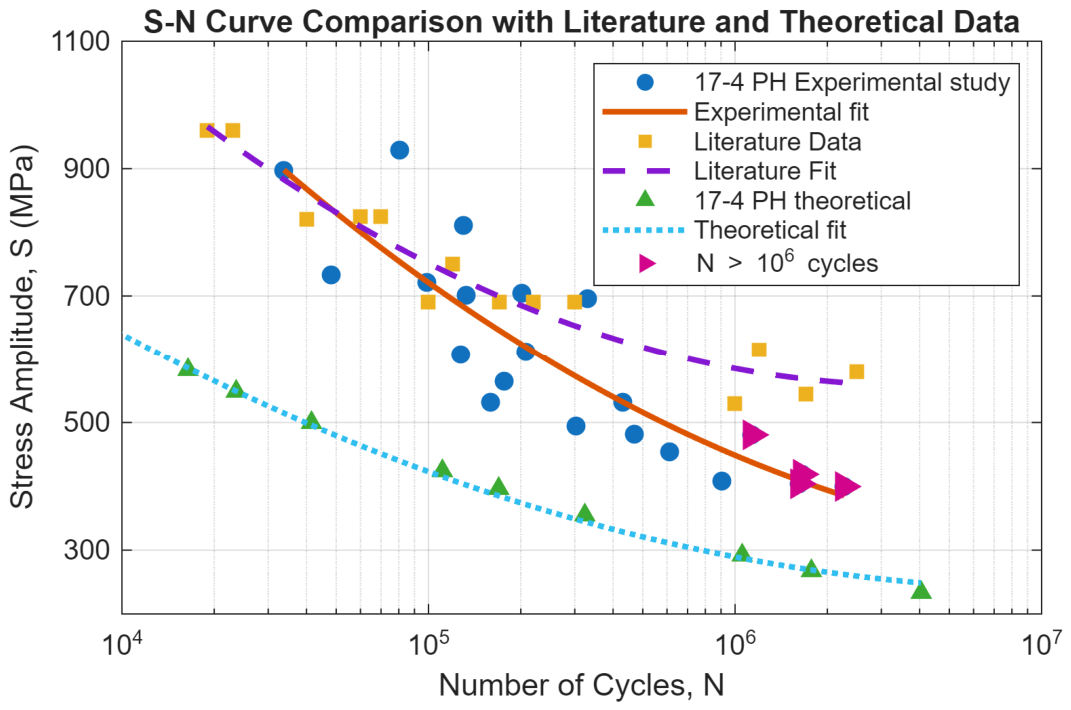

Table 1.
Chemical Composition of 17-4PH Steel.
| Element | C | Mn | P | S | CB | Si | Cu | Ni | Cr | Mo | Ta | Co |
| Wt. % | 0.04 | 0.52 | 0.022 | 0.0001 | 0.29 | 0.24 | 3.27 | 4.78 | 15.37 | 0.2 | 0.01 | 0.06 |
Table 2.
Comparison of Stress-Concentration Between Optimized Geometry and ASTM Design across Gradually Varying Cross-sections and Holes (unit=mm).
Table 2.
Comparison of Stress-Concentration Between Optimized Geometry and ASTM Design across Gradually Varying Cross-sections and Holes (unit=mm).
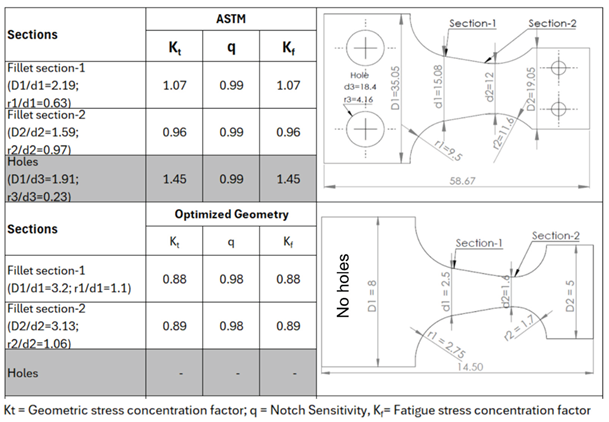 |
Table 3.
a) Mechanical Properties of 17-4PH steel from tensile test (measured), b) Endurance Strength Correction Factor (Calculated), c) Fatigue Strength Properties (Calculated).
Table 3.
a) Mechanical Properties of 17-4PH steel from tensile test (measured), b) Endurance Strength Correction Factor (Calculated), c) Fatigue Strength Properties (Calculated).
| (a)Mechanical Properties of 17-4PH Steel from Mini- Tensile Test (Measured) | |||||
| Properties | Ultimate Strength (UTS) MPa | Yield Strength (0.2% YS) MPa | Modulus of Elasticity, E, GPa | Strain at Break mm/mm | |
| Value | 1172 | 994 | 205 | 0.23 | |
| (b)Endurance Strength Correction Factors (Calculated) | |||||
| Factors | Load Factor, Cload |
Size Factor, Csize |
Surface Factor, Csurf |
Temp Factor, Ctemp |
Reliability Factor, Creliab |
| Value | 1 | 1 | 0.69 | 1 | 0.814 |
| (c)Fatigue Strength Properties (Calculated) | |||||
| Parameters | Estimated Endurance Strength, MPa | Corrected Endurance Strength, MPa | Fatigue Strength Coefficient, a, MPa | Fatigue Strength Exponent, b | |
| Value | 585 | 330.53 | 3287 | -0.1663 | |
Disclaimer/Publisher’s Note: The statements, opinions and data contained in all publications are solely those of the individual author(s) and contributor(s) and not of MDPI and/or the editor(s). MDPI and/or the editor(s) disclaim responsibility for any injury to people or property resulting from any ideas, methods, instructions or products referred to in the content. |
© 2026 by the authors. Licensee MDPI, Basel, Switzerland. This article is an open access article distributed under the terms and conditions of the Creative Commons Attribution (CC BY) license (http://creativecommons.org/licenses/by/4.0/).
Copyright: This open access article is published under a Creative Commons CC BY 4.0 license, which permit the free download, distribution, and reuse, provided that the author and preprint are cited in any reuse.


