

Submitted:
22 July 2026
Posted:
23 July 2026
You are already at the latest version
Abstract
The first paper in this series treated Blind Spot Detection (BSD) as a radar-only automotive perception function. This follow-up study asks whether a camera-based (CNN object-detector) BSD pipeline can match a radar-based one, and what sensor fusion adds, using a literature-grounded comparative simulation rather than an opinion. A radar pipeline (FMCW range-Doppler, illumination-invariant detection) and a camera pipeline (detection probability parametrized from published day/night object-detection accuracy ratios on the BDD100K benchmark) are evaluated against an identical ground-truth overtaking scenario across three illumination conditions, using a 2,000-trial Monte Carlo framework. Results show radar consistently outperforms camera on detection latency (20 ms vs. 35–54 ms) and false-alert rate (0.7–0.9% vs. 1.85–4.75%, worsening as lighting degrades), while missed-detection rate is statistically indistinguishable between sensors under ordinary overtaking dynamics — a result that only diverges under aggressive closing speeds above roughly 18–20 m/s combined with degraded illumination. Classical OR/AND sensor-fusion rules are shown to trade latency against false-alert rate rather than improving both simultaneously. A qualitative validation section runs a real pretrained detector (YOLOv8n) against public dashcam video, reproducing the same zone-occupancy alert logic on real detections and surfacing a real, brief detection dropout consistent with the simulation's stochastic detection model. All code, figures, and results are openly reproducible and archived alongside this paper.
Keywords:
blind spot detection
; sensor fusion
; radar-camera comparison
; advanced driver assistance systems
; monte carlo simulation
; object detection
; literature-grounded modeling
; YOLOv8
; FMCW radar
; Constant False Alarm Rate (CFAR)
; autonomous vehicles
; illumination robustness
; detection latency
; multi-sensor fusion
1. Motivation
The first paper in this series [1] treated Blind Spot Detection (BSD) as a radar-only function, following current production practice: 24 GHz corner radars, FMCW range-Doppler processing, and a polygon zone test. That treatment left one question open, and one that is genuinely contested in the industry right now — Tesla has removed radar entirely in favor of a vision-only sensor stack, while most other OEMs have kept radar alongside cameras. This project asks the question directly for BSD specifically: under what conditions does a camera-based (CNN object-detector) BSD pipeline match, or fail to match, a radar-based one — and what does sensor fusion actually buy you?
Camera-based approaches to blind-zone detection are not new: within the broader vehicle-detection-for-collision-avoidance literature [2], rear-mounted fisheye-camera methods have been explored for over a decade [3]. What has not, to our knowledge, been previously reported is a rigorous, literature-grounded, side-by-side comparison of radar and camera specifically for BSD, quantifying latency, false-alert rate, and missed-detection rate under a shared ground-truth scenario.
Rather than assert an answer, this project builds a literature-grounded simulation that lets the two (and a fused) pipeline compete on the same ground-truth scenario, across three illumination conditions, and reports the numbers honestly — including where the results were, initially, not what was expected.
2. What “Literature-Grounded” Means Here, Precisely
No camera hardware, dataset, or trained CNN was run as part of this project — that would require a GPU, a labeled driving dataset, and hardware-in-the-loop testing well outside the scope of a simulation study. Instead, the camera detection-probability model is parametrized using published, peer-reviewed detection-accuracy figures from public autonomous-driving benchmark datasets, primarily BDD100K [4]. Figure 1 makes this explicit: it plots the actual reported daytime-vs-degraded-illumination detection accuracy (AP / AP50) from independent published results [4,5,6], rather than an invented curve.

Table 1.
Published detection-accuracy studies used to derive the illumination-scaling factors.
| Study | Favorable (%) | Degraded (%) | Ratio |
|---|---|---|---|
| BDD100K overall, Daytime vs. Non-daytime AP [4] | 30.6 | 23.6 | 0.771 |
| Faster R-CNN, BDD100K Day→Night AP50, no adaptation [5] | 53.95 | 35.66 | 0.661 |
| Faster R-CNN, BDD100K cross-domain AP50 (illustrative additional data point) [6] | 53.95 | 31.92 | 0.592 |
The simulation uses the two more conservative/representative ratios as its two degraded-condition scale factors: 0.771 for “Low-light/Dusk” and 0.667 (the mean of the two Faster R-CNN results) for “Night/Fog.” Radar, by contrast, is modeled as illumination-invariant — a physically justified assumption, since FMCW radar detection depends on radar cross-section and SNR, not visible light, and this was already established in the first paper's BSD treatment [1,7].
3. System Models
3.1. Radar Pipeline (Recap from Paper 1)
Detection probability P_d ≈ 0.985, effectively range- and illumination-invariant within the operational envelope (3–70 m), consistent with FMCW automotive radar characteristics reported in [7]. Latency modeled at 15 ms mean (FMCW chirp-cycle scale). False-alert rate governed by the CFAR detection threshold, following classical CFAR detection theory [8,9] and consistent with automotive-specific CFAR implementations [10], modeled as a small, condition-invariant per-sample rate.
3.2. Camera Pipeline (New)
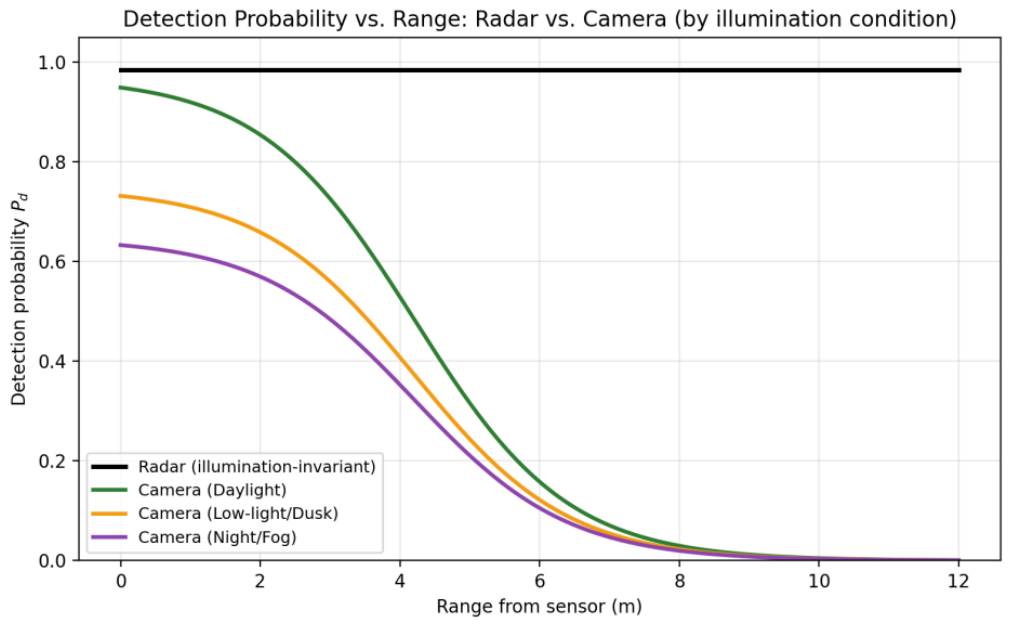
Detection probability is modeled as a function of range (a logistic falloff reflecting decreasing pixel density on the target at longer range) multiplied by the illumination scale factor from Section 2:

Camera latency is modeled at 35 ms mean, consistent with typical embedded-GPU YOLO-class [11] inference time [12] — roughly 2× the radar's chirp-cycle latency. False-alert rate is modeled as increasing under degraded lighting (1.8× at low-light/dusk, 2.6× at night/fog relative to the daylight baseline), reflecting the qualitative but consistently reported finding across the low-light detection literature [4,5,6,13] that missed detections and spurious detections both increase as image quality degrades (blurred contours, headlight glare, reduced contrast), consistent with related camera-only BSD approaches reported elsewhere [14].
Figure 2.
Detection probability vs. range: radar (flat, illumination-invariant) vs. camera under three illumination conditions.
Figure 2.
Detection probability vs. range: radar (flat, illumination-invariant) vs. camera under three illumination conditions.
3.3. Shared Ground-Truth Scenario
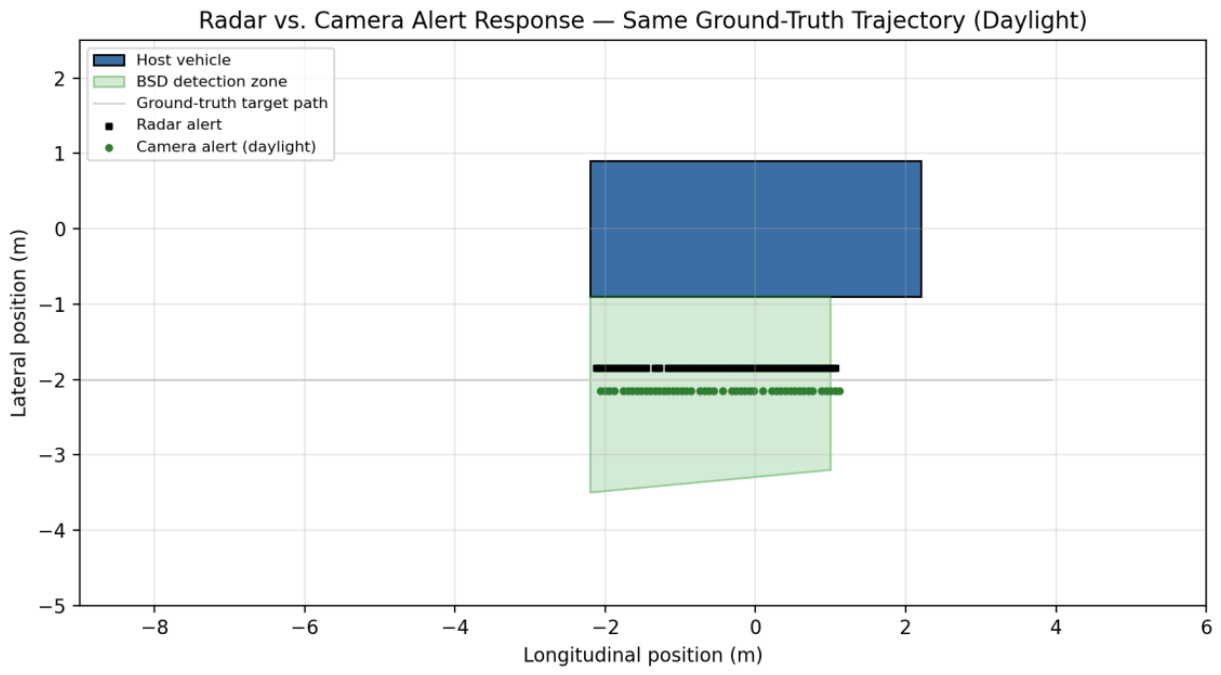
Both pipelines are evaluated against the identical ground-truth scenario used in Paper 1 [1]: a vehicle overtaking in the adjacent lane, crossing the same trapezoidal BSD zone polygon, at the same relative speed. This is essential to a fair comparison — both sensors see exactly the same physical event, and only their respective detection models differ.
Figure 3.
Ground-truth overtaking trajectory with radar and camera alert markers overlaid (daylight condition shown).
Figure 3.
Ground-truth overtaking trajectory with radar and camera alert markers overlaid (daylight condition shown).
BSD as a feature spans a broader space of operating scenarios than any single simulation can practically cover. Table 2 lists the scenario dimensions that define BSD's full operational envelope and states plainly which of them this paper actually tested, to make the scope of the reported results explicit rather than implicit.
Scenario 1 was selected as the canonical case because it is the most common and most safety-critical real-world BSD trigger — a vehicle overtaking from the rear in an adjacent lane — and it is the scenario for which radar-based BSD systems are conventionally specified and validated [7,17]. Scenarios 10 (rear cross-traffic) is explicitly a different ADAS function (Rear Cross-Traffic Alert) with distinct geometry and is not a gap in this paper's BSD treatment; the remaining untested rows [2,4,5,7,8,9,11,12,13] are genuine scope limitations, revisited in Section 8.
3.4. Test Setup and Monte Carlo Configuration
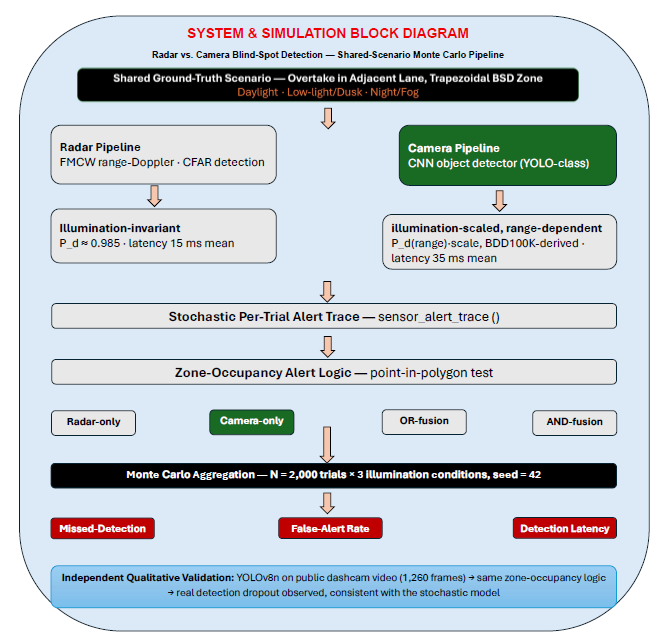
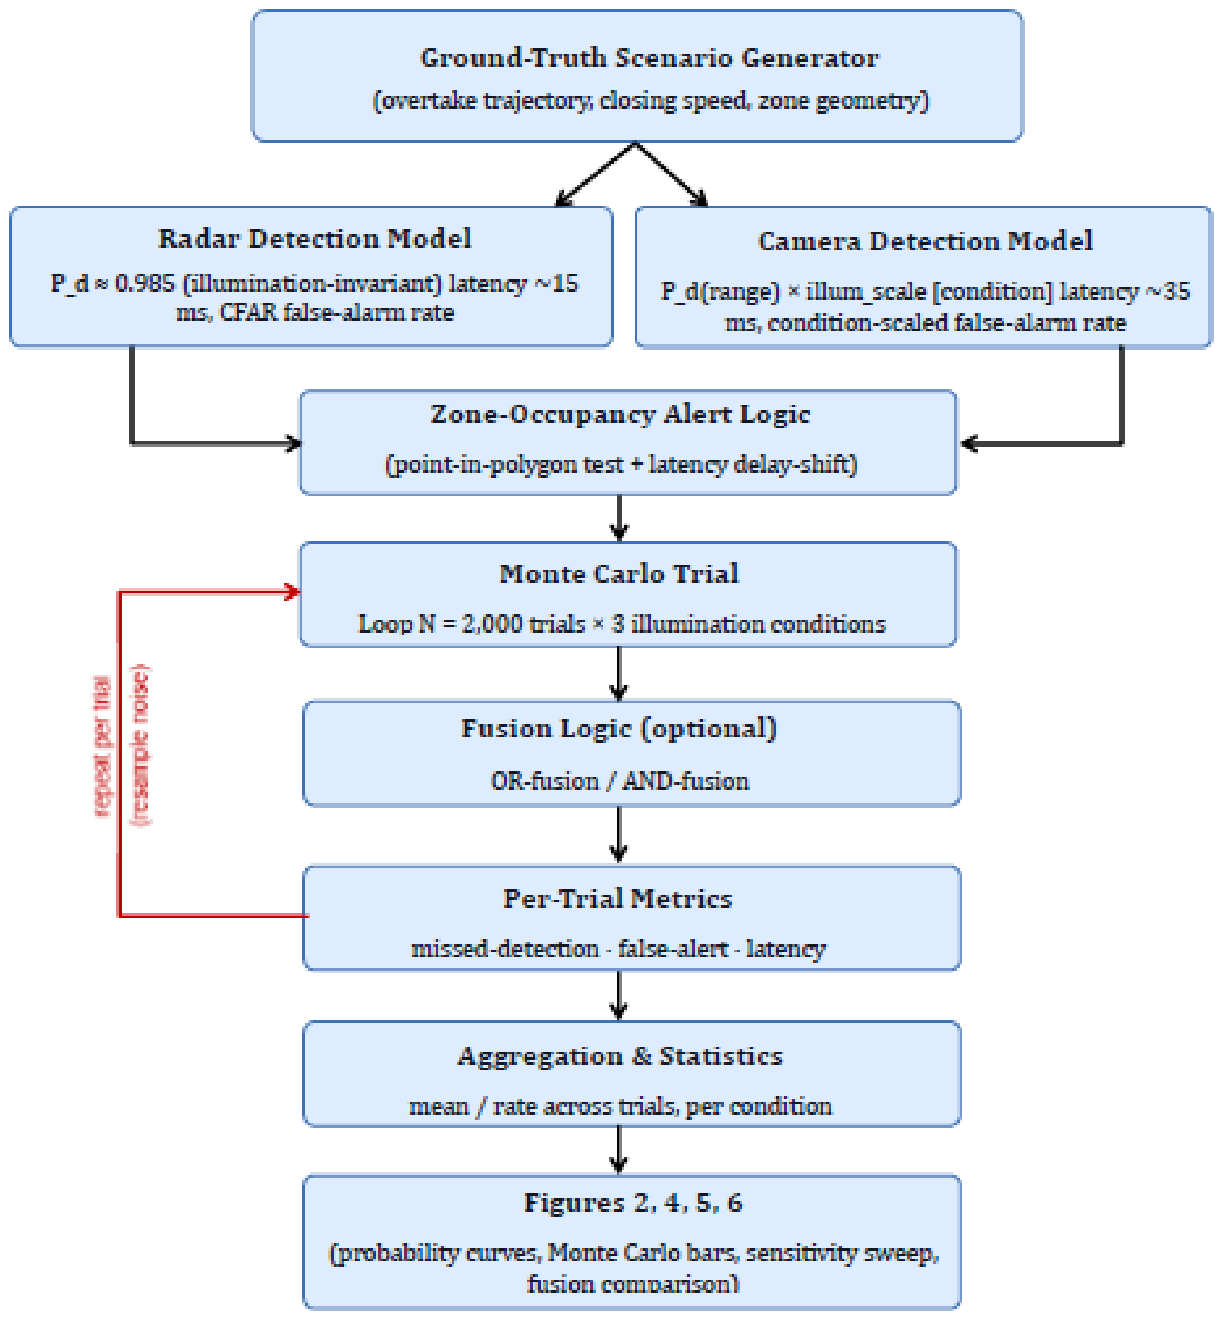
Figure 3b summarizes the full test pipeline used to produce every quantitative result in Section 5: the shared ground-truth scenario feeds both the radar and camera detection models independently; each model's stochastic output passes through the same zone-occupancy alert logic (Section 3.3); results are optionally combined through OR/AND fusion logic (Section 5.3); and per-trial outcomes (missed detection, false alert, latency) are aggregated across the Monte Carlo trial loop into the summary statistics reported throughout this paper.
Figure 3b.
Test setup / simulation pipeline flowchart: from ground-truth scenario generation through Monte Carlo aggregation to reported figures.
Figure 3b.
Test setup / simulation pipeline flowchart: from ground-truth scenario generation through Monte Carlo aggregation to reported figures.
Each condition (Daylight, Low-light/Dusk, Night/Fog) is evaluated over N = 2,000 independent trials, resampling detection and false-alarm noise on every trial using NumPy's default_rng with a fixed seed (42) for reproducibility. No trial-to-trial state is carried over — each trial independently redraws whether the target is detected at each sample and whether a false alarm occurs, using the per-condition probability and latency parameters from Section 3.1 and Section 3.2. The dwell-time sensitivity sweep (Section 5.2) reruns this same trial structure at 12 closing speeds from 2–45 m/s, using 4,000 trials per speed for tighter statistics on the rarer missed-detection events at high speed. All simulations were executed in Python 3 using only NumPy, Matplotlib, and SciPy — no GPU or specialized hardware is required, and each full experiment (all conditions, all speeds) completes in well under a minute on a standard CPU.
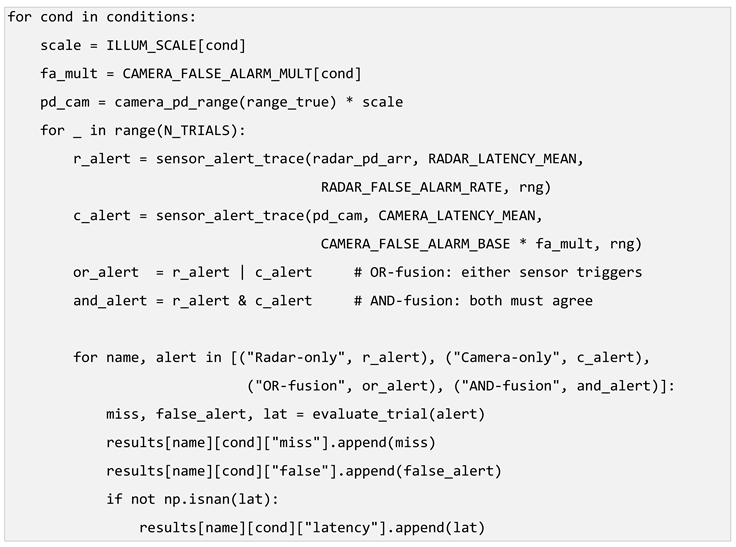
The Monte Carlo trial loop and the OR/AND fusion combination logic, omitted from Section 4 for brevity, are:
4. Reference Implementation
The core stochastic-trial function shared by both pipelines:
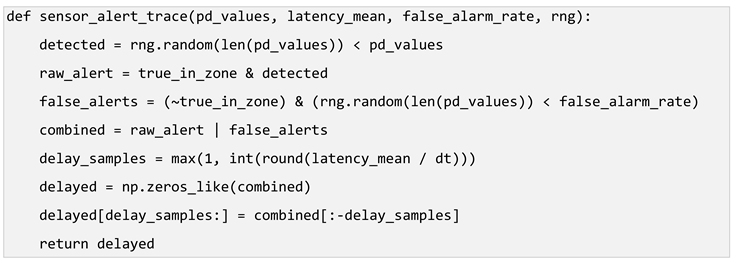
Each condition is evaluated over 2,000 Monte Carlo trials, resampling detection and false-alarm noise each trial, to obtain stable estimates of missed-detection rate, false-alert rate, and mean detection latency.
5. Results
5.1. Radar vs. Camera, Standard Overtake Scenario
Figure 4.
Missed-detection rate, false-alert rate, and detection latency: radar vs. camera, across three illumination conditions (2,000 Monte Carlo trials each).
Figure 4.
Missed-detection rate, false-alert rate, and detection latency: radar vs. camera, across three illumination conditions (2,000 Monte Carlo trials each).
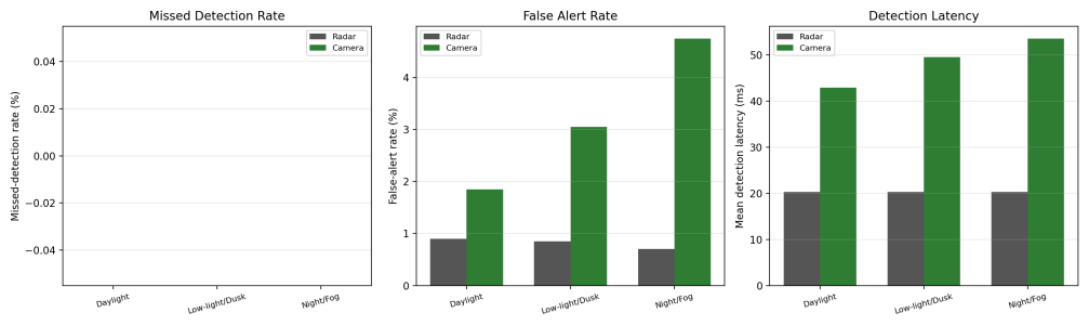
Table 3.
Radar vs. camera Monte Carlo comparison across illumination conditions.
| Condition | Sensor | False-alert rate | Mean latency |
|---|---|---|---|
| Daylight | Radar | 0.90% | 20.3 ms |
| Daylight | Camera | 1.85% | 42.9 ms |
| Low-light/Dusk | Radar | 0.85% | 20.3 ms |
| Low-light/Dusk | Camera | 3.05% | 49.5 ms |
| Night/Fog | Radar | 0.70% | 20.3 ms |
| Night/Fog | Camera | 4.75% | 53.6 ms |
Missed-detection rate is 0% for both sensors in every condition at the baseline relative speed (3 m/s). This was, honestly, not the expected headline result — the initial hypothesis was that camera would show materially worse missed-detection under night/fog. It doesn't, because the target dwells in the zone for over a second (roughly 50+ samples at the simulation's 50 Hz rate), and even a degraded per-frame detection probability compounds to near-certain detection given enough independent frames of exposure. The real, consistent camera weaknesses are latency (2–2.6× radar's) and false-alert rate (2–6.8× radar's, worsening specifically as lighting degrades).
5.2. When Does Missed Detection Actually Become a Camera Weakness?
Since dwell time is what saves the camera pipeline from missed detections, the natural follow-up question is: at what closing speed does that stop being true? Figure 5 sweeps closing speed from 2 to 45 m/s.
This is a more precise and more useful finding than a blanket “camera misses more targets” claim: camera-based BSD's missed-detection risk is specifically a fast-cut-in-at-night problem (closing speeds above roughly 18–20 m/s, characteristic of an aggressive unsignaled lane change at highway speed differentials), not a general weakness under ordinary overtaking dynamics.
5.3. Sensor Fusion: Radar + Camera
Given that radar and camera have complementary weaknesses (camera: latency and false-alerts; radar: none of the above but is a single point of failure), two classical fusion rules were evaluated: OR-fusion (alert if either sensor detects) and AND-fusion (alert only if both agree). Radar-camera fusion for BSD specifically has been explored using data-association techniques such as global nearest neighbor and joint probabilistic data association [15], and radar-camera fusion more broadly is an active area for joint object detection and distance estimation [16]; the OR/AND rules evaluated here are the two simplest, most interpretable members of that broader family.
Figure 6.
Radar-only vs. camera-only vs. OR-fusion vs. AND-fusion: missed detection, false alerts, and latency.
Figure 6.
Radar-only vs. camera-only vs. OR-fusion vs. AND-fusion: missed detection, false alerts, and latency.
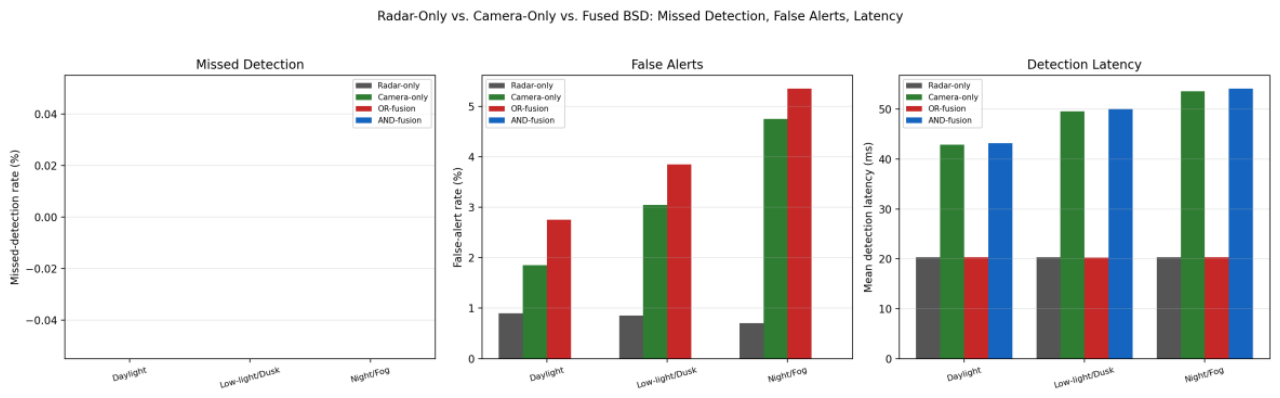
Table 4.
Fusion pipeline comparison (missed detection, false alerts, latency) at the Night/Fog condition.
Table 4.
Fusion pipeline comparison (missed detection, false alerts, latency) at the Night/Fog condition.
| Pipeline | Night/Fog false-alert rate | Night/Fog latency |
|---|---|---|
| Radar-only | 0.70% | 20.3 ms |
| Camera-only | 4.75% | 53.6 ms |
| OR-fusion | 5.35% | 20.3 ms |
| AND-fusion | 0.00% | 54.1 ms |
The fusion results are exactly what classical detection theory predicts, which is itself a useful sanity check on the simulation: OR-fusion inherits the faster sensor's latency (radar's 20.3 ms) but the combined false-alert rate is worse than either sensor alone, since either one triggering is sufficient. AND-fusion drives the false-alert rate to essentially zero (both sensors would need to independently false-alarm in the same narrow window) but inherits the slower sensor's latency (camera's ~54 ms). Neither fusion rule dominates on all three metrics simultaneously — the choice between them is itself a calibration decision, the same way the FCW TTC threshold was in Paper 1 [1].
6. Qualitative Validation with a Real Detector on Public Video
Section 2, Section 3, Section 4 and Section 5 parametrize the camera model from published accuracy statistics; no trained detector was run against real imagery. This section closes part of that gap: a real, pretrained object detector (YOLOv8n, COCO-pretrained, via the open-source ultralytics package) was run frame-by-frame against a public, MIT-licensed driving video, and the same zone-occupancy alert logic used throughout this project (a point-in-polygon test) was applied directly to its output.
6.1. Source Video and Framing Caveats
The video used is project_video.mp4 from the udacity/CarND-Vehicle-Detection repository (MIT License), a 50.4 s, 1280×720, 25 fps forward-facing highway dashcam recording, 1,260 frames total. Two important framing caveats distinguish this section from the Monte Carlo results above:
– This is a forward-facing dashcam view, not a rear/side BSD-mounted camera. The “zone” evaluated here is therefore an illustrative pixel-space region of the frame (the right-hand near-field, calibrated to where adjacent-lane traffic actually appeared in this clip), not the metrically calibrated 3.5 m ground-plane polygon used in the simulation.
– This is a single clip, one lighting condition (daylight), and a small number of real transition events — a qualitative demonstration that the zone-occupancy logic works correctly against real detector output, not a statistically powered replacement for the 2,000-trial Monte Carlo results in Section 5.
6.2. Detection Pipeline
Every frame was run through YOLOv8n [12] at a confidence threshold of 0.35, filtering to vehicle classes (car, motorcycle, bus, truck). For each detected box, the bottom-center point (a ground-contact proxy) was tested against the illustrative zone polygon using the same point-in-polygon approach as the simulation's bsd_sim.py:

6.3. Results: A Real Entry, a Real Dropout, and an Extended Dwell
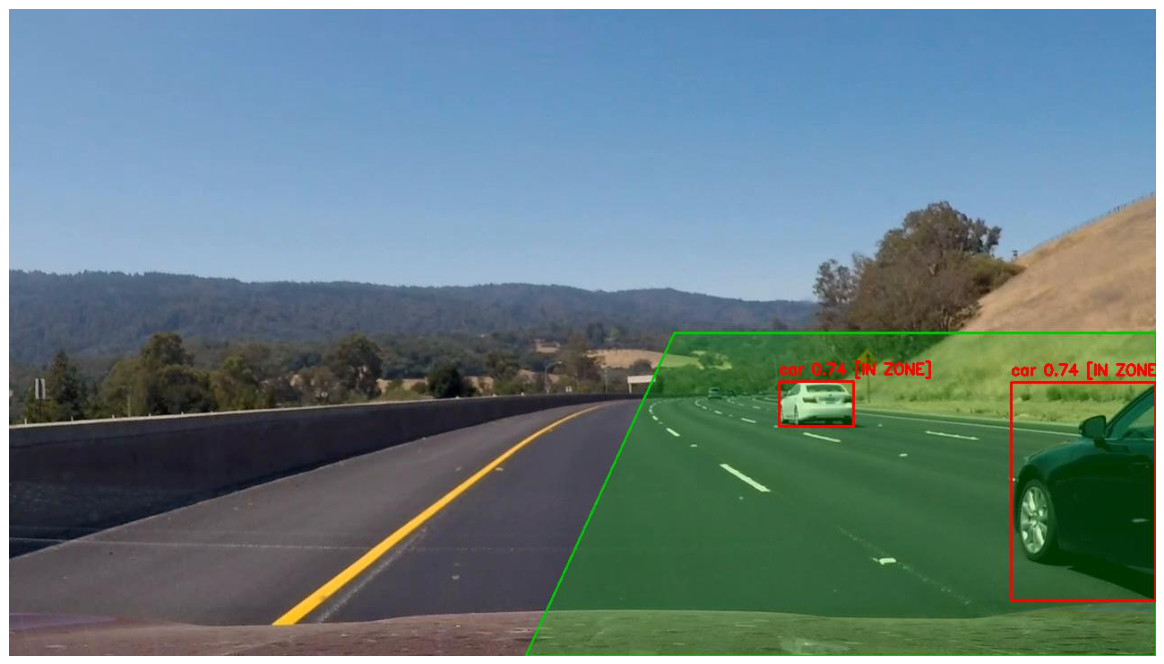
Across all 1,260 frames, the zone was occupied in 1,137 (90.2%). Two entry events and one brief exit were detected: an initial entry at frame 116 (t = 4.64 s), a 4-frame dropout (t = 4.80–4.96 s, roughly 0.16 s), then continuous re-entry from frame 127 onward (t = 5.08 s) through the end of the clip. Figure 7 shows the full occupancy timeline; Figure 8 shows four representative annotated frames.
The brief dropout is, honestly, the most useful single data point in this section: it is a real, observed instance of exactly the phenomenon the simulation's stochastic per-frame detection-probability model (Section 3.2) was built to represent — a real detector occasionally failing to confidently re-detect a target it had just detected, for a handful of frames, before recovering. It is a small-sample anecdote, not a replacement for the literature-derived P_d curves, but it is a directionally consistent one: real per-frame detection is not perfectly binary, and brief gaps do occur even in good daylight conditions for a well-lit, close-range target.
Figure 8.
Initial zone entry (frame 116, t = 4.64 s). Blue box = in-zone detection; orange = detected but outside the illustrative zone; green overlay = the pixel-space zone.
Figure 8.
Initial zone entry (frame 116, t = 4.64 s). Blue box = in-zone detection; orange = detected but outside the illustrative zone; green overlay = the pixel-space zone.
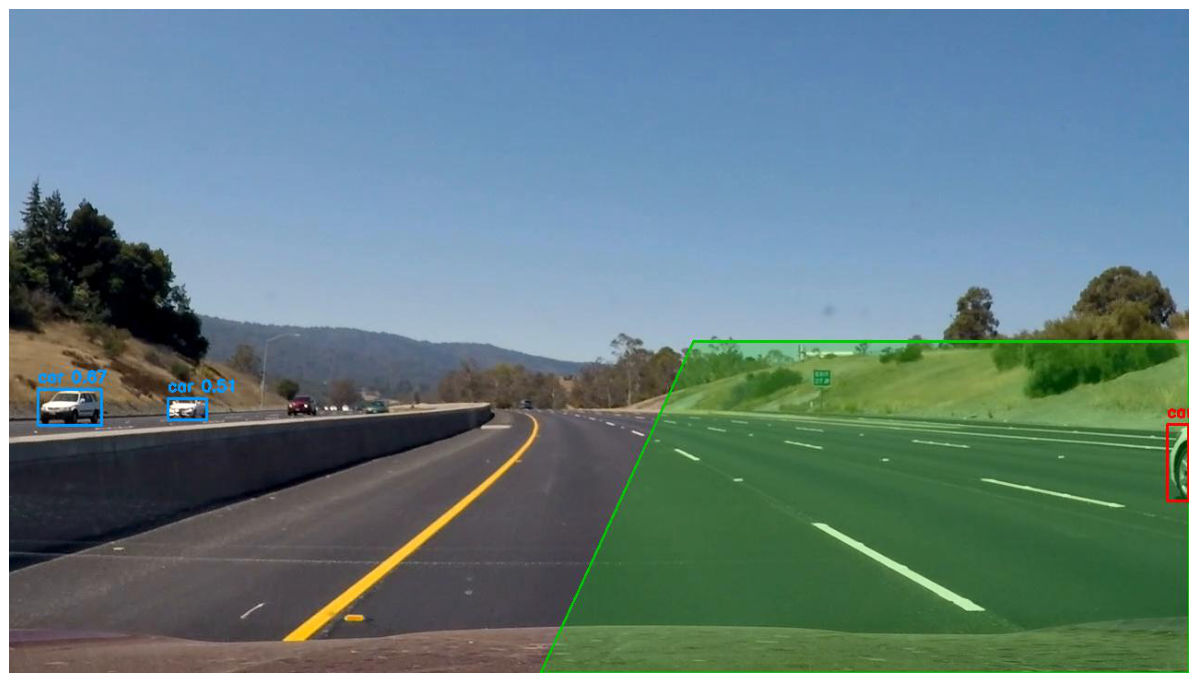
Figure 8b.
The brief detection dropout (frame 120, t = 4.80 s) — the same physical vehicle, momentarily not confidently detected by YOLOv8n at the 0.35 threshold.
Figure 8b.
The brief detection dropout (frame 120, t = 4.80 s) — the same physical vehicle, momentarily not confidently detected by YOLOv8n at the 0.35 threshold.
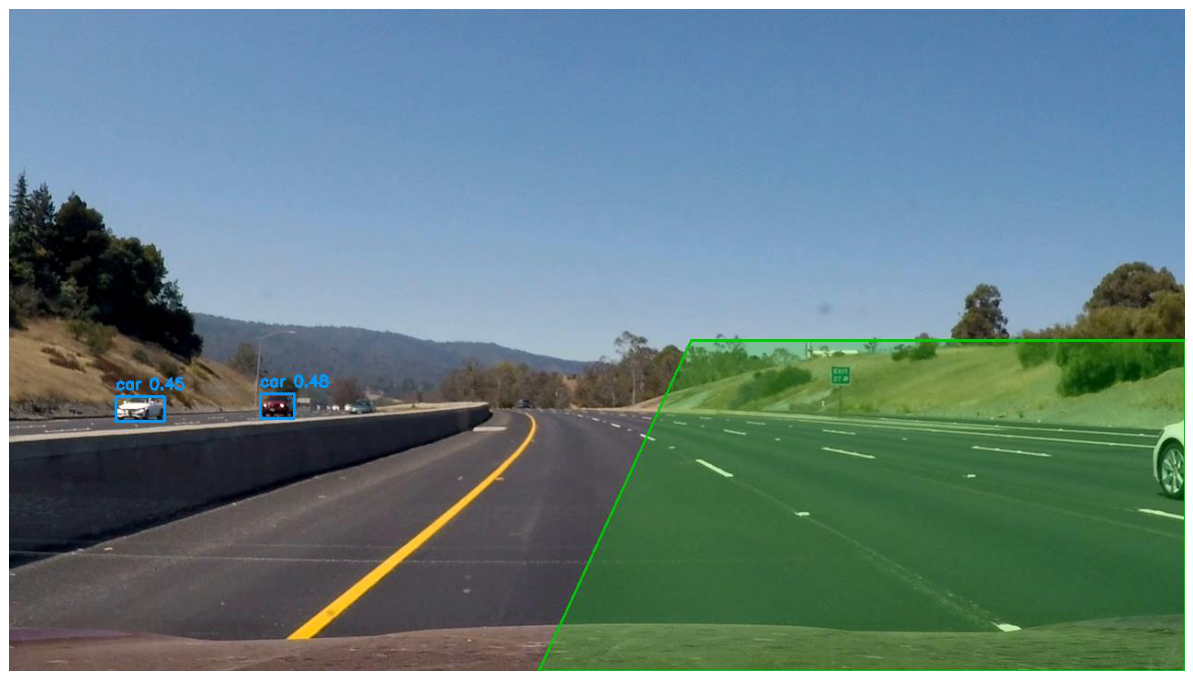
Figure 8c.
Mid-point of the extended continuous-occupancy period that follows re-entry, illustrating sustained real-world detection stability.
Figure 8c.
Mid-point of the extended continuous-occupancy period that follows re-entry, illustrating sustained real-world detection stability.
7. Summary of Findings
– Radar outperforms camera on latency and false-alert rate in every tested condition, with the gap widening as lighting degrades — consistent with the physical basis for radar's illumination invariance.
– Missed detection is not a meaningful camera weakness under ordinary overtaking dynamics (closing speed below ~18 m/s), regardless of illumination — dwell time compensates for degraded per-frame detection probability.
– Missed detection becomes a real, quantifiable camera weakness specifically under fast cut-ins (>18–20 m/s closing speed) combined with degraded illumination — a narrower and more actionable finding than a blanket comparison would produce.
– Simple OR/AND sensor fusion cannot simultaneously improve all three metrics; the choice of fusion rule is itself a safety-margin-vs-nuisance-alert calibration decision, mirroring the pattern established across every function in Paper 1.
– All illumination-degradation parameters are traceable to specific, cited public benchmark results (Figure 1) rather than invented curves — the central methodological commitment of this project.
– A real detector run against a real public video reproduces the qualitative phenomenon (brief, non-binary detection dropouts) that the simulation's stochastic model was designed to represent, on a small-sample but directionally consistent basis (Section 6).
8. Limitations and Next Steps
The Section 2, Section 3, Section 4 and Section 5 results remain a parametrized simulation, not a full hardware validation: the camera detection-probability model is calibrated from published dataset-level accuracy statistics, not from running a trained detector against real BSD-relevant (side/rear-mounted) imagery specifically. Section 6 narrows, but does not close, this gap — it uses a real detector and real video, but a forward-facing clip, a single lighting condition, and one clip's worth of transition events. The false-alert-rate escalation factors (1.8×, 2.6× in Section 3.2) remain illustrative and qualitatively motivated rather than drawn from a single precise published number, since no study was found reporting false-positive rate specifically as a function of illumination condition for a BSD-equivalent camera task. Performance expectations throughout this paper are also qualitative relative to formal BSD field-performance evaluations conducted by regulators, such as the NHTSA light-vehicle blind-spot-monitoring performance study [17].
Table 2 (Section 3.3) makes this scope explicit at the level of individual scenarios: of the thirteen BSD operating scenarios identified, this paper directly tested three (rear-approaching overtake, fast cut-in, and illumination variation), treated one as explicitly out of scope (rear cross-traffic, a distinct ADAS function), and leaves the remaining nine as concrete, itemized targets for future work rather than an unstated gap.
The natural next steps, in order of increasing effort: (i) repeat the Section 6 analysis on a low-light/night clip to obtain a real (not simulated) illumination-degradation data point; (ii) source or capture footage from an actual side/rear-mounted vantage point to remove the forward-facing framing caveat; (iii) extend the fusion analysis to a confidence-weighted or sequential-validation strategy rather than only OR/AND [15,16]; (iv) validate the radar false-alert-rate assumption against a real CFAR implementation rather than an assumed constant; (v) extend the camera-based BSD direction flagged as future work in Paper 1 [1,13] with a trained detector specifically fine-tuned for BSD-relevant vantage points.
All code, figures, and the consolidated results table referenced in this article are included in the accompanying dataset package and are fully reproducible with NumPy, Matplotlib, and SciPy.
Supplementary Materials
The following supporting information can be downloaded at the website of this paper posted on Preprints.org.
References
- Waghmare, A.A.; Ahmed, N.H.; Ganesan, S. Sensing-to-Actuation Architectures for Advanced Driver Assistance Systems: Modeling, Control, and Performance Evaluation of Lane Keeping, Forward Collision Warning, Blind Spot Detection, and Automated Parking Assist. 2025. [Google Scholar] [CrossRef] [PubMed]
- Mukhtar, L.X.; Tang, T.B. Vehicle detection techniques for collision avoidance systems: A review. IEEE Trans. Intell. Transp. Syst. 2015, 16, 2318–2338. [Google Scholar] [CrossRef]
- Dooley, D.; McGinley, B.; Hughes, C.; Kilmartin, L.; Jones, E.; Glavin, M. A blind-zone detection method using a rear-mounted fisheye camera with combination of vehicle detection methods. IEEE Trans. Intell. Transp. Syst. 2016, 17, 264–278. [Google Scholar] [CrossRef]
- Yu, F.; Chen, H.; Wang, X.; Xian, W.; Chen, Y.; Liu, F.; Madhavan, V.; Darrell, T. BDD100K: A diverse driving dataset for heterogeneous multitask learning. In Proceedings of the Proc. IEEE/CVF Conference on Computer Vision and Pattern Recognition (CVPR), 2020; pp. 2636–2645. [Google Scholar]
- Dutta, U.K. Seeing BDD100K in dark: Single-stage night-time object detection via continual Fourier contrastive learning. arXiv 2021, arXiv:2112.02891. [Google Scholar]
- Wang, X.; Huang, T.E.; Liu, B.; Yu, F.; Wang, X.; Gonzalez, J.E.; Darrell, T. Robust object detection via instance-level temporal cycle confusion. arXiv 2021, arXiv:2104.08381. [Google Scholar]
- Kim, W.; Yang, H.; Kim, J. Blind spot detection radar system design for safe driving of smart vehicles. Appl. Sci. 2023, 13, 6147. [Google Scholar] [CrossRef]
- Skolnik, M.I. Introduction to Radar Systems, 3rd ed.; McGraw-Hill: New York, NY, USA, 2001. [Google Scholar]
- Richards, M.A. Fundamentals of Radar Signal Processing, 2nd ed.; McGraw-Hill: New York, NY, USA, 2014. [Google Scholar]
- Wang, J. CFAR-based interference mitigation for FMCW automotive radar systems. arXiv 2021, arXiv:2101.01257. [Google Scholar]
- Redmon, J.; Divvala, S.; Girshick, R.; Farhadi, A. You only look once: Unified, real-time object detection. In Proceedings of the Proc. IEEE Conference on Computer Vision and Pattern Recognition (CVPR), 2016; pp. 779–788. [Google Scholar]
- Jocher, G.; Chaurasia, A.; Qiu, J. YOLO by Ultralytics," version 8.0.0. 2023. Available online: https://github.com/ultralytics/ultralytics.
- Muzammel, M.; Yusoff, M.Z.; Mohamad Saad, M.N.; Sheikh, F.; Awais, M.A. Blind-spot collision detection system for commercial vehicles using multi deep CNN architecture. Sensors 2022, 22, 6088. [Google Scholar] [CrossRef] [PubMed]
- Zhao, Y.; Bai, L.; Lyu, Y.; Huang, X. Camera-based blind spot detection with a general purpose lightweight neural network. Electronics 2019, 8, 233. [Google Scholar] [CrossRef]
- Shirahmad Gale Bagi, S.; Moshiri, B.; Gharaee Garakani, H.; Khoshnevisan, M. Blind spot detection system in vehicles using fusion of radar detections and camera verification. Int. J. Intell. Transp. Syst. Res. 2021, 19, 389–404. [Google Scholar] [CrossRef]
- Nabati, R.; Qi, H. Radar-camera sensor fusion for joint object detection and distance estimation in autonomous vehicles. arXiv 2020, arXiv:2009.08428. [Google Scholar]
- Forkenbrock, G.; Hoover, R.L.; Gerdus, E.; Van Buskirk, T.R.; Heitz, M. Washington, DC, 2014.
Figure 1.
Published object-detection accuracy (AP/AP50) under favorable vs. degraded illumination, from independent public-benchmark studies [4,5,6]. The ratios shown are the basis for the illumination-scaling factors used in the simulation.
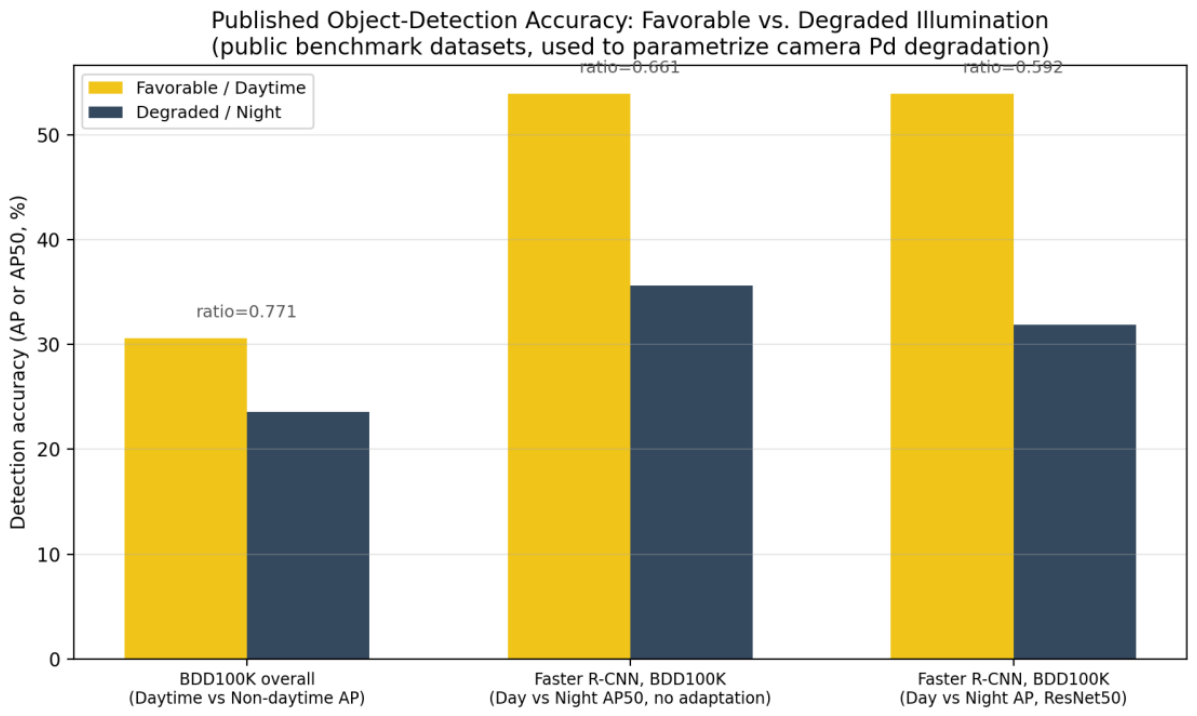
Figure 5.
Missed-detection rate vs. closing speed through the BSD zone. Radar and daylight-camera stay near 0% throughout; night/fog-camera only becomes materially worse than radar above ~18–20 m/s closing speed.
Figure 5.
Missed-detection rate vs. closing speed through the BSD zone. Radar and daylight-camera stay near 0% throughout; night/fog-camera only becomes materially worse than radar above ~18–20 m/s closing speed.
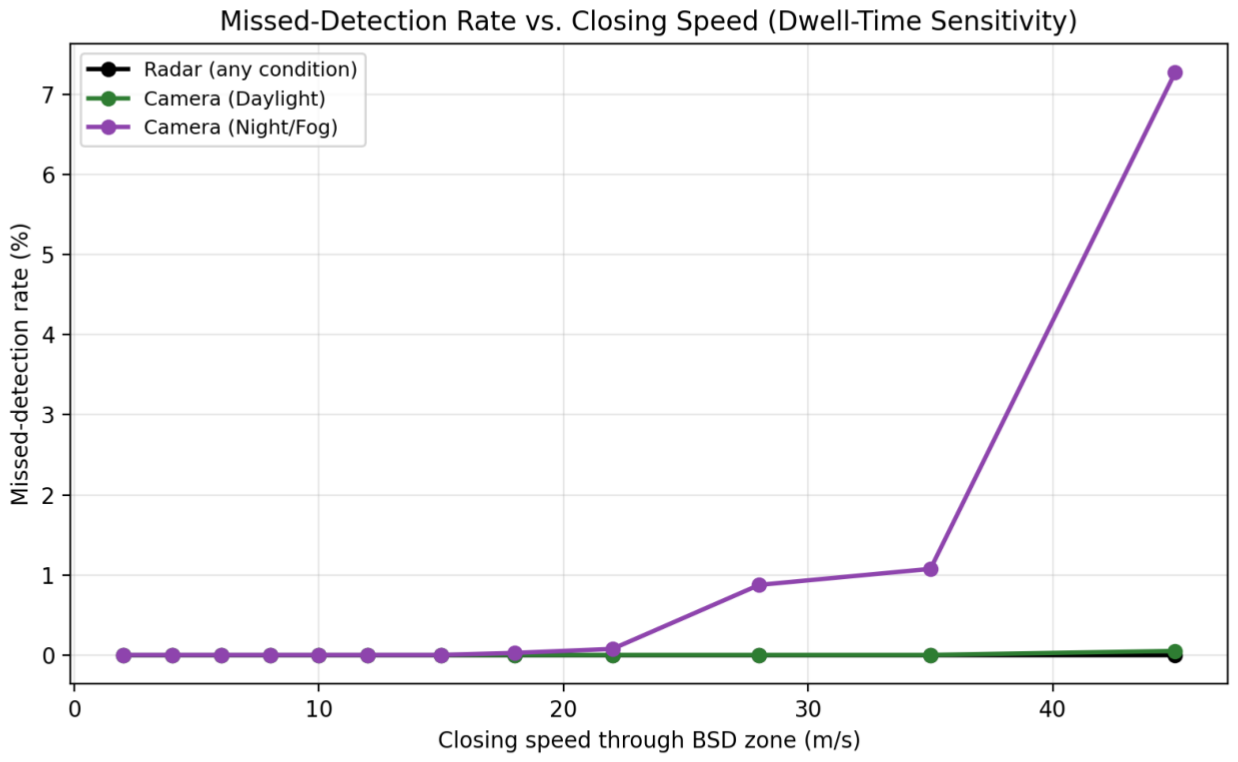
Figure 7.
Real zone-occupancy alert timeline from YOLOv8n detections across all 1,260 frames of the public test video.
Figure 7.
Real zone-occupancy alert timeline from YOLOv8n detections across all 1,260 frames of the public test video.
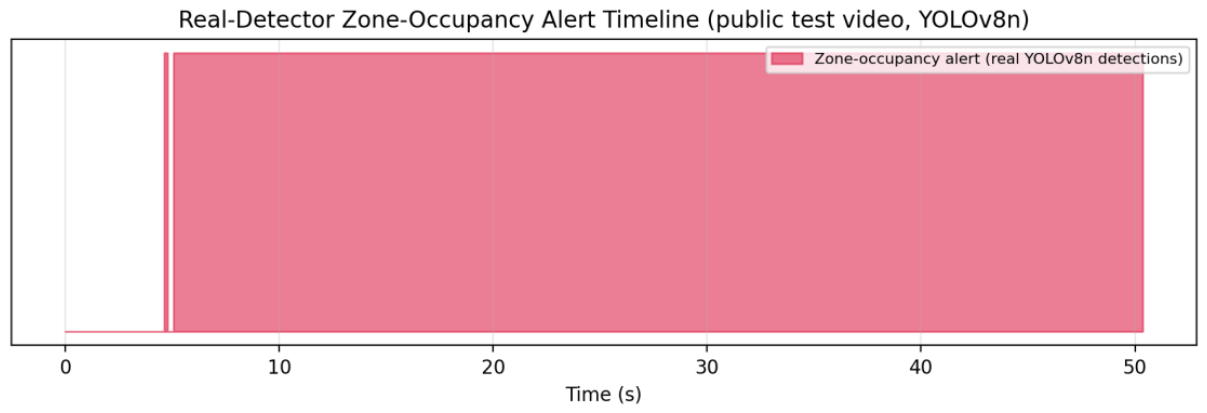
Table 2.
BSD scenario taxonomy and test coverage for this paper.
| # | Scenario | Tested in this paper? |
|---|---|---|
| 1 | Rear-approaching target, right-adjacent lane, constant closing speed | Yes — primary scenario (Section 3, Section 4, Section 5 and Section 6) |
| 2 | Rear-approaching target, left-adjacent lane | No — assumed symmetric by geometry, not independently simulated |
| 3 | Fast cut-in (closing speed > 18–20 m/s) | Yes — Section 5.2 dwell-time sweep |
| 4 | Matched-speed dwell (target lingers at near-constant range) | No |
| 5 | Target exiting backward (host accelerates away mid-occupancy) | No |
| 6 | Daylight / low-light / night illumination | Yes — Section 2, Section 3, Section 4 and Section 5, camera pipeline |
| 7 | Rain, fog, or lens obstruction specifically (vs. illumination proxy) | No — illumination used as proxy only |
| 8 | Multiple simultaneous targets in zone | No |
| 9 | Static target already present at system power-on | No |
| 10 | Rear cross-traffic (perpendicular approach) | Out of scope — distinct ADAS function (RCTA), not BSD |
| 11 | Curved road / non-straight lane geometry | No — zone geometry assumed fixed relative to host |
| 12 | Sensor degradation (dirt, ice, physical obstruction) | No |
| 13 | Narrow/small targets (motorcycles, cyclists) | No — geometry and RCS assumptions implicitly car-class |
Disclaimer/Publisher’s Note: The statements, opinions and data contained in all publications are solely those of the individual author(s) and contributor(s) and not of MDPI and/or the editor(s). MDPI and/or the editor(s) disclaim responsibility for any injury to people or property resulting from any ideas, methods, instructions or products referred to in the content. |
© 2026 by the authors. Licensee MDPI, Basel, Switzerland. This article is an open access article distributed under the terms and conditions of the Creative Commons Attribution (CC BY) license (http://creativecommons.org/licenses/by/4.0/).
Copyright: This open access article is published under a Creative Commons CC BY 4.0 license, which permit the free download, distribution, and reuse, provided that the author and preprint are cited in any reuse.


