

Submitted:
22 July 2026
Posted:
23 July 2026
You are already at the latest version
Abstract
Subway tunnels exacerbate fire hazards, revealing a critical lacuna regarding the spatio-temporal coupling of fire progression and human egress. To address this, this study proposes and validates an Integrated Spatio-Temporal Risk Assessment Model to explicitly quantify survivability thresholds under complex fire dynamics. The framework synergizes Large-Eddy Simulation (LES) based Computational Fluid Dynamics with agent-based pedestrian trajectory modeling within a 3D tunnel featuring a 2% longitudinal gradient. Evaluating 9.5 MW and 12 MW fire energies, the model assessed Single-Sided Evacuation (SSE), Double-Sided Evacuation (DSE), and Sprinkler-Assisted Single-Sided Evacuation (SSE-S) across 2,160 agents. Hazards were quantified by continuously resolving Fractional Effective Dose (FED) indices, 60°C boundaries, and 500 ppm CO fronts. Simulations reveal the gradient induces a severe stack effect, accelerating toxic dispersion and yielding temperatures exceeding 1200°C. Consequently, SSE engendered fatal bottlenecks (FED: 15.33), whereas DSE optimized pedestrian flux, capping peak FED at 0.52. Crucially, while active suppression (SSE-S) extinguished flames within 105 seconds, thermodynamic cooling induced a paradoxical loss of smoke buoyancy, causing toxic layers to stratify at the breathing zone. Ultimately, while DSE and SSE-S are paramount for survivability, water-based suppression generates localized toxicological risks, necessitating the integration of low-level smoke detection and extraction architectures in future subterranean designs.
Keywords:
spatio-temporal risk assessment
; subway tunnel fire
; evacuation dynamics
; fractional effective dose
; active fire suppression
; chimney effect
1. Introduction
Tunnel fires present significant challenges due to the confines of the spaces in which they occur, the complexity of the ventilation dynamics, and the rapid propagation of heat, smoke, and toxic gases [1,2,3]. Conducting physical experimental investigations in high-cost infrastructure such as subway tunnels is often unfeasible and highly hazardous, necessitating the use of advanced predictive techniques. Furthermore, it is not possible to experimentally investigate the direct effects of fire on humans due to the risk of serious injury or death. Also, vibration-induced instabilities occurring in trains can result in derailments and accidents [4,5,6]. Fires can lead to smoke-induced fatalities by reducing visibility, as smoke propagation paths often overlap with passenger evacuation routes. Therefore, it is crucial to develop effective evacuation strategies and fire suppression systems to ensure occupant safety during a fire.
Sprinkler and ventilation systems are considered essential measures to prevent fire spread and provide a safe evacuation route [7,8]. Studies have shown that sprinklers and efficient ventilation equipment can enhance evacuation efficiency [9]. In recent decades, Computational Fluid Dynamics (CFD) has emerged as a robust mechanism for modeling complex fire phenomena, including turbulent combustion, smoke movement, and radiation heat transfer [10,11]. Given the frequent overlap between smoke propagation paths and passenger evacuation routes, the mitigation of smoke-induced visibility reduction and toxicity is of the utmost importance to ensure occupant survival.
A substantial body of research has employed various modeling tools, including the Fire Dynamics Simulator (FDS), PyroSim, and Pathfinder, to examine the dynamics of fires and the evacuation process in subterranean environments [12,13,14,15]. A substantial proportion of these studies has centered on the optimization of evacuation layouts and procedures within subway stations and multi-story buildings [16,17,18,19,20,21,22,23,24]. Concurrently, other research efforts have evaluated the impact of active suppression systems, platform screen doors, and ventilation on fire containment and evacuation times within these broad station environments [25,26,27,28,29,30].
While these studies provide foundational insights into pedestrian dynamics and fire control, they predominantly treat the fire event as a static layout optimization problem rather than a dynamically coupled system within highly constrained linear geometries. In the particular case of subways, the inherent geometries of the tunnels significantly impact the behavior of smoke. Research has demonstrated that tunnel slopes induce stack effects, fundamentally changing smoke stratification and temperature distribution patterns [31,32,33,34]. Furthermore, the configuration of ventilation and the spacing of fans are of paramount importance for maintaining safe airflow velocities during a fire [35]. A critical gap persists in the extant literature that; there is an absence of a comprehensive risk assessment model that dynamically couples the spatio-temporal progression of tunnel fires with varied human evacuation behaviors and active suppression mechanisms [36], particularly in narrow tunnels where subway cars create significant airflow blockage.
To address this fundamental gap, this study proposes an Integrated Spatio-Temporal Risk Assessment Model designed specifically for narrow subway tunnels. The proposed model is distinct from conventional case studies integrating CFD-based fire development simulations with agent-based evacuation behavioral modeling. This coupling enables the quantitative establishment of survival thresholds. The primary objective of this research is to rigorously test the proposed model by analyzing the critical interactions between dynamic fire parameters (fire energy and growth rate) and three distinct intervention strategies: Single-Sided Evacuation (SSE), Double-Sided Evacuation (DSE), and Sprinkler-Assisted Single-Sided Evacuation (SSE-S).
The proposed methodology also involves the continuous calculation of Fractional Effective Dose (FED) values, 60°C isothermal layers, and 500 ppm CO concentration fronts to evaluate the time-space dependency of thermal risks and toxic gas accumulation. The present study utilizes a sample three-dimensional tunnel geometry to test the model, thereby providing a validated, generalized framework for mitigating thermal impacts, smoke propagation, and toxic gas exposure. The findings from the implementation of this model are of paramount importance to the advancement of scientific knowledge in the realm of effective fire management and active suppression strategies within intricate subterranean environments.
2. Materials and Methods
The methodology of this study is anchored in a structured framework designed to evaluate the coupled dynamics of fire propagation and human egress in confined subterranean environments. As illustrated in Figure 1, the overall research architecture is divided into two primary phases: Model Development and Empirical Testing. The initial phase establishes the computational foundation by integrating fire dynamics simulations with agent-based evacuation modeling to construct the Integrated Spatio-Temporal Risk Assessment Model. Subsequently, the empirical testing phase applies this integrated framework across defined evacuation and active suppression scenarios, establishing a systematic baseline for the ensuing quantitative risk assessment.
2.1. Framework of the Fire Dynamics Module
The proposed Integrated Spatio-Temporal Risk Assessment Model was evaluated by resolving the fire dynamics and propagation parameters using the Fire Dynamics Simulator (FDS). FDS utilizes a Large-Eddy Simulation (LES) code, meticulously designed for low-speed, thermally-driven flows, to predict smoke and heat transport. The mathematical underpinnings of the fire propagation module are predicated on the conservation equations for mass, momentum, energy, and matter, which are defined as follows:
Conservation of Mass:
Conservation of Momentum:
Conservation of Energy:
Conservation of Matter:
Turbulence calculation can be solved using Direct Numerical Simulation (DNS) or LES. The DNS model requires significant computational time for analysis. Therefore, in this study, the LES turbulence model will be used. The LES model calculates large-scale eddies and achieves solutions for viscosity, thermal conductivity, and diffusion in a shorter time. The following equations are used for this purpose.
Where, is a constant coefficient, set to 0.2 for FDS. Δ represents the filter width, while denotes the symmetric rate of the strain tensor. Other diffusion parameters, such as mass and thermal diffusion, are related to turbulent viscosity.
The values and in FDS were taken as 0.5. These values are compatible with experimental studies [37].
2.2. Spatial Configuration and Boundary Conditions
The 3D computational domain model delineates a subway tunnel segment extending between Cross Passages (CP) 1 and 4 given in Figure 2. An investigation was conducted to examine the impact of the chimney (stack) effect on the propagation of smoke. To this end, a segment of 620 meters, encompassing the train set, was configured with a gradient of 2%. Meanwhile, the remaining 80-meter section was maintained at a gradient of 0%. This configuration captures the natural buoyancy-driven flow of heated gases toward the non-sloped section.
To accurately represent the physical obstruction of airflow and smoke propagation, a complete 4+4 subway carriage configuration was integrated into the spatial model. Each individual carriage measures 22.5 m in length and features four doors on one side, each with a width of 1.4 m. The tunnel surfaces were designated as concrete, and both the entrance and exit boundaries were set as open to the atmosphere. In scenarios lacking sprinkler systems, the ignition source was strategically positioned beneath the central section of the middle carriage, thereby simulating an electrical undercarriage failure. In contrast, for the scenario involving the intervention of sprinkler systems, the source was positioned on top of the same carriage to assess the efficacy of water-based suppression methods.
2.3. Fire Scenarios and Computational Grid Discretization
The model was subjected to testing across a range of distinct fire scenarios, characterized by varying Fire Energy (FE) and Fire Growth Rates (FGR). The fire growth was modeled using the quadratic time-dependent curve . In high-intensity scenarios, an FE of 12 MW was employed, along with a moderate-fast growth rate of α = 11.7 W/s² [38]. Low-intensity scenarios were calibrated with an FE of 9.5 MW and a slower growth rate of α = 2.9 W/s². In all cases, convective energy constituted 80% of the total FE (e.g., 9.6 MW for the 12 MW scenario), thereby dictating the spatial spread of thermal energy via smoke and air movement. Upon reaching the maximum FE, the energy output stabilized and remained constant until the simulation concluded. In order to conduct an investigation into low fire energy conditions, a power output of 9.5 MW was utilized in addition to other scenarios. In the case of fires in metropolitan railways, it is generally accepted that the conflagration originates in the lower section of the carriages, where electrical components are situated, and subsequently disseminates to the railway floor, where it persists in its propagation. In the model, the tunnel's entrance and exit are designated as open boundaries to the atmosphere, thereby establishing the boundary conditions. The tunnel surfaces are defined as concrete material in the model. In all scenarios except that of fire sprinklers, the fire source is placed beneath the central wagon's median section in the train set. In the case of the sprinkler scenario, the apparatus is positioned on top of the same wagon to observe the suppression of flames by water. In the initial and sensitivity simulations, the combustion reaction for the floor material of Tiflex/Plywood was utilized in accordance with the comments from the published research study, from which the calibrated material properties were derived. The reaction for the floor material [39] was provided as:
CH1.7O0.74 + 1.055 (O2 + 3.76N2) → CO2 + 0.85 H2O + 3.97N2
From this reaction; soot yield 0.117 kg/kg, CO yield: 0.0044 kg/kg, radiative fraction: 0.35 and energy release per unit mass of oxygen consumed: 9370 kJ/kg was used in the simulations.
2.3.1. Grid Sensitivity and Model Validation
The number of meshes employed in the simulation is of particular significance in the region where the fire originates. The mesh size can be determined based on the fuel load. The characteristic flame diameter (D*) is calculated. The value of 0.2D* signifies the maximum permissible mesh size [40,41,42]. Equation 8 provides the formula necessary for calculation. In the context of Large-Eddy Simulation (LES) frameworks, the accuracy of the computational grid is analytically dictated by the non-dimensional resolution parameter (D*Δx). For the simulated maximum heat release rate of 12 MW, the characteristic flame diameter (D*) is approximately 2.6 m. To ensure absolute mathematical fidelity during both the incipient and fully developed combustion phases, a highly refined grid dimension (Δx) of 0.25 m was implemented across the critical fire zone (extending symmetrically across two carriages). This explicit configuration yielded a D*/Δx ratio of 10.4. The ratio in question falls precisely within the optimal threshold (4 to 16) established by authoritative FDS validation benchmarks. Consequently, this analytical confirmation provides a robust validation of grid independence. This validation guarantees that turbulent entrainment and buoyant plume dynamics are resolved with high accuracy, negating the necessity for exhaustive, iterative mesh sensitivity analyses.
In this formula, represents the fire energy release rate in kilowatts (kW). The ambient density in the fire zone, is considered as approximately 1.204 kg/m³, assuming a mixture of air and smoke. The ambient temperature, is taken as the average temperature in the fire zone and can be approximated as 293 K. The specific heat capacity of the medium, , is 1.005 kJ/kg.K, while the gravitational acceleration, g, is 9.81 m/s². Mesh structure is given in Figure 3.
2.4. Agent-Based Evacuation Dynamics
In the event of a fire in the metro tunnel, the evacuation of occupants from the subway cars was simulated using the Pathfinder software. The evacuation simulation was conducted under the assumption of the maximum possible occupant density per square meter within the subway cars. According to the findings of Ansari et al. [43], who determined the mean shoulder width to be 45.5 centimeters, it was calculated that 5.25 occupants could fit within a single square meter. In all scenarios, a total of 2,160 occupants were uniformly distributed across the cars, with each car accommodating 270 occupants. During the evacuation, a walking speed of 1.3 m/s [44] was assigned to the occupants. The steering-collision handling method was employed for the evacuation behavior of the occupants [45].
2.5. Quantitative Risk Evaluation & Fractional Effective Dose
The Fractional Effective Dose (FED), an indicator of exposure to CO, CO2, and the effects of oxygen depletion in fire smoke, can be obtained from Pyrosim software. The combined effects of CO, CO2, and low O2 levels on occupants are represented by the FED. The equation for FED is defined in Equation 9 as follows [46].
Where, represents the function of CO exposure, while the hyperventilation coefficient ) acts as a multiplier for the effects. is a time-dependent function that accumulates when O2 levels drop below 20.9%. According to literature [47,48], fire smoke effects on occupants are classified as negligible for , minor for , serious for , and lethal for .
3. Results
3.1. Model Validation and Baseline Hazard Thresholds
The proposed Integrated Spatio-Temporal Risk Assessment Model was subjected to a rigorous testing process at the CP3 tunnel location, encompassing a range of fire intensities, evacuation strategies, and suppression conditions. The active suppression intervention (SSE-S) was modeled utilizing three roof-mounted sprinklers, spaced 7.2 m apart, each discharging water at 66.5 L/min and activated 90 s after ignition as shown in Figure 4. In order to systematically quantify life safety, the model evaluated thermal and toxic hazard limits based on a 5-minute critical exposure baseline. Conventional literature frequently permits FED values up to 0.3 for safe evacuation; however, this assessment adopted a highly conservative critical safety limit of FED = 0.1 to account for physiological variables [49].
The simulation results were derived based on the threshold values defined for the hazard types listed in Table 1. The most critical scenario, determined by a 5-minute threshold, served as the baseline for data collection [50]. The results section incorporated 3D smoke distribution data within the tunnel during critical moments. Key parameters such as smoke temperature, optical density, oxygen concentration, and CO concentration were explicitly mapped as continuous spatio-temporal heatmaps, complete with longitudinal spatial coordinates to facilitate macro-level risk analysis. Furthermore, the incorporation of visual data, in the form of images depicting evacuated occupants, offers insights into their interaction with fire products during evacuation. The toxicological risks were explicitly quantified utilizing the FED metric, which encompasses the combined physiological effects of O2 depletion, CO, and CO2 exposure. Concurrently, thermal hazards were evaluated by tracking occupant exposure to ambient temperatures exceeding the critical 60°C threshold. In addition, time-dependent graphs of these values were generated.
The threshold FED values and the corresponding population impact ranges, indicating the limits for individuals to maintain their normal activities or mobility, are determined in the literature. This distinction is widely accepted as not all individuals are affected equally by a given FED value. The predicted population impact rates vary with FED levels in the literature [46,47]: 0% to 11% of the population is affected at FED values between 0.1 and 0.3, 11% to 50% at values between 0.3 and 1.0, and 50% to 89% at values ranging from 1.0 to 3.0. The safety limit is generally set at FED = 0.3; however, using a stricter limit of FED = 0.1 is considered a more conservative approach.
3.2. Spatio-Temporal Thermal and Smoke Propagation Dynamics
Spatio-temporal analysis demonstrated that the tunnel's geometric configuration, specifically the 2% gradient, decisively dictated hazard propagation via the chimney effect. Consequently, the propagation of smoke, soot, and the 60°C isothermal layer occurred at a significantly accelerated rate toward the B direction (upward slope) compared to the A direction. In the context of unmitigated Single-Sided Evacuation (SSE) scenarios, characterized by a free-field emission of 12 MW and a free-field gain rate (FGR) of 11.7 W/s², the continuous spatial heatmaps illustrate the rapid encroachment of the 60°C thermal layer upon the ceiling region. By the time t = 250 s, the lethal thermal front had descended to the occupant head level and extended longitudinally across the spatial coordinate plane, effectively neutralizing the primary escape routes. The Double-Sided Evacuation (DSE) strategy reduced occupant density near the fire source, facilitating faster egress and marginally mitigating individual thermal exposure. However, structural heat accumulation remained severe as shown in Figure 5.
Concurrently, soot visibility in the B direction plummeted below the critical 10 m threshold within 150 s, eventually degrading to complete obscurity (0 m) as given in Figure 6a. Conversely, the Sprinkler-Assisted (SSE-S) strategy fundamentally altered the fire dynamics. The activation of sprinklers at t = 90 s rapidly suppressed the heat release, entirely extinguishing the flames by t = 105 s and preventing the 60°C layer from expanding beyond the immediate fire zone, shown in Figure 6b.
However, the model revealed a critical secondary dynamic: while the sprinklers drastically reduced overall soot density, the water's cooling effect caused the residual smoke to lose buoyancy and settle near ground level after 150 seconds. This highlights a localized toxic risk that necessitates targeted floor-level ventilation or detection systems.
3.3. Toxic Gas Accumulation (CO, CO2, and O2)
The model continuously tracked the 500 ppm CO concentration front alongside critical gas volumetric fractions for the most heavily exposed occupants. The chimney (stack) effect was found to be a primary driver of the observed outcomes, with all tested fire scenarios in the B direction generating CO concentrations that exceeded the 500 ppm upper safety limit for a duration exceeding five minutes (Figure 7). This phenomenon was accompanied by a breach in the 1% CO₂ concentration threshold, which peaked near 2% towards the conclusion of the evacuation phase.
In stark contrast, the accumulation of toxic substances in the A direction progressed at a significantly slower rate. The only scenario in which CO levels exceeded the 200 ppm limit for eight minutes was the specific low-intensity scenario (FE = 9.5 MW, FGR = 2.9 W/s²). In all other scenarios in the A direction, CO₂ levels remained consistently below 1%, and ambient O₂ levels never decreased below the critical 15% threshold. In the absence of sprinkler intervention, the 500 ppm CO layer enveloped the evacuation pathways completely by t = 250 s (Figure 8). The SSE-S strategy effectively countered this progression, ensuring the maintenance of safe CO levels across the primary evacuation routes.
3.4. Quantitative Risk Evaluation and FED Outcomes
The maximum temperature exposure significantly impacted the overall survivability index. In the B direction during the high-intensity SSE scenario, ambient temperatures breached the 60°C safety threshold in a mere 220 seconds, ultimately reaching a lethal 1200°C. Despite a reduction in fire energy (FE = 9.5 MW, FGR = 2.9 W/s²), peak temperatures in the B direction still reached 300°C, a level incompatible with human survival. For the A direction under the worst-case parameters, the 60°C threshold was reached significantly later, at 480 seconds, subjecting trailing occupants to elevated heat for approximately 400 seconds (Figure 9).
The integration of these disparate thermal and toxicological variables into the FED metric provided the ultimate quantitative risk assessment. An increase in fire growth rates and energy releases led to an exponential acceleration in the accumulation of FED. In the B direction, the critical FED limit of 0.1 was breached at 505 seconds during the high-intensity SSE scenario. Prolonged exposure, attributable to the single egress route, led to an extended total evacuation time of 1,390 seconds. This resulted in the FED reaching an extreme and lethal value of 15.33.
The implementation of the DSE strategy under identical fire parameters resulted in a reduction of the maximum evacuation time to 823 seconds, thereby capping the peak FED at 0.52. A reduction in the FGR to 2.9 W/s² under SSE resulted in an extension of the safe available egress time, with the 0.1 FED breach being postponed to 800 s. Notably, the sprinkler intervention (SSE-S) exhibited a consistent capacity to maintain FED values well below the 0.1 safety limit throughout the duration of the simulation as shown in Figure 10. This finding serves to empirically substantiate the efficacy of SSE-S as the most effective strategy for ensuring life safety in confined tunnel geometries.
4. Discussion
The primary objective of this research was to transcend traditional, static evacuation paradigms by validating an Integrated Spatio-Temporal Risk Assessment Model tailored for narrow subway tunnels. Although prior studies have primarily focused on the dynamics of fires and emergency egress procedures in expansive, multi-story underground stations, a significant scientific gap remains concerning the interplay between thermal propagation and pedestrian flux in highly confined linear topologies. This study addresses that gap by explicitly quantifying life-safety thresholds under complex, time-dependent fire dynamics. The implementation of the proposed integrated model yielded significant insights into survivability thresholds in confined geometries. The continuous spatio-temporal data unequivocally demonstrated that a 2% longitudinal gradient induces a severe stack (chimney) effect, decisively accelerating upward toxic dispersion and culminating in ambient temperatures exceeding 1200°C in the upward (B) direction.
In the absence of mitigation strategies, the Single-Sided Evacuation (SSE) approach proved to be ineffective, resulting in a substantial number of fatalities, with a Fractional Effective Dose (FED) value of 15.33, attributable to spatial constraints that impeded egress. In contrast, the Double-Sided Evacuation (DSE) strategy demonstrated a capacity to optimize pedestrian flux, while concurrently limiting the maximum FED to a survivable level of 0.52. Most crucially, the active suppression paradigm (SSE-S) revealed a paradoxical secondary hazard: while sprinklers effectively extinguished flames within 105 seconds, thermodynamic cooling induced a profound loss of smoke buoyancy, stratifying toxic particulate layers directly at the pedestrian breathing zone by 150 seconds.
These findings significantly contextualize and expand upon the extant literature on the subject. The significant impact of the longitudinal gradient on smoke acceleration is consistent with experimental observations reported by [31] and [32]. These studies indicated that upward slopes substantially modify smoke stratification patterns. However, by integrating this aerodynamic phenomenon with agent-based FED calculations, our model converts this observation into a quantifiable life-safety metric. Moreover, the observed efficacy of the DSE strategy is consistent with the bottleneck analyses conducted by Chen et al. [17] and Qin et al. [14] in broad station environments, thereby substantiating that distributed pedestrian flux is equally, if not more, imperative in constrained tunnel geometries. The most critical theoretical contribution is arguably the spatio-temporal quantification of the sprinkler-induced buoyancy loss. The sprinkler systems might impede smoke ventilation in larger railway stations [26]. However, our model empirically demonstrates that, in narrow tunnels, this thermodynamic cooling process actively drives toxic carbon monoxide (CO) layers to the ground level, thereby creating an acute, localized asphyxiation hazard that overrides the initial thermal relief.
Notwithstanding the robustness of the integrated model, several methodological limitations must be acknowledged. The agent-based egress simulation was predicated on a maximum continuous occupant density of 5.25 occupants per square meter and a uniform nominal walking speed of 1.3 meters per second, based on standard anthropometric data. While this homogeneous behavioral assumption provides a fundamental baseline, it does not fully account for complex human factors such as panic-induced stampedes, pre-evacuation cognitive delays, or demographic mobility variations (e.g., elderly or disabled passengers) that occur during severe emergencies. To address this limitation, subsequent iterations of the model must integrate probabilistic demographic distributions, such as Monte Carlo simulations, to randomly allocate walking speeds and reaction times. When these advanced probabilistic frameworks are employed to explicitly account for vulnerable populations with reduced mobility, the resulting dynamic evacuation predictions are significantly more ecologically valid and realistic.
Furthermore, the combustion kinetics within the CFD module were calibrated using specific floor material properties (Tiflex/Plywood). Variations in fuel loads, such as the presence of battery-electric carriage fires or differing interior polymeric composites, could alter the fire growth rate (FGR) and the corresponding toxic yields, potentially shifting the specific spatio-temporal thresholds calculated in this study. These limitations delineate clear trajectories for future scientific inquiry. Subsequent research must explicitly explore the complex thermodynamic interactions between the identified "smoke settling" phenomenon and active forced longitudinal ventilation systems. Specifically, the evaluation of targeted, floor-level smoke extraction architectures has the potential to mitigate the secondary toxicological risks inadvertently introduced by water-based suppression systems. Furthermore, the integration of this spatio-temporal FED assessment framework with emerging AI-based, real-time fire prediction models [52] could facilitate the development of highly adaptive, dynamic emergency response systems for complex underground transit networks.
5. Conclusions
The present study proposed and rigorously tested an Integrated Spatio-Temporal Risk Assessment Model to evaluate fire dynamics and human evacuation behavior in narrow subway tunnels. By validating the complex interactions between aerodynamic hazard propagation and human egress limits, the study provides a definitive blueprint for evaluating extreme emergency scenarios in confined transit infrastructure. The proposed model quantitatively assessed the efficacy of three interventional paradigms: Single-Sided Evacuation (SSE), Double-Sided Evacuation (DSE), and Sprinkler-Assisted Single-Sided Evacuation (SSE-S) under varying fire energy levels. These evacuation procedures are investigated under varying fire energy levels and growth rates. The Fractional Effective Dose (FED) is used as the definitive life-safety metric. The model was subjected to a series of tests, the results of which indicated that the geometry of the tunnel, particularly its longitudinal slope, exerts a significant influence on the probability of survival. The empirical findings demonstrate that longitudinal gradients fundamentally compromise single-directional egress protocols. The structural integration of bidirectional evacuation pathways (DSE) is imperative in order to distribute pedestrian flux and prevent fatal spatial bottlenecks, given the fact that aerodynamic stack effects disproportionately accelerate toxic fronts. The distribution of pedestrian flow, as facilitated by DSE, serves to mitigate the formation of critical spatial bottlenecks in the vicinity of the fire source. This, in turn, leads to a substantial reduction in the duration of occupant exposure to lethal temperatures. Furthermore, DSE effectively prevents FED values from rapidly breaching the critical 0.1 threshold.
The application of the model to the active suppression (SSE-S) scenario yielded a critical scientific insight regarding water-based systems in confined geometries, uncovering a fundamental operational paradox. Conventional performance metrics evaluate rapid flame extinguishment as successful, as the sprinkler system effectively maintained FED values well below critical limits. However, the model demonstrates that the subsequent thermal cooling process results in a significant loss of smoke buoyancy. This thermodynamic collapse introduces an equally lethal asphyxiation hazard at the floor level. This insight dictates an urgent redesign of suppression architectures, mandating the inextricable linkage of low-level toxicological extraction systems to overhead sprinkler deployments. In essence, this work represents a paradigm shift in the realm of underground fire safety analysis, transitioning from a reactive post-incident evaluation model to a proactive, predictive risk management framework. The findings establish that implementing dual evacuation pathways and controlling fire growth rates are imperative for occupant survival in narrow tunnels. Future research endeavors should extend this integrated model to evaluate the complex interactions between forced smoke evacuation systems and varying longitudinal ventilation configurations. This would further optimize emergency response protocols against multi-hazard scenarios in transit tunnels. By projecting highly localized, micro-level tunnel physics as continuous spatio-temporal heatmaps, this risk assessment framework successfully bridges the gap toward macro-level infrastructure planning. Consequently, it provides urban disaster management authorities with a scalable, highly visual tool for broader emergency risk mitigation.
Author Contributions
Conceptualization, C.K.; methodology, G.C., C.K.; software, G.C. and O.Y; validation, G.C.; formal analysis, M.F.D.; investigation, C.K. and M.F.D.; resources, O.Y. and M.F.D.; data curation, G.C. and M.F.D.; writing—original draft preparation, G.C. and C.K.; writing—review and editing, C.K. and O.Y.; visualization, G.C. and O.Y.; supervision, C.K. and G.C.; project administration, C.K. All authors have read and agreed to the published version of the manuscript.
Funding
This research received no external funding. The APC was funded by Sakarya University.
Institutional Review Board Statement
Not applicable.
Data Availability Statement
The data that support the findings of this study are available from the corresponding author, upon reasonable request.
Acknowledgments
During the preparation of this manuscript, the authors used ChatGPT for the purposes of generating Figure 1 (the conceptual framework of the proposed model) and translation. The authors have reviewed and edited the output and take full responsibility for the content of this publication.
Conflicts of Interest
The authors declare no conflicts of interest.
Abbreviations/Nomenclature
The following abbreviations are used in this manuscript:
| Symbol | Meaning | Unit |
| CFD | Computational Fluid Dynamics | – |
| CO | Carbon monoxide | ppm |
| CO₂ | Carbon dioxide | ppm |
| CP | Cross passage | – |
| cₚ | Specific heat capacity | kJ·kg⁻¹·K⁻¹ |
| Cₛ | Smagorinsky constant | – |
| DNS | Direct Numerical Simulation | – |
| Dᵢ | Species diffusion coefficient | m²/s |
| D* | Characteristic fire diameter | m |
| DSE | Double-Sided Evacuation | – |
| FE | Fire energy | MW |
| FED | Fractional Effective Dose | – |
| FDS | Fire Dynamics Simulator | – |
| FGR | Fire growth rate | W/s² |
| FCO | CO exposure function in FED calculation | – |
| FO₂ | Oxygen depletion contribution to FED | – |
| g | Gravitational acceleration | m/s² |
| HRR (Q̇) | Heat release rate | kW |
| kW | Kilowatt | – |
| LES | Large-Eddy Simulation | – |
| ṁ | Mass flow rate | kg/s |
| MW | Megawatt | – |
| μt | Turbulent viscosity | kg·m⁻¹·s⁻¹ |
| O₂ | Oxygen | % |
| ppm | Parts per million | – |
| Prt | Turbulent Prandtl number | – |
| Q* | Dimensionless heat release rate | – |
| ρ | Gas density | kg/m³ |
| Sij | Strain-rate tensor | s⁻¹ |
| Sct | Turbulent Schmidt number | – |
| SSE | Single-Sided Evacuation | – |
| SSE-S | Sprinkler-Assisted Single-Sided Evacuation | – |
| T | Gas temperature | K |
| T∞ | Ambient temperature | K |
| t | Time | s |
| τij | Stress tensor | Pa |
| ui | Velocity component | m/s |
| VCO₂ | Hyperventilation factor due to CO₂ | – |
| xi | Spatial coordinate | m |
| Yi | Species mass fraction | – |
| α | Fire growth coefficient | W/s² |
| Δ | LES filter width | m |
| Δx | Computational mesh size | m |
| δij | Kronecker delta | – |
References
- Ingason, H.; Li, Y.Z.; Lönnermark, A. Tunnel Fire Dynamics; Springer International Publishing: Cham, 2024; ISBN 978-3-031-53922-0.
- Li, Y.Z.; Ingason, H. Overview of Research on Fire Safety in Underground Road and Railway Tunnels. Tunnelling and Underground Space Technology 2018, 81, 568–589. [CrossRef]
- Zhang, Y.; Huang, X. A Review of Tunnel Fire Evacuation Strategies and State-of-the-Art Research in China. Fire Technol 2024, 60, 859–892. [CrossRef]
- Eroğlu, M.; Koç, M.A.; Esen, İ.; Kozan, R. Realistic Modelling for Analysis of Train-Structure and Ballasted-Track Interaction for High-Speed Trains. Journal of Vibration Engineering & Technologies 2024, 12, 7065–7097. [CrossRef]
- Eroğlu, M.; Koç, M.A.; Esen, İ. Application of Magnetic Field to Reduce the Forced Response of Steel Bridges to High Speed Train. International Journal of Mechanical Sciences 2023, 242, 108023. [CrossRef]
- Eroğlu, M.; Koç, M.A.; Esen, İ.; Kozan, R. Train-Structure Interaction for High-Speed Trains Using a Full 3D Train Model. Journal of the Brazilian Society of Mechanical Sciences and Engineering 2022, 44, 48. [CrossRef]
- Beard, A.; Carvel, R. The Handbook of Tunnel Fire Safety; Thomas Telford Publishing, 2005; ISBN 978-0-7277-3875-2.
- Wang, J.; Huang, D.; Song, Y.; Lu, K. Improved Prediction Model for Ceiling Maximum Smoke Temperature in the Uphill Tunnel Fires Using Water Spray System. Case Studies in Thermal Engineering 2025, 66, 105739. [CrossRef]
- Luan, D.; Bielawski, J.; Fan, C.; Węgrzyński, W.; Huang, X. Numerical Simulation of the Impact of Rainfall on Tunnel Fire. Case Studies in Thermal Engineering 2024, 62, 105186. [CrossRef]
- Węgrzyński, W.; Lipecki, T. Fire and Smoke Modelling. In Handbook of Fire and the Environment; Meacham, B.J., McNamee, M., Eds.; The Society of Fire Protection Engineers Series; Springer International Publishing: Cham, 2023; pp. 101–181 ISBN 978-3-030-94355-4.
- Yeoh, G.H.; Yuen, K.K. Computational Fluid Dynamics in Fire Engineering; Elsevier, 2009; ISBN 978-0-7506-8589-4.
- Coşkun, G.; Demir, U.; Soyhan, H.S. Investigation of the Smoke Ventilation and Evacuation Strategies to Decrease Smoke Poisoning Risk by Coupling Fire and Evacuation Simulations. JAFM 2022, 15. [CrossRef]
- Coşkun, G.; Demir, U.; Soyhan, H.S. Sakarya Üniversitesi M-7 Binası Için Yangın Simülasyonu ve Duman Tahliye Stratejilerinin İncelenmesi. SAÜ Fen Bilimleri Enstitüsü Dergisi 2018, 1–1. [CrossRef]
- Qin, J.; Liu, C.; Huang, Q. Simulation on Fire Emergency Evacuation in Special Subway Station Based on Pathfinder. Case Studies in Thermal Engineering 2020, 21, 100677. [CrossRef]
- Yan, Z.; Wang, Y.; Chao, L. Simulation Study on Fire and Evacuation of Super High-Rise Commercial Building. Case Studies in Thermal Engineering 2023, 52, 103519. [CrossRef]
- Zhang, N.; Liang, Y.; Zhou, C.; Niu, M.; Wan, F. Study on Fire Smoke Distribution and Safety Evacuation of Subway Station Based on BIM. Applied Sciences 2022, 12, 12808. [CrossRef]
- Chen, Y.; Wang, C.; Hui Yap, J.B.; Li, H.; Zhang, S. Emergency Evacuation Simulation at Starting Connection of Cross-Sea Bridge: Case Study on Haicang Avenue Subway Station in Xiamen Rail Transit Line. Journal of Building Engineering 2020, 29, 101163. [CrossRef]
- Tsukahara, M.; Koshiba, Y.; Ohtani, H. Effectiveness of Downward Evacuation in a Large-Scale Subway Fire Using Fire Dynamics Simulator. Tunnelling and Underground Space Technology 2011, 26, 573–581. [CrossRef]
- Li, Z.; Tang, M.; Liang, D.; Zhao, Z. Numerical Simulation of Evacuation in a Subway Station. Procedia Engineering 2016, 135, 616–621. [CrossRef]
- Yang, X.-X.; Dong, H.-R.; Yao, X.-M.; Sun, X.-B. Pedestrian Evacuation at the Subway Station under Fire. Chinese Phys. B 2016, 25, 048902. [CrossRef]
- Zhang, L.; Wu, X.; Liu, M.; Liu, W.; Ashuri, B. Discovering Worst Fire Scenarios in Subway Stations: A Simulation Approach. Automation in Construction 2019, 99, 183–196. [CrossRef]
- Xu, H.; Wei, Y.; Tan, Y.; Zhou, Q. A BIM-FDS Based Evacuation Assessment of Complex Rail Transit Stations under Post-Earthquake Fires for Sustainable Buildings. Buildings 2024, 14, 429. [CrossRef]
- Liao, L.; Li, H.; Li, P.; Bao, X.; Hong, C.; Wang, D.; Xie, X.; Fan, J.; Wu, P. Underground Evacuation and Smoke Flow Simulation in Guangzhou International Financial City during Fire. Fire 2023, 6, 266. [CrossRef]
- Wang, P.; Dai, H.; Yu, X.; Wang, Q.; Li, S.; Jia, C. Fire-Spread Characteristics and Evacuation Plan Optimization of Old Style Multi-Story Student Apartments. Fire 2024, 7, 72. [CrossRef]
- Wang, K.; Cai, W.; Zhang, Y.; Hao, H.; Wang, Z. Numerical Simulation of Fire Smoke Control Methods in Subway Stations and Collaborative Control System for Emergency Rescue. Process Safety and Environmental Protection 2021, 147, 146–161. [CrossRef]
- Pan, K.; Feng, J.; Shi, J. A Comprehensive Study of Two Fire Conditions in a Subway Train Fire: Considering the Failure or Work of the Sprinkler System: In Proceedings of the 3rd International Conference on Electromechanical Control Technology and Transportation; SCITEPRESS - Science and Technology Publications: Chongqing, China, 2018; pp. 182–186.
- Roh, J.S.; Ryou, H.S.; Park, W.H.; Jang, Y.J. CFD Simulation and Assessment of Life Safety in a Subway Train Fire. Tunnelling and Underground Space Technology 2009, 24, 447–453. [CrossRef]
- Zhilei, W.; Min, H.; Dayong, X.; Xuhai, P. Simulation Research on Human Evacuation in Subway with a Single-Point Fire Scenario. Procedia Engineering 2014, 84, 595–602. [CrossRef]
- Yamamoto, K.; Takeuchi, Y.; Nishiki, S. Effects of a Sprinkler on Evacuation Dynamics in Fire. Computation 2015, 3, 274–284. [CrossRef]
- Yang, P.; Li, C.; Chen, D. Fire Emergency Evacuation Simulation Based on Integrated Fire–Evacuation Model with Discrete Design Method. Advances in Engineering Software 2013, 65, 101–111. [CrossRef]
- Liu, C.; Zhong, M.; Tian, X.; Zhang, P.; Xiao, Y.; Mei, Q. Experimental and Numerical Study on Fire-Induced Smoke Temperature in Connected Area of Metro Tunnel under Natural Ventilation. International Journal of Thermal Sciences 2019, 138, 84–97. [CrossRef]
- Vauquelin, O.; Wu, Y. Influence of Tunnel Width on Longitudinal Smoke Control. Fire Safety Journal 2006, 41, 420–426. [CrossRef]
- Su, Z.; Li, Y.; Luo, R.; Zhong, H.; Li, J.; Geng, Z.; Guo, Z. Mechanism of Spillage Plumes from Multiple Openings on Ceiling Temperature Distribution in Metro Tunnel Fires Based on Superposition Principle. Tunnelling and Underground Space Technology 2025, 158, 106412. [CrossRef]
- Ye, C.; Xia, M.; Li, J.; Hu, X.; Zhang, P. Experimental and Numerical Investigation into Effect of Vortex Fields on Flame Plume Behavior and Smoke Temperature Distribution in Tunnel Spill Fires. Tunnelling and Underground Space Technology 2025, 159, 106473. [CrossRef]
- Weng, M.; Obadi, I.; Wang, F.; Liu, F.; Liao, C. Optimal Distance between Jet Fans Used to Extinguish Metropolitan Tunnel Fires: A Case Study Using Fire Dynamic Simulator Modeling. Tunnelling and Underground Space Technology 2020, 95, 103116. [CrossRef]
- Xiao, M.; Du, C.; Wang, Y.; Wang, J.; Chang, B. Research on Smoke Diffusion and Evacuation Routes of Mine Fires with Complex Roadway Networks. Case Studies in Thermal Engineering 2025, 66, 105696. [CrossRef]
- Zhang, W.; Ryder, N.; Roby, R.; Carpenter, D. Modeling of the Combustion in Compartment Fires Using Large Eddy Simulation Approach. CHEMICAL AND PHYSICAL PROCESSES IN COMBUSTION 2001, 171–174.
- Quintiere, J.G. Fire Growth: An Overview. Fire Technology 1997, 33, 7–31. [CrossRef]
- Musluoğlu, E. A Theoretical Analysis of Fire Development and Flame Spread in Underground Trains. PhD, Middle East Technical University, 2009.
- Caliendo, C.; Ciambelli, P.; De Guglielmo, M.L.; Meo, M.G.; Russo, P. Numerical Simulation of Different HGV Fire Scenarios in Curved Bi-Directional Road Tunnels and Safety Evaluation. Tunnelling and Underground Space Technology 2012, 31, 33–50. [CrossRef]
- Huang, Y.; Li, Y.; Dong, B.; Li, J.; Liang, Q. Numerical Investigation on the Maximum Ceiling Temperature and Longitudinal Decay in a Sealing Tunnel Fire. Tunnelling and Underground Space Technology 2018, 72, 120–130. [CrossRef]
- Liu, C.; Zhong, M.; Tian, X.; Zhang, P.; Li, S. Study on Emergency Ventilation for Train Fire Environment in Metro Interchange Tunnel. Building and Environment 2019, 147, 267–283. [CrossRef]
- Ansari, S.; Nikpay, A.; Varmazyar, S. Design and Development of an Ergonomic Chair for Students in Educational Settings. Health Scope 2018, In Press. [CrossRef]
- Hu, M.; Cai, W.; Zhao, H. Simulation of Passenger Evacuation Process in Cruise Ships Based on A Multi-Grid Model. Symmetry 2019, 11, 1166. [CrossRef]
- Li, L.J.; Ji, J.; Fan, C.G.; Sun, J.H.; Yuan, X.Y.; Shi, W.X. Experimental Investigation on the Characteristics of Buoyant Plume Movement in a Stairwell with Multiple Openings. Energy and Buildings 2014, 68, 108–120. [CrossRef]
- Hurley, M.J.; Gottuk, D.T.; Hall, J.R.; Harada, K. SFPE Handbook of Fire Protection Engineering, 5th Ed. Springer.; 2015;
- Gann, R.G.; Bryner, N.P. Combustion Products and Their Effects on Life Safety.; 2008.
- Oven, V.A.; Cakici, N. Modelling the Evacuation of a High-Rise Office Building in Istanbul. Fire Safety Journal 2009, 44, 1–15. [CrossRef]
- Hansen-Bruhn, I.; Hull, T.R. Smoke Toxicity of Fire Protecting Timber Treatments. Fire Safety Journal 2023, 141, 103977. [CrossRef]
- Liu, Q.; He, R.; Zhang, L. Simulation-Based Multi-Objective Optimization for Enhanced Safety of Fire Emergency Response in Metro Stations. Reliability Engineering & System Safety 2022, 228, 108820. [CrossRef]
- Könnecke, R.; Schneider, V. A Fire Engineering Design for New and Existing Subway Stations. In Proceedings of the Proceedings Interflam2004, Fire Science & Engineering Conference; pp. 803–807.
- Cheng, J.; Yang, N.; Jiang, S.; Xiong, C. Real-Time Forecast of Tunnel Fire Scenario and Hazard Based on External Smoke Images. Tunnelling and Underground Space Technology 2025, 158, 106377. [CrossRef]
Figure 1.
The conceptual framework of the Integrated Spatio-Temporal Risk Assessment Model.
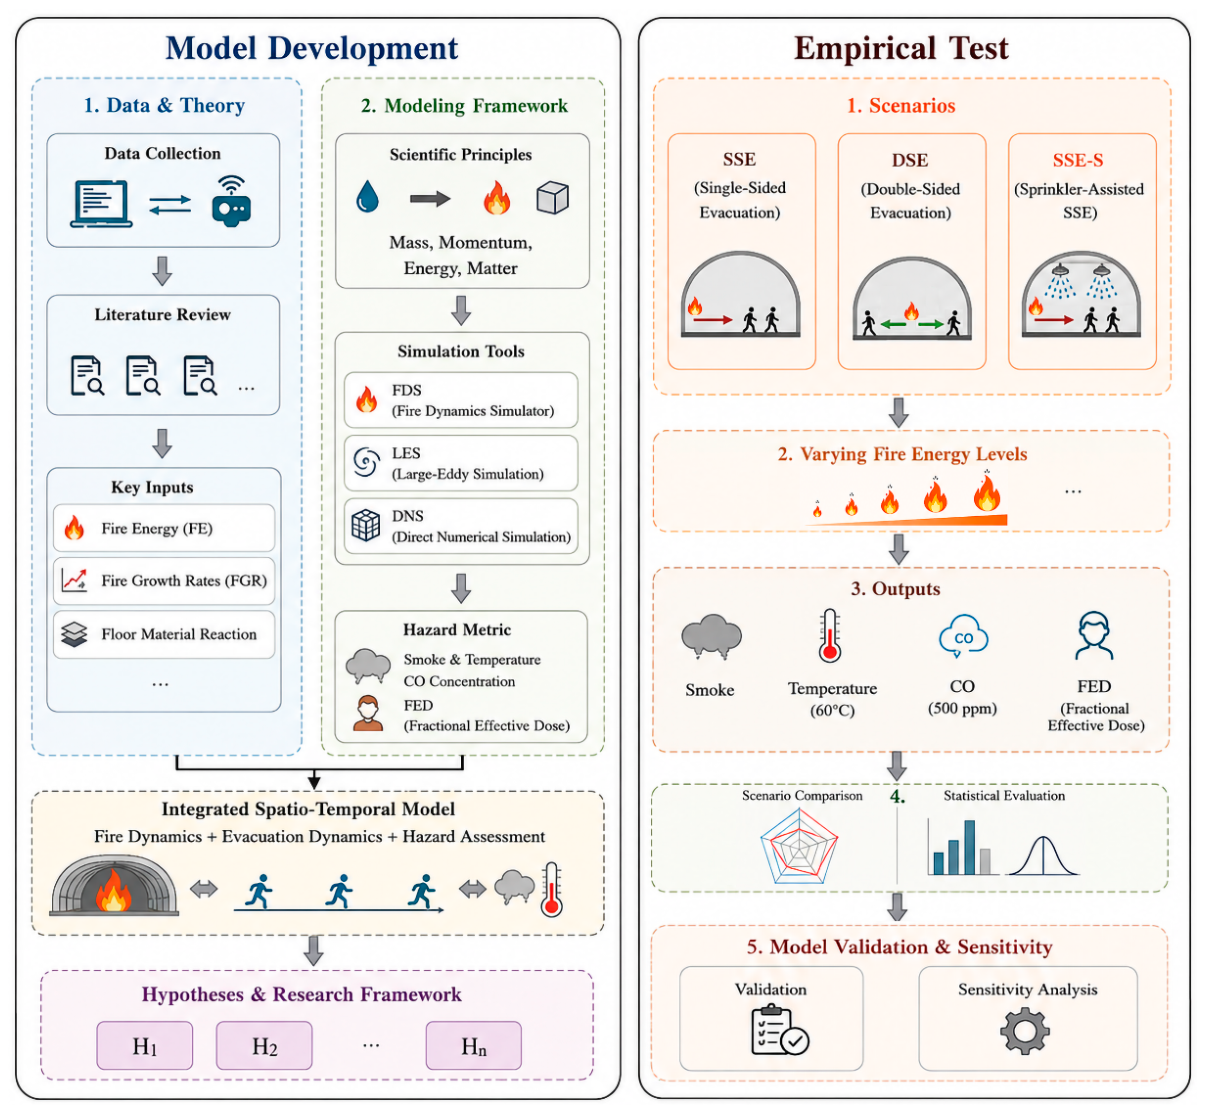
Figure 2.
3D model of the metro tunnel: a) the arrangement of carriages and b) occupants within the carriages.
Figure 2.
3D model of the metro tunnel: a) the arrangement of carriages and b) occupants within the carriages.
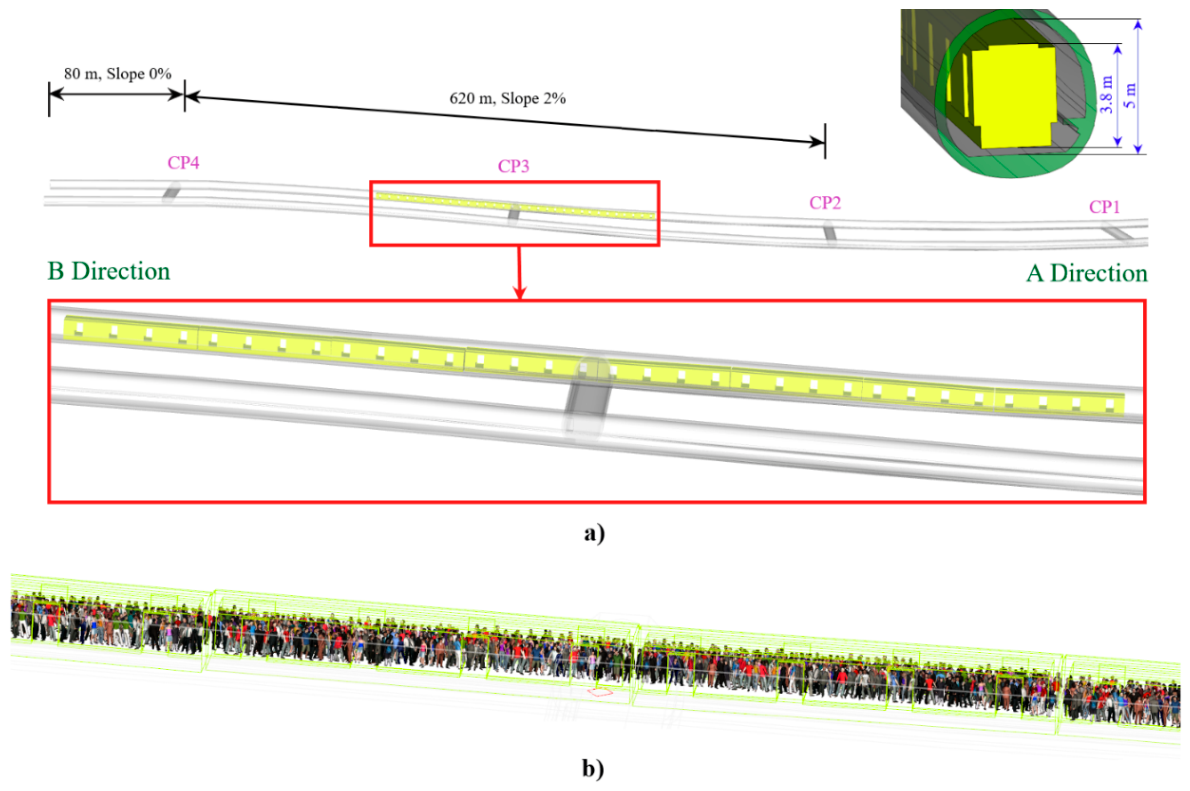
Figure 3.
Mesh structure of the computational domain.
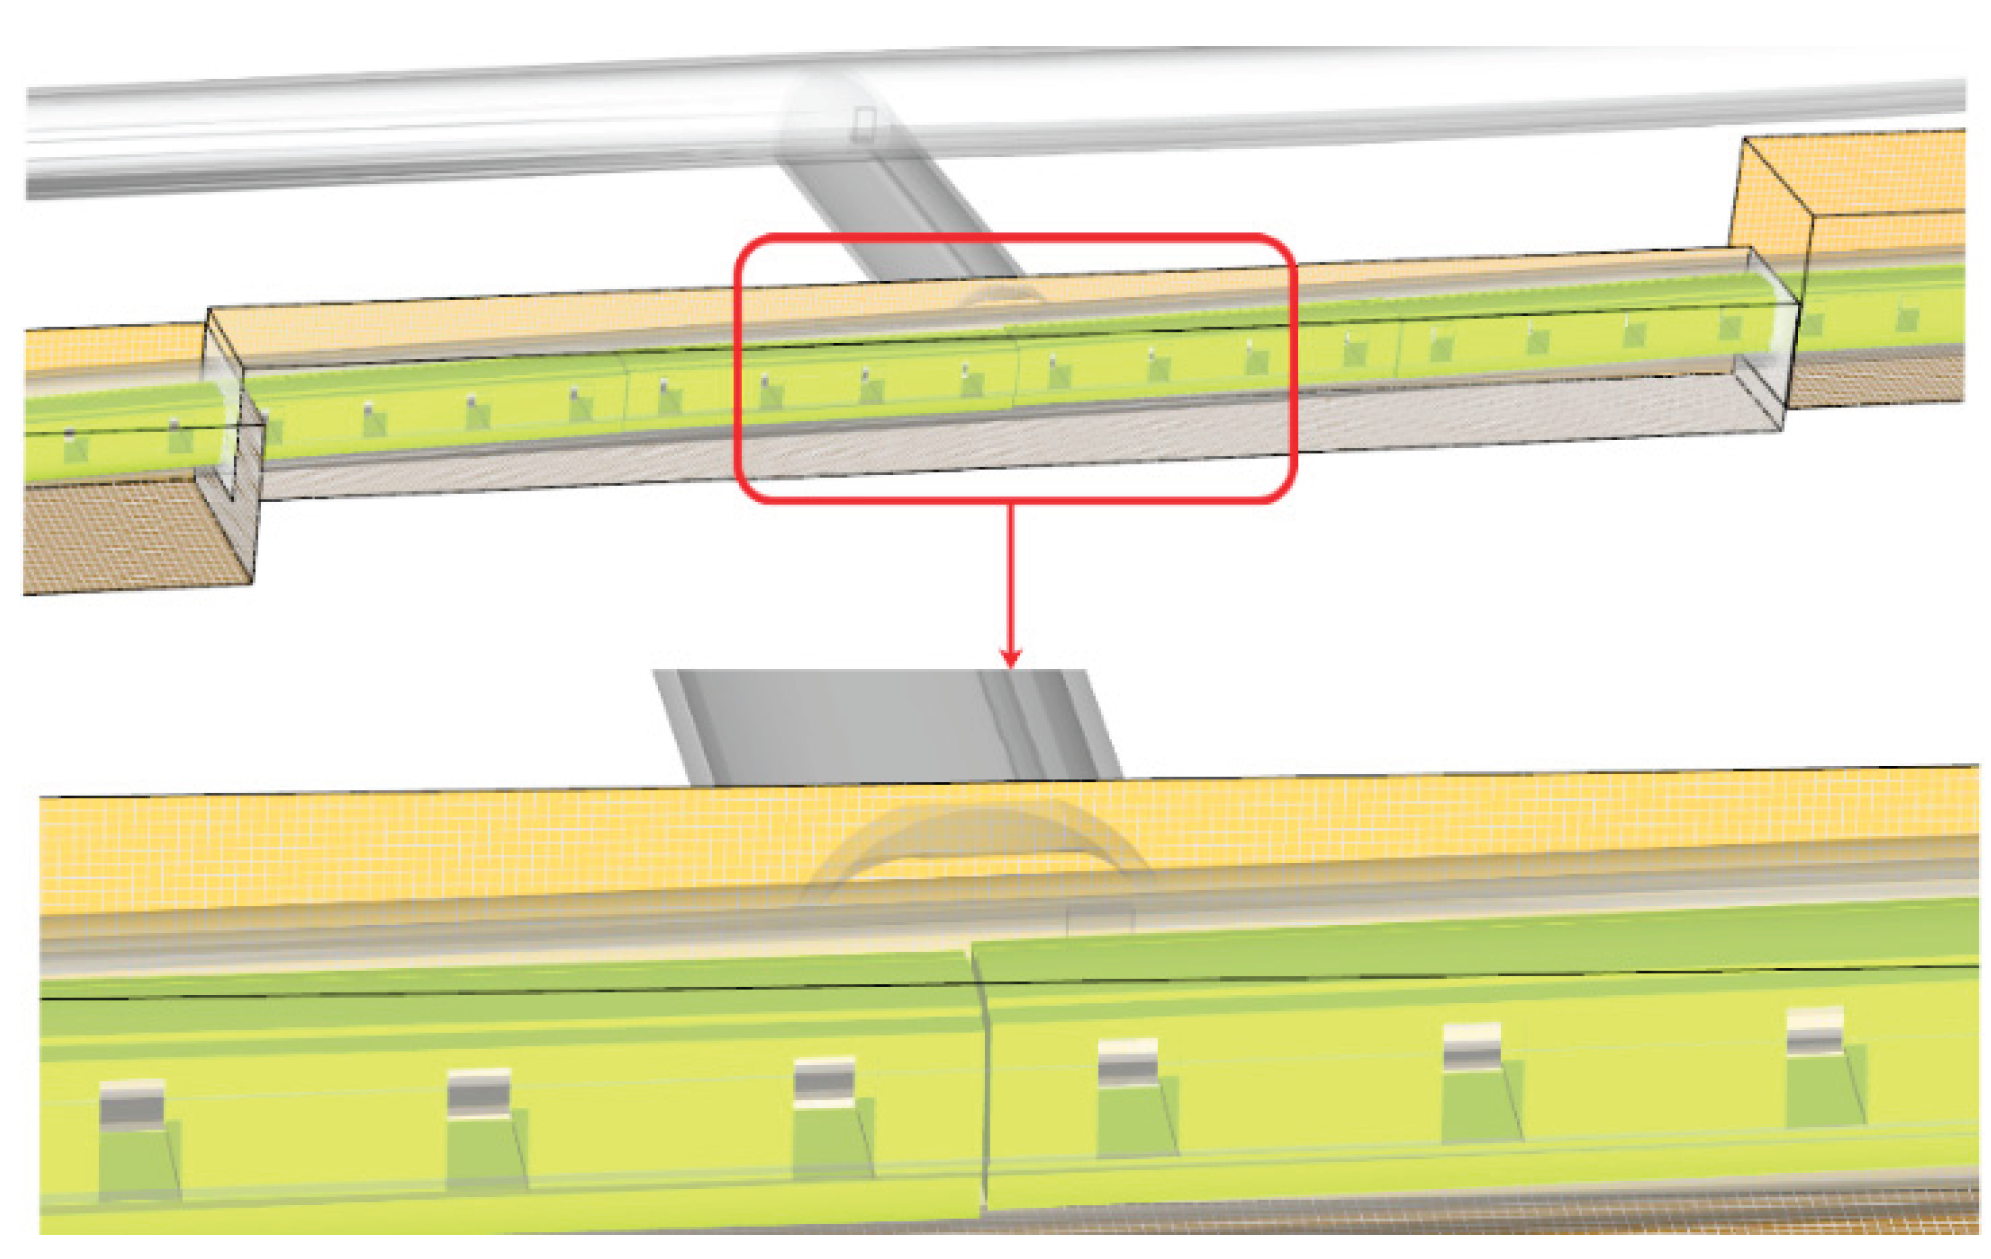
Figure 4.
Placement of sprinklers along the arch inside the tunnel.
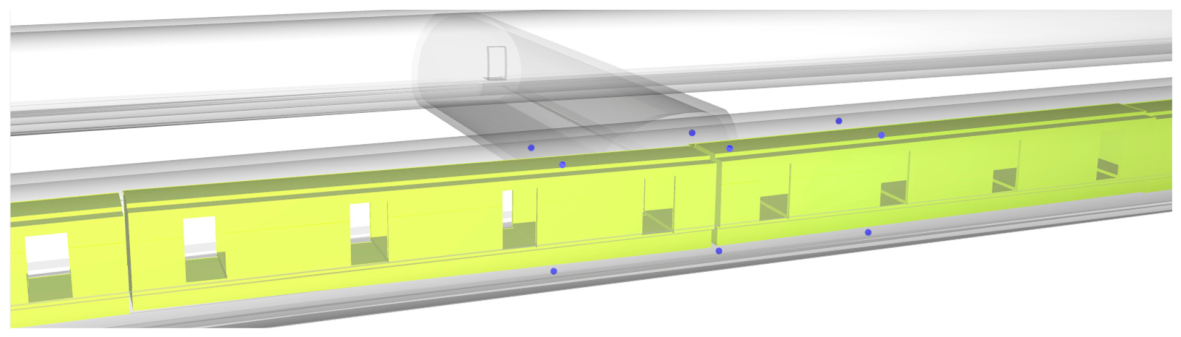
Figure 5.
Occupant evacuation and smoke dispersion patterns at A & B directions for SSE, DSE, and SSE-S configurations over time; a) t = 50 s, b) t = 150 s, c) t = 400 s, and d) t= 800 s.
Figure 5.
Occupant evacuation and smoke dispersion patterns at A & B directions for SSE, DSE, and SSE-S configurations over time; a) t = 50 s, b) t = 150 s, c) t = 400 s, and d) t= 800 s.
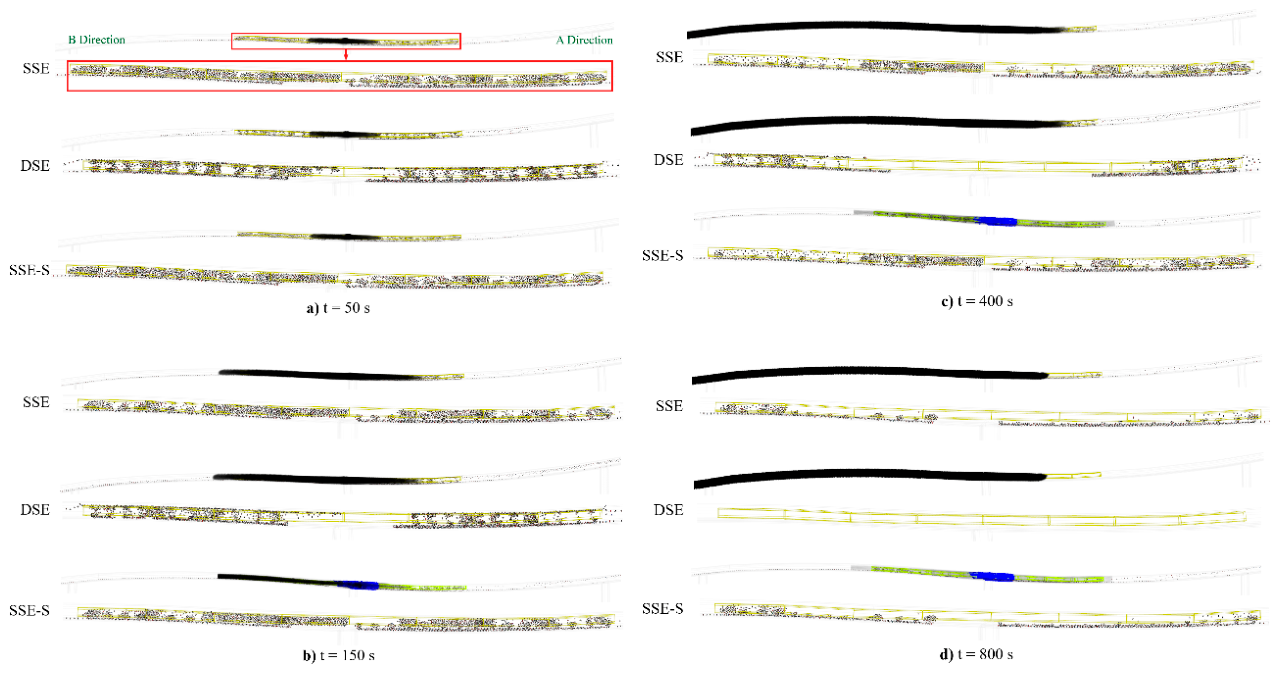
Figure 6.
(a) Soot visibility distribution over time for SSE, DSE, and SSE-S, (b) 60°C temperature layer for evacuation and fire scenarios.
Figure 6.
(a) Soot visibility distribution over time for SSE, DSE, and SSE-S, (b) 60°C temperature layer for evacuation and fire scenarios.
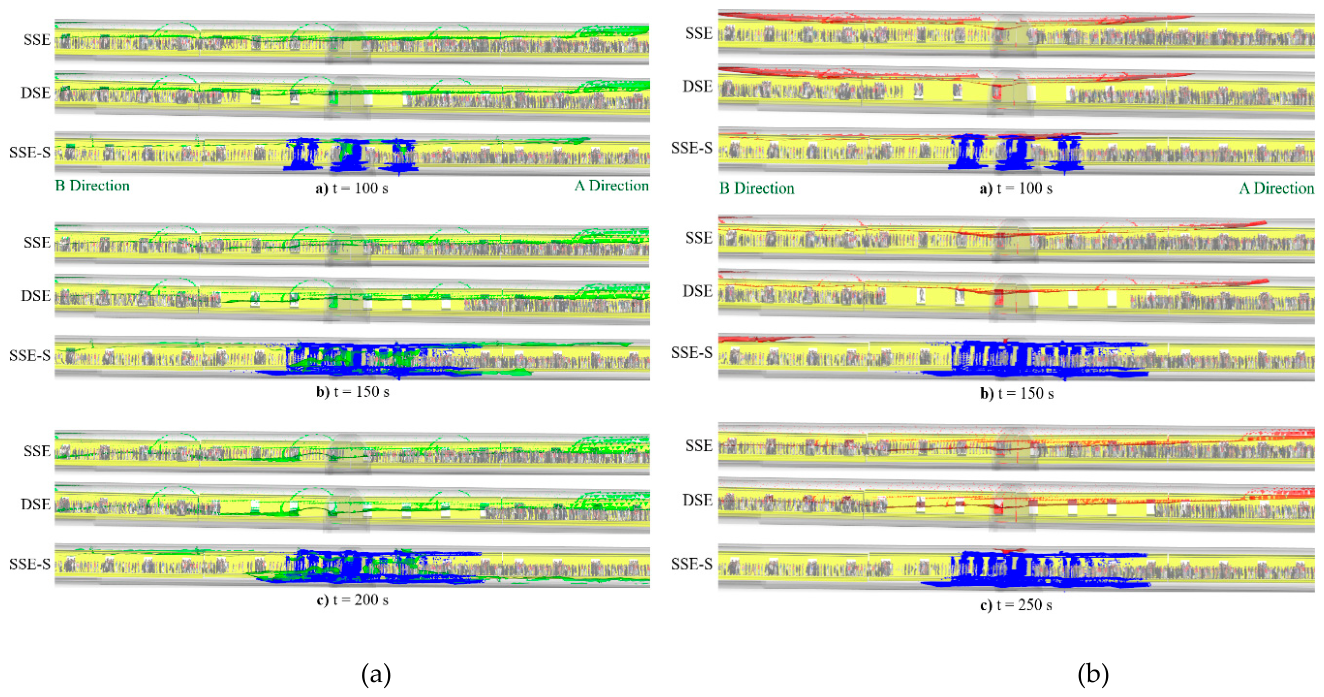
Figure 7.
CO 500 ppm layer distribution over time for SSE, DSE, and SSE-S evacuation and fire scenarios at a) t = 100 s, b) 250 s, and c) 400 s.
Figure 7.
CO 500 ppm layer distribution over time for SSE, DSE, and SSE-S evacuation and fire scenarios at a) t = 100 s, b) 250 s, and c) 400 s.
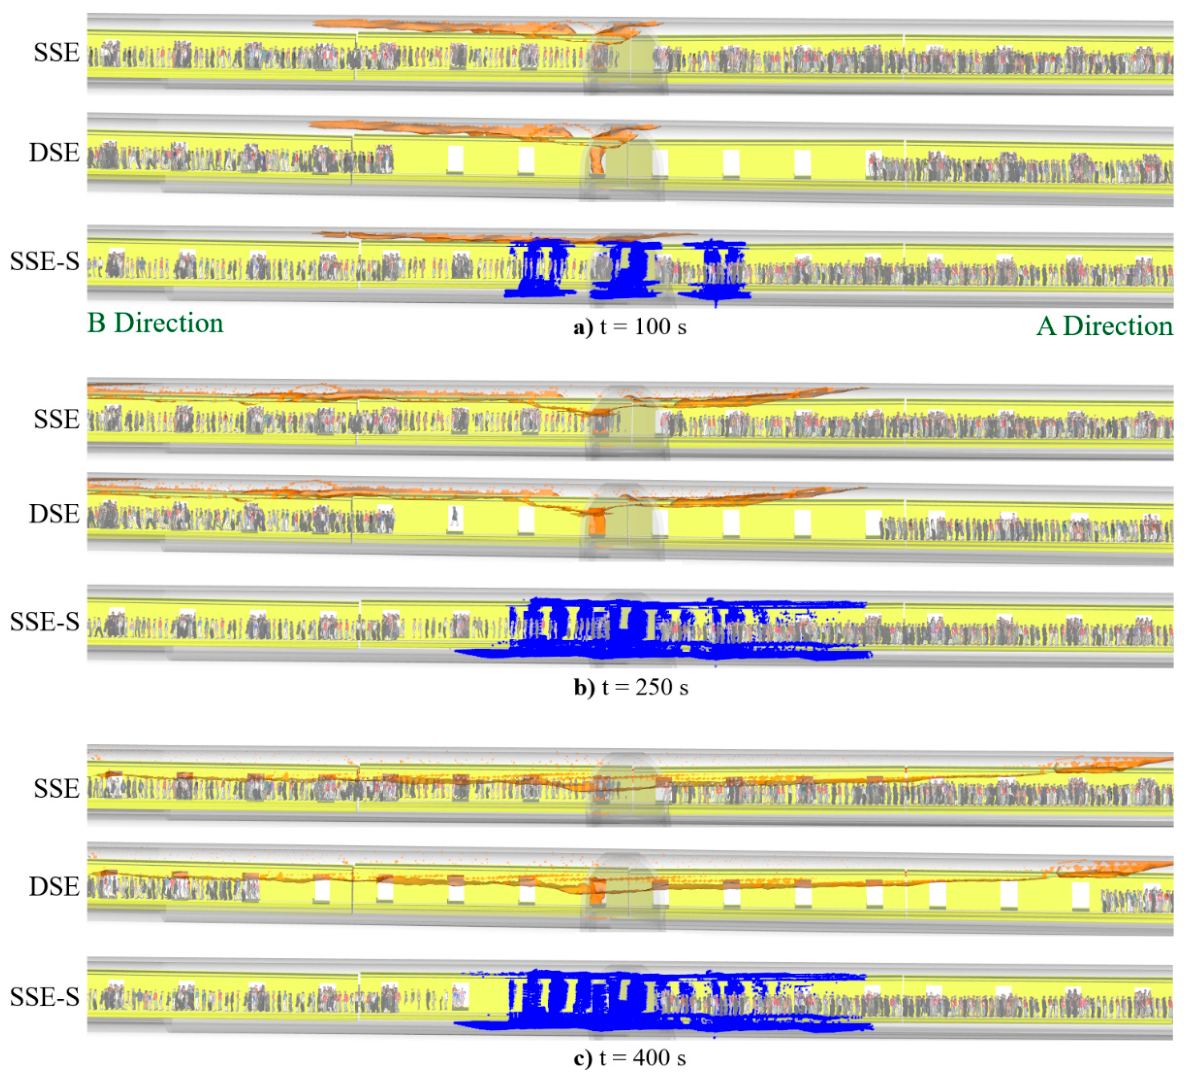
Figure 8.
Time-dependent variation of CO, CO2, and O2 volumetric fractions in A and B directions under different fire energy and fire growth rate scenarios.
Figure 8.
Time-dependent variation of CO, CO2, and O2 volumetric fractions in A and B directions under different fire energy and fire growth rate scenarios.
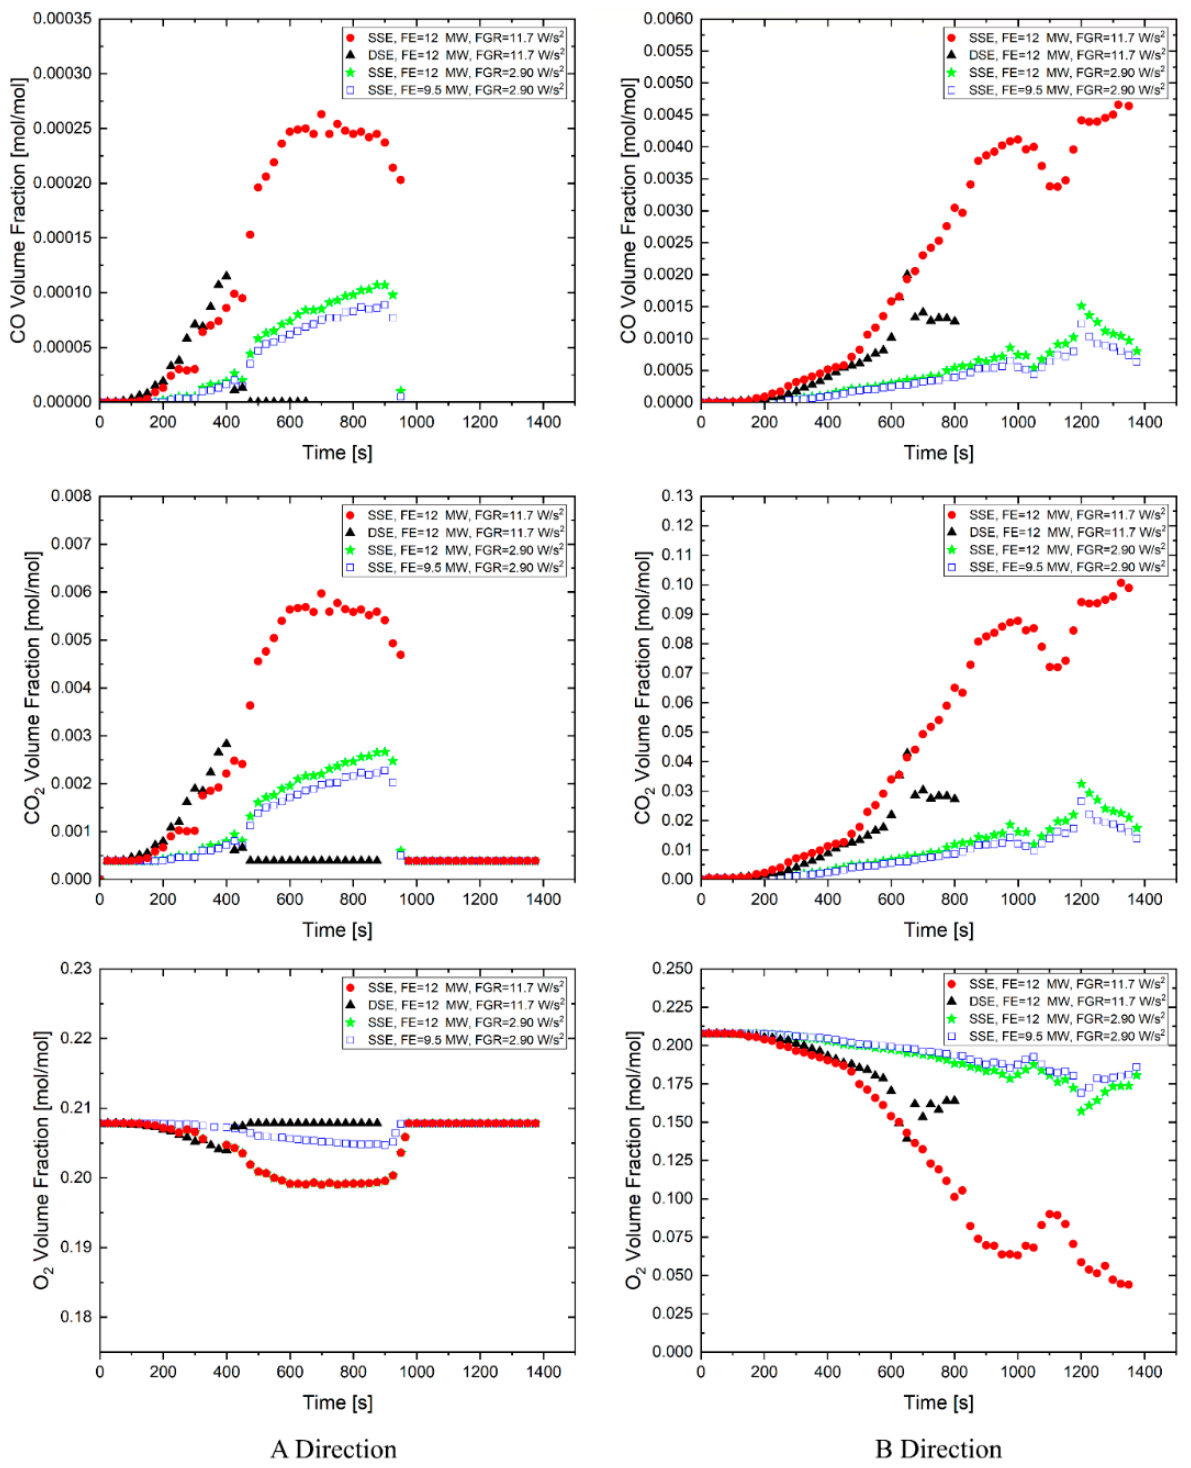
Figure 9.
Time-dependent variation of temperature and soot visibility in A and B directions under various fire scenarios.
Figure 9.
Time-dependent variation of temperature and soot visibility in A and B directions under various fire scenarios.
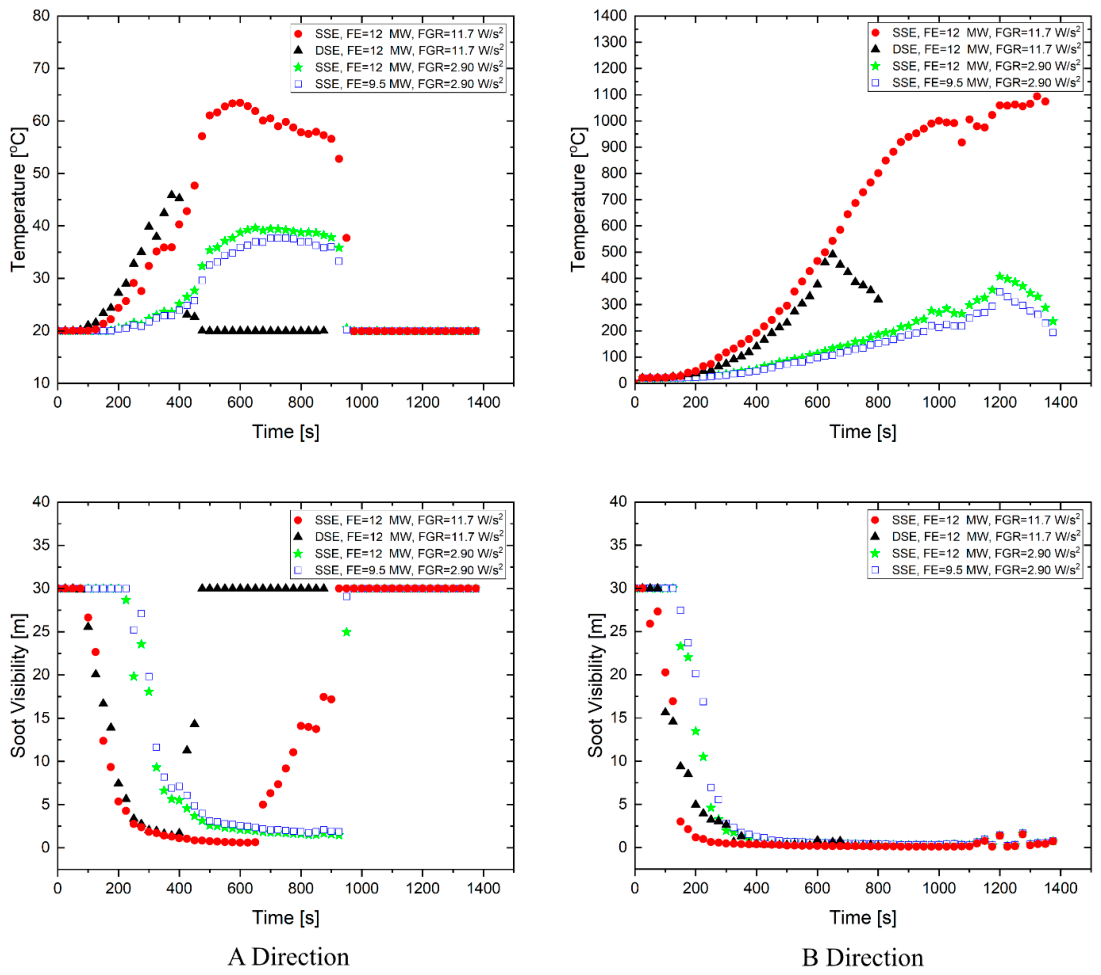
Figure 10.
Time-dependent FED data for the most smoke-exposed occupant in A and B directions in the CP3 region under different scenarios.
Figure 10.
Time-dependent FED data for the most smoke-exposed occupant in A and B directions in the CP3 region under different scenarios.
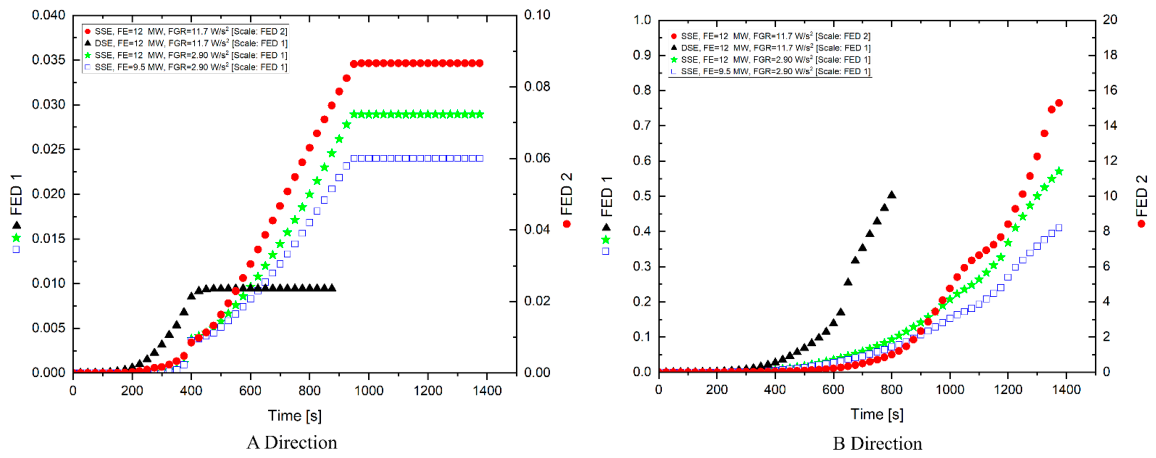

Table 1.
Threshold values for hazard types [51].
Table 1.
Threshold values for hazard types [51].
| Hazard type | Limit values | Exposure duration | ||
|---|---|---|---|---|
| 5 min | 15 min | 30 min | ||
| Thermal effects | Heat flux | 2.5 kW/m2 | 2.0 kW/m2 | 1.7 kW/m2 |
| Smoke temperature | 60°C | 50°C | 50°C | |
| Smoke obstruction | Visibility distance | 10-20 m | ||
| O2 deficiency | O2 concentration in air | > 14-16% | ||
| Toxic fire gases | CO-concentration | 500 ppm | 200 ppm | 100 ppm |
| CO2-concentration | 3% | 2% | 1% | |
Disclaimer/Publisher’s Note: The statements, opinions and data contained in all publications are solely those of the individual author(s) and contributor(s) and not of MDPI and/or the editor(s). MDPI and/or the editor(s) disclaim responsibility for any injury to people or property resulting from any ideas, methods, instructions or products referred to in the content. |
© 2026 by the authors. Licensee MDPI, Basel, Switzerland. This article is an open access article distributed under the terms and conditions of the Creative Commons Attribution (CC BY) license (http://creativecommons.org/licenses/by/4.0/).
Copyright: This open access article is published under a Creative Commons CC BY 4.0 license, which permit the free download, distribution, and reuse, provided that the author and preprint are cited in any reuse.


