

Submitted:
22 July 2026
Posted:
23 July 2026
You are already at the latest version
Abstract
Biofortification of permanent grasslands with selenium is a promising strategy for improving the nutritional quality of animal feed. This study assessed the effectiveness of foliar selenium biofortification in multi-species grass and legume mixtures as affected by application rate, application timing, and species composition. Three multi-species mixtures were treated with four application rates of a selenium preparation applied at two developmental stages. Selenium content in plant dry matter was determined, and treatment effects were evaluated using nonparametric statistical analyses. Application rate had a significant effect on selenium content. Selenium content increased progressively with increasing application rate, demonstrating a clear dose–response relationship, with the highest application rate resulting in the highest biofortification efficiency. However, neither plant developmental stage nor species composition significantly affected selenium accumulation (p > 0.05). These results demonstrate that foliar selenium biofortification is an effective approach for increasing selenium content in multi-species grass and legume mixtures. Application rate was identified as the primary factor determining biofortification efficiency. The absence of significant effects of application timing and species composition suggests that selenium enrichment can be achieved under a wide range of management conditions, making this approach a practical strategy for producing selenium-enriched forage.
Keywords:
selenium
; foliar biofortification
; permanent grassland
; multispecies forage mixtures
; micronutrient enrichment
; forage quality
1. Introduction
Permanent grasslands constitute a primary source of roughage for livestock, and their nutritional value depends not only on biomass yield and botanical composition of the sward but also on the content of mineral nutrients essential for maintaining proper physiological functions in animals [1]. Among the micronutrients determining feed quality , selenium (Se) plays a particularly important role. Its content in plants is directly influenced by selenium availability in the soil and by the ability of individual plant species to uptake, translocate, and accumulate this element [2].
In many regions of Europe, including Poland, soils are characterized by naturally low selenium availability [3]. This phenomenon is expected to intensify under ongoing climate change, including prolonged drought periods and an increasing frequency of heat waves [4]. Consequently, low soil selenium availability results in reduced selenium content in forage plants and increases the risk of selenium deficiency in animals consuming feed produced in these areas. This issue primarily affects ruminants, particularly cattle and sheep; however, it is also relevant in equine nutrition, where forage obtained from permanent grasslands constitutes the fundamental component of the diet. Insufficient selenium supply may lead to metabolic disorders, impaired immune response, reduced fertility, and decreased productive performance in animals [5].
Therefore, mineral supplementation is widely applied in livestock production; however, increasing attention is being paid to agronomic biofortification of forage plants, which aims to enhance selenium content at the stage of feed production. This approach may improve the biological value of forage in a more sustainable and natural manner while reducing the need for subsequent mineral supplementation of animals [6].
Among the available biofortification strategies, foliar application of selenium-containing formulations has attracted particular interest. Compared with soil fertilization, foliar selenium application enables rapid enrichment of plant biomass with this element while limiting selenium immobilization in the soil matrix and reducing losses associated with its low availability for root uptake [7,8].
The effectiveness of selenium (Se) biofortification is influenced by multiple factors, including the chemical form of selenium, the application method and dose, plant species, and the developmental stage at the time of application. Plant physiological status, selenium assimilation efficiency, potential phytotoxic effects, and biomass accumulation rate are considered key determinants of selenium uptake, translocation, and accumulation in harvested biomass [2,9].
Previous studies have demonstrated that plant species differ considerably in their response to foliar selenium application. However, the effectiveness of foliar selenium biofortification in multispecies grass–legume swards remain poorly understood. In particular, little is known about how botanical composition influences selenium uptake by individual sward components and, consequently, the overall selenium content in harvested forage [9]. Differences in species-specific selenium absorption and accumulation may substantially affect the efficiency of biofortification in mixed swards.
Furthermore, the timing of selenium application in relation to plant developmental stages is likely to play a critical role in determining biofortification efficiency. Identifying the optimal application stage is essential for maximizing selenium accumulation in forage while maintaining high biomass yield, forage quality, and selenium contents within safe limits for animal nutrition. Consequently, evaluating both selenium application timing and sward developmental stage is of considerable scientific and practical importance for developing effective biofortification strategies for forage production [11].
Although selenium biofortification has been extensively investigated in arable crops, particularly oilseed rape, cereals, and vegetable crops, research on multispecies grasslands composed of grasses and small-seeded legumes remains limited. To the best of our knowledge, no previous studies have comprehensively evaluated foliar selenium biofortification in this type of forage system. Therefore, the present study addresses an important knowledge gap by investigating the effectiveness of foliar selenium application in multispecies forage swards. The findings contribute to a broader understanding of selenium biofortification beyond conventional crop species and provide new insights into the development of effective biofortification strategies for forage production systems.
Despite extensive research on agronomic selenium (Se) biofortification, the agronomic factors that most strongly determine the effectiveness of selenium enrichment in multispecies forage swards remain poorly understood. In particular, it is unclear whether biofortification efficiency is primarily governed by the selenium application rate or whether the developmental stage of the sward at the time of application and the botanical composition of the forage mixture exert equally important effects. It also remains unknown whether increasing the selenium application rate results in a proportional increase in selenium accumulation in plant biomass or whether a threshold exists beyond which further increases in application rate provide diminishing returns. Addressing these research questions is of both scientific and practical importance, as it will improve our understanding of the factors governing selenium biofortification in permanent grasslands and provide an evidence-based foundation for developing precise and agronomically sound biofortification recommendations [10].
The development of optimized selenium biofortification strategies for forage mixtures has the potential to increase the mineral value of forage, improve animal health and welfare, and reduce the need for mineral supplementation in ruminant and equine production systems [12]. The present study was further motivated by practical concerns raised by horse breeders regarding the difficulty of achieving adequate selenium contents in forage produced from permanent grasslands.
The objective of this study was to identify the key factors determining the effectiveness of foliar selenium biofortification in multispecies grass–legume forage mixtures cultivated on permanent grasslands. Specifically, the effects of selenium application rate, sward developmental stage at the time of foliar application, and forage mixture composition on selenium content in plant dry matter were evaluated to identify application parameters that maximize biofortification efficiency. We hypothesized that selenium application rate would be the primary determinant of biofortification efficiency, whereas the developmental stage of the sward and the botanical composition of the forage mixture would act as modifying factors influencing the magnitude of the response. Furthermore, we hypothesized that an optimal selenium application rate could be identified that maximizes selenium accumulation while ensuring efficient use of the biofortification treatment.
2. Materials and Methods
2.1. Experimental Site
The field experiment was established in 2022 at the Experimental and Research Station of the University of Life Sciences in Lublin, located in Sosnowica, Poland (51°31′23.36″N, 23°04′15.65″E). The experiment was conducted on a light-textured mineral soil under permanent grassland. Before the experiment, the soil was slightly acidic (pH in 1 M KCl, 6.68), with a very high content of available potassium (483 mg kg⁻¹) and magnesium (370 mg kg⁻¹), and a moderate level of available phosphorus (5.43 mg 100 g⁻¹ soil).
Weather conditions differed among the study years (Table 1). The mean air temperature during the growing season (April–October) ranged from 14.1 °C in 2022 to 15.3 °C in 2023 and amounted to 14.4 °C and 14.9 °C in 2024 and 2025, respectively. In all years, growing-season temperatures were close to or slightly above the long-term average (13.9 °C). In contrast, growing-season precipitation showed marked interannual variability. Total rainfall during April–October ranged from 414 to 475 mm in 2022–2024, remaining close to the long-term average (423 mm). In 2025, however, precipitation declined to 189.2 mm, mainly due to exceptionally low rainfall in June, July, and August. These dry conditions were likely to limit plant growth and reduce selenium uptake by plants (Table 1).
2.2. Experimental Design
The experiment was conducted using a three-factor randomized block design with three replications. The experimental factors included:
- selenium dose: 0 (control), 0.5, 1.0 and 1.5 L ha⁻¹,
- sward height at selenium application: 10 cm and 15 cm,
- seed mixture: M1, M2 and M3 (Table 2).
Three feed mixtures differing in species composition and intended use were selected for the study. All mixtures were produced by DSV Seeds (Deutsche Saatveredelung). According to the manufacturer’s specifications, the M1 mixture – Country Horse H2118 is described as an overseeding mixture that improves old, thinned turf. It is highly resistant thanks to the use of various turf types, with a predominance of perennial ryegrass (Lolium perenne L.), ensuring rapid regeneration, and is intended for horse pastures. The M2 mixture – Country Horse H2120 Balance is described as a fructan-reduced mixture for horse meadows and to produce hay and silage under difficult conditions whereas the M3 mixture Pasture mixture is dedicated for cattle and contains white clover (Trifolium repens L.).
The mixtures were sown in experimental plots of 5.4 m², and samples were collected from an area of 1.1 m² for testing.
2.3. Plant Material and Selenium Application
For selenium biofortification, the JOSEK™ formulation (INTERMAG, Poland) was used. The product contained 53 g L⁻¹ selenium, 7 g L⁻¹ iodine, and 60 g L⁻¹ potassium and was specifically designed for foliar biofortification of plants. The selenium-containing formulation was applied according to the experimental design.
Regardless of the selenium biofortification treatment, all experimental plots received identical fertilization. In spring, a single application of Polifoska® 6 (NPK 6–20–30) fertilizer was applied at a dose of 200 kg ha⁻¹, providing 12 kg N, 17.5 kg P, and 49.8 kg K ha⁻¹. Additionally, nitrogen fertilization in the form of 34% ammonium nitrate was applied before each harvest at a dose of 31.5 kg N ha⁻¹. The total annual nitrogen dose was 75 kg N ha⁻¹. Fertilization was conducted according to recommended management practices for permanent grasslands to ensure optimal plant growth conditions and minimize the potential influence of basic nutrient deficiencies on the evaluated parameters.
Fertilization dose was divided into equal doses applied after each harvest.
2.4. Chemical Analyses
The plant material, collected from each plot from an area of 1.1 m², was dried to constant weight, homogenized, and subjected to microwave-assisted digestion in concentrated nitric acid (HNO₃, Suprapur, Merck). Selenium content was determined using inductively coupled plasma mass spectrometry (ICP-MS; Varian MS-820) at the Central Research Laboratory of the University of Life Sciences in Lublin. In total, selenium content was analyzed in 216 plant material samples.
The effectiveness of selenium biofortification was evaluated based on the increase in selenium content in plant dry matter relative to the untreated control and expressed as the percentage increase in selenium content following application of individual selenium treatment rates.
2.5. Statistical Analysis
Statistical analyses and data presentation were performed using open-source JASP software.
The distribution of selenium content values was assessed using the Kolmogorov–Smirnov test with Lilliefors correction. As the assumption of normality was not met, group differences were analysed using the nonparametric Kruskal–Wallis one-way analysis of variance by ranks. When the overall test was significant, post hoc pairwise comparisons were conducted using Dunn’s test with Bonferroni correction to control for multiple comparisons. The adjusted significance threshold was determined according to the number of pairwise comparisons performed.
Effect sizes for the Kruskal–Wallis test were estimated using rank eta squared (rank η²). Statistical significance was set at p < 0.05 unless otherwise specified.
As a non-native English speakers, we used AI-based language assistance solely to improve the clarity and readability of this manuscript. We take full responsibility for the content of the manuscript, the conceptual background, the obtained results, and their interpretation.
3. Results
3.1. Dose Effect
To determine whether selenium contents were normally distributed, the Kolmogorov–Smirnov test with Lilliefors correction was performed. The results indicated that the data deviated significantly from a normal distribution (D = 0.251, p < 0.001).
Accordingly, subsequent analyses were conducted using the nonparametric Kruskal–Wallis test. The analysis revealed a significant main effect of dose, H(3) = 24.53, p < 0.001, rank η² = 0.11.
Post hoc pairwise comparisons were performed using Dunn’s test with Bonferroni correction for multiple comparisons. Selenium contents were significantly higher following the 1.5 dose than in the control condition (dose 0). Likewise, the 1.0 dose resulted in significantly higher selenium contents than the control condition (Table 3 ).
Figure 1 shows empirical comparison of selenium content depending on the fertilizer dose.
The effectiveness of biofortification increased with higher application rates of the preparation. Compared with the control treatment, the application of 0.5 L·ha⁻¹ increased the mean selenium content in plant dry matter by 0.042 mg kg⁻¹ DM, corresponding to a 120% increase. Increasing the application rate to 1.0 L·ha⁻¹ resulted in an increase of 0.051 mg kg⁻¹ DM (145.71%), whereas the highest application rate (1.5 L ha⁻¹) produced the greatest increase in selenium content, reaching 0.080 mg kg⁻¹ DM, representing a 228.57% increase relative to the control. These results demonstrate a clear dose–response relationship, confirming the progressive improvement in biofortification efficiency with increasing application rates of the preparation (Table 4).
3.2. The Effect of Sward Height During Selenium Application
Kruskall-Wallis test for the stages of plant development as an independent factor showed non-significant effect: H(1) = 0.18, p = 0.669, rank η² > 0.01 (Figure 2).
Results lacked significant differences in selenium accumulation between the developmental stages examined suggests that fertilizer application timing did not significantly influence this parameter under the conditions of the present study. The plants exhibited a similar capacity for selenium accumulation irrespective of the timing of fertilizer application.
3.3. Seeds Mixture Effect
There was also no statistically significant effect for the type of mixture: H(1) = 0.87, p = 0.648, rank η² > 0.01 (Figure 3).
No significant interaction effects were detected among the experimental factors (p > 0.05), indicating that the response to increasing application rates was consistent across developmental stages and species compositions. Collectively, these findings suggest that the effectiveness of selenium biofortification was driven predominantly by the applied rate, while the remaining factors did not significantly modulate the biofortification response. Despite the absence of statistically significant differences, mixture M3 displayed a subtly distinct pattern of selenium accumulation relative to the other mixtures.
4. Discussion
4.1. Application Rate as the Primary Determinant of Biofortification Efficiency
The conducted study demonstrated that, among the evaluated factors, including the application rate of the selenium-containing preparation, plant developmental stage, and species composition of the mixture, only the applied selenium dose exerted a significant effect on this element concentration in the dry matter of grass–legume mixtures.
Comparable relationships have been reported in numerous studies investigating agronomic biofortification strategies. A substantial body of evidence indicates that the magnitude of the biofortification response is primarily governed by the applied selenium dose and the chemical form of selenium used, whereas the contribution of other factors is generally of secondary importance [11,13]. The predominant role of application rate can be attributed to the fact that the amount of selenium available for foliar uptake directly determines the intensity of selenium translocation, assimilation, and subsequent accumulation within plant tissues [14,15].
4.2. Optimization of Selenium Formulation Rate for the Biofortification of Forage Mixtures
In the present study, the effectiveness of biofortification improved progressively with higher application rates of the selenium-containing formulation, confirming the existence of a clear dose–response relationship.
Successive increases in the applied rate resulted in a systematic rise in selenium concentration in the dry matter of the plants. However, the absence of significant differences between the 1.0 and 1.5 L·ha⁻¹ rates indicates that further increases in formulation input no longer resulted in a statistically confirmed enhancement of selenium accumulation.
A similar response pattern has been described in other studies, demonstrating that plant responses to increasing selenium supply do not exhibit an unlimited linear relationship. Once a threshold level of selenium availability within the plant system is reached, further increases in selenium application do not translate into a proportional increase in tissue selenium concentration. This phenomenon is associated with physiological mechanisms regulating selenium uptake, translocation, assimilation, and metabolism [13,15].
The application rate of 1.0 L·ha⁻¹ resulted in a high level of selenium enrichment in plant biomass, comparable to that achieved with the 1.5 L·ha⁻¹ rate. These results indicate that increasing the formulation rate above 1.0 L·ha⁻¹ does not provide significant additional benefits for biofortification efficiency. From an agronomic perspective, the use of the 1.0 L·ha⁻¹ rate appears to be the most justified approach, as it enables a reduction in formulation consumption while maintaining the effectiveness of the biofortification treatment.
The effectiveness of biofortification improved progressively with higher application rates of the selenium-containing formulation, confirming the existence of a clear dose–response relationship.
4.3. The Role of Species Composition in Forage Mixtures
The species composition of the mixtures did not significantly affect the effectiveness of selenium biofortification, indicating that under the conditions of the present experiment, potential interspecific differences in selenium uptake capacity were not sufficiently pronounced to influence the final selenium concentration in mixture biomass [15,16]. The lack of significant differences among the evaluated mixtures and the absence of interaction between selenium formulation rate and species composition indicate that the applied biofortification strategy showed comparable effectiveness regardless of the botanical composition of the sward. Although the differences were not statistically significant, a tendency towards higher selenium concentration was observed in the mixture containing Trifolium repens L.
Previous studies have reported a higher selenium accumulation capacity in some legume species; however, the magnitude of this effect depends on species proportion within the sward, selenium application rate, and environmental conditions [9,16]. Differences between previous findings and the results obtained in the present study may also be related to methodological approaches. Most earlier studies investigated individual plant species, whereas the current experiment evaluated multispecies forage mixtures. In such systems, the final selenium concentration in biomass is determined not only by the species-specific capacity for selenium uptake and accumulation but also by the relative contribution of individual species to the total biomass [14,16]. Therefore, the potentially greater selenium accumulation capacity of Trifolium repens L. may have been partially masked by the dominant contribution of grass species in the mixtures, which could explain the lack of significant differences among the evaluated mixtures [2].
These results do not exclude the existence of physiological differences among plant species; however, under the conditions of the present experiment, their effect was considerably smaller than that of selenium application rate. This suggests that, when developing biofortification strategies for permanent grasslands, optimization of selenium application rates should be considered a priority, whereas moderate differences in botanical composition of forage mixtures are likely to play a secondary role.
4.4. The Importance of Application Timing
No significant effect of sward developmental stage, expressed as plant height of 10 and 15 cm, on selenium concentration in the dry matter of the mixtures was observed. This indicates that within the evaluated growth period, the effectiveness of foliar selenium biofortification remained at a comparable level regardless of application timing.
It can be assumed that the differences between the analyzed growth stages were too small to substantially affect the capacity of plants for foliar selenium uptake. At both application dates, plants were in a period of intensive vegetative growth, characterized by high physiological activity and a sufficiently developed assimilatory surface, which may have supported efficient uptake of foliar-applied nutrients.
Similar observations have been reported in studies on foliar biofortification, where it has been emphasized that the effectiveness of such treatments is influenced to a greater extent by selenium chemical form, formulation properties, and meteorological conditions during application than by minor differences in plant phenological stage [14,17].
Limitations
The study was conducted under field conditions, where selenium availability and plant uptake may have been influenced by variable meteorological and soil conditions, as well as by temporal changes in sward botanical composition resulting from the emergence of spontaneous species and competition from weeds.
It should also be noted that the obtained results refer exclusively to two closely related developmental stages of the sward, represented by plant heights of 10 and 15 cm. Therefore, it cannot be excluded that a wider range of plant developmental stages could reveal a more pronounced effect of application timing on biofortification efficiency.
5. Conclusion
The present study provided insight into the relative contribution of key agronomic factors determining the effectiveness of foliar selenium biofortification in multispecies grass–legume mixtures established on permanent grasslands. Among the evaluated factors, selenium application rate represented the predominant driver of selenium accumulation in plant biomass, whereas differences in species composition and application timing, within the investigated range of sward development (10–15 cm plant height), did not significantly modify the biofortification response. The application of 1.0 L·ha⁻¹ of the selenium-containing formulation resulted in biomass selenium enrichment comparable to that achieved with the higher rate of 1.5 L·ha⁻¹, demonstrating that increased formulation input does not necessarily translate into a proportional improvement in biofortification efficiency. These findings highlight the importance of optimizing selenium application rates as a key component of sustainable biofortification strategies for permanent grassland management and provide a basis for further refinement of agronomic practices aimed at enhancing selenium concentration in forage biomass.
Author Contributions
Conceptualization, A.K. H.L.; methodology, M.K., H.L.; software, E.K..; validation, M.K, H.L.; formal analysis, E.K., H.L; investigation, E.K., M.K.; resources, E.K., A.K.; data curation, E.K.; writing—original draft preparation, H.L., E.K; writing—review and editing, E.K., M.K.; visualization, E.K.; supervision, M.K., H.L.; project administration, M.K.; funding acquisition, E.K. All authors have read and agreed to the published version of the manuscript.
Funding
This research was funded by Doctoral School of University of Life Sciences, grant number SD.WRŁ.26.098 RiO.
Institutional Review Board Statement
Not applicable.
Acknowledgments
During the preparation of this manuscript, the authors – being a non-native English speakers – used ChatGPT improve the clarity and readability of this manuscript. The authors have reviewed and edited the output and take full responsibility for the content of this publication.
Conflicts of Interest
The authors declare no conflicts of interest.
References
- Wróbel, B.; Zielewicz, W.; Paszkiewicz-Jasińska, A. Improving Forage Quality from Permanent Grasslands to Enhance Ruminant Productivity. Agriculture 2025, 15(13), 1438. [Google Scholar] [CrossRef]
- Hall, J.A.; Bobe, G.; Filley, S.J.; Pirelli, G.J.; Bohle, M.G.; Wang, G.; Davis, T.Z.; Bañuelos, G.S. Effects of Amount and Chemical Form of Selenium Amendments on Forage Selenium Concentrations and Species Profiles. Biol. Trace Elem. Res. 2023, 201, 4951–4960. [Google Scholar] [CrossRef] [PubMed]
- Yang, H.; Yang, X.; Ning, Z.; Kwon, S.Y.; Li, M.L.; Tack, F.M.G.; Kwon, E.E.; Rinklebe, J.; Yin, R. The beneficial and hazardous effects of selenium on the health of the soil-plant-human system: An overview. J. Hazard. Mater. 2022, 422, 126876. [Google Scholar] [CrossRef] [PubMed]
- Jones, G.D.; Droz, B.; Greve, P.; Gottschalk, P.; Poffet, D.; McGrath, S.P.; Seneviratne, S.I.; Smith, P.; Winkel, L.H.E. Selenium deficiency risk predicted to increase under future climate change. Proc. Natl. Acad. Sci. 2017, 114, 2848–2853. [Google Scholar] [CrossRef] [PubMed]
- Moulick, D.; Mukherjee, A.; Das, A.; Roy, A.; Majumdar, A.; Dhar, A.; Pattanaik, B.K.; Chowardhara, B.; Ghosh, D.; Upadhyay, M.K.; Yadav, P.; Hazra, S.; Sarkar, S.; Mahanta, S.; Santra, S.C.; Choudhury, S.; Maitra, S.; Mishra, U.N.; Bhutia, K.L.; Skalicky, M.; Obročník, O.; Bárek, V.; Brestic, M.; Hossain, A. Selenium – An Environmentally Friendly Micronutrient in Agroecosystem in the Modern Era: An Overview of 50-Year Findings. Ecotoxicol. Environ. Saf. 2024, 270, 115832. [Google Scholar] [CrossRef] [PubMed]
- Lyons, G. Biofortification of Cereals with Foliar Selenium and Iodine Could Reduce Hypothyroidism. Front. Plant Sci. 2018, 9, 730. [Google Scholar] [CrossRef] [PubMed]
- Duborská, E.; Šebesta, M.; Matulová, M.; Zvěřina, O.; Urík, M. Current Strategies for Selenium and Iodine Biofortification in Crop Plants. Nutrients 2022, 14, 4717. [Google Scholar] [CrossRef] [PubMed]
- Galić, L.; Vinković, T.; Ravnjak, B.; Lončarić, Z. Agronomic Biofortification of Significant Cereal Crops with Selenium – A Review. Agronomy 2021, 11, 1015. [Google Scholar] [CrossRef]
- Hossain, A.; Skalický, M.; Brestič, M.; Maitra, S.; Sarkar, S.; Ahmad, Z.; Vemuri, H.; Garai, S.; Mondal, M.; Bhatt, R. Selenium Biofortification: Roles, Mechanisms, Responses and Prospects. Molecules 2021, 26(4), 881. [Google Scholar] [CrossRef] [PubMed]
- Fernández, V.; Sotiropoulos, T.; Brown, P.H. (Eds.) Foliar formulations and application technology. In Foliar Fertilization: Scientific Principles and Field Practices; International Fertilizer Industry Association (IFA): Paris, France, 2013. [Google Scholar]
- Singh, M.; Yadav, M.; Singh, C.; Poonia, P.; Chauhan, J.; Kumawat, G.; Singhal, R.K.; Ahmed, S.; Iqbal, M.A.; Ayman El Sabagh, A. Selenium Enrichment in Forage Crops: Potential and Prospects. In Selenium in Sustainable Agriculture: A Soil to Spoon Prospective. Environmental Science and Engineering.; Moulick, D., Choudhury, S. Springer, Eds.; Cham, 2025. [Google Scholar] [CrossRef]
- Wang, G.; Bobe, G.; Filley, S. J.; Pirelli, G. J.; Bohle, M. G.; Davis, T. Z.; Bañuelos, G. L.; Hall, J. A. Effects of springtime sodium selenate foliar application and NPKS fertilization on selenium concentrations and selenium species in forages across Oregon. Anim. Feed Sci. Technol. 2021, 276, 114944. [Google Scholar] [CrossRef]
- Izydorczyk, G.; Ligas, B.; Mikula, K.; Witek-Krowiak, A.; Moustakas, K.; Chojnacka, K. Biofortification of edible plants with selenium and iodine – A systematic literature review. Sci. Total Environ. 2021, 754, 141983. [Google Scholar] [CrossRef] [PubMed]
- White, P.J. Selenium metabolism in plants. Biochim. Biophys. Acta Gen. Subj. 2018, 1862, 2333–2342. [Google Scholar] [CrossRef] [PubMed]
- Schiavon, M.; Pilon-Smits, E.A.H. The Fascinating Facets of Plant Selenium Accumulation—Biochemistry, Physiology, Evolution and Ecology. New Phytol. 2017, 213, 1582–1596. [Google Scholar] [CrossRef]
- Zhou, X.; Yang, J.; Kronzucker, H.J.; Shi, W. Selenium Biofortification and Interaction with Other Elements in Plants: A Review. Front. Plant Sci. 2020, 11, 586421. [Google Scholar] [CrossRef] [PubMed]
- Hall, J.A.; Bobe, G.; Filley, S.J.; Bohle, M.G.; Pirelli, G.J.; Wang, G.; Davis, T.Z.; Bañuelos, G.S. Impact of selenium biofortification on production characteristics of forages grown following standard management practices in Oregon. Front. Plant Sci. 2023, 14, 1121605. [Google Scholar] [CrossRef] [PubMed]
- Szerement, J.; Szatanik-Kloc, A.; Mokrzycki, J.; Mierzwa-Hersztek, M. Agronomic Biofortification with Se, Zn, and Fe: An Effective Strategy to Enhance Crop Nutritional Quality and Stress Defense—A Review. J. Soil Sci. Plant Nutr. 2022, 22, 1129–1159. [Google Scholar] [CrossRef]
- Trippe, R.C., III; Pilon-Smits, E.A.H. Selenium transport and metabolism in plants: Phytoremediation and biofortification implications. J. Hazard. Mater. 2021, 404, 124178. [Google Scholar] [CrossRef] [PubMed]
Figure 1.
Raincloud plots and box-plots showing empirical distribution of selenium content for four individual fertilizer doses. Statistical significance effects: ** p < 0.05; *** p < 0.001. Note. Letters A-D represent the following doses: A – 0.0 L·ha⁻¹, B – 0.5 L·ha⁻¹, C – 1.0 L·ha⁻¹, D – 1,5 L·ha⁻¹.
Figure 1.
Raincloud plots and box-plots showing empirical distribution of selenium content for four individual fertilizer doses. Statistical significance effects: ** p < 0.05; *** p < 0.001. Note. Letters A-D represent the following doses: A – 0.0 L·ha⁻¹, B – 0.5 L·ha⁻¹, C – 1.0 L·ha⁻¹, D – 1,5 L·ha⁻¹.
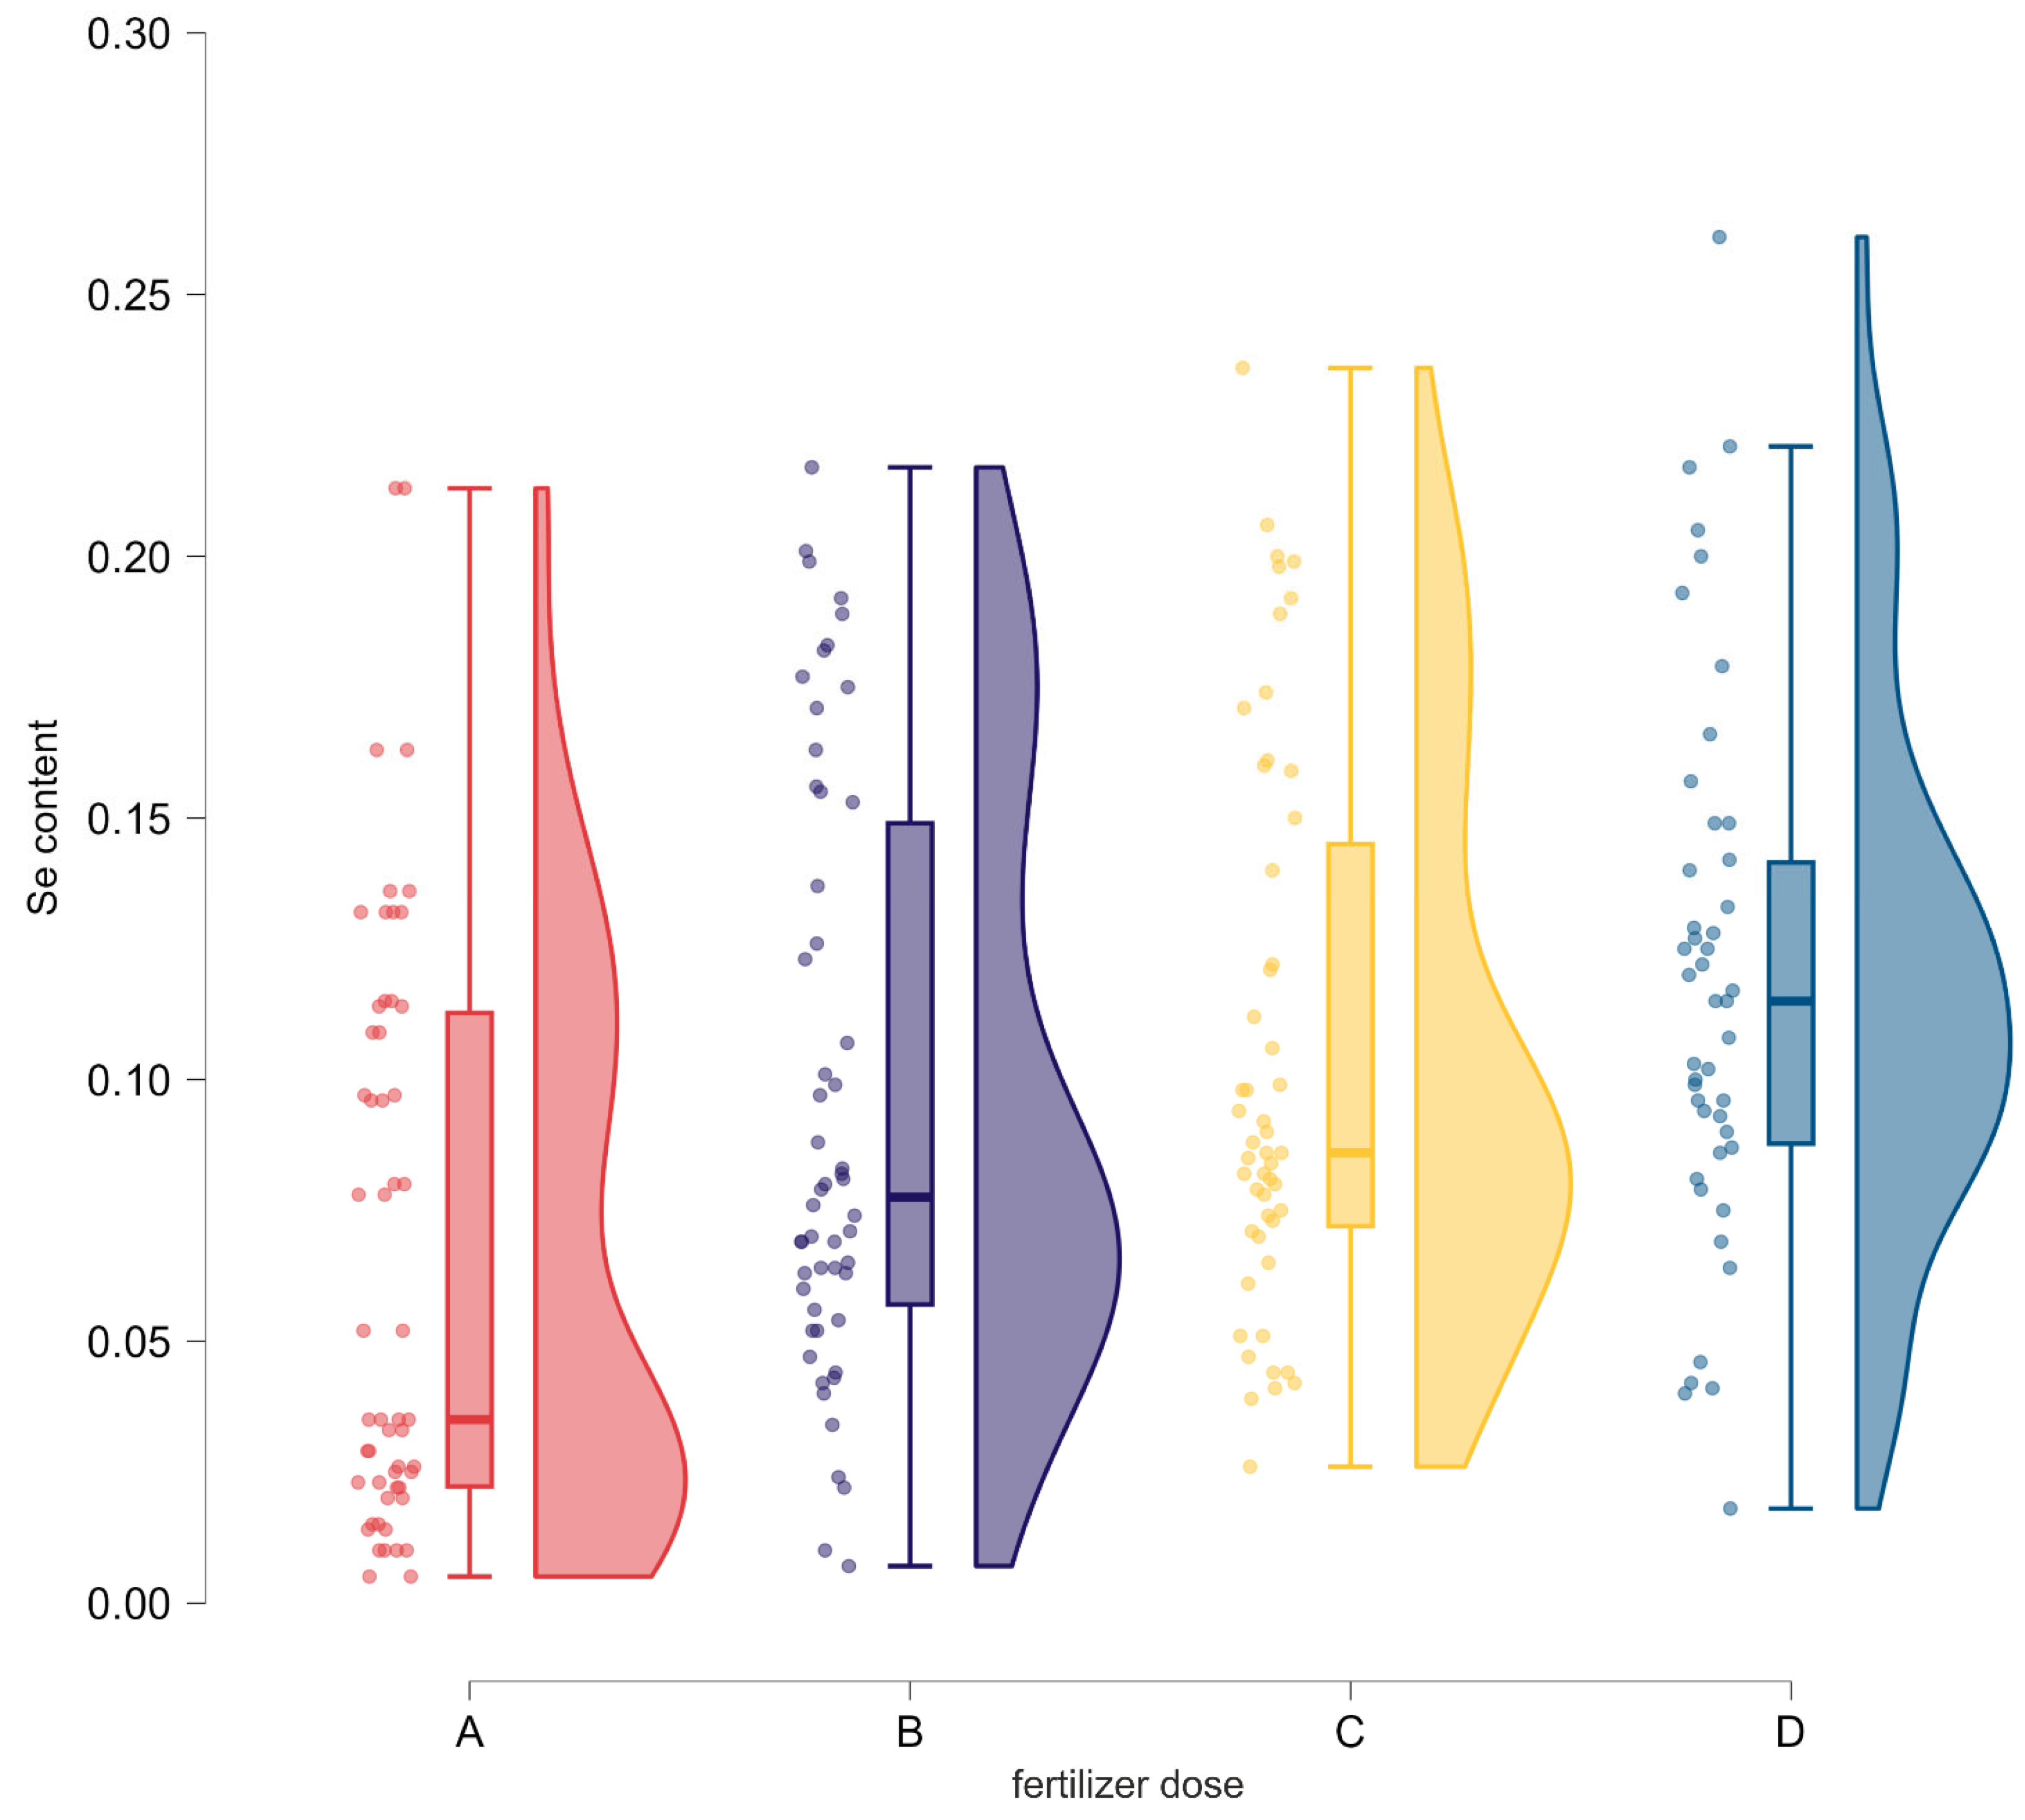
Figure 2.
Raincloud plots and box-plots showing empirical distribution of selenium content for two stages of plant development.
Figure 2.
Raincloud plots and box-plots showing empirical distribution of selenium content for two stages of plant development.
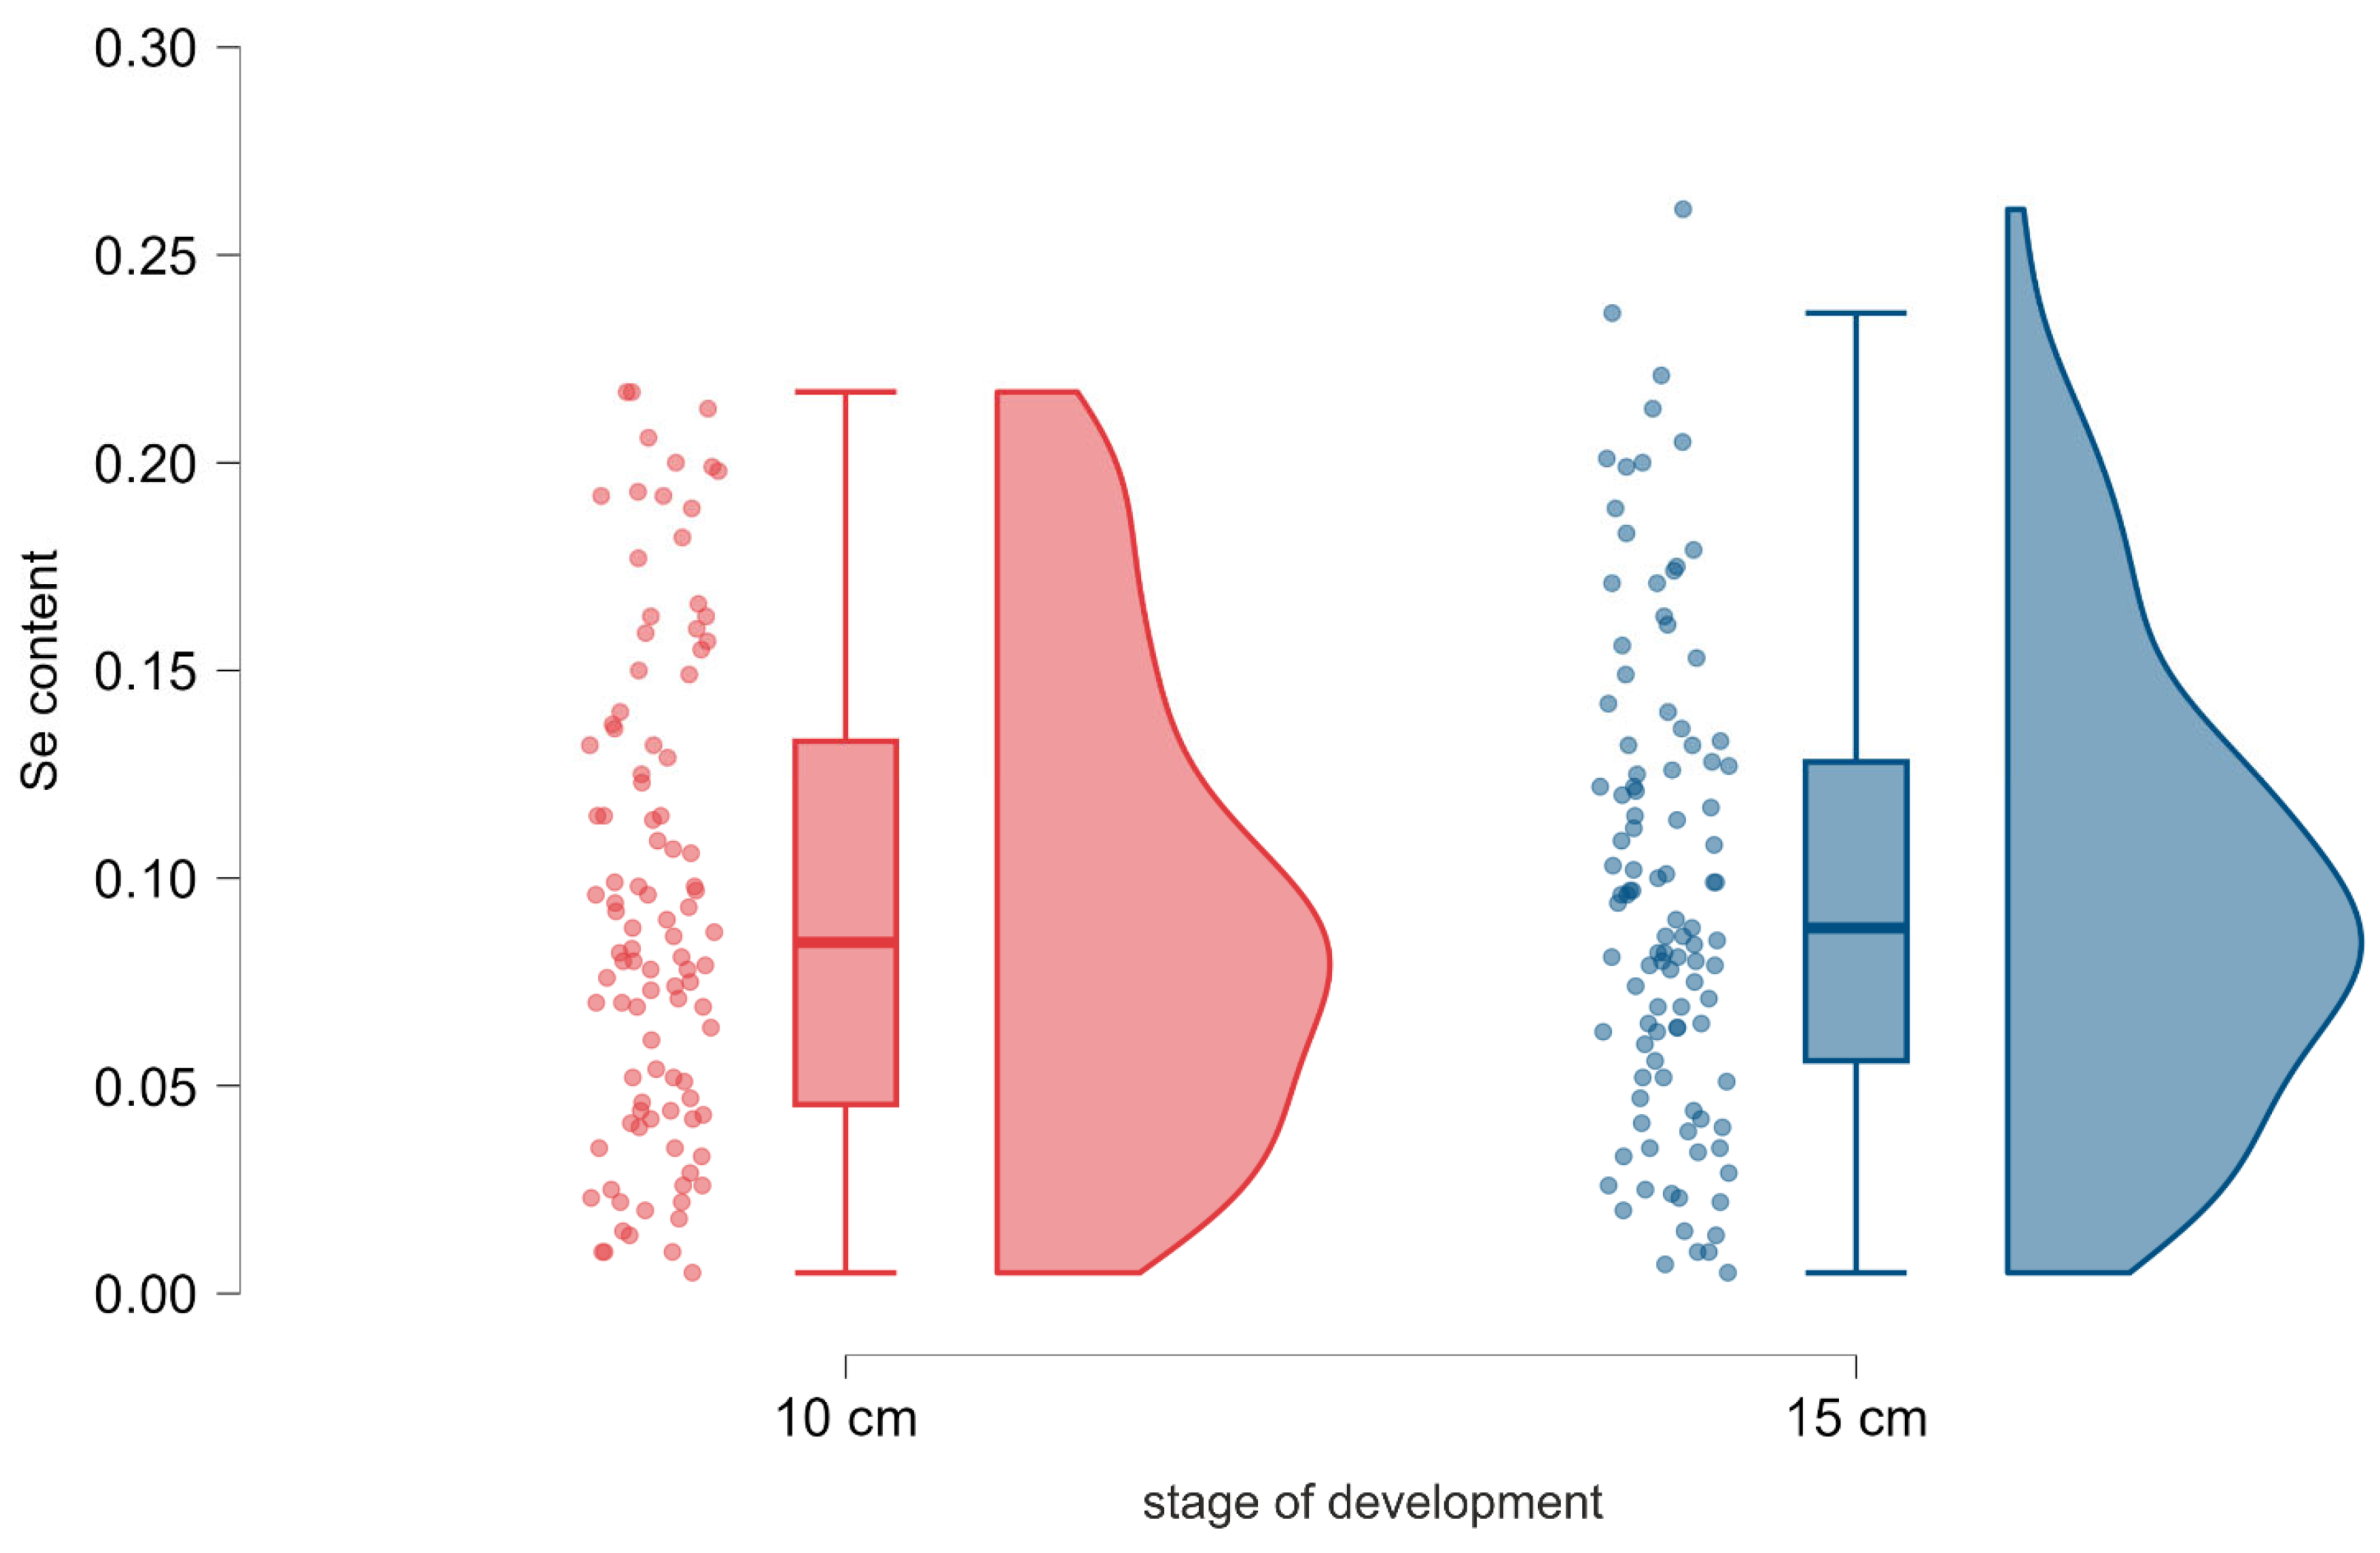
Figure 3.
Raincloud plots and box-plots showing empirical distribution of selenium content for three types of mixture.
Figure 3.
Raincloud plots and box-plots showing empirical distribution of selenium content for three types of mixture.
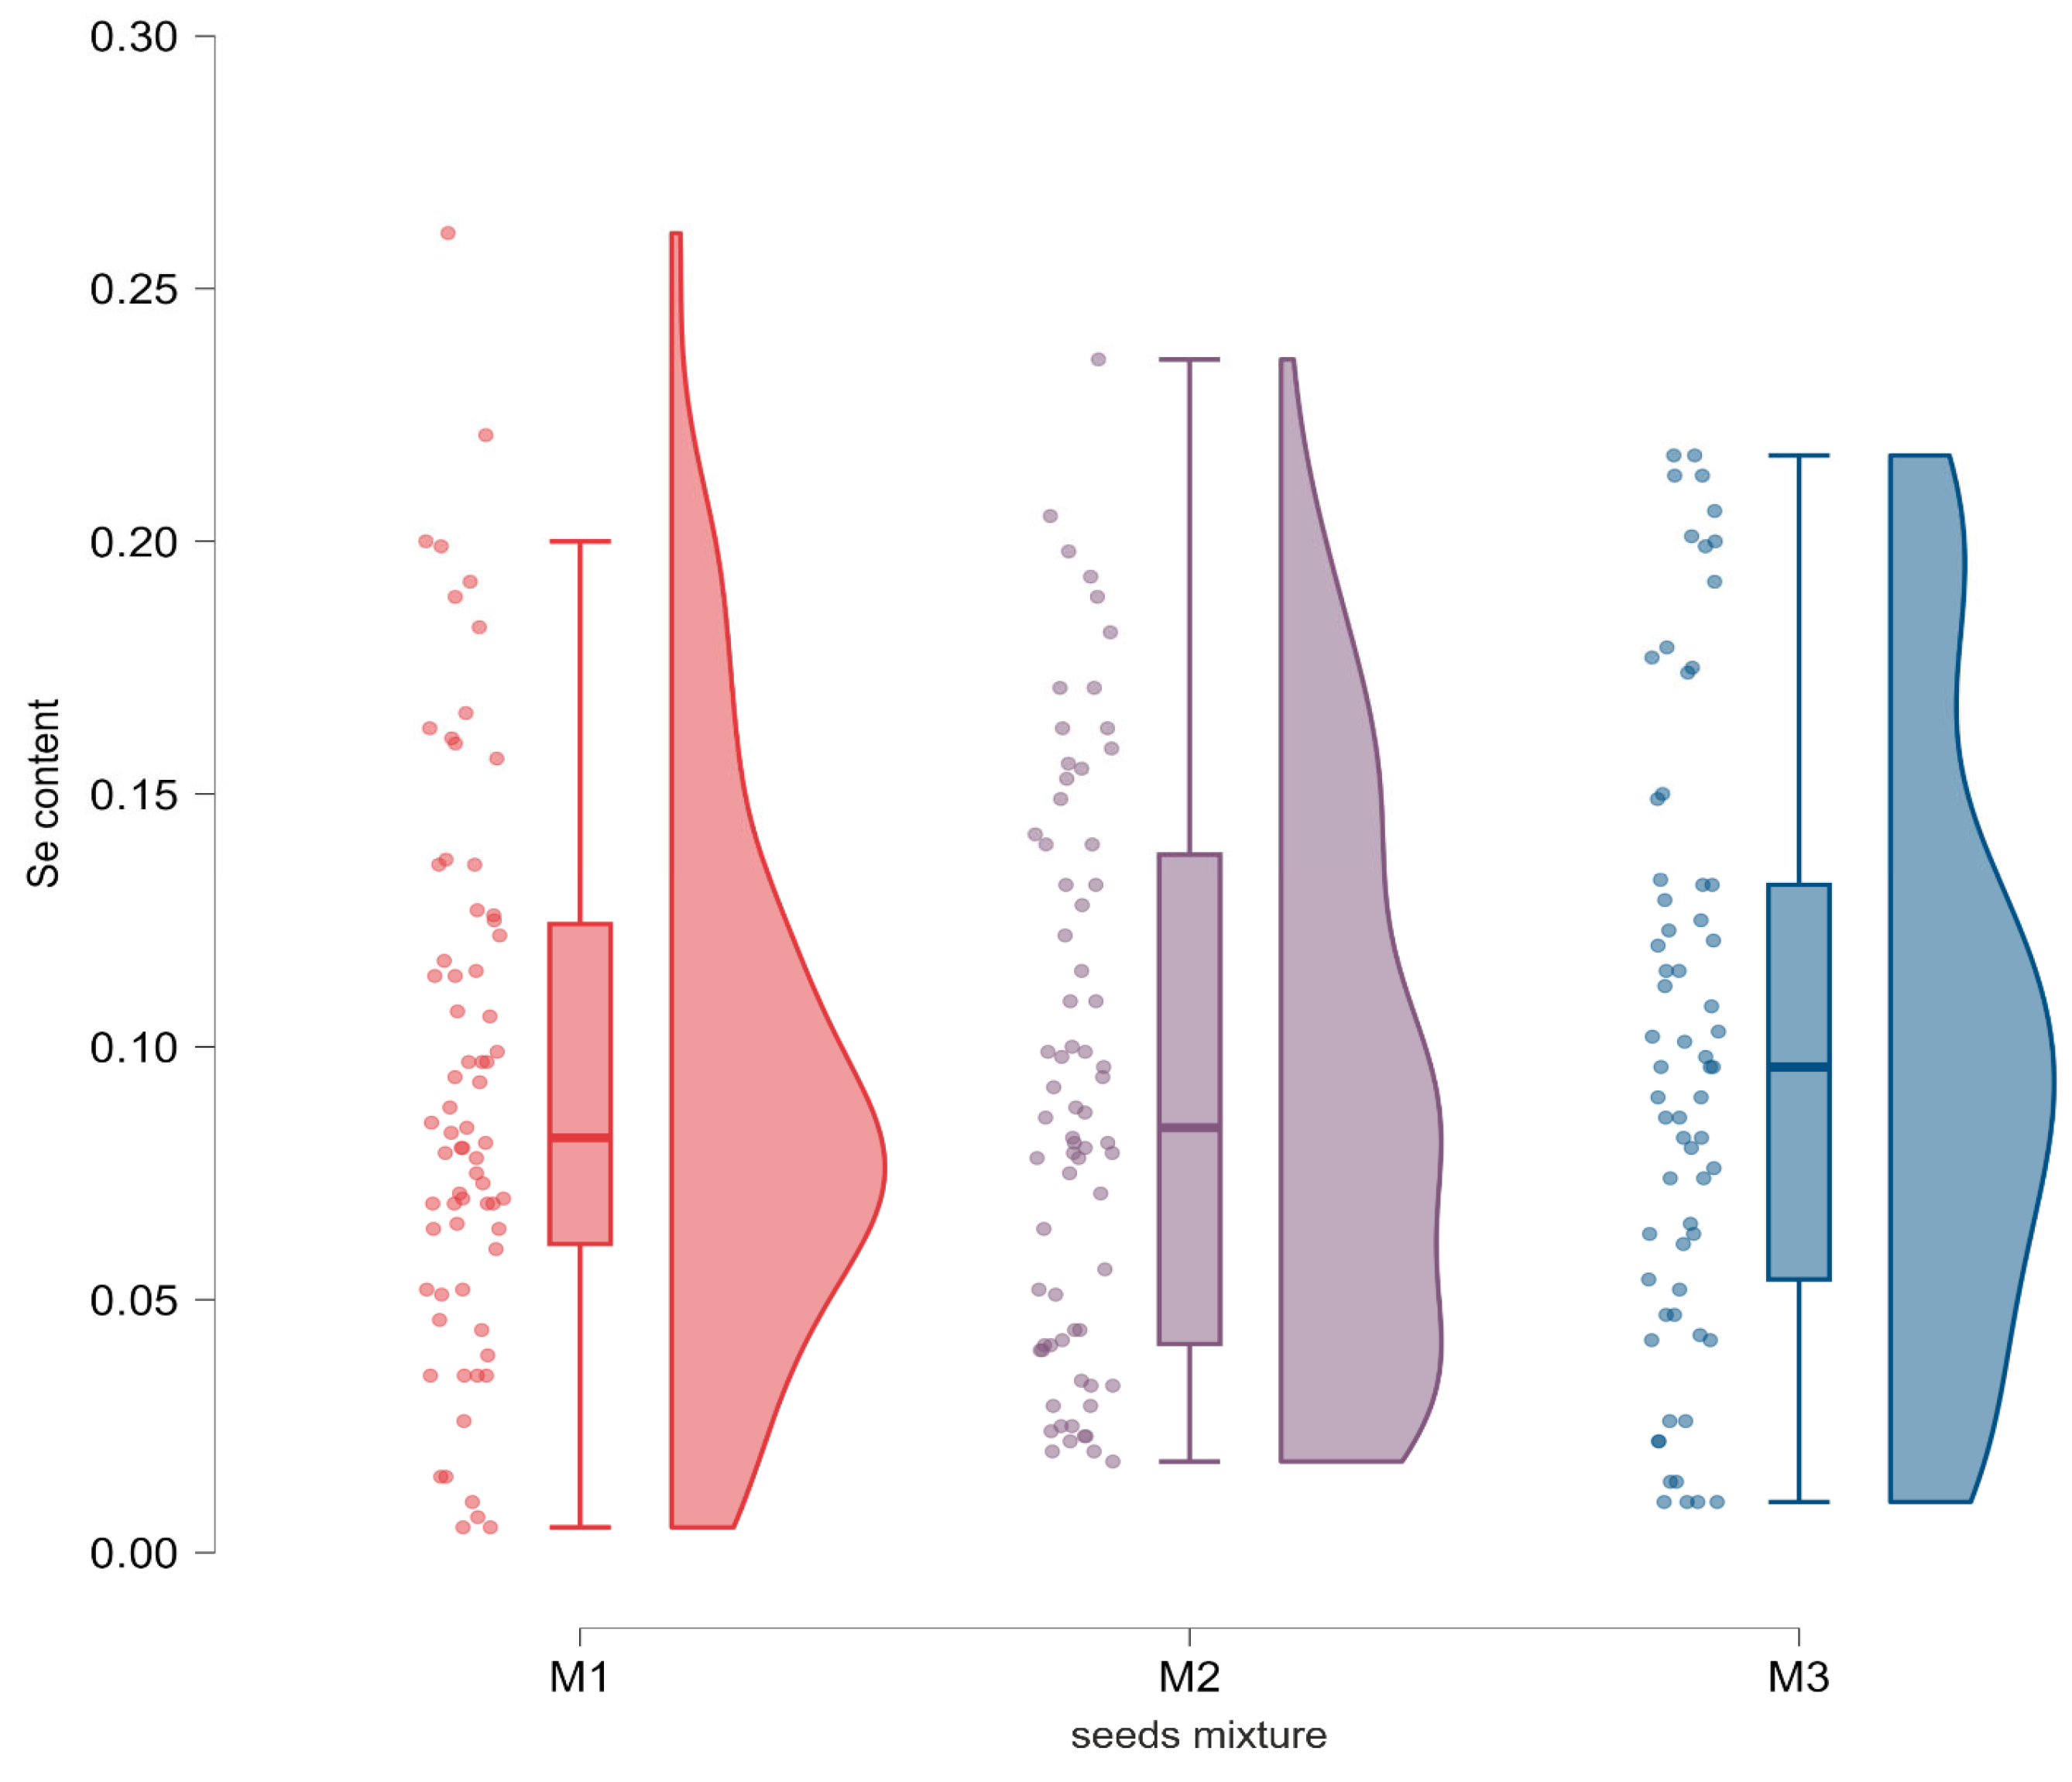

Table 1.
Air temperature [°C] and rainfall [mm] in 2022–2025 and for the multi-year periods 1991–2020.
Table 1.
Air temperature [°C] and rainfall [mm] in 2022–2025 and for the multi-year periods 1991–2020.
| Year | Month | |||||||||||||
| I | II | III | IV | V | VI | VII | VIII | IX | X | XI | XII | |||
| average air temperature [°C] | ||||||||||||||
| Mean for vegetation period | Mean annual | |||||||||||||
| 2022 | 0 | 2 | 2 | 6 | 13 | 19 | 19 | 20 | 11 | 10 | 3 | -1 | 14 | 9 |
| 2023 | 2 | 1 | 4 | 8 | 13 | 17 | 20 | 21 | 18 | 11 | 3 | 1 | 15 | 10 |
| 2024 | -2 | 5 | 5 | 11 | 16 | 19 | 21 | 21 | 17 | 8 | 3 | 2 | 16 | 11 |
| 2025 | 2 | -2 | 6 | 10 | 11 | 18 | 20 | 19 | 16 | 8 | 4 | 2 | 15 | 10 |
| 1991-2020 | -2 | -2 | 2 | 9 | 12 | 17 | 19 | 18 | 13 | 9 | 3 | -1 | 14 | 8 |
| total rainfall [mm] | ||||||||||||||
| Total for vegetation period | Total annual | |||||||||||||
| 2022 | 34 | 36 | 9 | 47 | 27 | 31 | 123 | 48 | 130 | 19 | 12 | 20 | 424 | 534 |
| 2023 | 69 | 34 | 29 | 53 | 79 | 90 | 61 | 58 | 17 | 55 | 41 | 54 | 413 | 640 |
| 2024 | 52 | 43 | 59 | 46 | 8 | 53 | 106 | 22 | 40 | 4 | 11 | 20 | 278 | 463 |
| 2025 | 29 | 7 | 46 | 23 | 56 | 57 | 136 | 8 | 77 | 41 | 43 | 13 | 398 | 536 |
| 1991-2020 | 30 | 34 | 45 | 40 | 65 | 70 | 80 | 70 | 55 | 43 | 45 | 50 | 423 | 627 |
Note: Data obtained from automatic weather station at the Didactic and Research Station in Sosnowica, University of Life Sciences in Lublin.
Table 2.
Species composition of the seed mixtures.
| Mixture | Species: common name, scientific name, cultivar, proportion (%) |
| M1 Country Horse H2118 | Perennial ryegrass Lolium perenne cv. Transate 40% Perennial ryegrass Lolium perenne cv. Arelio 20% Perennial ryegrass Lolium perenne cv. Trivos 20% Timothy grass Phleum pratense cv. Alma 20% |
| M2 Country Horse H2120 Balance | Perennial ryegrass Lolium perenne cv. Trivos 5% Meadow fescue Festuca pratensis cv. Cosima 12,5% Meadow fescue Festuca pratensis cv. Patra 12,5% Timothy grass Phleum pratense cv. Alma 30% Smooth meadow-grass Poa pratensis cv. Liblue 15% Red fescue Festuca rubra cv. Rafael 15% Meadow foxtail Alopecurus pratensis cv. Zuberska 5% Tall fescue Festuca arundinacea cv. Hykor 5% |
| M3 Country Standard | Perennial ryegrass Lolium perenne cv. Mirtello 8% Perennial ryegrass Lolium perenne cv. Karatos 5% Perennial ryegrass Lolium perenne cv. Activa 8% Perennial ryegrass Lolium perenne cv. Garbor 9% Perennial ryegrass Lolium perenne cv. Valerio 7% Perennial ryegrass Lolium perenne cv. Melfrost 10% Meadow fescue Festuca pratensis cv. Comer 15% Meadow fescue Festuca pratensis cv. Polarking 2% Meadow fescue Festuca pratensis cv. Liherold 15% Meadow fescue Festuca pratensis cv. Paradus 5% Smooth meadow-grass Poa pratensis cv. Liblue 10% White clover Trifolium repens cv. Jura 6% |
Table 3.
Statistical description of selenium content for all doses and results of post hoc analyses.
Table 3.
Statistical description of selenium content for all doses and results of post hoc analyses.
| Comparison | z | Wi | Wj | p | pBonf |
| A - B | -2.524 | 72.78 | 101.6 | .012 | .070 |
| A - C | -3.442 | 72.78 | 112.6 | < .001 | .003 |
| A - D | -4.760 | 72.78 | 129.4 | < .001 | < .001 |
| B - C | -0.954 | 101.6 | 112.6 | .340 | 1.000 |
| B - D | -2.339 | 101.6 | 129.4 | .019 | .116 |
| C - D | -1.392 | 112.6 | 129.4 | .164 | .984 |
Note. Letters A-D represent the following doses: A – 0.0 L·ha⁻¹, B – 0.5 L·ha⁻¹, C – 1.0 L·ha⁻¹, D – 1,5 L·ha⁻¹. Wi, Wj - average ranks of compared doses, pBonf – Bonferroni-corrected significance level.
Table 4.
Biofortification effectiveness, expressed as the increase in selenium content relative to the control, as affected by the applied preparation rate.
Table 4.
Biofortification effectiveness, expressed as the increase in selenium content relative to the control, as affected by the applied preparation rate.
| Dose [l·ha⁻¹] | M | MIN | MAX | Increase over control [l·ha⁻¹] | Increase over control [%] |
| 0.5 | 0.035 | 0.005 | 0.213 | 0.00 | 0.00 |
| 0.5 | 0.077 | 0.007 | 0.217 | 0.042 | 120.00 |
| 1.0 | 0.086 | 0.026 | 0.236 | 0.051 | 145.71 |
| 1.5 | 0.115 | 0.018 | 0.261 | 0.08 | 228.57 |
Note. Abbreviations represent: M – median, MIN – minimum value, MAX – maximum value.
Disclaimer/Publisher’s Note: The statements, opinions and data contained in all publications are solely those of the individual author(s) and contributor(s) and not of MDPI and/or the editor(s). MDPI and/or the editor(s) disclaim responsibility for any injury to people or property resulting from any ideas, methods, instructions or products referred to in the content. |
© 2026 by the authors. Licensee MDPI, Basel, Switzerland. This article is an open access article distributed under the terms and conditions of the Creative Commons Attribution (CC BY) license (http://creativecommons.org/licenses/by/4.0/).
Copyright: This open access article is published under a Creative Commons CC BY 4.0 license, which permit the free download, distribution, and reuse, provided that the author and preprint are cited in any reuse.