

Submitted:
21 July 2026
Posted:
23 July 2026
You are already at the latest version
Abstract
Targeted inhibition of the MAPK pathway using BRAF inhibitors (BRAFi) represents a cornerstone of treatment for BRAFV600E-mutant melanoma. However, the rapid emergence of drug resistance remains a major clinical challenge. Mounting evidence indicates that therapy resistance is driven by both phenotypic plasticity and metabolic reprogramming. In this study, we investigated the molecular, phenotypic, and metabolic adaptations underlying acquired resistance to the BRAFi GSK2118436 in A375 melanoma cells. BRAFi-resistant cells (A375-R) displayed cross-resistance to additional BRAFi and MEK inhibitors and clear features of epithelial–mesenchymal transition (EMT), including E-cadherin decreased, vimentin increased, and inhibitor dependent’s spheroid compaction. Metabolic profiling suggests a shift toward mitochondrial oxidative phosphorylation (OXPHOS) dependency. Among multiple metabolic modulators evaluated, inhibitors of mitochondrial respiration—particularly metformin and antimycin A—selectively impaired viability, clonogenicity, and 3D growth of resistant cells. Importantly, while simultaneous BRAFi–metformin combination produced mostly antagonist effects, a sequential regimen (BRAFi followed by metformin) elicited additive/synergistic cytotoxicity in both 2D and 3D models. Collectively, these findings show that BRAFi resistance is driven by coordinated EMT and metabolic rewiring toward OXPHOS dependency and identify sequential metabolic targeting as an effective strategy to overcome therapeutic resistance in melanoma.
Keywords:
melanoma
; BRAFi
; resistance
; metformin
; metabolism
1. Introduction
Cutaneous melanoma is one of the most aggressive skin cancers and is characterized by a high mutational burden and remarkable phenotypic plasticity. Among the genetic alterations driving melanoma progression, activating mutations in the BRAF gene—most frequently the V600E substitution—are detected in approximately 40–50% of cases and result in constitutive activation of the MAPK signaling pathway, promoting uncontrolled cell proliferation and survival [1].
The development of selective BRAF inhibitors (BRAFi), such as vemurafenib (PLX4032) and dabrafenib (GSK2118436), represented a major therapeutic breakthrough for patients with BRAF-mutant metastatic melanoma, significantly improving progression-free and overall survival [2]. However, despite high initial response rates, most patients relapse within months due to the emergence of acquired resistance. Multiple resistance mechanisms have been described, including reactivation of MAPK signaling through secondary mutations or pathway bypass, activation of alternative survival pathways, and phenotypic switching [3].
Beyond genetic and signaling adaptations, increasing evidence indicates that melanoma cells undergo profound metabolic rewiring in response to antitumor strategies, especially during targeted therapies. Drug-resistant melanoma cells frequently display enhanced mitochondrial function and a shift toward oxidative phosphorylation (OXPHOS), which supports survival under therapeutic stress [4,5,6,7,8]. In this context, mitochondrial metabolism has emerged as a critical vulnerability in BRAFi-resistant melanoma. Indeed, increased reliance on OXPHOS has been shown to contribute directly to resistance against MAPK pathway inhibitors [9].
Metformin, a widely prescribed antidiabetic drug, is known to inhibit mitochondrial complex I, reduce ATP production, and activate AMP-activated protein kinase (AMPK), thereby indirectly suppressing mTOR signaling and anabolic metabolism. Due to its favorable safety profile and pleiotropic metabolic effects, metformin has attracted considerable interest as a potential anticancer agent. Several preclinical studies have demonstrated that metformin can impair melanoma cell growth and survival, especially in metabolically adapted or therapy-resistant contexts [6,7,10,11,12].
In parallel, resistance to BRAFi has been associated with phenotypic transitions resembling epithelial–mesenchymal transition (EMT), characterized by changes in cell morphology, loss of epithelial markers, gain of mesenchymal traits, and increased cellular plasticity. These phenotypic changes may further reinforce metabolic flexibility and therapy resistance, suggesting a functional link between EMT, metabolic rewiring, and drug tolerance [13]. In thyroid cancer, BRAFV600E cells resistant to BRAFi (PLX4032) were reported to display increased expression of mesenchymal EMT markers (vimentin, β-catenin, and CD44), together with enhanced migration and invasion processes [14]. BRAF mutations are frequent in melanoma and are known to regulate the invasive phenotype of tumor cells. Specifically, Monaghan-Benson and Burridge demonstrated that BRAF signaling regulates the cadherin switch: in BRAFV600E melanoma cells, high levels of N-cadherin and low levels of E-cadherin were observed, whereas BRAF silencing produced the opposite effect [15]. In addition, proteomic studies revealed an increase in proteins associated with EMT, such as vimentin, in melanoma cells resistant to vemurafenib [16].
Given this background, we hypothesized that acquisition of resistance to BRAFi could increase melanoma cell dependency on mitochondrial metabolism, thereby enhancing sensitivity to metabolic inhibition. In the present study, we established a dabrafenib-resistant melanoma cell line and systematically evaluated its response to metabolic modulators. We demonstrate that BRAFi-resistant melanoma cells exhibit increased sensitivity to metformin and that sequential targeting of MAPK signaling and mitochondrial metabolism may represent a rational strategy to overcome or exploit this acquired resistance.
2. Results
2.1. Establishment of GSK2118436-Resistant A375 Cells
To get inside the features of developing resistance to BRAF targeted therapy, we set up a GSK2118436-resistant cell line by chronic exposure to this drug. Treatment started with 1 μM GSK2118436. Cells increased their adhesion surface, developed irregular borders, and formed intercellular connections between distant, non-adjacent cells altering cellular morphology (Figure 1A). This morphology was maintained for approximately 15 days, during which extensive cell death and a decrease in cell division were observed. Once the remaining cells began to recover their proliferative capacity; the concentration of the inhibitor was gradually. This cycle was repeated with successive passages. During the development of this resistant cell line, regions or foci of dense cellular proliferation were observed (black circle, Figure 1A), together with cells showing the previously described alterations (black arrows). Finally, after approximately four months of culture in the presence of the inhibitor, the cell line named “A375-R” was established (Figure 1A). This cell line exhibited a higher number of cells in the supernatant compared to the parental line (white arrows), retained regions with more compact cell morphology (black circle), and displayed cells with spindle-shaped morphology and extensive intercellular connections (black arrows). Resistant cells were maintained in culture under continuous selective pressure (20 μM GSK2118436). To validate that the observed phenotype was specifically associated with acquired drug resistance rather than long-term passaging, both A375-R cells and parental A375 cells were exposed to 1 µM and 10 µM GSK2118436 for 48 h. Under these conditions, control A375 cells displayed a morphology similar to that observed at the beginning of the selection process, characterized by reduced proliferation and altered adhesion, whereas A375-R cells preserved the resistant phenotype, maintaining their heterogeneous morphology with compact and spindle-shaped interconnected cells and a high proportion of non-adherent cells in the supernatant (Figure 1B).
2.2. Effect of BRAF and MEK Inhibitors on GSK2118436-Resistant A375 Cells
Once the A375-R was established, the resistance generated against GSK2118436 was evaluated in comparison with the parental cells (A375). In addition, another BRAFi (PLX4032) was used to determine whether the resistance was specific to a single molecule or to BRAF inhibitors in general. Under 2D culture conditions, the A375-R showed significantly lower sensitivity to GSK2118436 compared to the parental A375 starting at a concentration of 2.5 μM (p < 0.001; Figure 1C). Within the tested concentration range, no cytotoxic effect was observed in the A375-R, that is, there was no decrease in viability, and the IC₅₀ was 50-fold higher than that of the parental cells. Regarding the inhibitor PLX4032, reduced sensitivity was also detected starting at 5 μM (p < 0.01; Figure 1D). In this case, a rightward shift of the response curve was observed for the A375-R, with an IC₅₀ more than twice that of the A375 cells.
Although resistant cells remained viable under anchorage-independent growth, they failed to form 3D structures as effectively as the A375 cells (Figure 1G and H A375-R cells without treatment). As in 2D cultures, the A375-R exhibited significantly lower sensitivity to the inhibitor compared to A375 cells, as evidenced by a rightward shift of the curve data points (p < 0.05; Figure 1C and D), with an increase of more than 25-fold in the IC₅₀ value relative to the
A375 cell line, as well as by alterations in the morphology of the 3D structures. The size of spheroids formed by the A375 decreased in the presence of GSK2118436, whereas the A375-R formed spheroids only in the presence of the inhibitor and in a concentration-dependent manner (Figure 1G). Similar results were obtained with the inhibitor PLX4032: when A375-R cells were exposed to PLX4032, reduced sensitivity compared to A375 was observed starting at 1 μM (p < 0.01; Figure 1H), with an IC₅₀ that was 10-fold higher, and cells in culture acquired a 3D structure only in the presence of the BRAFi.
Since BRAF kinase can phosphorylate and activate the kinases MEK1 and MEK2, it was of particular interest to investigate how sensitivity to MEK inhibitors (MEKi) was affected in the A375-R cells. Under 2D culture conditions, A375-R exhibited reduced sensitivity to both MEK inhibitors, GSK1120212 (trametinib) and PD98059, compared to A375. Representative images of these effects can be observed in Figure 1E and F. Specifically, for GSK1120212, the IC₅₀ of the A375-R was 441-fold higher (Figure 1E), whereas for PD98059 it was more than twice the IC₅₀ of A375 (the IC₅₀ of PD98059 for the A375-R was not contained within the tested concentration range, Figure 1F). Under 3D culture conditions, the A375-R cells treated with GSK1120212 were able to form structures compatible with multicellular spheroids, whereas under treatment with PD98059 it failed to generate such structures (Figure 1J). In both cases, A375-R exhibited lower sensitivity to MEK inhibitors, displaying an IC₅₀ 25-fold higher for GSK1120212 (Figure 1I) and slightly more than two-fold higher for PD98059 (as in 2D culture, the IC₅₀ for PD98059 in A375-R cells was not contained within the tested concentration range in 3D culture; Figure 1J).
2.3. Changes in EMT Markers
Considering the morphological changes observed, we next studied the expression of EMT markers, such as E-cadherin, whose presence is associated with a more epithelial phenotype, and vimentin, which is associated with a more mesenchymal phenotype. Since A375-R displayed a highly heterogeneous population, with a high percentage of non- attached cells, it was decided to evaluate these markers in both the adherent population (AP) and the suspension cells or non-adherent population (NAP). Thus, A375 and A375-R cells, in the absence or presence of the BRAFi (GSK2118436, 20 μM), were cultured for 48 h under 2D conditions, separated as AP and NAP populations and subsequently, indirect immunolabeling was performed using monoclonal antibodies against E-cadherin and vimentin, and the results were analyzed by flow cytometry. In Figure 2A, no differences were detected in E-cadherin expression levels between A375-AP and A375-R-AP; however, compared to A375-NAP, a significant decrease in E-cadherin expression was observed in A375-R-NAP both in the absence and presence of the BRAFi (p < 0.05). In the histograms showing the distribution of labeling in suspension cells, it can be observed that the A375-NAP cells display a higher number of events with greater fluorescence intensity for E-cadherin than A375-R-NAP. Vimentin staining showed the opposite pattern: A375-R-AP exhibited a trend toward higher vimentin levels, and this pattern became significantly evident when comparing A375-R-NAP in the presence of the BRAFi with the A375-NAP (p < 0.05; Figure 2C). This effect was also visualized by western blot analysis using total protein extracts (AP and NAP) from both cell lines (Figure 2E). The distribution of vimentin was also evaluated by immunolabeling and epifluorescence microscopy. Representative images are shown on a single channel (green) and displayed using the LUT Blue Orange icb, where color differences reflect differences in fluorescence intensity. Thus, fluorescence can be observed throughout the cell, with higher intensity in violet or orange regions (Figure 2D). Vimentin exhibited a differential distribution depending on the cell line: whereas A375 showed a more uniform distribution, A375-R, in both the absence and presence of the BRAFi, displayed a higher concentration of vimentin in the outermost cells of the monolayer.
2.4. Effect of Metformin
In this context, it was hypothesized that blocking or regulating specific metabolic pathways could counteract the resistance phenomenon. For this reason, we decided to investigate how the response to metabolic modulators is altered in GSK2118436-resistant melanoma cells.
To this end, the effects of nine metabolic modulators were compared between A375 and A375-R. Melanoma cells were exposed to increasing concentrations of the inhibitors, and after five days of culture, cell viability was determined using the APH assay (supplementary Figure S1). Among the seven modulators with differential responses, only Metformin and Antimicyn A (2/7) preferentially killed A375-R vs A375. It is noteworthy that both modulators affect oxidative phosphorylation, which may suggest a mitochondrial role during resistance.
In both cases, A375-R exhibited greater sensitivity to MET (p < 0.001) and antimycin A (p < 0.001) compared with A375 (Figure S1). This effect was noticed from the leftward shift of the curves and the changes in IC₅₀ values (Table S1: MET and antimycin A). For MET, this effect was observed starting at 1 mM (p < 0.001) and was associated with a two-fold reduction in IC₅₀, whereas for Antimycin A, it was evident at 0.1 μg/mL (p < 0.001) and the IC₅₀ was reduced four-fold relative to A375. Since MET is a drug that has been widely tested and used clinically for more than 60 years, it was selected for further evaluation to OXPHOS inhibition.
As shown in Figure 3A, after MET treatment, the morphology of the remaining A375-R cells differed from that observed in A375. At 1 mM MET, clusters of cells with heterogeneous morphology were observed in both cells’ variant. However, at 5 mM MET, polyhedral morphology was clear in the remaining A375-R cells, whereas A375 cells displayed a more spindle-shaped morphology. Subsequently, it was assessed whether this effect was maintained under anchorage-independent conditions (3D). As observed under 2D conditions, A375-R was more sensitive to MET than the parental cells (Figure 3B). This effect was evidenced by a leftward shift of the dose–response curve of A375-R (the IC₅₀ of A375-R showed a 35% reduction compared to A375), with a statistically significant difference at 5 mM MET (p < 0.01).
Sphere-forming capacity was also evaluated in cells treated or not with MET (5 mM) for 10 days (D). Residual sphere formation assay of A375 and A375-R cells in the presence or absence of GSK2118436 (20 μM) and treated with MET (5 mM) under 2D conditions and then seeded under sphere-forming conditions (E). Representative images of spheres are shown (magnification: 100×). Results are presented as colony formation efficiency (mean ± s.e.m; n>3; two-way ANOVA with Sidak’s post hoc test). Cell viability of suspension cells previously treated for 24, 48, or 72 h with MET (5 mM) is shown (F). After 72 h of culture, cells were fixed and stained with crystal violet. Statistical significance: *p<0.05, **p<0.01, ***p<0.001.
Next, it was decided to evaluate whether the cytotoxic effect of MET could affect those cells capable of forming colonies, which exhibit stem-like characteristics and a lower division rate. To this end, clonogenic assays were performed in the presence or absence of GSK2118436 (20 μM), treated with 5 mM MET. In both cases, the colony-forming ability of the resistant cells was significantly affected by MET in the presence or absence of the BRAFi (Colony count: A375-R Control vs. MET p < 0.05 and A375-R GSK2118436 20 μM Control vs. MET p < 0.05; Colony area: A375-R Control vs. MET p < 0.05 and A375-R GSK2118436 20 μM Control vs. MET p < 0.001).
The effect of MET on sphere-forming capacity of the stem cells population was also evaluated. For this purpose, cells were seeded under sphere-forming conditions and treated with MET (5 mM) for 10 days. As shown in Figure 3D, the morphology of melanospheres formed by the resistant cells showed a clustered shape with irregular edges, low compactness, and easy disaggregation. In contrast, A375 spheres were round, with smooth borders and high compactness. Although no differences in sphere-forming capacity were observed between the cell lines, a significant difference in response to MET was detected, with the resistant cell line being significantly more sensitive (p < 0.05).
To evaluate whether this effect of MET could be long lasting or “residual”, A375 and A375-R monolayers were treated with MET for 72 h in the presence or absence of GSK2118436 (20 μM) and then reseeded under sphere-forming conditions. A375-R in the presence of BRAFi was able to form spheres morphologically similar to A375 and showed a tendency toward a higher number of spheres. Previous MET treatment drastically impaired the sphere-forming capacity in both cell lines. However, when the effect of MET was specifically compared, the ability to generate melanospheres was significantly more affected in the resistant cell line than in the parental cells (p < 0.01). This effect was not reversed by co-incubation with MET–BRAFi under 2D conditions but showed a reduction in the residual effect of MET when BRAFi was restored during sphere culture (p < 0.05).
The residual effect of MET on non-adherent population was also evaluated. For this purpose, cells were treated with MET (5 mM) for 24, 48, or 72 h, the supernatant was collected, cells were separated by centrifugation, the drug-free medium was restored, and cells were cultured in a new plate for additional 72 h. Figure 3F shows, by crystal violet staining, that the A375-R line indeed presented a higher number of cells in the supernatant than the A375 cells. Furthermore, these cells were viable and capable of adhering to a new substrate to generate a monolayer. MET treatment impaired this adhesion capacity, as shown by comparison of the stained area in the MET (5 mM) well with the control in the A375-R cells at 24 h. This effect was more pronounced at 48 and 72 h.
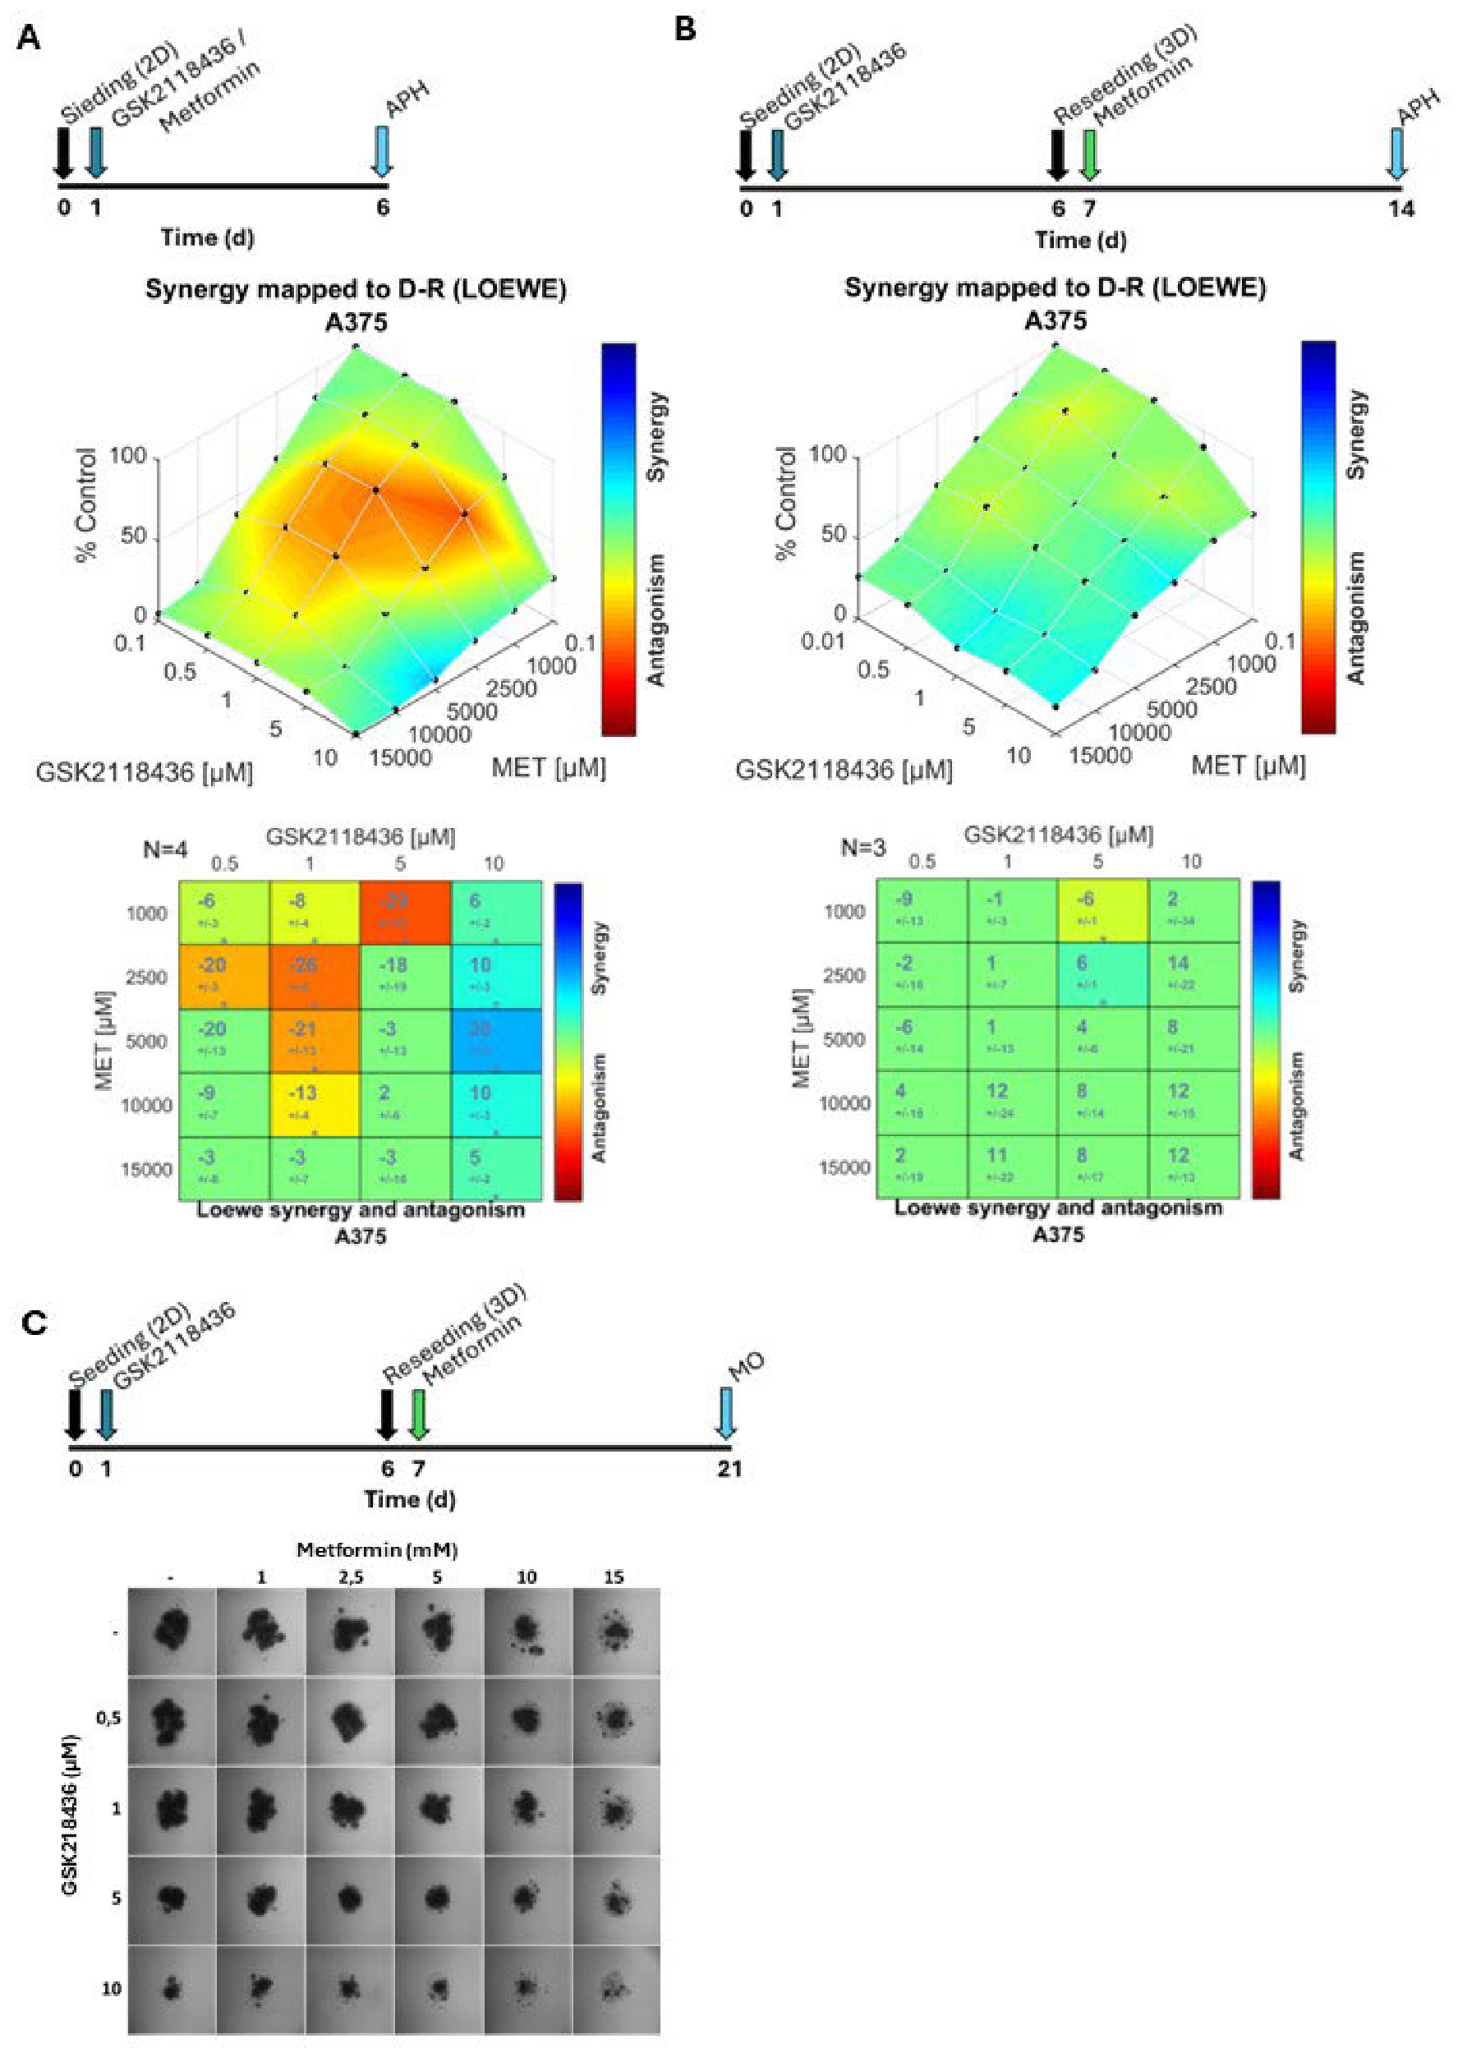
Finally, to determine whether a synergistic, antagonistic, or additive effect existed between the two drugs, A375 melanoma cells were simultaneously exposed to increasing concentrations of GSK2118436 (0.5–10 μM) and MET (1–15 mM). After 5 days of culture, melanoma cell viability was determined. Both, the surface map analysis and the interaction matrix revealed small regions of synergy (light blue–blue) and additive effects (green) and broad regions of antagonism (yellow–orange). In particular, the antagonistic effect was evident for the combination at low concentrations of GSK2118436, where the effect of MET as a single agent was greater than in combination with BRAFi (p < 0.001; Figure 4A). Conversely, a synergistic effect was observed at higher concentrations of GSK2118436.
Based on these results and considering the previously observed effect of MET on the A375-R cells, it was hypothesized that the acquisition of resistance to GSK2118436 might be required to improve the response to MET.
A sequential treatment scheme was designed in which A375 cells were first exposed to increasing concentrations of GSK2118436 (0.5–10 μM) and after 5 days of this treatment, the remaining cells were reseeded and treated with MET (1–15 mM). After 5 days, cell viability was evaluated using the APH assay. Baseline analysis showed that the BRAFi response curve in the absence of MET differed between both treatment schemes (Figure 4B). As in the simultaneous treatment, antagonistic and synergistic effects of the combination were evaluated using the Loewe model. Interestingly, in this sequential treatment scheme no antagonistic regions (yellow areas) were observed in the surface map analysis but mostly additive effect throughout the concentration range Figure 4B.
Given the limitations of long-term 2D cultures, the sequential treatment protocol was applied to A375 cells cultured under 3D conditions. In this model, a sequential treatment scheme was similar to sequential 2D protocol in which A375 cells were first exposed to increasing concentrations of GSK2118436 (0.5–10 μM) and after 5 days of this treatment, the remaining cells were reseeded in 3D conditions and treated with MET (1–15 mM). After 5 days, spheroids decreased at high concentrations of both inhibitors compared to the respective single-agent treatments, particularly at MET concentrations of 10–15 mM combined with GSK2118436 at 10 μM reenforcing 2D results (Figure 4C).
3. Discussion
The development of resistance to BRAF inhibitors (BRAFi) remains a major clinical challenge in the treatment of BRAFV600E-mutant melanoma. Although several genetic and signaling-based mechanisms have been described, increasing evidence indicates that non-genetic adaptations, including metabolic rewiring and phenotypic plasticity, play a critical role in the acquisition and maintenance of drug resistance. In the present study, we show that melanoma cells with acquired resistance to the BRAFi GSK2118436 undergo profound phenotypic and metabolic changes that render them selectively vulnerable to mitochondrial metabolic inhibition.
In this context, metformin-mediated complex I inhibition may selectively compromise the bioenergetic flexibility required for survival under MAPK pathway inhibition. Consistently, biguanides have been shown to impair tumor growth and enhance the efficacy of targeted therapies in multiple preclinical models [17,18]
Recent preclinical studies have illustrated the capacity of metformin to sensitize tumor cells to therapy and to target metabolic dependencies associated with resistance. In melanoma and other cancer models, metformin has been shown to enhance the efficacy of MAPK pathway inhibitor [19,20], disrupt mitochondrial function [21] suppress mTOR signaling [22,23], and selectively target stem-like, therapy-resistant subpopulation [24,25]. Furthermore, metformin can modulate the tumor microenvironment and improve responses to immunotherapy in preclinical systems [26,27].
Our data demonstrate that A375 melanoma cells that acquire resistance to GSK2118436 (A375-R) display marked morphological alterations and changes in the expression of epithelial–mesenchymal transition (EMT)-related markers. Resistant cells exhibited reduced E-cadherin expression in the non-adherent population, increased vimentin levels, and alterations in vimentin subcellular distribution, collectively suggesting a shift toward a mesenchymal-like phenotype. These findings are consistent with previous reports linking BRAFi resistance to EMT-like programs that promote cellular plasticity, invasiveness, and survival under therapeutic pressure [28].
Interestingly, N-cadherin expression did not uniformly increase in resistant cells, and in some conditions was even reduced, highlighting the complexity and context dependency of cadherin switching in melanoma. This observation aligns with emerging concepts that EMT in melanoma does not necessarily follow a classical epithelial-to-mesenchymal trajectory but rather involves hybrid or partial EMT states that support drug tolerance and adaptive survival.
Moreover, the inability of A375-R cells to form compact spheroids under basal conditions, together with their recovery of spheroid formation upon BRAFi re-exposure, further supports the notion that resistance is accompanied by reversible phenotypic states rather than fixed genetic alterations. Such plasticity may allow melanoma cells to dynamically adapt to changing microenvironmental and therapeutic cues.
A major finding of this study is that BRAFi-resistant melanoma cells exhibit a distinct metabolic vulnerability profile compared with their parental counterparts. Systematic screening of metabolic modulators revealed that A375-R cells are significantly more sensitive to inhibitors targeting mitochondrial respiration, including metformin and antimycin A, whereas their sensitivity to glycolytic inhibition or pyruvate redirection remained largely unchanged.
These results suggest that the acquisition of BRAFi resistance is accompanied by a metabolic shift toward increased reliance on mitochondrial oxidative metabolism. Such a shift has been previously described in BRAFi-resistant melanoma and has been linked to enhanced mitochondrial biogenesis, increased OXPHOS activity, and altered redox homeostasis [29,30]. Our data reinforce this model and extend it by showing that mitochondrial dependency in resistant cells constitutes an exploitable therapeutic vulnerability.
In contrast, A375-R cells were less sensitive to modulators of folate metabolism and mTOR signaling, supporting the idea that resistant cells rewire multiple metabolic pathways to sustain survival. Notably, the reduced response to RAD001 is consistent with reports indicating that mTOR activation in BRAFi-resistant cells may become uncoupled from MAPK signaling and dependent on alternative pathways, including PI3K/AKT signaling or PTEN status [31,32].
Our data propose that metformin effectively impairs the viability and reattachment capacity of cells present in the supernatant, a population often associated with anoikis resistance, stem-like properties, and metastatic potential. In addition, the strong effect of metformin on clonogenic and sphere-forming cells further suggests that this drug may preferentially target tumor-initiating or drug-tolerant persister populations that contribute to relapse.
Combination strategies aimed at preventing or overcoming resistance are of major interest in melanoma therapy. In this study, we found that simultaneous treatment with BRAFi and metformin resulted predominantly in antagonistic effects, depending on the concentrations used. This observation is in line with previous reports showing heterogeneous and context-dependent outcomes of BRAFi–metformin combinations.
In contrast, a sequential treatment strategy—whereby melanoma cells were first exposed to BRAFi and subsequently treated with metformin—reduced antagonistic interactions and revealed mostly additive and synergistic effects at higher drug concentrations. Importantly, this sequential approach was also evidenced in 3D spheroid models, which better recapitulate tumor architecture and nutrient gradients.
From a translational perspective, our results support the concept that acquired BRAFi resistance creates a window of vulnerability to mitochondrial metabolic inhibitors such as metformin. Given metformin’s long-standing clinical use and favorable safety profile, these findings may have implications for treatment strategies in BRAFi-resistant melanoma patients. Nevertheless, this study has limitations, and in vivo validation will be required to confirm the therapeutic potential and safety of sequential BRAFi–metformin regimens. However, early-phase clinical trials have demonstrated the safety and feasibility of combining metformin with anticancer therapies, reinforcing its translational potential as a low-cost, well-tolerated metabolic adjuvant [33,34]. In addition, at present there is a phase I/II clinical trial of Vemurafenib and metformin in melanoma patients (NCT01638676).
4. Materials and Methods
Cell culture. Human melanoma cell lines A375 (ATCC® CRL-1619™) and A375-R were cultured at 37°C in a humidified atmosphere of 95% air and 5% CO2 with DMEM/F12 medium Invitrogen, Carlsbad, CA, USA) containing 10% FBS (Internegocios, Córdoba, Argentina), 10 mM HEPES (pH 7.4) and antibiotics (60 mg/L Penicillin G, 50 mg/L Streptomycin and 50 mg/L Gentamicin). 3D culture. Multicellular spheroids were obtained following the procedure of hanging drop culture [35] from trypsinized monolayers (0.8-1.4x10⁴ cell/spheroid).
Viability. Cells were seeded onto 96-well plates at 4-7x10³ cells/well 24 h before treatments. After 5 days of treatments, cell viability was measured by acidic phosphatase assay [36] and crystal violet staining [37].
MAPK Pathway inhibitors. Increasing concentrations of the following BRAF and MEK inhibors were evaluated: Dabrafenib (GSK2118436; Tafinlar®, GlaxoSmithKline), a selective BRAFV600E inhibitor with lower activity against BRAFV600R (PubChem CID: 44462760); Vemurafenib (PLX4032; Zelboraf®, Roche), a selective BRAFV600E inhibitor (PubChem CID: 42611257); Trametinib (GSK1120212; Mekinist®, Novartis), a MEK1/2 inhibitor (PubChem CID: 11707110); and PD98059 (Calbiochem), a MEK1/2 inhibitor (PubChem CID: 4713).
BRAF inhibitor–resistant melanoma cell line (A375-R). The cell line was initiated by seeding A375 cells in T25 culture flask and exposing them to increasing concentrations of GSK2118436. Treatment was started at 1 µM, based on the IC₅₀ of parental A375 cells (0.88 µM), and the drug concentration was progressively escalated during successive passages as cells recovered proliferative capacity. In parallel, the parental A375 cell line was cultured under identical conditions but in the absence of inhibitor and used as a control to discriminate drug-induced morphological and phenotypic changes from those associated with prolonged culture and passaging. After approximately four months of continuous drug selection, a stable resistant population (A375-R) was obtained in complete medium supplemented with 20 µM GSK2118436.
Determination of the Half-Maximal Inhibitory Concentration (IC₅₀). Dose–response viability curves were generated for each cell line and treatment. The half-maximal inhibitory concentration (IC₅₀) was calculated by fitting the data to a logarithmic inhibition curve with normalized response using GraphPad Prism software (version 8.0.1).
Evaluation of Synergistic or Antagonistic Drug Interactions. Drug combination effects were evaluated by using Combenefit software according to the Loewe additivity model [38].
Epithelial–Mesenchymal Transition. Adherent cells (harvested using 0.25 mM EDTA) and suspended cells from A375 and A375-R were washed twice with cold PBS and permeabilized with 0.1% Triton X-100 for 10 min (vimentin determination only). Cells were then incubated with blocking solution (5% BSA in PBS) for 30 min, followed by incubation with primary antibodies diluted in blocking solution for 1 h at 4 °C. Excess primary antibody was removed by centrifugation (1500 rpm, 5 min, 4 °C), and cells were washed three times with cold PBS before incubation with the corresponding secondary antibody diluted in blocking solution for 2 h, protected from light. After incubation, cells were pelleted (1500 rpm, 5 min, 4 °C), resuspended in complete culture medium, and analyzed by flow cytometry for Alexa Fluor®488 fluorescence (FL1 channel) using an AccuryTM C6 Plus (BD). Mean fluorescence intensity was determined and expressed relative to the geometric media (GM) of A375 cells. The primary antibodies used were anti-E-cadherin (sc-8426, Santa Cruz Biotechnology), anti-vimentin (ab92547, Abcam), and anti-N-cadherin (13116S, Cell Signaling Technology). The secondary antibodies used were Alexa Fluor®488-conjugated anti-rabbit IgG (ab150077, Abcam) and Alexa Fluor®488-conjugated anti-mouse IgG (ab150113, Abcam).
Metabolic inhibitors. Increasing concentrations and/or combinations of the following metabolic modulators were evaluated: metformin (MET; Laboratorios Craveri), a direct inhibitor of mitochondrial complex I and indirect activator of AMP-activated protein kinase (AMPK) (PubChem CID: 4091); antimycin A (Sigma-Aldrich), a direct inhibitor of mitochondrial complex III (PubChem CID: 14957) 2-deoxy-D-glucose (2-DG; Sigma-Aldrich), a glycolytic hexokinase inhibitor (PubChem CID: 108223); sodium oxamate (Sigma-Aldrich), a lactate dehydrogenase (LDH) inhibitor (PubChem CID: 5242); 6-aminonicotinamide (6-AN; Sigma-Aldrich), an inhibitor of glucose-6-phosphate dehydrogenase (G6PDH) in the pentose phosphate pathway (PPP) (PubChem CID: 9500); dichloroacetate (DCA; Merck), an inhibitor of pyruvate dehydrogenase kinase (PDK) (PubChem CID: 517326); methotrexate (MTX; Laboratorios Kampel Martian S.A.), a direct inhibitor of dihydrofolate reductase (DHFR) and modulator of mitochondrial metabolism (PubChem CID: 126941); N,N′-[thiobis(2,1-ethanediyl-1,3,4-thiadiazole-5,2-diyl)]bis-benzeneacetamide (BPTES; Cayman Chemical), a glutaminase (KGA) inhibitor (PubChem CID: 3372016); and everolimus (RAD001; Novartis), an mTOR inhibitor acting through FKBP12 binding (PubChem CID: 6442177).
Western blotting. Whole-cell extracts were obtained using a lysis and extraction buffer (50 mM tris-HCl (pH 8); 100 mM NaCl; 1% Triton; 10 mM EDTA; protease inhibitor 1:10 000). The lysates were centrifuged at 10000 rpm for 10 min at 4°C, and the supernatant was stored at -20°C until immunoblotting was performed. Protein content was determined by the Bradford method. Immunoblot. Proteins (70-100 μg) from whole-cell extracts were electrophoresed on SDS-PAGE and transferred to PVDF membranes. The membrane was blocked with 5% nonfat milk for 1 h, incubated with the primary antibody overnight at 4°C and exposed to corresponding secondary antibody (1:5000) for 1 h at room temperature. The primary antibodies used were anti-E-cadherin (sc-8426, Santa Cruz Biotechnology), anti-vimentin (ab92547, Abcam), and anti-N-cadherin (13116S, Cell Signaling Technology) and anti-tubulin. Densitometry units were referred to tubulin (Cell-Signaling). The secondary antibodies used were goat anti-rabbit IgG-HRP (Sigma A9169) and goat anti-mouse IgG-HRP (Santa Cruz sc-2031). Detection. Chemiluminescence was detected using the Image Quant LAS 500 (GE Healthcare Life Sciences).
Statistics: All experiments were performed at least in triplicate, and data are expressed as the mean ± SEM. Differences between groups were analyzed with one- or two-way ANOVA followed by multiple comparisons Tukey's test. P<0.05 was established as significant. Analyses were made using INFOSTAT free edition and GraphPad Prism 8.0.1 software (GraphPad Software Inc., USA).
5. Conclusions
In this study, we demonstrate that the acquisition of resistance to BRAF inhibition in melanoma cells is accompanied by profound phenotypic and metabolic adaptations that generate novel therapeutic vulnerabilities. BRAFi-resistant A375 cells exhibit features of phenotypic plasticity associated with EMT-related programs and a metabolic shift toward increased dependence on mitochondrial oxidative phosphorylation.
Importantly, this metabolic reprogramming renders resistant cells selectively sensitive to mitochondrial inhibitors, particularly metformin, which effectively impaired cell viability, clonogenic capacity, and sphere-forming potential. While simultaneous combination of BRAFi and metformin resulted in largely antagonistic effects, a sequential treatment strategy revealed a more favorable interaction, supporting the concept that resistance-associated metabolic states can be therapeutically exploited.
Supplementary Materials
The following supporting information can be downloaded at the website of this paper posted on Preprints.org.
Acknowledgments
We thank Graciela B. Zenobi for technical advice and assistance. This work was supported by Agencia Nacional para la Promoción Científica y Tecnológica (PICT 2014-1247 and PICT 2012-1738, Préstamo BID) and by Consejo Nacional de Investigaciones Científicas y Técnicas (CONICET, D3646/14 and PIP 112 201101 00627). GCG, LMEF, MFA and MSV are investigators of CONICET, Argentina.
Conflicts of interest
All authors declare that they have no conflicts of interests.
References
- H. Davies, S. Edkins, S. Clegg, J. Teague, H. Woffendin, M.J. Garnett, E.D. , Neil Davis1, R. Ewing, R. Hawes, C. Mould, S. Hooper, C. Cooper, Pritchard-Jones, G.J. Riggins, A. Cossu, A. Nicholson, J.W.C. Ho, H.F. Seigler, R. Marais, M.R. Stratton, P.A. Futreal, Mutations of the BRAF gene in human cancer., Nature 417 (2002) 949–954. [CrossRef]
- M.J. Wongchenko, G.A. Mcarthur, B. Dr Eno, J. Larkin, P.A. Ascierto, J. Sosman, L. Andries, M. Kockx, S.D. Hurst, I. Caro, I. Rooney, P.S. Hegde, L. Molinero, H. Yue, I. Chang, L. Amler, Y. Yan, A. Ribas, Biology of Human Tumors Gene Expression Profiling in BRAF-Mutated Melanoma Reveals Patient Subgroups with Poor Outcomes to Vemurafenib That May Be Overcome by Cobimetinib Plus Vemurafenib, (2017). [CrossRef]
- S.N. Aasen, H. Parajuli, T. Hoang, Z. Feng, K. Stokke, J. Wang, K. Roy, R. Bjerkvig, S. Knappskog, F. Thorsen, Effective treatment of metastatic melanoma by combining mapk and pi3k signaling pathway inhibitors, Int. J. Mol. Sci. 20 (2019) 1–19. [CrossRef]
- C. Abildgaard, S. Rizza, H. Christiansen, S. Schmidt, C. Dahl, A. Abdul-Al, A. Christensen, G. Filomeni, P. Guldberg, Screening of metabolic modulators identifies new strategies to target metabolic reprogramming in melanoma, Sci. Rep. 11 (2021). [CrossRef]
- M.A. Deken, J. Gadiot, E.S. Jordanova, R. Lacroix, M. van Gool, P. Kroon, C. Pineda, M.H. Geukes Foppen, R. Scolyer, J.Y. Song, I. Verbrugge, C. Hoeller, R. Dummer, J.B.A.G. Haanen, G. V. Long, C.U. Blank, Targeting the MAPK and PI3K pathways in combination with PD1 blockade in melanoma, Oncoimmunology 5 (2016) 1–12. [CrossRef]
- M.D. Pan, M.F. Arbe, G.V. Salamone, G.C. Glikin, L.M.E. Finocchiaro, M.S. Villaverde, Loss of viability and impairment of the cell cycle by combining metabolic modulators in canine and feline melanoma cells, Res. Vet. Sci. 191 (2025) 105691. [CrossRef]
- M.F. Arbe, L. Agnetti, E. Breininger, G.C. Glikin, L.M.E. Finocchiaro, M.S. Villaverde, Glucose 6-phosphate dehydrogenase inhibition sensitizes melanoma cells to metformin treatment, Transl. Oncol. 13 (2020) 100842. [CrossRef]
- M.F. Arbe, C. Fondello, L. Agnetti, G. Martín Álvarez, M. Nicolás Tellado, G.C. Glikin, L. María, E. Finocchiaro, M.S. Villaverde, Inhibition of bioenergetic metabolism by the combination of metformin and 2-deoxyglucose highly decreases viability of feline mammary carcinoma cells, (2017). [CrossRef]
- A.W. Loftus, M. Zarei, H. Kakish, O. Hajihassani, J.J. Hue, C. Boutros, H.J. Graor, F. Nakazzi, T. Bahlibi, J.M. Winter, L.D. Rothermel, Therapeutic implications of the metabolic changes associated with BRAF inhibition in melanoma, Cancer Treat. Rev. 129 (2024) 102795. [CrossRef]
- M.A. Lea, M.S. Qureshi, M. Buxhoeveden, N. Gengel, J. Kleinschmit, C. Desbordes, Regulation of the proliferation of colon cancer cells by compounds that affect glycolysis, including 3-bromopyruvate, 2-deoxyglucose and biguanides, Anticancer Res. (2013). [CrossRef]
- R. Pryor, F. Cabreiro, Repurposing metformin: An old drug with new tricks in its binding pockets, Biochem. J. 471 (2015) 307–322. [CrossRef]
- L. Zhu, K. Yang, Z. Ren, D. Yin, Y. Zhou, Metformin as anticancer agent and adjuvant in cancer combination therapy: Current progress and future prospect, Transl. Oncol. 44 (2024) 101945. [CrossRef]
- M.R. Chastney, J. Kaivola, V.M. Leppänen, J. Ivaska, The role and regulation of integrins in cell migration and invasion, Nat. Rev. Mol. Cell Biol. 2024 262 26 (2024) 147–167. [CrossRef]
- H.K. Byeon, H.J. Na, Y.J. Yang, S. Ko, S.O. Yoon, M. Ku, J. Yang, J.W. Kim, M.J. Ban, J.H. Kim, D.H. Kim, J.M. Kim, E.C. Choi, C.H. Kim, J.H. Yoon, Y.W. Koh, Acquired resistance to BRAF inhibition induces epithelial-to-mesenchymal transition in BRAF (V600E) mutant thyroid cancer by c-Met-mediated AKT activation, Oncotarget 8 (2016) 596. [CrossRef]
- E. Monaghan-Benson, K. Burridge, Mutant B-RAF regulates a Rac-dependent cadherin switch in melanoma, Oncogene 32 (2013) 4836–4844. [CrossRef]
- V. Paulitschke, W. Berger, P. Paulitschke, E. Hofstätter, B. Knapp, R. Dingelmaier-Hovorka, D. Födinger, W. Jäger, T. Szekeres, A. Meshcheryakova, A. Bileck, C. Pirker, H. Pehamberger, C. Gerner, R. Kunstfeld, Vemurafenib resistance signature by proteome analysis offers new strategies and rational therapeutic concepts, Mol. Cancer Ther. 14 (2015) 757–768. [CrossRef]
- R.J.O. Dowling, S. Lam, C. Bassi, S. Mouaaz, A. Aman, T. Kiyota, R. Al-Awar, P.J. Goodwin, V. Stambolic, Metformin Pharmacokinetics in Mouse Tumors: Implications for Human Therapy, Cell Metab. 23 (2016) 567–568. [CrossRef]
- M.N. Pollak, Investigating metformin for cancer prevention and treatment: The end of the beginning, Cancer Discov. (2012). [CrossRef]
- Y. Xie, Z. Peng, M. Shi, M. Ji, H. Guo, H. Shi, Metformin combined with p38 MAPK inhibitor improves cisplatin sensitivity in cisplatin-resistant ovarian cancer, Mol. Med. Rep. 10 (2014) 2346. [CrossRef]
- Ryabaya, A. Prokofieva, R. Akasov, D. Khochenkov, M. Emelyanova, S. Burov, E. Markvicheva, A. Inshakov, E. Stepanova, Metformin increases antitumor activity of MEK inhibitor binimetinib in 2D and 3D models of human metastatic melanoma cells, Biomed. Pharmacother. 109 (2019) 2548–2560. [CrossRef]
- Z.L. Sebo, R.P. Chakrabarty, R.A. Grant, K.B. D’Alessandro, A.R. Koss, J.L.E. Blum, S.M. Davidson, C.R. Reczek, N.S. Chandel, Metformin inhibits mitochondrial complex I in intestinal epithelium to promote glycaemic control, Nat. Metab. 2026 86 8 (2026) 1291–1304. [CrossRef]
- Z. Al-Wahab, I. Mert, C. Tebbe, J. Chhina, M. Hijaz, R.T. Morris, R. Ali-Fehmi, S. Giri, A.R. Munkarah, R. Rattan, Metformin prevents aggressive ovarian cancer growth driven by high-energy diet: similarity with calorie restriction, Oncotarget 6 (2015) 10908–10923. [CrossRef]
- N.G. Vallianou, A. Evangelopoulos, C. Kazazis, Metformin and cancer, Rev. Diabet. Stud. 10 (2013) 228–235. [CrossRef]
- R. Würth, A. Pattarozzi, M. Gatti, A. Bajetto, A. Corsaro, A. Parodi, R. Sirito, M. Massollo, C. Marini, G. Zona, D. Fenoglio, G. Sambuceti, G. Filaci, A. Daga, F. Barbieri, T. Florio, Metformin selectively affects human glioblastoma tumor-initiating cell viability: A role for metformin-induced inhibition of Akt, Cell Cycle 12 (2013) 145–156. [CrossRef]
- J.W. Jung, S.B. Park, S.J. Lee, M.S. Seo, J.E. Trosko, K.S. Kang, Metformin represses self-renewal of the human breast carcinoma stem cells via inhibition of estrogen receptor-mediated OCT4 expression, PLoS One 6 (2011) 1–8. [CrossRef]
- M.Z. Afzal, R.R. Mercado, K. Shirai, Efficacy of metformin in combination with immune checkpoint inhibitors (anti-PD-1/anti-CTLA-4) in metastatic malignant melanoma, J. Immunother. Cancer 6 (2018). [CrossRef]
- S. Verdura, E. Cuyàs, B. Martin-Castillo, J.A. Menendez, Metformin as an archetype immuno-metabolic adjuvant for cancer immunotherapy, Oncoimmunology 8 (2019). [CrossRef]
- J. Jandova, G.T. Wondrak, Vemurafenib Drives Epithelial-to-Mesenchymal Transition Gene Expression in BRAF Inhibitor‒Resistant BRAFV600E/NRASQ61K Melanoma Enhancing Tumor Growth and Metastasis in a Bioluminescent Murine Model, J. Invest. Dermatol. 142 (2022) 1456-1465.e1. [CrossRef]
- L.F.L. Prado-Souza, L.A. Grabauskas, R. Chaguri, C.D. Cardoso, F.Y. Urushima, L.G.R. Mangini, V.S. Ramos, T. Rodrigues, MAPK-driven remodeling of mitochondrial dynamics in melanoma: implications for metabolic plasticity and response to targeted therapy, Biochem. Pharmacol. 252 (2026) 118211. [CrossRef]
- G. Zhang, D.T. Frederick, L. Wu, Z. Wei, C. Krepler, S. Srinivasan, Y.C. Chae, X. Xu, H. Choi, E. Dimwamwa, O. Ope, B. Shannan, D. Basu, D. Zhang, M. Guha, M. Xiao, S. Randell, K. Sproesser, W. Xu, J. Liu, G.C. Karakousis, L.M. Schuchter, T.C. Gangadhar, R.K. Amaravadi, M. Gu, C. Xu, A. Ghosh, W. Xu, T. Tian, J. Zhang, S. Zha, Q. Liu, P. Brafford, A. Weeraratna, M.A. Davies, J.A. Wargo, N.G. Avadhani, Y. Lu, G.B. Mills, D.C. Altieri, K.T. Flaherty, M. Herlyn, Targeting mitochondrial biogenesis to overcome drug resistance to MAPK inhibitors, J. Clin. Invest. 126 (2016) 1834–1856. [CrossRef]
- M. Atefi, E. Von Euw, N. Attar, C. Ng, C. Chu, D. Guo, R. Nazarian, B. Chmielowski, J.A. Glaspy, B. Comin-Anduix, P.S. Mischel, R.S. Lo, A. Ribas, Reversing Melanoma Cross-Resistance to BRAF and MEK Inhibitors by Co-Targeting the AKT/mTOR Pathway, (n.d.). [CrossRef]
- J.L. Manzano, L. Layos, C. Bugés, M. De los Llanos Gil, L. Vila, E. Martínez-Balibrea, A. Martínez-Cardús, Resistant mechanisms to BRAF inhibitors in melanoma, Ann. Transl. Med. 4 (2016) 237–237. [CrossRef]
- S. Gulati, J. Desai, S.M. Palackdharry, J.C. Morris, Z. Zhu, R. Jandarov, M.K. Riaz, V. Takiar, M. Mierzwa, J.S. Gutkind, A. Molinolo, P.B. Desai, N.H. Sadraei, T.M. Wise-Draper, Phase 1 dose-finding study of metformin in combination with concurrent cisplatin and radiotherapy in patients with locally advanced head and neck squamous cell cancer, Cancer 126 (2020) 354–362. [CrossRef]
- J.R. Perry, K. Bélanger, W.P. Mason, D. Fulton, P. Kavan, J. Easaw, C. Shields, S. Kirby, D.R. Macdonald, D.D. Eisenstat, B. Thiessen, P. Forsyth, J.F. Pouliot, Phase II trial of continuous dose-intense temozolomide in recurrent malignant glioma: RESCUE study, J. Clin. Oncol. 28 (2010) 2051–2057. [CrossRef]
- J.M. Kelm, N.E. Timmins, C.J. Brown, M. Fussenegger, L.K. Nielsen, Method for generation of homogeneous multicellular tumor spheroids applicable to a wide variety of cell types, Biotechnol. Bioeng. 83 (2003) 173–180. [CrossRef]
- M.L. Gil-Cardeza, T.A. Rossi, M.S. Villaverde, G.C. Glikin, L.M.E. Finocchiaro, Cationic lipid: DNA complexes allow bleomycin uptake by melanoma cells, Biomed. Pharmacother. 67 (2013). [CrossRef]
- K. Saotome, H. Morita, M. Umeda, Cytotoxicity test with simplified crystal violet staining method using microtitre plates and its application to injection drugs, Toxicol. Vitr. 3 (1989) 317–321. [CrossRef]
- G.Y. Di Veroli, C. Fornari, D. Wang, S. Verine Mollard, J.L. Bramhall, F.M. Richards, D.I. Jodrell, Combenefit: an interactive platform for the analysis and visualization of drug combinations, (n.d.). [CrossRef]
Figure 1.
Effect of BRAF and MEK inhibitors on A375 and GSK2118436-resistant A375 (A375-R) cells. Representative images during A375-R development (A-B). A375 and A375-R cell were cultured under 2D (C and F) or 3D (G and J) conditions and then treated with increasing concentrations of GSK2118436 (0.001–100 µM) and PLX4032 (0.001–10 µM; C, D, G and H) or PD98059 (0.01–100 μM; B and E). After 5 days (2D) or 14 days (3D) of culture, cell viability was evaluated using the APH assay. Results are expressed as viability relative to control (mean ± s.e.m., n > 3). Viability data were analyzed using two-way ANOVA followed by Sidak’s multiple comparisons test (*p < 0.05, **p < 0.01, ***p < 0.001) and fitted to a logarithmic inhibition curve with normalized response. IC₅₀ values were obtained by curve analysis using GraphPad Prism 8.0.1 software.
Figure 1.
Effect of BRAF and MEK inhibitors on A375 and GSK2118436-resistant A375 (A375-R) cells. Representative images during A375-R development (A-B). A375 and A375-R cell were cultured under 2D (C and F) or 3D (G and J) conditions and then treated with increasing concentrations of GSK2118436 (0.001–100 µM) and PLX4032 (0.001–10 µM; C, D, G and H) or PD98059 (0.01–100 μM; B and E). After 5 days (2D) or 14 days (3D) of culture, cell viability was evaluated using the APH assay. Results are expressed as viability relative to control (mean ± s.e.m., n > 3). Viability data were analyzed using two-way ANOVA followed by Sidak’s multiple comparisons test (*p < 0.05, **p < 0.01, ***p < 0.001) and fitted to a logarithmic inhibition curve with normalized response. IC₅₀ values were obtained by curve analysis using GraphPad Prism 8.0.1 software.
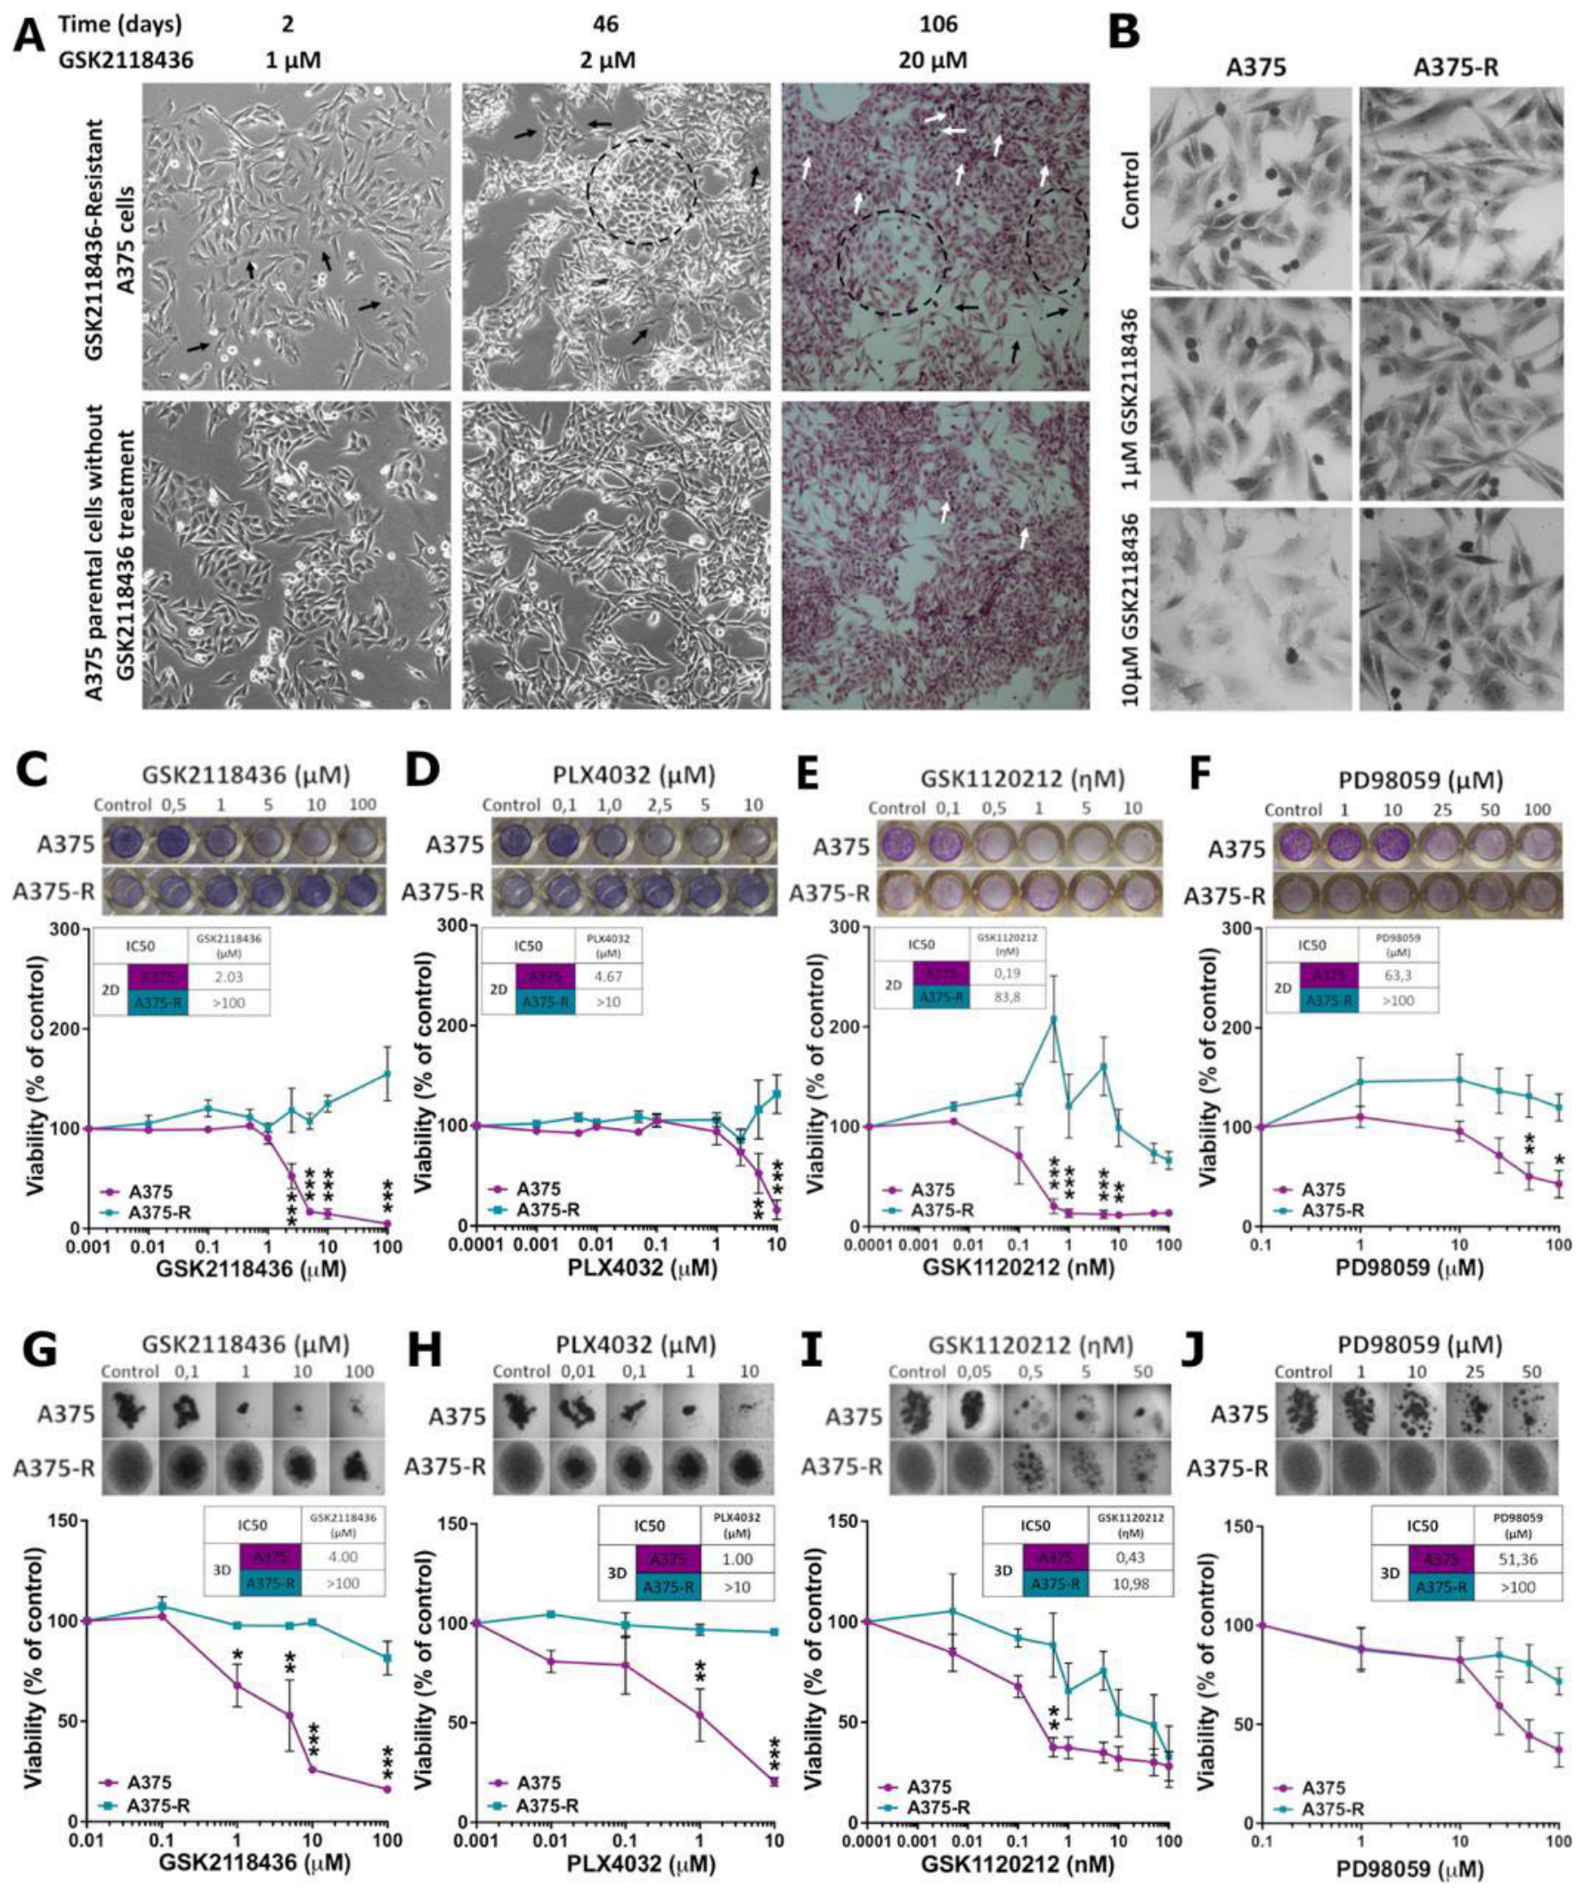
Figure 2.
Changes in EMT expression patterns in GSK2118436-resistant melanoma cells (A375-R). Human melanoma A375 and A375-R cells, cultured in the presence or absence of GSK2118436 (20 μM), were maintained for 48 h and subsequently separated into two populations: suspension (NAP) cells and adherent cells (AP) (see Materials and Methods). E-cadherin (A), Vimentin (B) and N-cadherin (C) expression levels were then determined by indirect immunostaining followed by flow cytometry analysis. Vimentin subcellular distribution was evaluated by immunostaining and epifluorescence microscopy (D). Representative single-channel images (green) are shown using the Blue–Orange ICB LUT, in which color differences reflect variations in fluorescence intensity (magnification: 100× and 400×). Results are expressed as the geometric mean fluorescence intensity relative to A375 cells (mean ± s.e.m.; n = 3), and representative histograms showing fluorescence intensity distributions are shown. Protein levels were assessed by Western blot analysis using total protein extracts (including both adherent and non-adherent cells) from each cell line, normalized to the loading control tubulin (E). Statistical analyses were performed using one-way ANOVA followed by Tukey’s multiple comparisons test (*p < 0.05, ***p < 0.001).
Figure 2.
Changes in EMT expression patterns in GSK2118436-resistant melanoma cells (A375-R). Human melanoma A375 and A375-R cells, cultured in the presence or absence of GSK2118436 (20 μM), were maintained for 48 h and subsequently separated into two populations: suspension (NAP) cells and adherent cells (AP) (see Materials and Methods). E-cadherin (A), Vimentin (B) and N-cadherin (C) expression levels were then determined by indirect immunostaining followed by flow cytometry analysis. Vimentin subcellular distribution was evaluated by immunostaining and epifluorescence microscopy (D). Representative single-channel images (green) are shown using the Blue–Orange ICB LUT, in which color differences reflect variations in fluorescence intensity (magnification: 100× and 400×). Results are expressed as the geometric mean fluorescence intensity relative to A375 cells (mean ± s.e.m.; n = 3), and representative histograms showing fluorescence intensity distributions are shown. Protein levels were assessed by Western blot analysis using total protein extracts (including both adherent and non-adherent cells) from each cell line, normalized to the loading control tubulin (E). Statistical analyses were performed using one-way ANOVA followed by Tukey’s multiple comparisons test (*p < 0.05, ***p < 0.001).
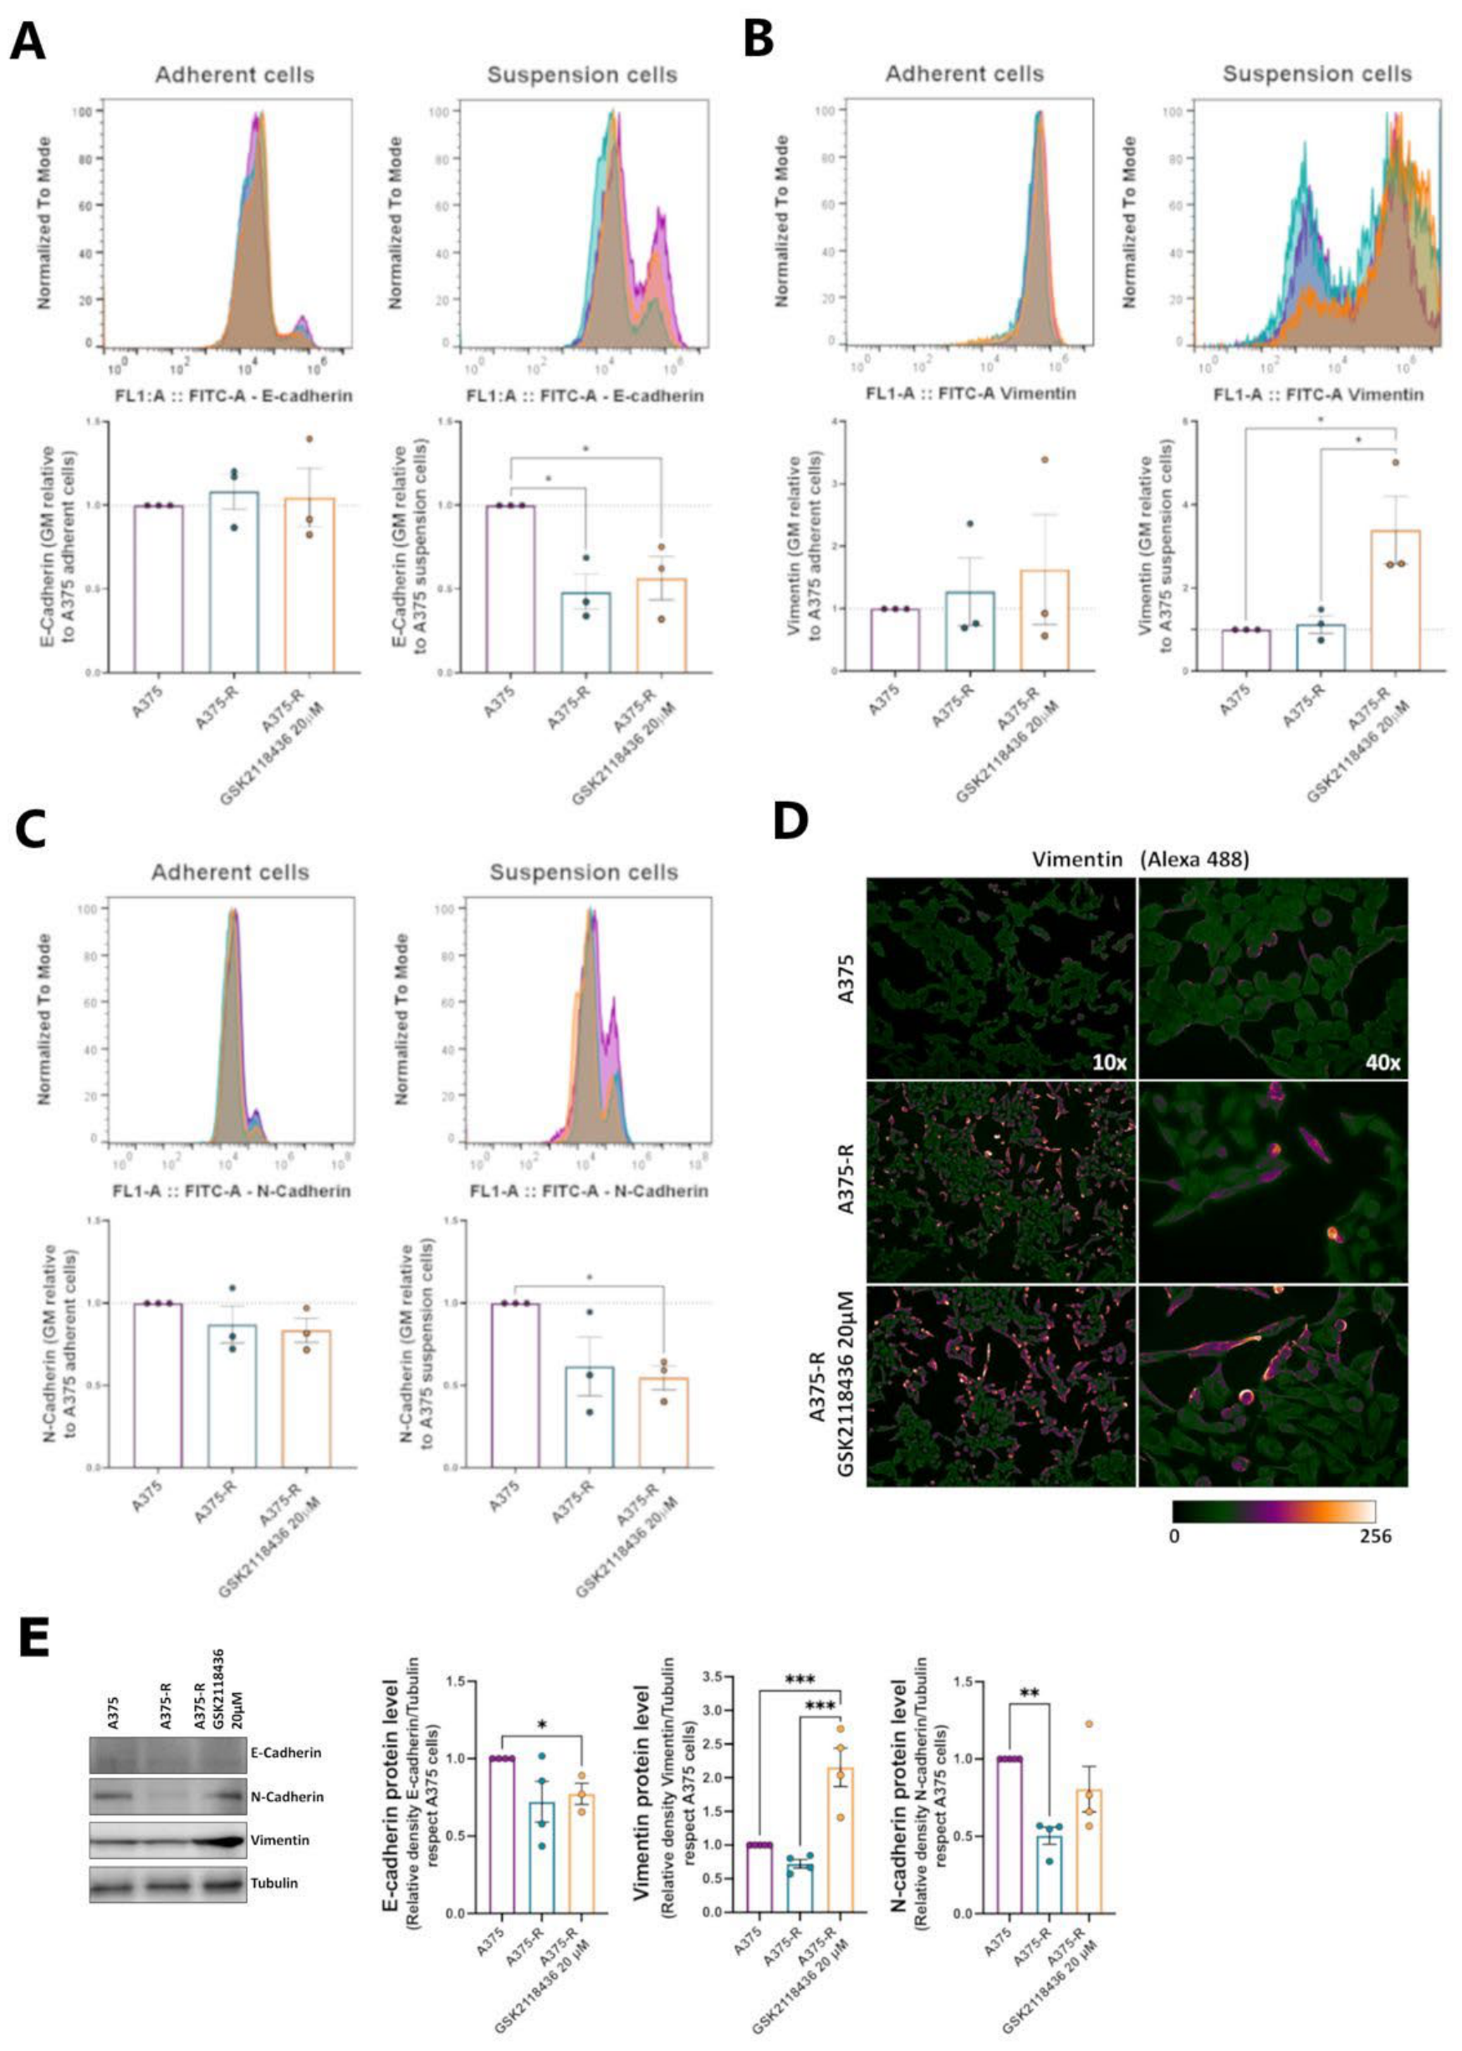
Figure 3.
Cytotoxic effects of metformin in GSK2118436-resistant melanoma cells. A375 and A375-R cells were treated with metformin (MET; 1 or 5 mM) under 2D culture conditions and, after 48 h, stained with hematoxylin and eosin (A). Representative images illustrating morphological changes are shown (magnification: 100× and 400×). Spheroids cultured under 3D conditions were treated with increasing concentrations of MET (1–15 mM). After 10 days of treatment, cell viability was assessed using the APH assay (B). Results are expressed as viability relative to untreated controls (mean ± s.e.m.; n > 3). Data were analyzed by two-way ANOVA followed by Sidak’s post hoc multiple-comparison test. In addition, the colony-forming ability of A375 and A375-R cells was determined in the presence or absence of GSK2118436 (20 μM) and treated with MET (5 mM) (C). A representative image of the colonies obtained after 10 days using crystal violet staining is shown. Results are presented as colony formation efficiency or colony-covered area calculated with ImageJ. At the bottom, the ImageJ quantification is shown; color intensity corresponds to the staining intensity of each pixel (mean ± s.e.m; n>3; t-test).
Figure 3.
Cytotoxic effects of metformin in GSK2118436-resistant melanoma cells. A375 and A375-R cells were treated with metformin (MET; 1 or 5 mM) under 2D culture conditions and, after 48 h, stained with hematoxylin and eosin (A). Representative images illustrating morphological changes are shown (magnification: 100× and 400×). Spheroids cultured under 3D conditions were treated with increasing concentrations of MET (1–15 mM). After 10 days of treatment, cell viability was assessed using the APH assay (B). Results are expressed as viability relative to untreated controls (mean ± s.e.m.; n > 3). Data were analyzed by two-way ANOVA followed by Sidak’s post hoc multiple-comparison test. In addition, the colony-forming ability of A375 and A375-R cells was determined in the presence or absence of GSK2118436 (20 μM) and treated with MET (5 mM) (C). A representative image of the colonies obtained after 10 days using crystal violet staining is shown. Results are presented as colony formation efficiency or colony-covered area calculated with ImageJ. At the bottom, the ImageJ quantification is shown; color intensity corresponds to the staining intensity of each pixel (mean ± s.e.m; n>3; t-test).
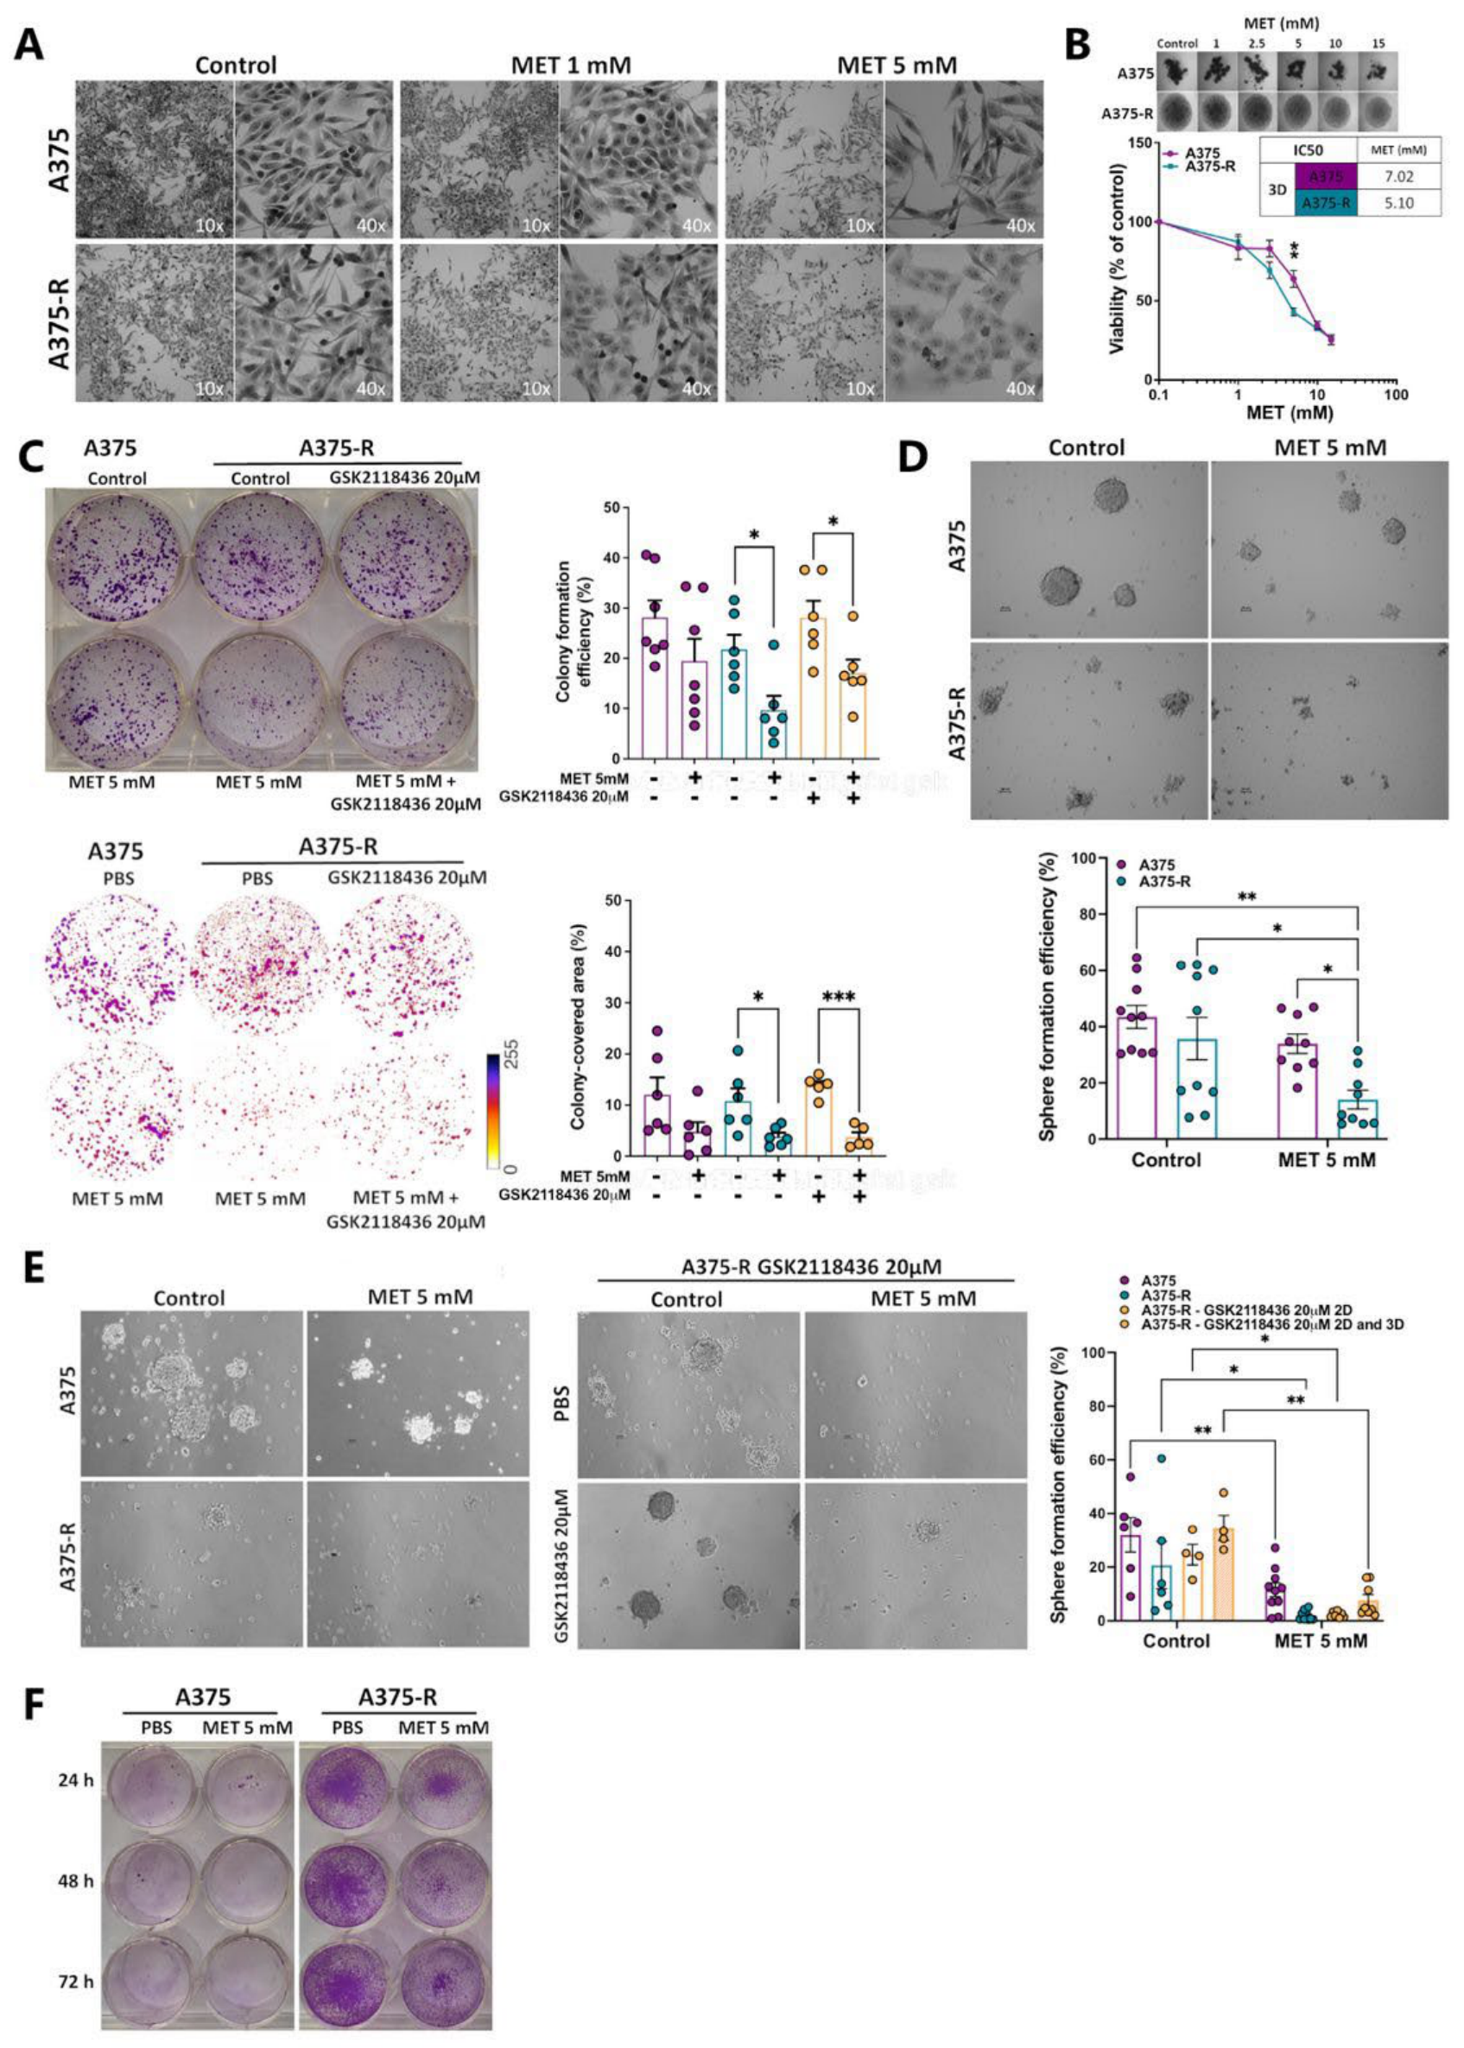
Figure 4.
Cytotoxic effects of combined GSK2118436 and metformin treatment in melanoma cells. A375 melanoma cells were treated with increasing concentrations of the BRAF inhibitor GSK2118436 (0.5–10 μM) and metformin (MET; 1–15 mM), either simultaneously (A) or sequentially (B and C). After treatment, cell viability was assessed using the APH assay and spheroid morphology was evaluated by bright-field optical microscopy (MO). Surface-mapped analysis and significance matrices based on the Loewe additivity model were generated using Combenefit software (A and B). Representative images of multicellular melanoma spheroids treated with BRAFi, MET, or their combination are shown (C) (magnification: 40×).
Figure 4.
Cytotoxic effects of combined GSK2118436 and metformin treatment in melanoma cells. A375 melanoma cells were treated with increasing concentrations of the BRAF inhibitor GSK2118436 (0.5–10 μM) and metformin (MET; 1–15 mM), either simultaneously (A) or sequentially (B and C). After treatment, cell viability was assessed using the APH assay and spheroid morphology was evaluated by bright-field optical microscopy (MO). Surface-mapped analysis and significance matrices based on the Loewe additivity model were generated using Combenefit software (A and B). Representative images of multicellular melanoma spheroids treated with BRAFi, MET, or their combination are shown (C) (magnification: 40×).
Disclaimer/Publisher’s Note: The statements, opinions and data contained in all publications are solely those of the individual author(s) and contributor(s) and not of MDPI and/or the editor(s). MDPI and/or the editor(s) disclaim responsibility for any injury to people or property resulting from any ideas, methods, instructions or products referred to in the content. |
© 2026 by the authors. Licensee MDPI, Basel, Switzerland. This article is an open access article distributed under the terms and conditions of the Creative Commons Attribution (CC BY) license (http://creativecommons.org/licenses/by/4.0/).
Copyright: This open access article is published under a Creative Commons CC BY 4.0 license, which permit the free download, distribution, and reuse, provided that the author and preprint are cited in any reuse.


