Preprint
Article

This version is not peer-reviewed.

Transcriptomic Profiling of Primary Human Dermal Fibroblasts Response to Perlatolic Acid and Bromoatranorin

Submitted:

22 July 2026

Posted:

23 July 2026

You are already at the latest version

Abstract

Background: Secondary metabolites of lichens have a wide range of biological activity, including geroprotective activity, but their complex effect on the human transcriptome remains poorly understood. The aim of the study was to evaluate the effects of perlatolic acid (PA) and bromoatranorine (Br) on the transcriptomic profile of primary human dermal fibroblasts (HDFs) to identify key target genes and signaling pathways. Methods and Results: HDFs were treated with PA and Br at concentrations of 1µM and 5µM, followed by analysis by high-throughput RNA sequencing (RNA-seq). Using the SenMayo panel, the GeneAge and MatrisomeDB databases, it was shown that PA leads to a significant decrease in the expression of key SASP factors: IL6, CXCL8, CCL2, IL32, and IGFBP family genes. Both compounds led to upregulation of matrix metalloproteinase genes (MMP1, MMP3, MMP12), which, in the case of PA, was accompanied by a predominant suppression of the expression of structural genes of the core matrisome. Based on the Gene Set Enrichment Analysis (GSEA), we identified pathways, such as Cell cycle/replication, genome maintenance, ECM/fibroblast matrix, and RNA/signaling/metabolism, which were significantly modulated by exposure to PA and, to a lesser extent, Br. Conclusions: The study describes for the first time the full-transcriptomic landscape of the response of fibroblasts to lichen depsides. PA acts as an active modulator of genetic networks, stimulating proliferative cascades and remodeling of the matrix. The identified targets open up prospects for the use of PA in regenerative biomedicine, while Br has a limited effect on the transcriptome.

Keywords: 
;  ;  ;  ;  ;  

1. Introduction

Aging is a complex biological process characterized by a gradual, systemic decrease in the adaptive capabilities of the organism and an increased vulnerability to age-related pathologies. At the molecular and cellular level, these changes are controlled by a conservative network of interrelated mechanisms, the hallmarks of aging, among which cellular senescence, large-scale epigenetic rearrangements, and chronic subclinical inflammation (inflammaging) play an important role [1,2].
One of the promising approaches to increasing healthy life expectancy is considered to be the search and use of geroprotectors, compounds capable of selectively modulating these regulatory cascades. Actively developing databases and classifications of potential geroprotective agents expand the possibilities for targeted search for new candidate molecules [3,4,5]. Biologically active natural compounds are of particular interest in this context due to their pleiotropic action and relatively high safety. Among them, secondary metabolites of lichens, depsides and depsidones, are a promising but poorly studied resource. These polyphenolic compounds, which evolved as adaptive agents of protection against ultraviolet radiation and biotic stress, have a unique spatial structure and diverse biological activity [6].
In this chemical class, the perlatolic acid and the specific halogenated depside bromoatranorine deserve special attention. The PA molecule contains a benzene ring fragment with several hydroxyl groups located in ortho positions relative to the carboxyl group, which determines its specific properties. It is known that PA has an immunomodulatory effect by regulating the synthesis of hydrogen peroxide and NO in macrophage cells [7]. In addition, it is able to inhibit microsomal prostaglandin E2 synthase-1 (mPGES-1), whose increased expression is observed in inflammation and various age-related diseases, including osteoarthritis, rheumatoid arthritis, and cancer [8]. Moreover, the activity of PA in inhibiting mPGES-1 (IC50 = 0.40 µM) is comparable to that of curcumin (IC50 = 0.3 µM) and surpasses many other studied natural compounds. The role of PA in the suppression of lipoxygenase-5 and transcription factor NF-kB has also been revealed, which causes its anti-inflammatory effect [8]. Experiments on neuroblastoma cells have shown that it participates in the acetylation of histones H3 and H4, a process functionally opposite to the action of the methyltransferase subunit EZH2 of the repressive PRC2 complex, and thus has neuroprotective and neurotrophic effects [9].
Br, in turn, is a derivative of atranorine, which is known for its anti-inflammatory, antioxidant, and antidiabetic properties [10,11]. Many atranorine derivatives exhibit similar activity, but have higher stability [12]. Due to the introduction of a bromine atom into the aromatic ring, Br can exhibit increased membranotropicity and selective cytotoxicity [6].
Despite the obvious potential of these small molecules, a comprehensive understanding of their effect on cellular programs at the transcriptomic level has not yet been obtained. The aim of this study was to study the effect of PA and Br on the full-transcriptome profile of primary dermal fibroblasts using high-throughput sequencing (RNA-seq) to identify key signaling pathways and genes modulated by these compounds. The obtained data expand the fundamental understanding of the molecular mechanisms of action of depsides and open up new prospects for their further research in the field of cell biology and regenerative biomedicine.

2. Results

2.1. The Effect of PA and Br on the Viability of Primary Human Fibroblasts

To determine the safe dosage range for PA and Br in terms of their cytotoxic effects, we assessed the viability of primary human dermal fibroblasts at 4th passage using the MTT (3-(4,5-dimethylthiazol-2-yl)-2,5-diphenyltetrazolium bromide) assay after 48 hours of exposure to the substances at concentrations ranging from 10nM to 10mM. The MTT test showed the absence of cytotoxic effects for PA in the concentration range up to 100 µM and for Br up to 10 µM (Figure 1). In general, our results are consistent with literature data showing that secondary metabolites of lichens are nontoxic at low doses [13]. Doses of 1 µM and 5 µM were selected for transcriptomic profiling as the most physiologically relevant.

2.2. Identification of Differentially Expressed Genes (DEGs)

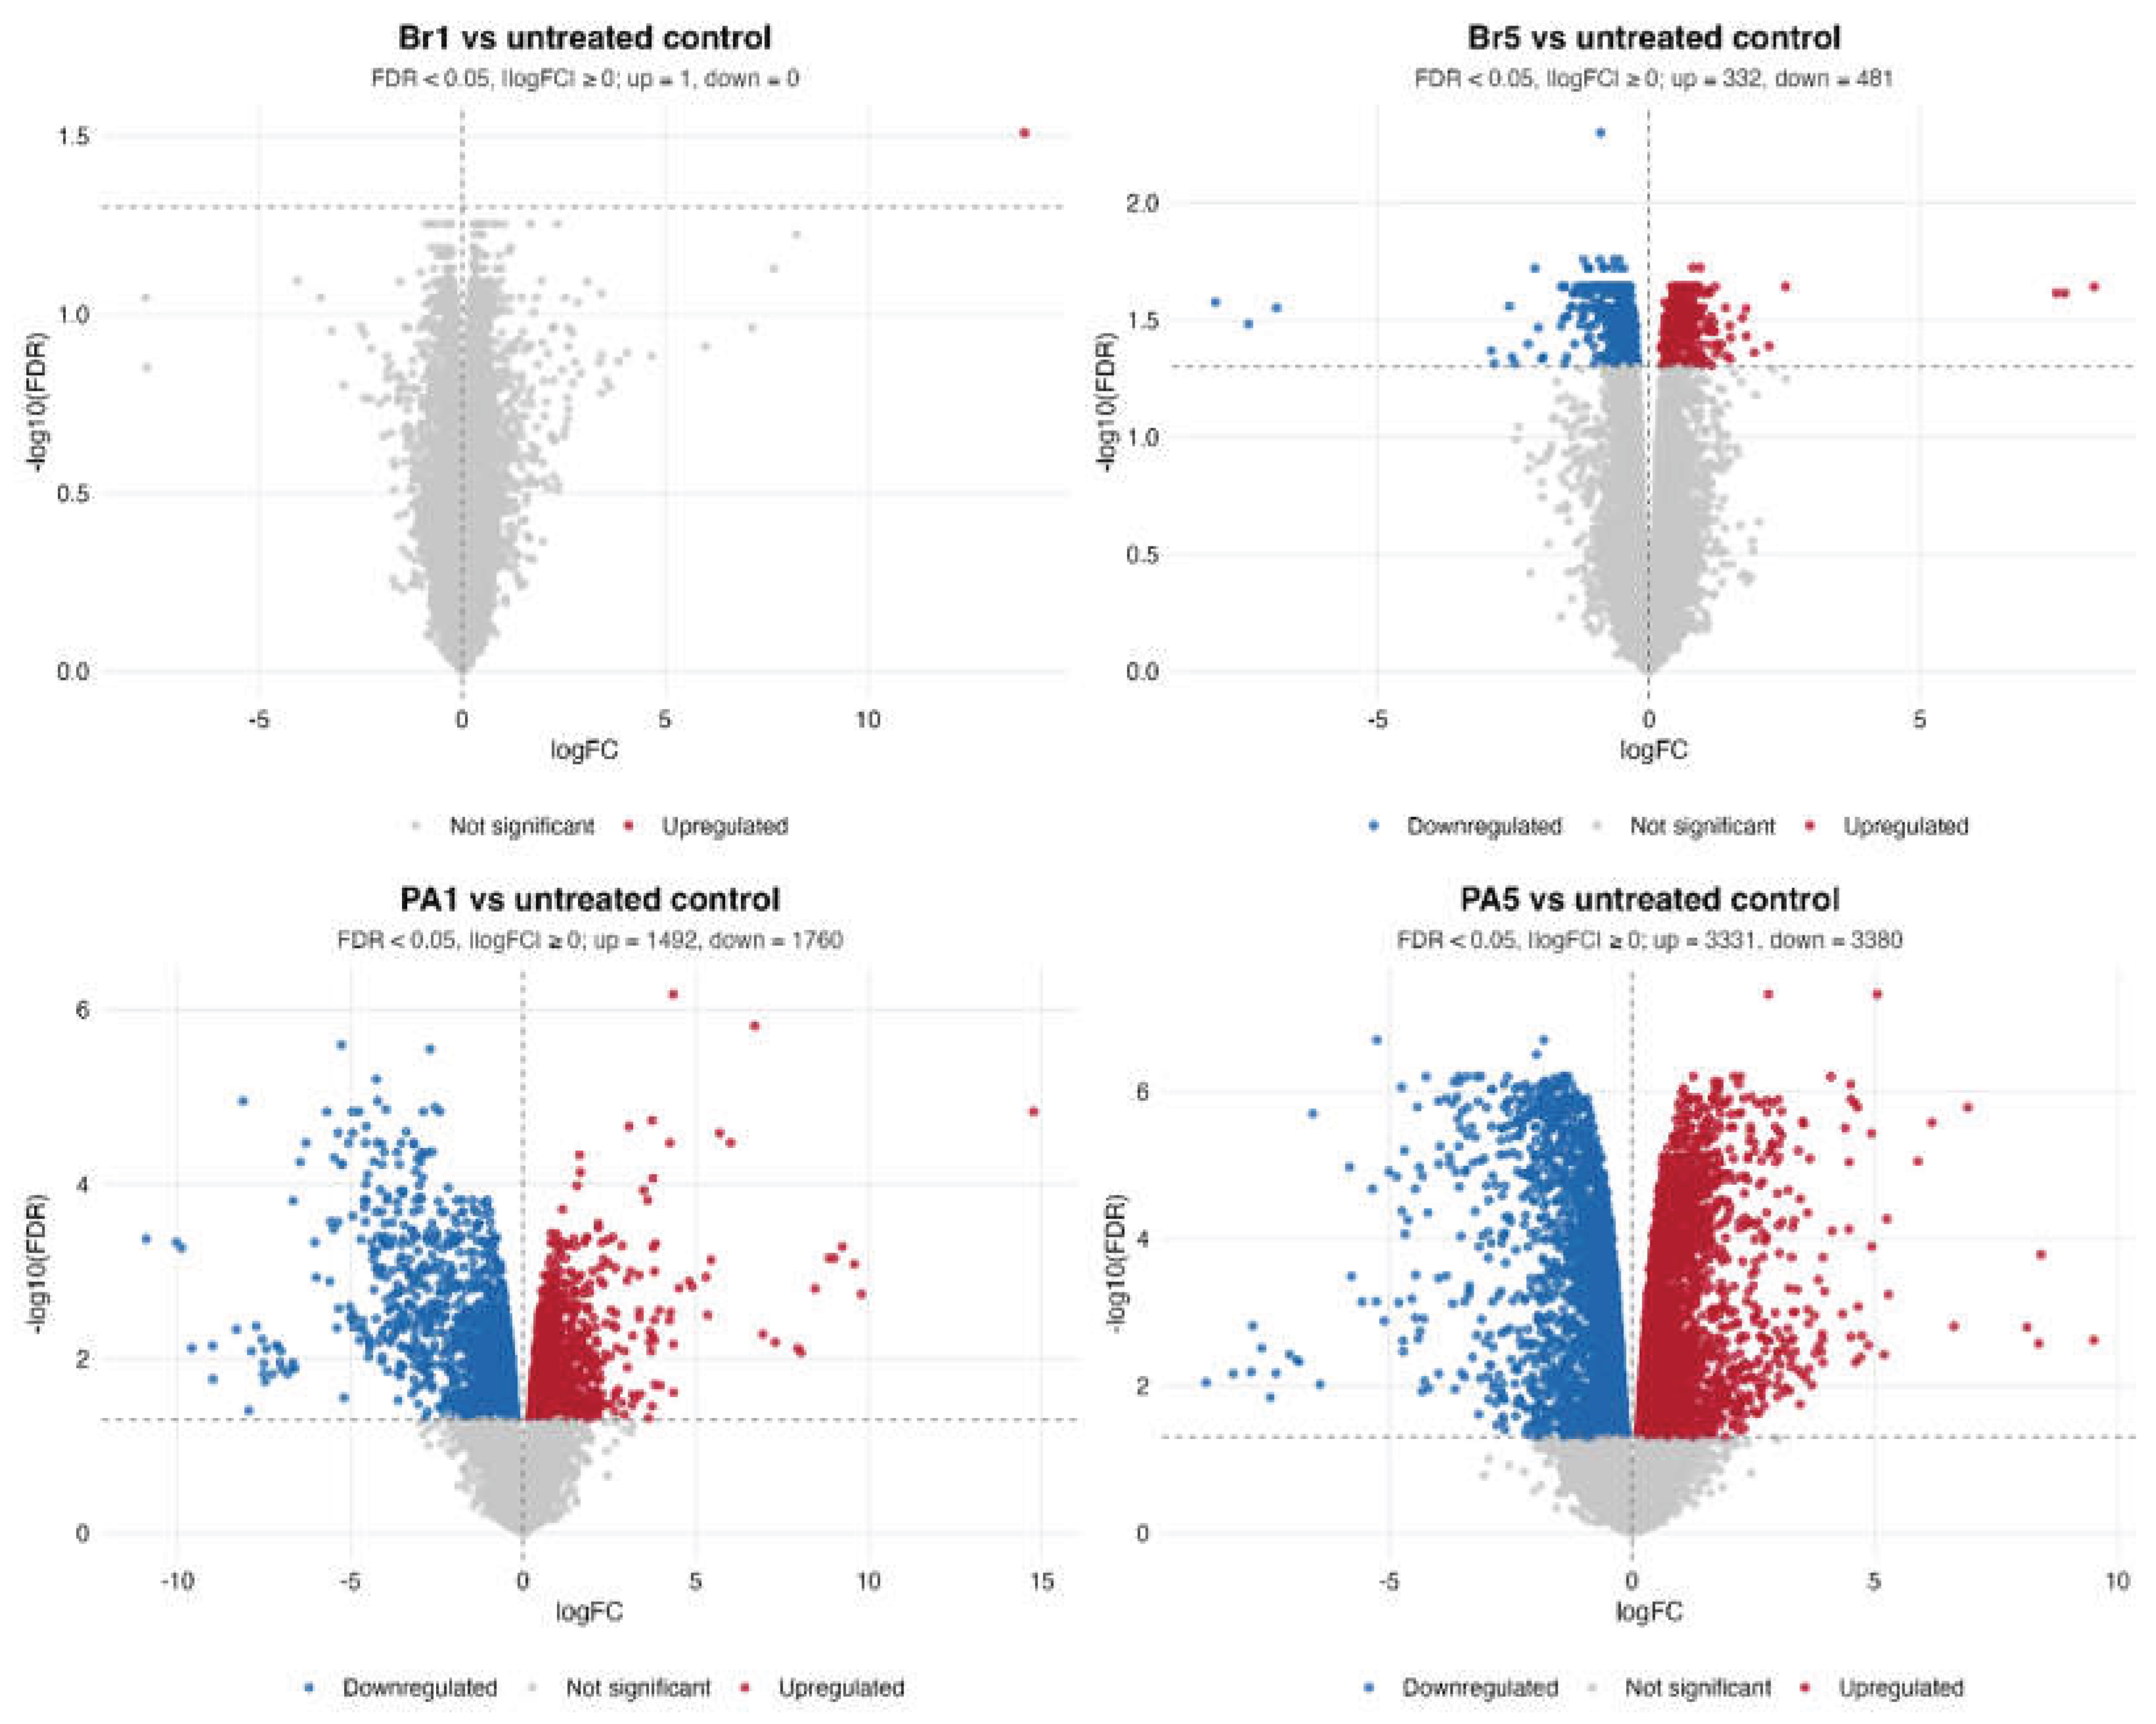
For transcriptome analysis, cells the same passage were treated with 1 μM or 5 μM of the tested compounds and incubated for 3 days. Differential gene expression analysis (DEG) showed a change in the expression of 567 and 1215 genes that passed the thresholds |logFC| > 1, logCPM > 1, FDR < 0.05, when PA was treated at concentrations of 1 µM and 5 µM, respectively (further in the text PA1 and PA5). For Br, the changes were much smaller: a statistically significant change was shown in 68 genes from the Br5 group. In Br1, only one gene passed the thresholds (Figure 2). A significant increase was shown in the expression of CTD-2545G14.7 (logFC = 13.84, logCPM = 4.97, FDR = 0.03). This increase was also detected during PA1 processing (logFC = 14.76, logCPM = 5.86, FDR = 1.47E-05). The complete lists of DEGs, including values of logFC, logCPM, and FDR, are provided in Supplementary Table S1.
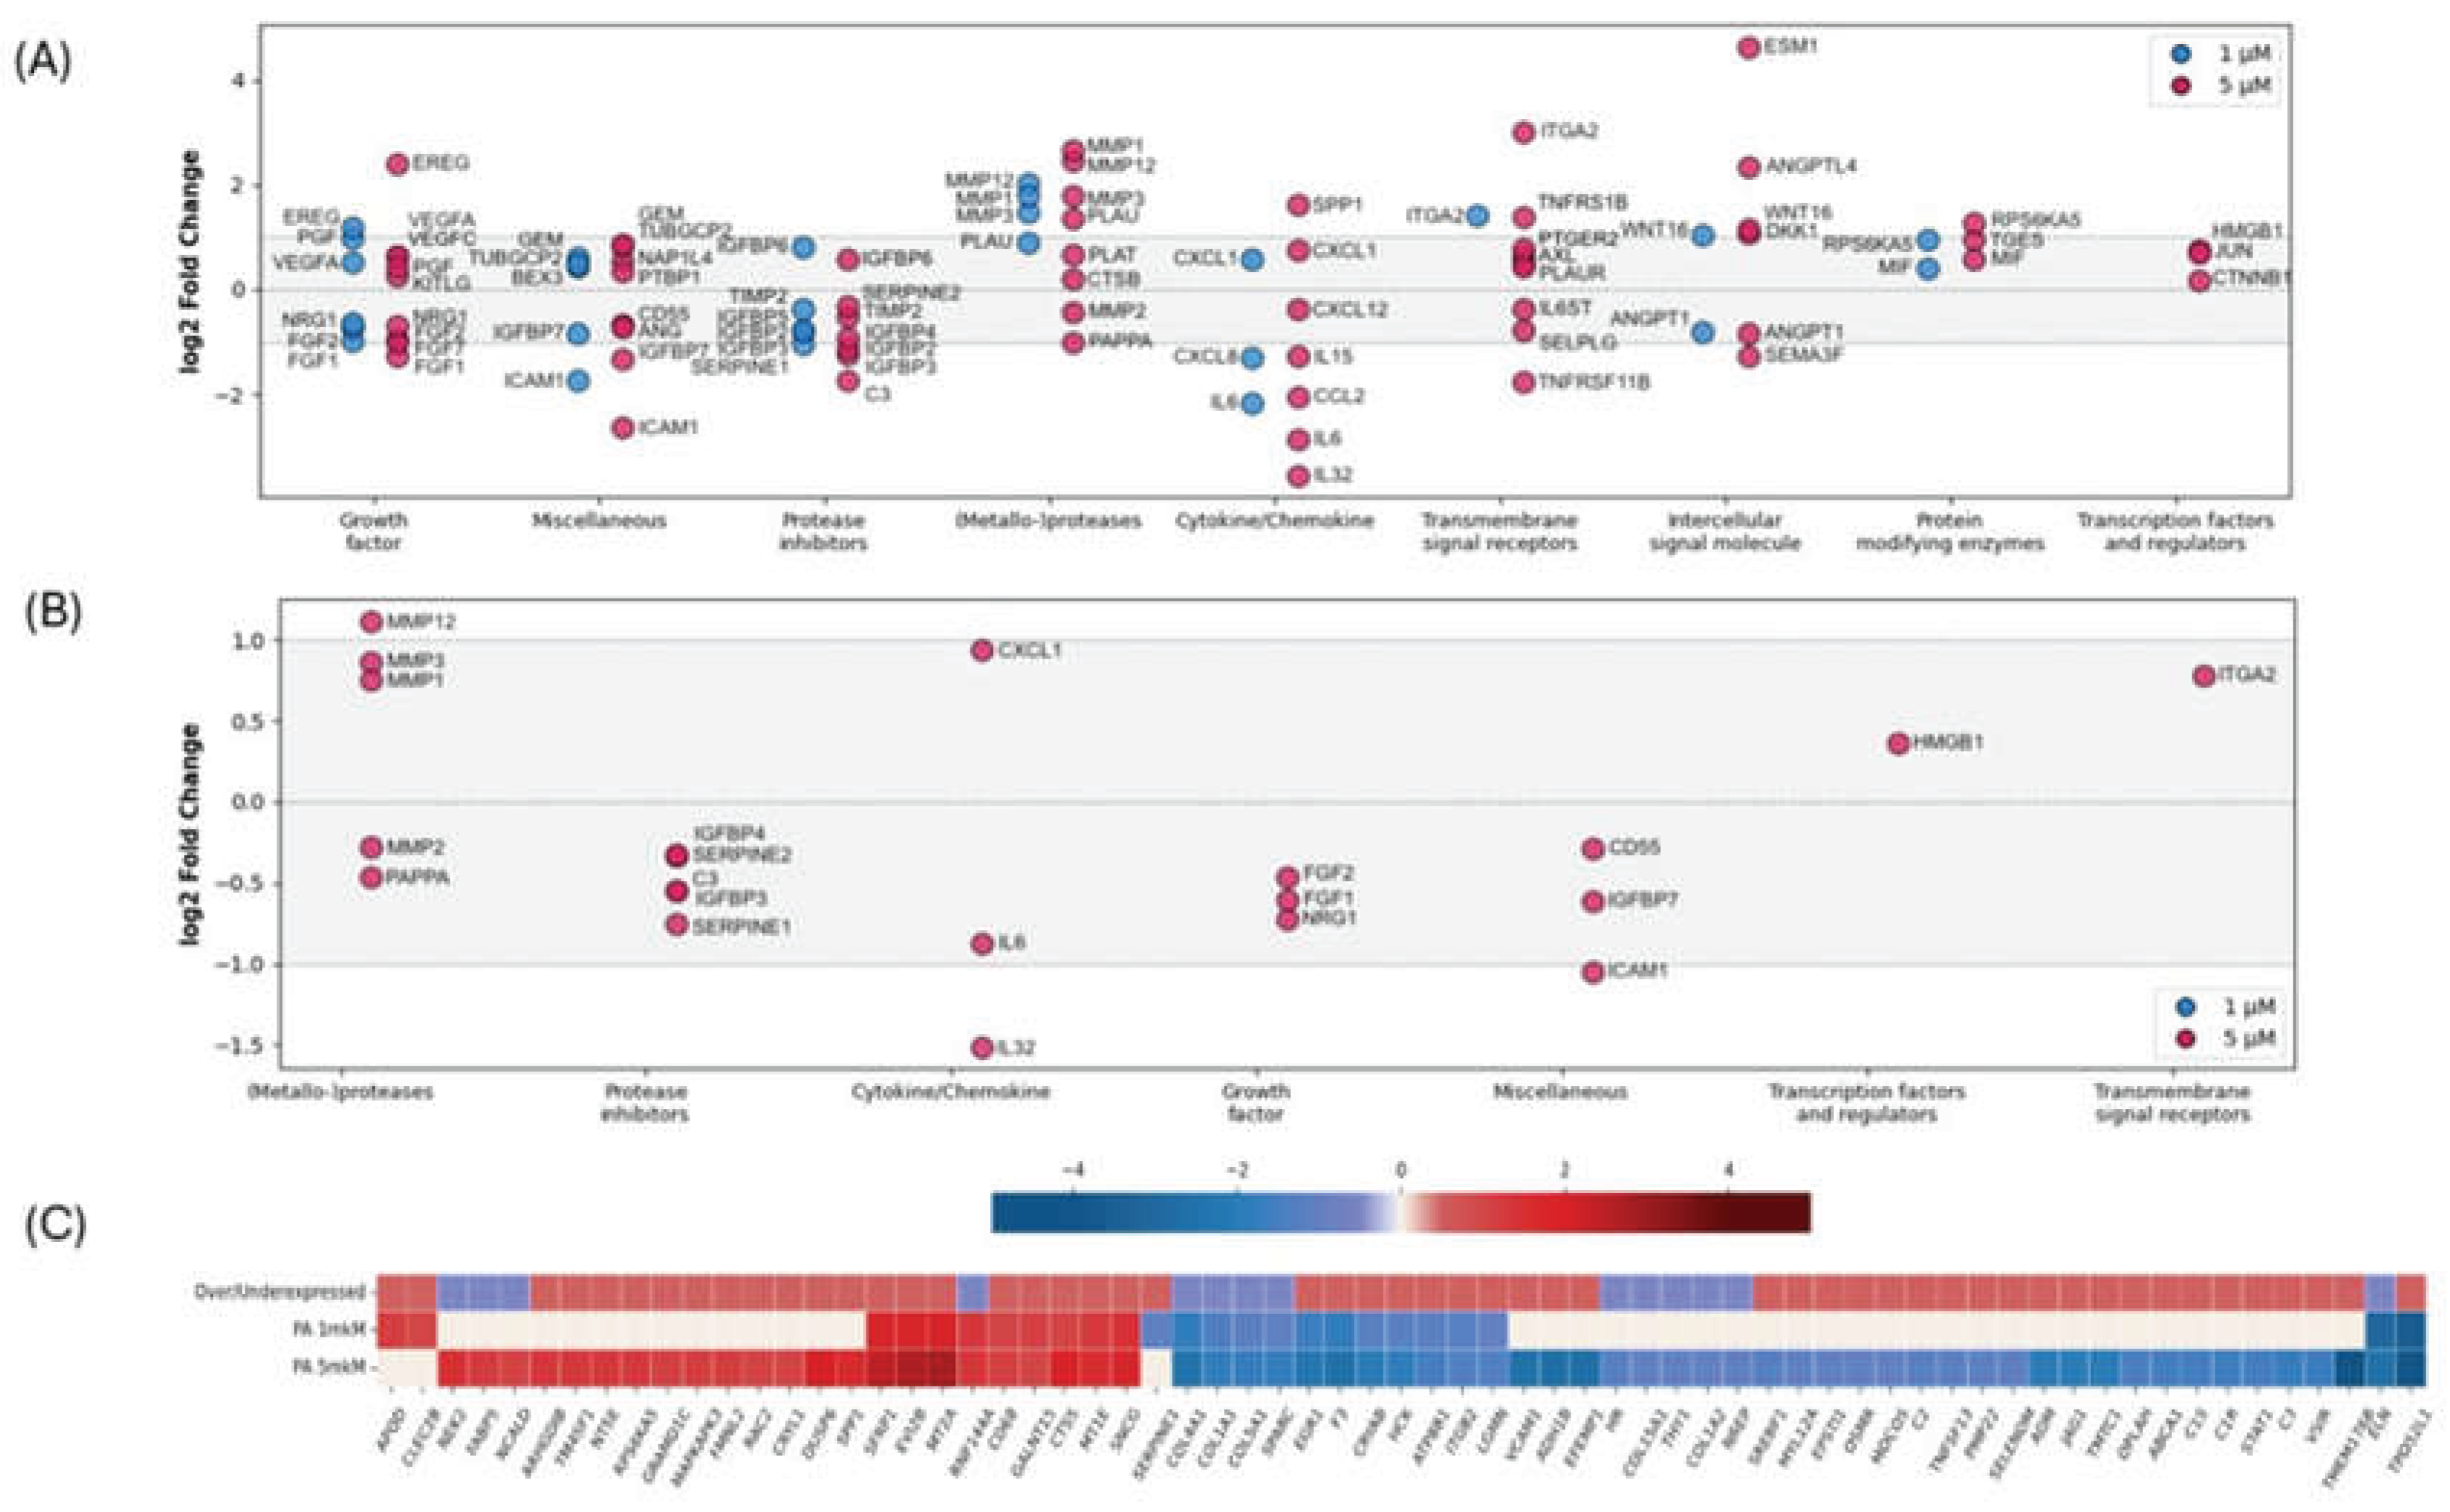
To assess the geroprotective potential of the studied natural compounds, we conducted a comparative analysis of DE gene profiles using a validated SenMayo panel of cellular aging markers. The panel included 125 genes that are markers of cell senescence [14]. Incubation of cells with PA resulted in dose-dependent suppression of pro-inflammatory components of SASP. The most pronounced effect was recorded at a concentration of 5 µm, where there was a statistically significant decrease in the expression of interleukin and chemokine genes (IL6, CCL2, IL32, IL15), genes encoding IGFBP family proteins (IGFBP2, IGFBP3, IGFBP7) (Figure 3A). PA5 shows significant overexpression of endothelial specific molecular marker 1 (ESM1), which may indicate activation of alternative cell survival pathways. When treating PA cells at a concentration of 1 μM, suppression of the expression of the interleukin 8 gene (CXCL8), which plays a key role in immune and inflammatory processes, as well as in the regulation of cellular responses during aging, was recorded. Also, in the 1 μM group, along with suppression of IL6 expression, a decrease in SERPINE1 was shown, which may indicate suppression of the IL-6/GATA2/SERPINE1 pathway involved in the regulation of cellular aging [15].
In contrast to PA, Br demonstrated significantly lower modulating activity against the SenMayo panel (Figure 3B). Exposure to Br at both studied concentrations (1 µM and 5 µM) led to only a slight decrease in the expression of a number of genes (for example, CXCL8, SERPINE1, IGFBP2), while the expression of most key SASP markers remained at a level comparable to the aging control. Interestingly, both compounds led to a significant increase in the expression of a number of matrix metalloproteinase genes (MMP1, MMP3, MMP12) responsible for active remodeling of the extracellular matrix, as well as the ITGA2 gene encoding integrin alpha-2.
Comparison of the results of the DEG analysis with the list of genes of the core matrisome (n = 274) and matrisome-associated genes (n = 753) obtained from MatrisomeDB (https://matrisomedb.org , accessed on March 23, 2024) showed that PA in both concentrations leads to a statistically significant decrease in most of the structure-forming genes of the extracellular matrix (ECM) (Supplementary Figure 1), including genes encoding the main targets of MMP1 and MMP12, such as COL1A1, SOL3A1, and ELN. A decrease in ELN expression was also detected during treatment with Br, albeit to a lesser extent (logFC = -1.56). Among the genes classified as collagens, only COL11A1 (logFC = -1) and COL14A1 (logFC = 1.22) showed a more than 2-fold change in expression in the Br5 group. A decrease in the expression of the HAPLN3 (logFC = -1) and ACAN (logFC = -1.62) genes encoding hyaluronan and aggrecan, key components of the hydrophilic framework of ECM, was also shown. Lists of DEGs for all experimental variants, with information about genes belonging to particular categories of matrisome genes (collagens, proteoglycans, ECM glycoproteins, ECM-affiliated proteins, ECM regulators, and secreted factors), are presented in Supplementary Table S2.
The next step of the analysis was to compare the data obtained (lists of DE genes) with the GenAge database [16], which contains data on more than 300 genes for which a functional relationship with the fundamental mechanisms of aging and longevity has been identified. According to the results, exposure to PA led to a significant change in the gene expression landscape, which was clearly dose-dependent. At a concentration of 5 µM, PA induced suppression (a more than 2-fold change in expression) of an extensive cluster of genes associated with cellular aging and pro-inflammatory signaling (Figure 3C). Among the repressed targets, genes for cell cycle regulation and transcription (EGR1, STAT1), cell adhesion and immune response molecules (CD74, VCAM1, ICAM1), components of the complement cascade (C1R, C1S, C2, C3), as well as regulators of lipid metabolism (SREBF1) deserve special attention. On the other hand, incubation with PA resulted in pronounced upregulation of an alternative cluster of GenAge genes responsible for antioxidant protection and cellular survival. In the PA groups (1 µm and 5 µm), an increase in the expression of MT2A, transcription factors (EVI2B, MAPKAPK3), lipid transport genes (APOD, FABP5) and key regulators of intracellular traffic pathways (SNCG, CTSS, GALNT15) was recorded.
In contrast to the large-scale transcriptional response induced by PA, the effect of Br was characterized by extremely limited regulatory potential for longevity genes. Among the entire pool of statistically significantly altered genes after Br treatment, only three targets from the GenAge database were identified. Incubation with Br caused moderate repression of the elastin gene (ELN, logFC = -1.56) and connective tissue growth factor (CTGF, logFC = -1.12), as well as minor induction of the gamma synuclein gene (SNCG, logFC = 1.11).
We also noticed that among the DEGs in cells treated with PA, there are many long non-coding RNAs (lncRNAs). By filtering out these transcriptomic data and isolating exclusively molecules with an approved nomenclature name (HUGO Gene Nomenclature Committee, HGNC), we identified lncRNAs that may be involved in epigenetic reprogramming (TSIX, KCNQ1OT1, MIR503HG), control of cytoskeletal dynamics, and suppression of secretory phenotype (VIM-AS1, ACTA2-AS1, HAS2-AS1, THBS1-IT1) and others. To identify potential regulatory cascades altered by exposure to PA, a cross-analysis of statistically significantly (FDR < 0.05) DE lncRNAs and mRNAs annotated as their targets was performed. The identified gene pairs were distributed into several functional clusters. Under conditions of lower concentrated exposure (PA1), a decrease in the expression of three antisense transcripts PCBP1-AS1 (logFC = -2.55), PTOV1-AS1 (logFC = -2.63), and VCAN-AS1 (logFC = -3.15) was found, which was associated with a decrease in the expression of their potential target HDAC9 (logFC = - 3.01) encoding histone deacetylase 9. Upon transition to PA5 conditions, the nature of the association remains, although it becomes less pronounced (logFC = -1.42), but at this point it correlates with moderate up regulation of LINC00517 lncRNA (logFC = 1.09). A concomitant decrease in the levels of HAS2-AS1 lncRNA (logFC = -2.99) and the HAS2 gene (logFC = -1.35) encoding hyaluronan synthase 2 was recorded at the PA1 group. At PA5, this trend continues: the decrease in HAS2-AS1 expression was logFC = -1.79, and for the HAS2 gene logFC was -1.74. In addition, at PA5, a significant decrease in expression was recorded for the transcript of insulin-like growth factor 2 associated with the same locus (IGF2, logFC = -3.40).
At PA5, the most multidirectional nature of gene expression was revealed in KCNQ1OT1, level of which was significantly decreased (logFC = -1.28). There were two opposite transcriptional trends among potential targets: mRNA expression decreased for SERTAD4 (logFC = -1.32), limbic protein Ajuba (AJUBA, logFC = -1.19) and structural protein titina (TTN, logFC = -1.08), along with an increase in the expression of genes controlling the cell cycle and nuclear architecture — centromeric protein E (CENPE, logFC = 1.27), DNA repair gene FANCD2 (logFC = 1.43) and chromatin factor HMGA2 (logFC = 1.56). Among the other "lncRNA—mRNA" pairs, a pattern of unidirectional decrease in transcriptional activity prevails. The complete list of significant lncRNA–target pairs, including source database, interaction type, supporting evidence, and correlation statistics, is provided in Supplementary Table S3.

2.3. GSEA-Based Pathway Enrichment Analysis

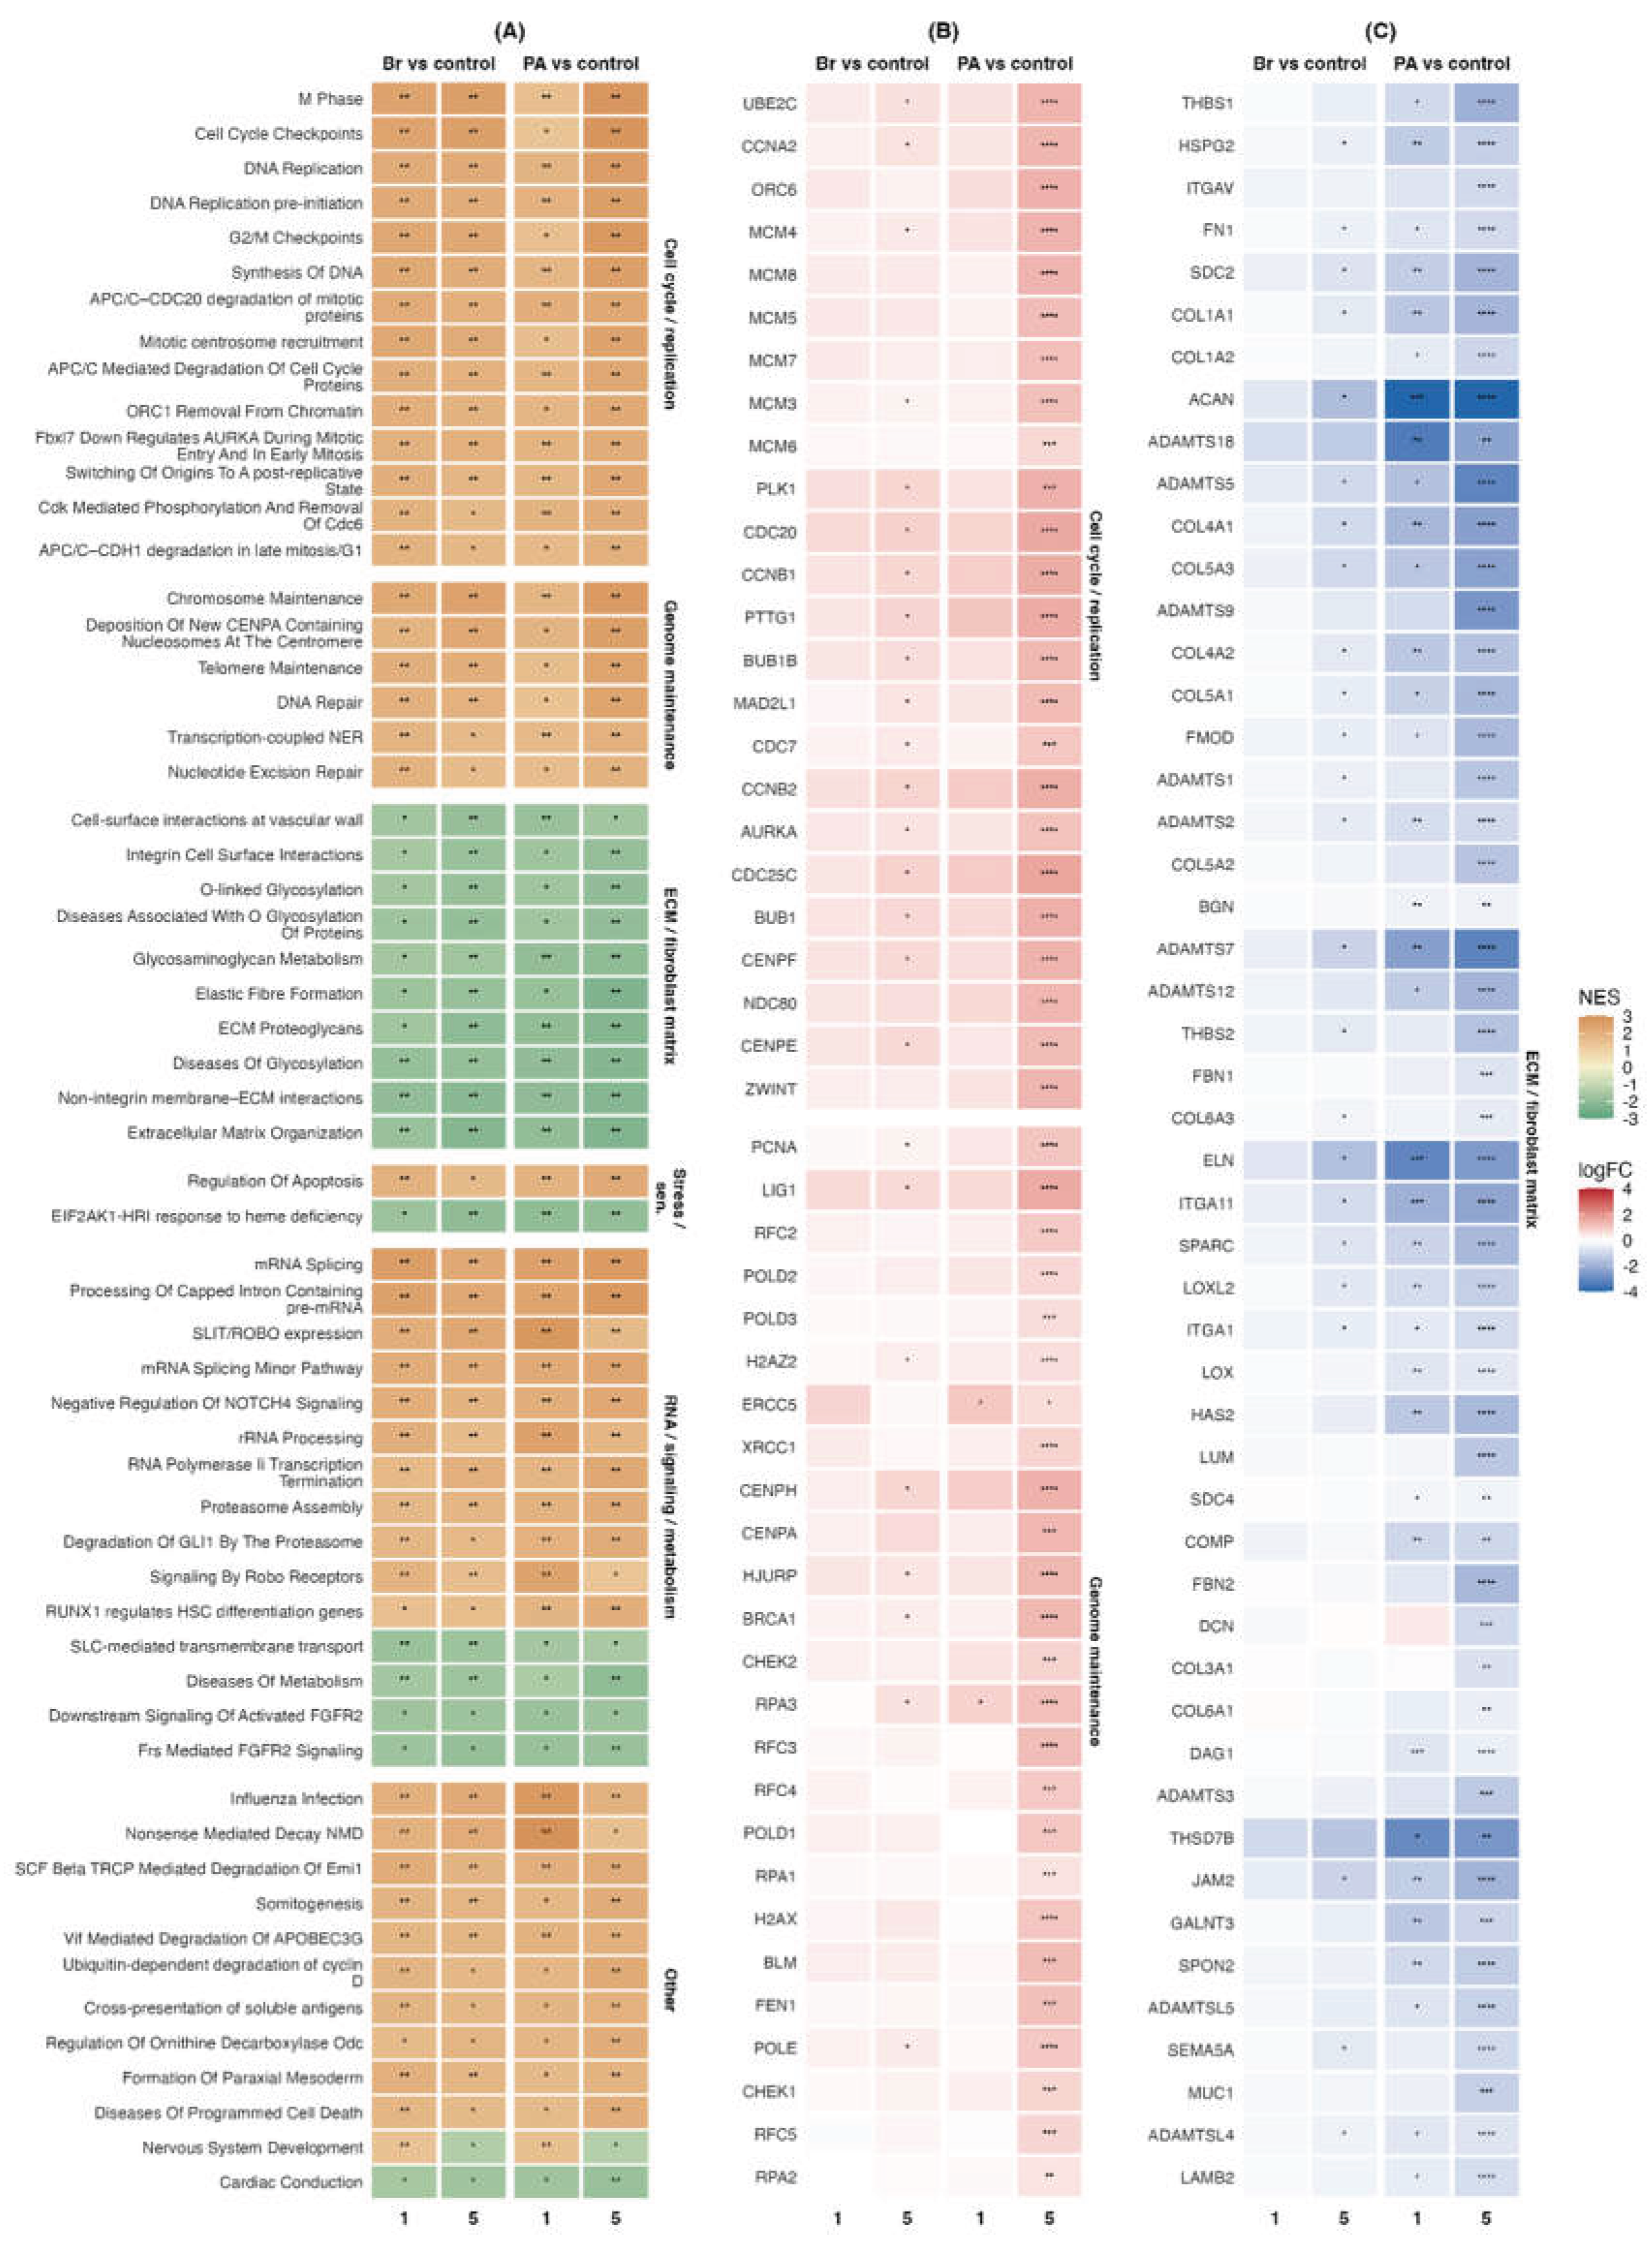
To assess changes at the level of biological processes, a Gene Set Enrichment Analysis (GSEA) was performed separately for each comparison: (Br1 vs control, Br5 vs control, PA1 vs control and PA5 vs control). The analysis included a complete ranked list of genes for each comparison. The genes were ranked based on the direction of expression change and statistical significance, which made it possible to evaluate coordinated shifts in entire biological pathways. The Reactome database was used for functional annotation. Based on our analysis, we identified several large functional blocks: Cell cycle/replication, genome maintenance, ECM/fibroblast matrix, RNA/signaling/metabolism, and others, that were significantly enriched in all four comparisons were identified. The most pronounced positive enrichment was observed for pathways related to the cell cycle, mitosis, and DNA replication. This group includes such Reactome pathways as «M phase», «cell cycle checkpoints», «DNA replication», «DNA replication pre-initiation», «synthesis of DNA», «G2/M checkpoints», as well as pathways associated with «APC/C-mediated degradation of cell cycle proteins». This indicates a coordinated activation of proliferation, cell cycle, and division preparation programs in the treated cells compared to the control. The second large positively enriched block included the genome maintenance pathways: «chromosome maintenance», «telomere maintenance», «DNA repair», «nucleotide excision repair», and «transcription-coupled nucleotide excision repair». These changes may reflect increased replication processes and related mechanisms for controlling DNA damage and maintaining chromosomal structure.
In contrast, the block of pathways associated with the extracellular matrix and the fibroblast matrix program showed predominantly negative enrichment. Such pathways as «extracellular matrix organization», «non-integrin membrane–ECM interactions», «ECM proteoglycans», «elastic fiber formation», «glycosaminoglycan metabolism», «O-linked glycosylation», «integrin cell surface interactions» and «cell-surface interactions at the vascular wall» are noted among them. When examining the block of pathways associated with stress and senescence, it was found that the Reactome pathway «Regulation of apoptosis» was positively enriched, while the «Response of EIF2AK1/HRI to heme deficiency» demonstrated negative enrichment. This result may indicate a restructuring of the stress response, in which individual pathways of cellular stress and apoptotic regulation change in different directions (Figure 4A).
Considering that the GSEA showed a stable restructuring of several large transcriptomic programs, our next step was to conduct a Leading-Edge Analysis (LEA) to identify the genes within the enriched set that make the main contribution to the detected biological signal. For all comparisons, the leading-edge genes of significant Reactome pathways were extracted and considered (Figure 4B and 4C). These genes were grouped according to previously identified functional pathway blocks. The selection of genes for visualization included the presence of a gene in the leading edge in at least two of the four comparisons. This approach allowed us to focus on repetitive transcriptomic changes characteristic of several processing conditions.
It is shown that the analysis of leading-edge genes confirmed the results of GSEA at the level of individual genes. A consistent increase in the expression of genes related to DNA replication, mitotic control, and cell cycle passage was observed in the cell cycle/replication block. The most pronounced effect was observed in the PA5 vs control comparison, where most genes showed increased expression with high statistical significance. Under Br conditions, the effect was less pronounced, especially with Br1, but the general trend towards an increase in some of the cell cycle genes persisted. The genome maintenance block also showed an increase in gene expression related to replication, DNA repair, and maintenance of chromosome structure. The opposite profile was revealed for the ECM/fibroblast-matrix block, where most of the leading-edge genes of this group showed a decrease in expression, especially under PA1 and PA5 conditions. These data confirm that the negative enrichment of ECM/fibroblast-matrix pathways is associated with a coordinated decrease in extracellular matrix genes, collagens, proteoglycans, glycosaminoglycan metabolism, and cell-matrix interactions. It is worth noting the presence of HAS2 among these genes, since it links the result at the pathway level with the previously identified HAS2-AS1–HAS2 pair and indicates a possible regulation of the hyaluronic/ECM component of the transcriptomic response. In the stress/senescence block, the most pronounced changes were associated with a decrease in stress response genes, especially during PA treatment. Collectively, the leading-edge analysis showed that common GSEA signals are formed by coordinated changes in specific groups of genes. Treatments, especially PA5, were associated with an increase in cell cycle genes, replication, and genome maintenance, as well as a decrease in ECM/fibroblast matrix and part of stress response programs.

3. Discussion

The search for safe and effective geroprotectors that can slow down the fundamental processes of aging and increase the duration of healthy human life is an urgent task in modern gerontology. Secondary metabolites from lichens occupy a special niche among the promising natural compounds in this context. However, the characteristic pleiotropic effect and multiple biological activities of these natural compounds significantly complicate the identification of their exact molecular mechanisms. In this context, primary high-throughput screening using RNA-seq serves as a valid method for obtaining comprehensive pilot data that can be used to map changes in the transcriptional landscape of cells and identify specific directions for further in-depth mechanistic studies.
As previously mentioned, PA can inhibit the activation of the transcription factor NF-κB [8], which acts as a key regulator of SASP and controls the expression of factors such as IL-1α, IL-1β, IL-6, IL-8, CCL2, CCL5, CXCL1, and many other mediators [17,18]. Through the secretion of these signaling molecules, senescent cells induce changes in surrounding cells through a paracrine pathway, which leads to the degradation of the ECM, depletion of the stem cell pool, and the development of inflammaging [19]. Our study revealed that PA dose-dependently inhibits the expression of key SASP genes in fibroblasts, including interleukins and chemokines (IL6, CXCL8, CCL2, IL32), a number of genes encoding insulin-like growth factor-binding proteins (IGFRs), and the SERPINE1. At the same time, an increase in the expression of matrix metalloproteinase genes (MMP1, MMP3, MMP12) was observed, which are also traditionally included in the core of the SASP and whose up-regulation is associated with the processes of aging. While the increase in the expression of these metalloproteinases under the influence of PA was accompanied by a concomitant suppression of the transcription of the structural components of the matrisome, in the case of Br, we did not observe a significant shift in the expression profile of the matrisome genes. This indicates that these two compounds have fundamentally different molecular mechanisms of action on the components of the ECM of the dermis.
Notably, along with the activation of MMPs genes under the influence of PA, a significant dose-dependent increase in the expression of the integrin α2β1 (ITGA2) gene, the main receptor for type I fibrillar collagen on fibroblasts [20], was observed, as well as the suppression of the ACTA2 gene, which encodes smooth muscle actin (α-SMA), a key marker of myofibroblasts. The decrease in ACTA2 expression in this profile may indicate the suppression of the transformation of fibroblasts into myofibroblasts and, consequently, the inhibition of the profibrogenic program [21]. It is known that in cells expressing integrin α2β1, MMP-1 is induced upon direct contact with type I fibrillar collagen, while this induction does not occur in cells lacking this receptor [22]. Additionally, integrin α2β1 physically interacts with pro-MMP-1 through the I-domain of the α2 subunit, binding both the pro- and active forms of the enzyme, which ensures a strictly localized proteolysis of the ECM directly on the cell surface [23]. Taken together, this transcriptomic pattern (ITGA2↑, MMP1/3/12↑, COL1A1/COL3A1↓, ACTA2↓, IL6/IL1B↓) indicates a directed transition of fibroblasts from an anabolic (matrix-synthesizing) to a catabolic (matrix-degrading) state, while simultaneously shutting down pro-inflammatory and fibrogenic programs, which is also consistent with the results of the GSEA. It is worth noting that these changes may have dual biological significance: on the one hand, they have a physiological role (directed tissue remodeling and potential antifibrotic effects), and on the other hand, they have a pathophysiological role (the risk of degradation of ECM structural elements associated with tumor invasion) [21]. Among the matrix genes that demonstrated a dose-dependent decrease in expression under the influence of PA, the LOXL3 gene, which encodes lysyl oxidase-like 3 and is involved in matrix maturation through the cross-linking of collagen and elastin fibers [24,25], should also be highlighted. In recent years, lysyl oxidase-like 3 has been discovered to have intracellular functions that are not related to matrix remodeling, and one of its most significant functions is maintaining genome stability through physical interactions with key DNA repair and mitosis proteins such as BRCA1, BRCA2, MSH2, SMC1A, and NUMA1 [25,26]. Interestingly, our results showed a slight but statistically significant increase in the expression of these genes, and the GSEA analysis revealed a significant enrichment of the «genome maintaince» pathway.
Although the overall trend in the enrichment dynamics of pathways under Br exposure is similar to that of PA, a detailed analysis of individual statistically significant DEGs suggests that there are no changes in genes associated with the fibroblastic phenotype. While in the case of PA, the activation of MMP1, MMP3, and MMP12 expression appears to reflect a physiological program of active-matrix remodeling, in the case of Br, the isolated increase in MMP levels may indicate a non-specific stress-induced cellular response in fibroblasts.
Analysis of DEGs also revealed upregulation of the EZH2 and PHF19 genes under the influence of PA, accompanied by a decrease in the expression of the transcriptional regulators EGR1 and CDKN2B. Given the fundamental role of EZH2 methyltransferase in the epigenetic repression of SASP loci and the coordination of the cellular response to DNA damage, it can be assumed that the regulatory effect of PA is partially mediated by the stabilization of the functional state of the repressive PRC2 complex. Since the IL6, CXCL8, and CCL2 genes are under the direct transcriptional control of the Polycomb complex [27], the suppression of these markers under the influence of PA is consistent with the hypothesis of activation of EZH2-dependent silencing. Our data partially echo the recent work of J. Sengstack et al. [28], where it was shown that the induction of EZH2 expression in aging human fibroblasts leads to a reversal of the signs of the senescent phenotype, restoration of proliferative activity, mitochondrial function and proteostasis with a decrease in the level of markers of senescence.
An additional confirmation of the epigenetic shift under the influence of PA was a decrease in the expression of the regulatory lncRNA KCNQ1OT1, which functions as a cis-acting silencer recruiting PRC2 complexes (including EZH2), histone methyltransferase G9a and DNA methyltransferase DNMT1 to chromatin [29,30]. The suppression of KCNQ1OT1 under the influence of PA indicates a modulation of the epigenetic landscape mediated by a change in the recruitment pattern of PRC2/G9a [31,32]. This process can lead to targeted derepression of target genes stimulating mitotic division (CENPE, HMGA2) and DNA repair (FANCD2), while reducing the expression of genes involved in maintaining structural integrity and cell adhesion (TTN, AJUBA). A parallel increase in the levels of EZH2 itself may lead to increased repression of alternative loci, which indicates a global redistribution of Polycomb methylation activity across the genome. Nevertheless, given the complex and dual role of EZH2 in the modulation of the cell cycle and aging known from the literature, the verification of this hypothesis requires additional studies, for example, ChIP-seq analysis or profiling the distribution of the histone label H3K27me3 on the promoters of SASP genes.
In model of diabetic nephropathy, it has previously been demonstrated that KCNQ1OT1 regulates proliferation, apoptosis, and fibrosis through the KCNQ1OT1/miR-18b-5p/SORBS2 regulatory axis and the NF-kB cascade [33]. It has been experimentally proven that both KCNQ1OT1 knockdown and SORBS2 suppression are able to restrain excessive fibrogenic program and proliferation in mesangial cells. In our study, we recorded a significant decrease in SORBS2 gene expression (logFC = -1.72) under the action of PA. In addition, the suppression of another lncRNA, VCAN-AS1, found by us, according to literature data (obtained in gastric cancer models), is associated with proliferation restriction and induction of apoptosis through activation of the p53-dependent signaling pathway and its downstream effectors p21 and Fas [34]. A decrease in the expression of the potential target of VCAN-AS1, the histone deacetylase 9 (HDAC9) gene, for which the p53 protein is one of the keys non—histone deacetylation substrates, also suggests that the p53-dependent cascade is modulated by PA. In the context of aging biology, it is known that HDAC9 expression is induced by the oncogenic Ras protein in senescent human fibroblasts and potential geroprotective compounds are able to reduce the level of its expression, which is confirmed by data on an age-dependent increase in HDAC9 induction and its association with fibrotic and inflammatory processes [35]. In particular, the carotenoid astaxanthin, which has geroprotective properties, selectively suppresses HDAC9 expression in cellular test systems [36], which underlines the importance of identifying a similar pattern for PA. Another interesting result was a consistent decrease in the expression of the HAS2-AS1 pair and its target gene HAS2 under the action of PА at both concentrations (PA1: logFC = -2.99 and -1.35; PA5: logFC = -1.79 and -1.74; Pearson r ≈ 0.99). HAS2-AS1 is an antisense transcript of the hyaluronan synthase 2 (HAS2) gene, and their directed decrease suggests that this lncRNA functions as a HAS2 activator in fibroblasts. Since the transcription of HAS2-AS1 is triggered by the NF-kB factor, a decrease in the activity of the HAS2-AS1→HAS2 axis may reflect the suppression of NF-kB under the action of PA [37]. HAS2 is involved in the development of fibrosis and the differentiation of fibroblasts into myofibroblasts, therefore, its repression is consistent with the decrease in ACTA2 expression and the negative enrichment of ECM associated pathways that we have identified. At the same time, it should be borne in mind that in the context of aging, it is not so much the level of the synthase itself that is functionally significant, as the molecular weight of the hyaluronic acid synthesized by it, since its high-molecular form has an anti-inflammatory effect and is associated with longevity [38].
We recognize a number of objective limitations inherent in the design of this screening study. For example, in the context of assessing the dynamics of extracellular matrix gene expression, cell culture under standard 2D conditions is a serious limiting factor, since hard plastic has been proven to distort the transcriptional aging program and the mechanobiological response of cells [39,40]. Recent studies have convincingly shown that 3D in vitro models significantly better mimic the natural tissue architecture of the dermis and reproduce an in vivo-like gene expression profile [24,41]. A logical continuation of this work will be the validation of PA effects on matrices in 3D hydrogels or spheroids. The second important point is the lack of functional validation of proteins: the present work is in the nature of primary bioinformatic profiling of the transcriptome. The revealed changes at the mRNA level require further confirmation by RT-qPCR, Western blotting, and ELISA methods to assess the actual cytokine secretion and enzymatic activity of MMP at the protein level.
Nevertheless, despite these objective limitations, the present screening study yields a set of fundamentally novel findings that merit close scientific attention, since it provides the first detailed characterization of the response profile of primary human dermal fibroblasts to perlatolic acid and bromoatranorine. The results show that PA acts as an active modulator of fibroblast genetic networks, transferring cells from an anabolic to a matrix-degrading state with concomitant shutdown of profibrogenic and pro-inflammatory programs. It has also been shown that the action of PA is associated with a complex restructuring of epigenetic regulation systems, including the induction of EZH2 methyltransferase and the repression of regulatory long non-coding RNAs KCNQ1OT1, VCAN-AS1, and HAS2-AS1 which opens up new directions for studying the mechanisms of directed chromatin control. In turn, exposure to bromoatranorine did not lead to significant changes in the transcriptome at low concentrations, and the upregulation of metalloproteinases caused by it has the character of a non-specific cellular response to chemical stress, which emphasizes the high structural specificity of the action of the studied polyphenols.

4. Materials and Methods

4.1. Cell Culture

Primary human dermal fibroblasts were isolated from eyelid skin biopsies obtained during routine blepharoplasty procedures at the Department of Maxillofacial and Reconstructive Plastic Surgery (Petrovsky National Research Center of Surgery). Written informed consent was obtained from the patient prior to tissue collection. The study protocol was formally approved by the Local Ethics Committee of the Petrovsky National Research Centre of Surgery (Protocol No. 6, dated June 20, 2025). The tissue samples were thoroughly washed in HBSS (BioinnLabs, Russia) supplemented with antibiotics, and mechanically minced into small fragments (0.1 mm³). Enzymatic dissociation was performed in Dulbecco's Modified Eagle Medium (DMEM; BioinnLabs) containing 0.1% type I collagenase (Worthington Biochemical Corp., USA) for 24 h at 37°C in a humidified atmosphere with 5% CO₂. The resulting cell suspension was washed twice with DPBS (BioinnLabs) via centrifugation at 100 × g for 5 min. Cells were subsequently cultured in DMEM supplemented with 10% FBS (Gibco, USA), 2 mM L-glutamine, and 1% penicillin/streptomycin (PanEco, Russia). The culture medium was refreshed every 48 h until the cells reached 80% confluence. Subculturing was performed using TrypLE Express enzyme (Gibco, USA). Fibroblasts at passage 4 were utilized for all subsequent experiments. PA Br (>95% purity) were generously provided by the Engineering Center of N.N. Vorozhtsov Novosibirsk Institute of Organic Chemistry of the SB RAS (Russia).

4.2. Cell Viability Assay (MTT Assay)

To evaluate the potential cytotoxicity and determine the non-toxic concentration range of PA and Br, cell viability was assessed using the MTT assay. HDFs were seeded into 96-well plates at a density of 2 x 10^3 cells per well. Following cell attachment (6 h post-seeding), the culture medium was replaced with fresh medium containing either PA or Br at concentrations ranging from 10 nM to 10 mM. After 48 h of incubation with the target compounds, 20 µL of MTT solution (Sigma-Aldrich, USA) was added to each well, and the plates were incubated for an additional 3 h under standard incubator conditions (37°C, 5% CO₂). Subsequently, the supernatant was completely aspirated, and 100 µL of dimethyl sulfoxide (DMSO) was added to each well to solubilize the formazan crystals. The plates were agitated on an orbital shaker for 20 min to ensure complete dissolution. The optical density was measured at 530 nm, with a reference background subtraction at 620 nm, using a Victor3 microplate reader (PerkinElmer, USA).

4.3. RNA Isolation and Sequencing

For transcriptome analysis, 4th passage cells were seeded in 12-well plates. After cell attachment, the medium was replaced with fresh medium containing 1 μM or 5 μM of the test compounds and incubated for 3 days. Untreated cells served as a control. Total RNA from cells were isolated using a Quick-RNA MiniPrep Kit (Zymo Research, USA) according to the manufacturer’s instructions. The quantity and quality of total RNA were checked using a Qubit®2.0 Fluorometer (Thermo Fisher Scientific, USA), NanoDrop® ND-1000 spectrophotometer (NanoDrop Technologies Inc., Wilmington, DE, USA), and Qsep1 (BiOptic, Taiwan). For subsequent library preparation, samples with a RIN (RNA Integrity Number) > 8 were used. To obtain mRNA, total RNA was enriched by Poly (A) using VAHTS mRNA Capture Beads (Vazyme Biotech, China). Double-stranded cDNA libraries were prepared using a VAHTS® Universal V8 RNA-seq Library Prep Kit for Illumina (Vazyme Biotec) according to the manufacturer’s protocol. cDNA quality was checked with the bioanalyzer Qsep1 (BiOptic) using a Srandard Cartridge S2 (BiOptic). Then, cDNA libraries were normalized to 4 nM, pooled together, and sequenced with 100 bp single-end reads on the NextSeq2000 System (Illumina, USA). The sequencing data are available at the NCBI Sequence Read Archive (GSE336273).

4.4. Bioinformatic Analysis

Raw RNA-seq reads in FASTQ format were subjected to quality control using FastQC and MultiQC (accessed on 23 March 2025). Reads were aligned to the GRCh38 human reference genome using STAR [43]. Transcript abundances were quantified in alignment-based mode using Salmon from STAR-generated alignments [44]. Differential gene expression analysis was performed in the R statistical environment using the edgeR package (v3.36) [45]. Count data were normalized using the trimmed mean of M-values (TMM) method, and differential expression was assessed using the quasi-likelihood F-test (QLF test). P-values were adjusted for multiple testing using the Benjamini–Hochberg false discovery rate (FDR) correction. Genes with |logFC| > 1, logCPM > 1, and FDR < 0.05 were considered differentially expressed. To evaluate the geroprotective potential of the tested compounds, differentially expressed genes were compared with curated reference gene sets. Cellular senescence markers were assessed using the validated SenMayo panel (125 genes) [14]. Genes functionally associated with ageing and longevity were retrieved from the GenAge database (Human Ageing Genomic Resources; more than 300 genes) [16]. Extracellular matrix genes were annotated using MatrisomeDB (https://matrisomedb.org, accessed on 23 March 2024), distinguishing the core matrisome (n = 274) from matrisome-associated genes (n = 753). For the SenMayo analysis, transcripts passing logCPM > 1 and FDR < 0.05 were retained without applying the |logFC| > 1 cut-off, in order to allow visualization of low-magnitude changes, whereas the GenAge and matrisome comparisons used the differential expression thresholds defined above. GSEA was performed separately for each comparison (Br1, Br5, PA1, and PA5 versus untreated control) using the clusterProfiler package (v3.14.3) [46]. For each comparison, all detected genes were ranked according to the direction and statistical significance of their expression change, and enrichment was tested against gene sets from the Reactome pathway database (version 2025) [47]. Gene sets outside a defined size range were excluded, and p-values were adjusted using the Benjamini–Hochberg FDR correction. Pathways with FDR < 0.05 were considered significantly enriched, and the normalized enrichment score (NES) was used to represent the direction and magnitude of enrichment. Significantly enriched pathways recurring across comparisons were grouped into major functional blocks (cell cycle/replication, genome maintenance, ECM/fibroblast matrix, stress/senescence, and RNA/signaling/metabolism). To identify the genes driving the observed enrichment signals, a leading-edge analysis was performed on the GSEA output. For each significantly enriched Reactome pathway (FDR < 0.05), the leading-edge genes were extracted in every comparison and assigned to the functional blocks defined above. To focus on transcriptional changes recurring across treatment conditions, genes were retained for visualization if they appeared in the leading edge of a significant pathway in at least two of the four comparisons. To assess the potential regulatory contribution of lncRNAs differential expression was evaluated separately for lncRNA transcripts in each comparison using the same edgeR pipeline and significance thresholds applied to protein-coding genes (|logFC| > 1, logCPM > 1, FDR < 0.05). For each differentially expressed lncRNA, candidate target genes were retrieved from curated interaction databases covering both RNA–RNA and RNA–protein interactions: NPInter, RNAInter, and ENCORI/starBase [48,49,50]. Interaction records from the three resources were merged, and the resulting candidate lncRNA–target pairs were intersected with the differential expression results. A pair was retained only when, within the same comparison, the lncRNA was significantly differentially expressed, a documented lncRNA–target interaction was present in at least one database, and the predicted target gene was also significantly differentially expressed. For every retained pair, concordance between lncRNA and target gene expression was quantified across the control and treated samples of the corresponding comparison using TMM-normalized expression values (log-CPM); Pearson and Spearman correlation coefficients and their associated p-values were computed to assess whether the direction of expression change was consistent with co-regulation.

Supplementary Materials

The following supporting information can be downloaded at the website of this paper posted on Preprints.org. Supplementary Table S1. Lists of differentially expressed genes (DEGs) across all treatment comparisons versus untreated control (including logFC, logCPM, and FDR values); Supplementary Table S2. Lists of differentially expressed genes (DEGs) for Br1, Br5, PA1, and PA5 comparisons, with assigned matrisome categories (collagens, proteoglycans, ECM glycoproteins, ECM-affiliated proteins, ECM regulators, and secreted factors); Supplementary Table S3. Significant lncRNA–target mRNA pairs with interaction evidence and correlation statistics; Supplementary Figure S1. Heatmap visualization of DEGs from the core matrisome and matrisome-associated genes across Br1, Br5, PA1, and PA5 treatment groups, showing a dose-dependent suppression of structural ECM genes under PA treatment.

Author Contributions

All authors contributed to the study conception and design. Methodology, Z.G.G., O.A.L. and E.A.P.; Investigation, E.R.K., I.U.B., I.Y.B, V.V.S. and A.V.K.; Data Curation, R.A.L. and A.V.S.; Writing—Original Draft Preparation, M.I.S., E.A.P., Z.G.G. and A.A.M.; Writing—Review, A.A.M. and Z.G.G.; Visualization, E.R.K., E.A.P. All authors commented on previous versions of the manuscript and read and approved the final manuscript.

Funding

Funding was provided by Ministry of Education and Science of Russian Federation (FURG-2025-0059, Project Reg. No 1025021200029-4).

Data Availability Statement

The sequencing data are available at the NCBI Sequence Read Archive (GSE336273).

Acknowledgments

We thank the EIMB RAS “Genome” center (https://www.eimb.ru/ru1/ckp/ccu_genome_c.php) for technical assistance.

Conflicts of Interest

The authors declare no conflicts of interest.

Abbreviations

The following abbreviations are used in this manuscript:
PA Perlatolic acid
Br Bromoatranorine
HDFs Primary human dermal fibroblasts
RNA-seq RNA sequencing
SASP Senescence-Associated Secretory Phenotype
GSEA Gene Set Enrichment Analysis
MTT 3-(4,5-dimethylthiazol-2-yl)-2,5-diphenyltetrazolium bromide
DEGs differentially expressed genes
lnc RNAs long non-coding RNAs

References

  1. FRANCESCHI, C.; BONAFÈ, M.; VALENSIN, S.; OLIVIERI, F.; DE LUCA, M.; OTTAVIANI, E.; DE BENEDICTIS, G. Inflamm-aging: An Evolutionary Perspective on Immunosenescence. Ann. N. Y. Acad. Sci. 2000, 908, 244–254. [Google Scholar] [CrossRef]
  2. López-Otín, C.; Blasco, M.A.; Partridge, L.; Serrano, M.; Kroemer, G. Hallmarks of Aging: An Expanding Universe. Cell 2023, 186, 243–278. [Google Scholar] [CrossRef]
  3. Moskalev, A.; Chernyagina, E.; de Magalhães, J.P.; Barardo, D.; Thoppil, H.; Shaposhnikov, M.; Budovsky, A.; Fraifeld, V.E.; Garazha, A.; Tsvetkov, V.; et al. Geroprotectors.Org: A New, Structured and Curated Database of Current Therapeutic Interventions in Aging and Age-Related Disease. Aging 2015, 7, 616–628. [Google Scholar] [CrossRef] [PubMed]
  4. Moskalev, A.; Guvatova, Z.; Lopes, I.D.A.; Beckett, C.W.; Kennedy, B.K.; De Magalhaes, J.P.; Makarov, A.A. Targeting Aging Mechanisms: Pharmacological Perspectives. Trends Endocrinol. Metab. 2022, 33, 266–280. [Google Scholar] [CrossRef] [PubMed]
  5. Moskalev, A.; Chernyagina, E.; Tsvetkov, V.; Fedintsev, A.; Shaposhnikov, M.; Krut’ko, V.; Zhavoronkov, A.; Kennedy, B.K. Developing Criteria for Evaluation of Geroprotectors as a Key Stage toward Translation to the Clinic. Aging Cell 2016, 15, 407–415. [Google Scholar] [CrossRef] [PubMed]
  6. Ren, M.; Jiang, S.; Wang, Y.; Pan, X.; Pan, F.; Wei, X. Discovery and Excavation of Lichen Bioactive Natural Products. Front. Microbiol. 2023, 14. [Google Scholar] [CrossRef] [PubMed]
  7. Carlos, I.Z.; Quilles, M.B.; Carli, C.B.A.; Maia, D.C.G.; Benzatti, F.P.; Lopes, T.I.B.; Gianini, A.S.; Brum, R.L.; Vilegas, W.; dos Santos, L.C.; et al. Lichen Metabolites Modulate Hydrogen Peroxide and Nitric Oxide in Mouse Macrophages. Z. Für Naturforschung C 2009, 64, 664–672. [Google Scholar] [CrossRef] [PubMed]
  8. Khurana, P.; Jachak, S.M. Chemistry and Biology of Microsomal Prostaglandin E 2 Synthase-1 (MPGES-1) Inhibitors as Novel Anti-Inflammatory Agents: Recent Developments and Current Status. RSC Adv. 2016, 6, 28343–28369. [Google Scholar] [CrossRef]
  9. Oettl, S.K.; Gerstmeier, J.; Khan, S.Y.; Wiechmann, K.; Bauer, J.; Atanasov, A.G.; Malainer, C.; Awad, E.M.; Uhrin, P.; Heiss, E.H.; et al. Imbricaric Acid and Perlatolic Acid: Multi-Targeting Anti-Inflammatory Depsides from Cetrelia Monachorum. PLoS ONE 2013, 8, e76929. [Google Scholar] [CrossRef] [PubMed]
  10. Gaikwad, S.; Verma, N.; Sharma, B.O.; Behera, B.C. Growth Promoting Effects of Some Lichen Metabolites on Probiotic Bacteria. J. Food Sci. Technol. 2014, 51, 2624–2631. [Google Scholar] [CrossRef] [PubMed]
  11. Wang, H.; Lin, X.; Huang, G.; Zhou, R.; Lei, S.; Ren, J.; Zhang, K.; Feng, C.; Wu, Y.; Tang, W. Atranorin Inhibits NLRP3 Inflammasome Activation by Targeting ASC and Protects NLRP3 Inflammasome-Driven Diseases. Acta Pharmacol. Sin. 2023, 44, 1687–1700. [Google Scholar] [CrossRef] [PubMed]
  12. Duong, T.-H.; Paramita Devi, A.; Tran, N.-M.-A.; Phan, H.-V.-T.; Huynh, N.-V.; Sichaem, J.; Tran, H.-D.; Alam, M.; Nguyen, T.-P.; Nguyen, H.-H.; et al. Synthesis, α-Glucosidase Inhibition, and Molecular Docking Studies of Novel N-Substituted Hydrazide Derivatives of Atranorin as Antidiabetic Agents. Bioorg. Med. Chem. Lett. 2020, 30, 127359. [Google Scholar] [CrossRef] [PubMed]
  13. Desmarets, L.; Millot, M.; Chollet-Krugler, M.; Boustie, J.; Camuzet, C.; François, N.; Rouillé, Y.; Belouzard, S.; Tomasi, S.; Mambu, L.; et al. Lichen or Associated Micro-Organism Compounds Are Active against Human Coronaviruses. Viruses 2023, 15, 1859. [Google Scholar] [CrossRef] [PubMed]
  14. Saul, D.; Kosinsky, R.L.; Atkinson, E.J.; Doolittle, M.L.; Zhang, X.; LeBrasseur, N.K.; Pignolo, R.J.; Robbins, P.D.; Niedernhofer, L.J.; Ikeno, Y.; et al. A New Gene Set Identifies Senescent Cells and Predicts Senescence-Associated Pathways across Tissues. Nat. Commun. 2022, 13, 4827. [Google Scholar] [CrossRef] [PubMed]
  15. Su, H.; Lin, X.; Paredong, A.; Yao, C.; Zhang, Y.; Geng, M.; Guan, Y.; Gong, L.; Jiang, F.; Lv, Q.; et al. IL-6/GATA2/SERPINE1 Pathway Is Implicated in Regulating Cellular Senescence after Acute Kidney Injury. Front. Mol. Biosci. 2025, 12. [Google Scholar] [CrossRef] [PubMed]
  16. de Magalhães, J.P.; Abidi, Z.; dos Santos, G.A.; Avelar, R.A.; Barardo, D.; Chatsirisupachai, K.; Clark, P.; De-Souza, E.A.; Johnson, E.J.; Lopes, I.; et al. Human Ageing Genomic Resources: Updates on Key Databases in Ageing Research. Nucleic Acids Res. 2024, 52, D900–D908. [Google Scholar] [CrossRef] [PubMed]
  17. Kalra, R.; Conlan, X.A.; Goel, M. Recent Advances in Research for Potential Utilization of Unexplored Lichen Metabolites. Biotechnol. Adv. 2023, 62, 108072. [Google Scholar] [CrossRef] [PubMed]
  18. Wang, B.; Han, J.; Elisseeff, J.H.; Demaria, M. The Senescence-Associated Secretory Phenotype and Its Physiological and Pathological Implications. Nat. Rev. Mol. Cell Biol. 2024, 25, 958–978. [Google Scholar] [CrossRef] [PubMed]
  19. Ajoolabady, A.; Pratico, D.; Tang, D.; Zhou, S.; Franceschi, C.; Ren, J. Immunosenescence and Inflammaging: Mechanisms and Role in Diseases. Ageing Res. Rev. 2024, 101, 102540. [Google Scholar] [CrossRef] [PubMed]
  20. Stricker, T.P.; Dumin, J.A.; Dickeson, S.K.; Chung, L.; Nagase, H.; Parks, W.C.; Santoro, S.A. Structural Analysis of the A2 Integrin I Domain/Procollagenase-1 (Matrix Metalloproteinase-1) Interaction. J. Biol. Chem. 2001, 276, 29375–29381. [Google Scholar] [CrossRef] [PubMed]
  21. Giannandrea, M.; Parks, W.C. Diverse Functions of Matrix Metalloproteinases during Fibrosis. Dis. Model. Mech. 2014, 7, 193–203. [Google Scholar] [CrossRef] [PubMed]
  22. Zigrino, P.; Drescher, C.; Mauch, C. Collagen-Induced ProMMP-2 Activation by MT1-MMP in Human Dermal Fibroblasts and the Possible Role of A2β1 Integrins. Eur. J. Cell Biol. 2001, 80, 68–77. [Google Scholar] [CrossRef] [PubMed]
  23. Stricker, T.P.; Dumin, J.A.; Dickeson, S.K.; Chung, L.; Nagase, H.; Parks, W.C.; Santoro, S.A. Structural Analysis of the A2 Integrin I Domain/Procollagenase-1 (Matrix Metalloproteinase-1) Interaction. J. Biol. Chem. 2001, 276, 29375–29381. [Google Scholar] [CrossRef] [PubMed]
  24. Laurentino, T. de S.; Soares, R. da S.; Marie, S.K.N.; Oba-Shinjo, S.M. LOXL3 Function Beyond Amino Oxidase and Role in Pathologies, Including Cancer. Int. J. Mol. Sci. 2019, 20, 3587. [Google Scholar] [CrossRef] [PubMed]
  25. Santamaría, P.G.; Floristán, A.; Fontanals-Cirera, B.; Vázquez-Naharro, A.; Santos, V.; Morales, S.; Yuste, L.; Peinado, H.; García-Gómez, A.; Portillo, F.; et al. Lysyl Oxidase-like 3 Is Required for Melanoma Cell Survival by Maintaining Genomic Stability. Cell Death Differ. 2018, 25, 935–950. [Google Scholar] [CrossRef] [PubMed]
  26. Jeong, C.; Kim, Y. LOXL3-Sv2, a Novel Variant of Human Lysyl Oxidase-like 3 (LOXL3), Functions as an Amine Oxidase. Int. J. Mol. Med. 2017, 39, 719–724. [Google Scholar] [CrossRef] [PubMed]
  27. Hui, T.; A., P.; Zhao, Y.; Yang, J.; Ye, L.; Wang, C. EZH2 Regulates Dental Pulp Inflammation by Direct Effect on Inflammatory Factors. Arch. Oral Biol. 2018, 85, 16–22. [Google Scholar] [CrossRef] [PubMed]
  28. Sengstack, J.; Zheng, J.; Aghayev, T.; Bieri, G.; Mobaraki, M.; Lin, J.; Deng, C.; Villeda, S.A.; Li, H. Systematic Identification of Single Transcription Factor Perturbations That Drive Cellular and Tissue Rejuvenation. Proc. Natl. Acad. Sci. 2026, 123. [Google Scholar] [CrossRef] [PubMed]
  29. Andresini, O.; Rossi, M.N.; Matteini, F.; Petrai, S.; Santini, T.; Maione, R. The Long Non-Coding RNA Kcnq1ot1 Controls Maternal P57 Expression in Muscle Cells by Promoting H3K27me3 Accumulation to an Intragenic MyoD-Binding Region. Epigenet. Chromatin 2019, 12, 8. [Google Scholar] [CrossRef] [PubMed]
  30. Xia, F.; Wang, Y.; Xue, M.; Zhu, L.; Jia, D.; Shi, Y.; Gao, Y.; Li, L.; Li, Y.; Chen, S.; et al. LncRNA KCNQ1OT1: Molecular Mechanisms and Pathogenic Roles in Human Diseases. Genes Dis. 2022, 9, 1556–1565. [Google Scholar] [CrossRef] [PubMed]
  31. Pandey, R.R.; Mondal, T.; Mohammad, F.; Enroth, S.; Redrup, L.; Komorowski, J.; Nagano, T.; Mancini-DiNardo, D.; Kanduri, C. Kcnq1ot1 Antisense Noncoding RNA Mediates Lineage-Specific Transcriptional Silencing through Chromatin-Level Regulation. Mol. Cell 2008, 32, 232–246. [Google Scholar] [CrossRef] [PubMed]
  32. Kanduri, C. Kcnq1ot1: A Chromatin Regulatory RNA. Semin. Cell Dev. Biol. 2011, 22, 343–350. [Google Scholar] [CrossRef] [PubMed]
  33. Jie, R.; Zhu, P.; Zhong, J.; Zhang, Y.; Wu, H. LncRNA KCNQ1OT1 Affects Cell Proliferation, Apoptosis and Fibrosis through Regulating MiR-18b-5p/SORBS2 Axis and NF-ĸB Pathway in Diabetic Nephropathy. Diabetol. Metab. Syndr. 2020, 12, 77. [Google Scholar] [CrossRef] [PubMed]
  34. Feng, L.; Li, J.; Li, F.; Li, H.; Bei, S.; Zhang, X.; Yang, Z. Long Noncoding RNA VCAN-AS1 Contributes to the Progression of Gastric Cancer via Regulating P53 Expression. J. Cell. Physiol. 2020, 235, 4388–4398. [Google Scholar] [CrossRef] [PubMed]
  35. Yang, C.; Croteau, S.; Hardy, P. Histone Deacetylase (HDAC) 9: Versatile Biological Functions and Emerging Roles in Human Cancer. Cell. Oncol. 2021, 44, 997–1017. [Google Scholar] [CrossRef] [PubMed]
  36. Yang, Y.; Bae, M.; Park, Y.-K.; Lee, Y.; Pham, T.X.; Rudraiah, S.; Manautou, J.; Koo, S.I.; Lee, J.-Y. Histone Deacetylase 9 Plays a Role in the Antifibrogenic Effect of Astaxanthin in Hepatic Stellate Cells. J. Nutr. Biochem. 2017, 40, 172–177. [Google Scholar] [CrossRef] [PubMed]
  37. Vigetti, D.; Deleonibus, S.; Moretto, P.; Bowen, T.; Fischer, J.W.; Grandoch, M.; Oberhuber, A.; Love, D.C.; Hanover, J.A.; Cinquetti, R.; et al. Natural Antisense Transcript for Hyaluronan Synthase 2 (HAS2-AS1) Induces Transcription of HAS2 via Protein O-GlcNAcylation. J. Biol. Chem. 2014, 289, 28816–28826. [Google Scholar] [CrossRef] [PubMed]
  38. Zhang, Z.; Tian, X.; Lu, J.Y.; Boit, K.; Ablaeva, J.; Zakusilo, F.T.; Emmrich, S.; Firsanov, D.; Rydkina, E.; Biashad, S.A.; et al. Increased Hyaluronan by Naked Mole-Rat Has2 Improves Healthspan in Mice. Nature 2023, 621, 196–205. [Google Scholar] [CrossRef] [PubMed]
  39. Bao, X.; Xu, Z.; Wang, X.; Zhang, T.; Ye, H.; Yang, H. Three-Dimensional Culture of Orbital Fibroblasts From Thyroid Eye Disease Induce In Vivo-Like Tissue Remodeling and Fibrosis. Invest. Ophthalmol. Vis. Sci. 2025, 66, 67. [Google Scholar] [CrossRef] [PubMed]
  40. Hughes, B.K.; Davis, A.; Milligan, D.; Wallis, R.; Mossa, F.; Philpott, M.P.; Wainwright, L.J.; Gunn, D.A.; Bishop, C.L. SenPred: A Single-Cell RNA Sequencing-Based Machine Learning Pipeline to Classify Deeply Senescent Dermal Fibroblast Cells for the Detection of an in Vivo Senescent Cell Burden. Genome Med. 2025, 17, 2. [Google Scholar] [CrossRef] [PubMed]
  41. Shyam, R.; Reddy, L.V.K.; Palaniappan, A. Fabrication and Characterization Techniques of In Vitro 3D Tissue Models. Int. J. Mol. Sci. 2023, 24, 1912. [Google Scholar] [CrossRef] [PubMed]
  42. Guvatova, Z.G.; Kudasheva, E.R.; Efremov, Y.M.; Timashev, P.S.; Fedorova, M.S.; Pudova, E.A.; Snezhkina, A. V.; Kudryavtseva, A. V.; Kobelyatskaya, A.A.; Moskalev, A.A. Changes in Gene Expression Patterns in Young and Senescent Fibroblasts in Glycated Three-Dimensional Collagen Matrices. Int. J. Mol. Sci. 2025, 26, 4769. [Google Scholar] [CrossRef] [PubMed]
  43. Dobin, A.; Davis, C.A.; Schlesinger, F.; Drenkow, J.; Zaleski, C.; Jha, S.; Batut, P.; Chaisson, M.; Gingeras, T.R. STAR: Ultrafast Universal RNA-Seq Aligner. Bioinformatics 2013, 29, 15–21. [Google Scholar] [CrossRef] [PubMed]
  44. Patro, R.; Duggal, G.; Love, M.I.; Irizarry, R.A.; Kingsford, C. Salmon Provides Fast and Bias-Aware Quantification of Transcript Expression. Nat. Methods 2017, 14, 417–419. [Google Scholar] [CrossRef] [PubMed]
  45. Robinson, M.D.; McCarthy, D.J.; Smyth, G.K. edgeR : A Bioconductor Package for Differential Expression Analysis of Digital Gene Expression Data. Bioinformatics 2010, 26, 139–140. [Google Scholar] [CrossRef] [PubMed]
  46. Yu, G.; Wang, L.-G.; Han, Y.; He, Q.-Y. ClusterProfiler: An R Package for Comparing Biological Themes Among Gene Clusters. OMICS 2012, 16, 284–287. [Google Scholar] [CrossRef] [PubMed]
  47. Milacic, M.; Beavers, D.; Conley, P.; Gong, C.; Gillespie, M.; Griss, J.; Haw, R.; Jassal, B.; Matthews, L.; May, B.; et al. The Reactome Pathway Knowledgebase 2024. Nucleic Acids Res. 2024, 52, D672–D678. [Google Scholar] [CrossRef] [PubMed]
  48. Li, J.-H.; Liu, S.; Zhou, H.; Qu, L.-H.; Yang, J.-H. StarBase v2.0: Decoding MiRNA-CeRNA, MiRNA-NcRNA and Protein–RNA Interaction Networks from Large-Scale CLIP-Seq Data. Nucleic Acids Res. 2014, 42, D92–D97. [Google Scholar] [CrossRef] [PubMed]
  49. Kang, J.; Tang, Q.; He, J.; Li, L.; Yang, N.; Yu, S.; Wang, M.; Zhang, Y.; Lin, J.; Cui, T.; et al. RNAInter v4.0: RNA Interactome Repository with Redefined Confidence Scoring System and Improved Accessibility. Nucleic Acids Res. 2022, 50, D326–D332. [Google Scholar] [CrossRef] [PubMed]
  50. Zheng, Y.; Luo, H.; Teng, X.; Hao, X.; Yan, X.; Tang, Y.; Zhang, W.; Wang, Y.; Zhang, P.; Li, Y.; et al. NPInter v5.0: NcRNA Interaction Database in a New Era. Nucleic Acids Res. 2023, 51, D232–D239. [Google Scholar] [CrossRef] [PubMed]
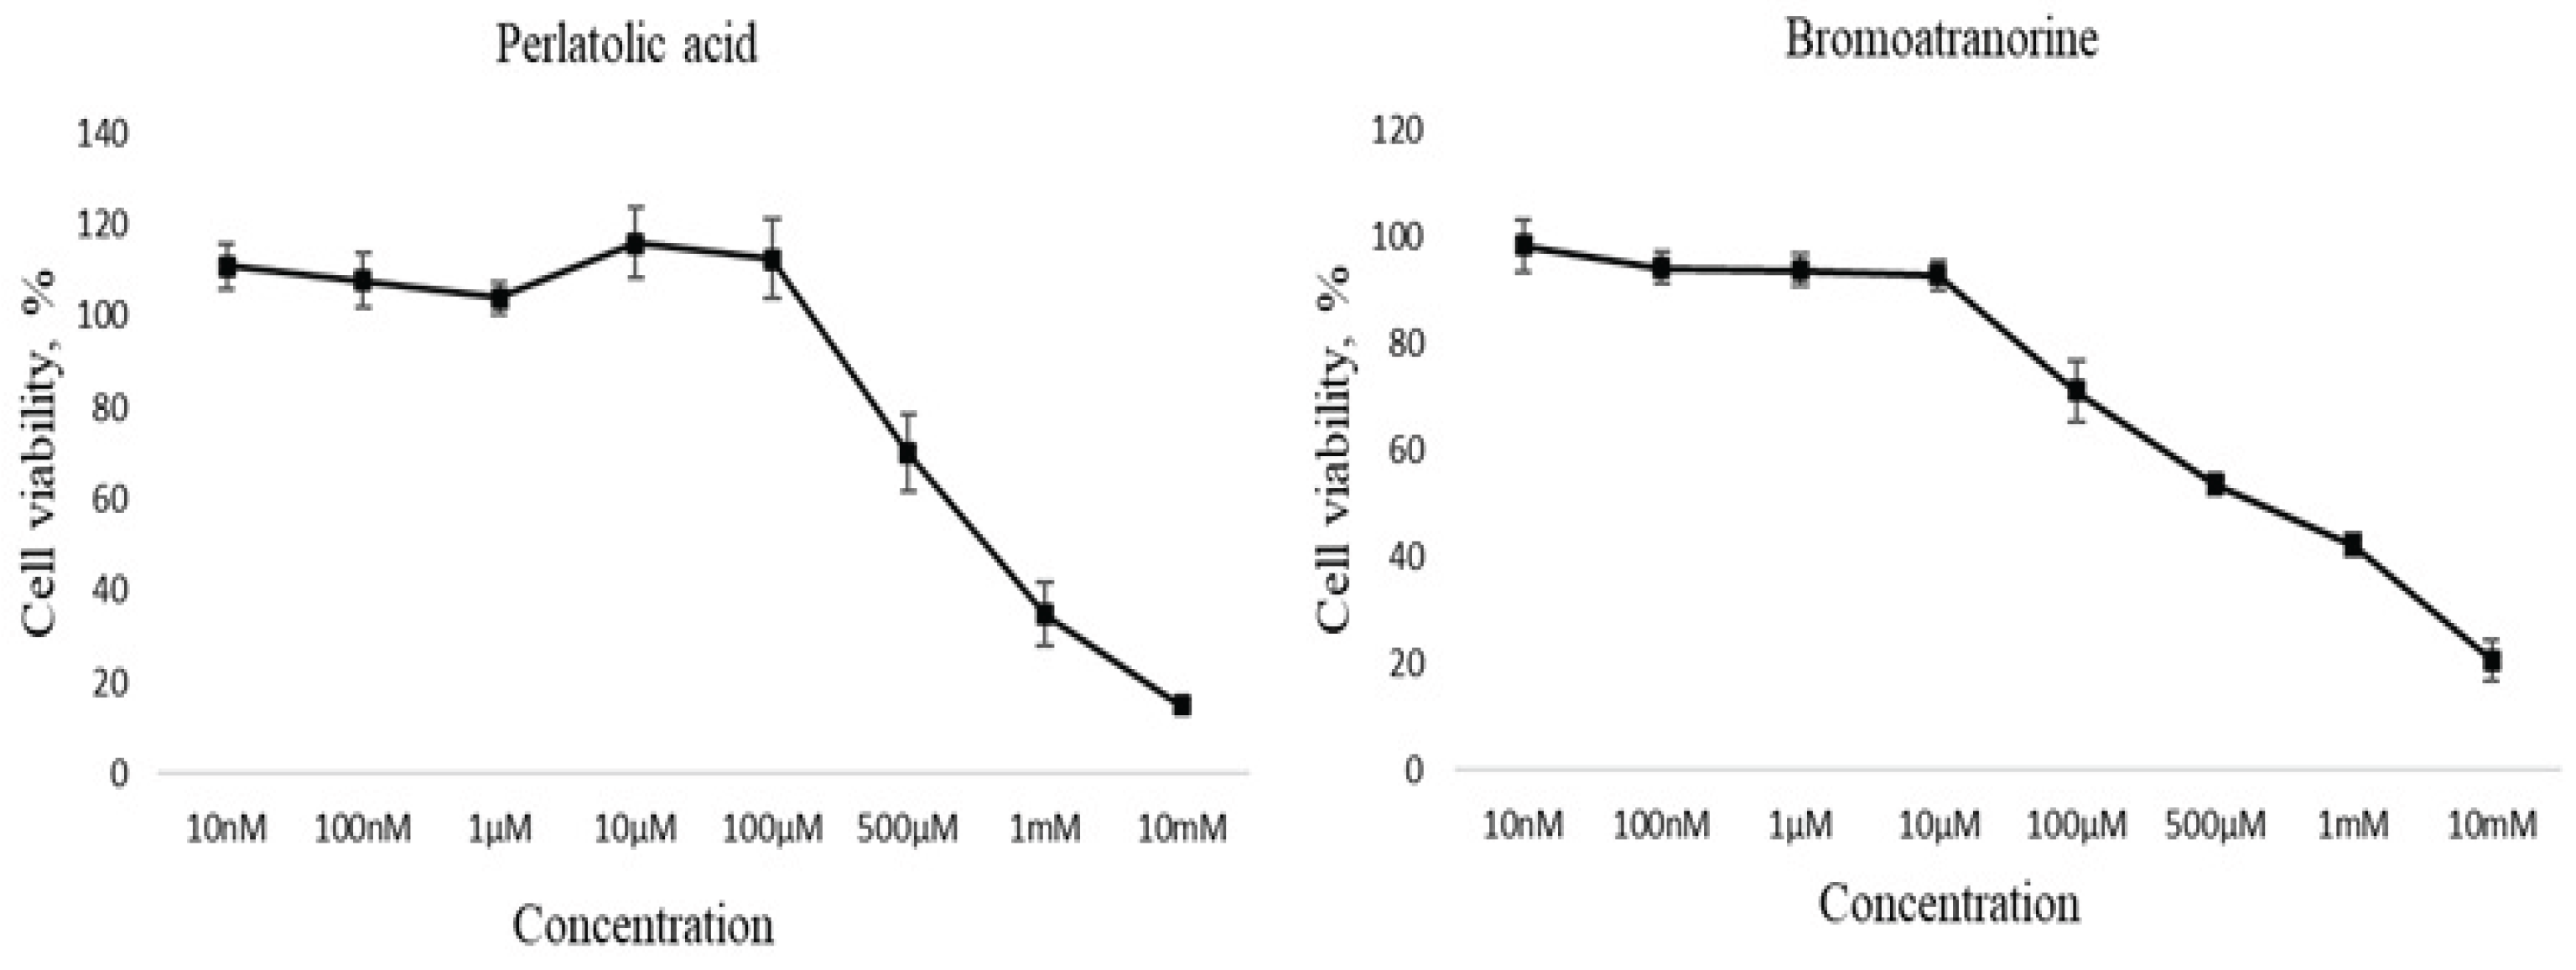
Figure 1. Restoration of MTT to MTT-f by primary dermal fibroblasts after PA and Br treatment. The values of ± SD (n = 3) are shown.
Preprints 224499 g001
Figure 2. Volcano plots of differential gene expression after Br and PA treatment. Volcano plots show differential expression results for Br1, Br5, PA1 and PA5 comparisons relative to untreated control cells. Each point represents one gene. The x-axis shows edgeR logFC, and the y-axis shows −log10(FDR). Genes with FDR < 0.05 are highlighted: red indicates upregulated genes and blue indicates downregulated genes, while grey points represent genes that did not reach statistical significance. Dashed horizontal lines indicate the FDR = 0.05 threshold. The number of significantly upregulated and downregulated genes is shown above each plot.
Preprints 224499 g002
Figure 3. Expression profiles of aging-associated (GeneAge) and cellular senescence-associated (SenMayo) genes in response to perlatolic acid (PA) and bromoatranorine(Br) treatment. (A) Distribution of DEGs after PA treatment from the SenMayo panel grouped by functional categories (logCPM >= 1, FDR <0.05). Blue dots represent 1 µM, and red dots represent 5 µM concentrations. The gray shaded area indicates the threshold zone for low magnitude changes (-1 < logFC < 1); (B)Distribution of DEGs after Br treatment from the SenMayo panel grouped by functional categories (logCPM >= 1, FDR <0.05); (C) Heatmap of DEGs from the GeneAge database (age-dependent genes) in primary human dermal fibroblasts following treatment with 1 and 5 µM PA. Selection criteria: ||logFC| >= 1, logCPM >= 1, FDR <0.05. The color scale bar represents relative gene expression levels.
Preprints 224499 g003
Figure 4. GSEA of Reactome pathways and the expression of their leading-edge genes across Br and PA treatments. (A) Heatmap of normalized enrichment scores (NES) for Reactome pathways that were significantly enriched (FDR < 0.05) in all four comparisons. Pathways are grouped into the major functional blocks identified in the analysis: cell cycle/replication, genome maintenance, ECM/fibroblast matrix, stress/senescence (stress/sen.), RNA/signaling/metabolism, and other. Color encodes NES: orange - positive enrichment, green - negative enrichment (B, C) Heatmaps of differential expression for genes present in the leading edge of significant Reactome pathways in at least two of the four comparisons. Genes are grouped by the same functional blocks: (B) cell cycle/replication and genome maintenance; (C) ECM/fibroblast matrix. Cell colors (blue–white–red gradient) correspond to the binary logarithm of the ratio of the expression level in a current sample to the average level across all the samples (per each transcript). Blue, expression level is below the average; red, above the average. Asterisks denote statistical significance GSEA FDR in (A) and gene-level FDR in (B, C): **** FDR < 1×10⁻⁴, *** < 1×10⁻³, ** < 1×10⁻², * < 0.05; in panel (A) the symbol "·" additionally marks FDR < 0.1.
Preprints 224499 g004
Disclaimer/Publisher’s Note: The statements, opinions and data contained in all publications are solely those of the individual author(s) and contributor(s) and not of MDPI and/or the editor(s). MDPI and/or the editor(s) disclaim responsibility for any injury to people or property resulting from any ideas, methods, instructions or products referred to in the content.
Copyright: This open access article is published under a Creative Commons CC BY 4.0 license, which permit the free download, distribution, and reuse, provided that the author and preprint are cited in any reuse.