

Submitted:
21 July 2026
Posted:
23 July 2026
You are already at the latest version
Abstract
The paper aims to explain in the simplest possible way how tyres influence, to the greatest extent, the dynamic behaviour of cars, i.e. vehicle handling, during power-on or power-off. Starting from the ISO 4138 steering pad test, controlled power-on and power-off manoeuvres are introduced to reproduce typical manoeuvres relevant for active safety. Handling diagrams are used to make clear how tyres determine the oversteer and understeer character of a car. A simple two degrees-of-freedom analytical vehicle model and a complex high-fidelity fourteen degrees-of-freedom model have been used. Driver-in-the-Loop simulations were performed at a dynamic driving simulator. The study considers three representative driveline configurations, namely front-wheel drive (FWD), rear-wheel drive (RWD), and all-wheel drive (AWD). A key outcome of the study is that the fundamental mechanisms governing understeer and oversteer behaviour can be effectively captured using a simple two degrees-of-freedom model combined with appropriate tyre characteristics. The results show that the handling diagrams are a proper tool to describe handling manoeuvres during power-on or power-off. Variations in understeer and oversteer behaviour induced by power modulation can be interpreted as a direct consequence of tyre characteristics. The findings of this work highlight the pivotal role of the tyre in vehicle dynamics and active safety.
Keywords:
vehicle dynamics
; handling diagrams
; power-on
; power-off
; tyre characteristics
1. Introduction
Teaching vehicle design requires to provide basic understanding of relevant manoeuvres influencing active safety. For example, designing a suspension system implies that the attention is primarily devoted to tyre sizing and to proper elasto-kinematic settings allowing the tyre to work correctly. Students need, in addition to fundamental concepts of vehicle system dynamics and multi-body modeling, a simple but accurate model for reasoning quickly on the relationships among tyre characteristics, vehicle dynamic behaviour, and chassis design.
A simple but accurate vehicle model is also of outmost importance during testing on track. Often in this case the time and the data for an analysis of the actual results are missing. Thus a scheme or model, to make interpretation of experience quickly and with reasonable accuracy, becomes crucial.
This paper aims to provide a simple, accurate, non-linear model, based on the handling diagram theory [1], that meets the addressed needs. The model is capable of analyzing the essential mechanisms governing vehicle dynamic behaviour in cornering conditions during power-on or power-off, with direct implications for both safety and performance. The proposed model can be exploited without resorting to a complex model running on a computer, thus is precious for instant reasoning. The relevance of the contribution is evident if - at the time this paper is written - a query to the most used AI chatbots is entered. Asking how a front or rear wheel drive car reacts to power-on or power-off often returns wrong answers.
The characterization of steady-state cornering behaviour has long been recognized as a key aspect of vehicle dynamics. This is also reflected in international standards such as ISO 4138 [2], where the steering behaviour under controlled conditions is assessed. It is worth noting that no standardized test procedure explicitly focuses on the systematic investigation of handling variations induced by controlled power-on and power-off inputs during steady-state cornering.
In this context, handling diagrams - relating steering angle, lateral acceleration, and lateral slip - may represent a fundamental tool to derive a simple accurate model for the interpretation of vehicle behaviour [1,3,4].
In addition to ISO 4138, several standardized test procedures have been developed to investigate vehicle dynamic response under both steady-state and transient conditions. For instance, ISO 7401 [5] defines the step steer test, which is widely used to evaluate the transient lateral response of the vehicle. ISO 14792 [6] specifies open-loop steering tests with sinusoidal inputs. ISO 13674 [7] introduces closed-loop test procedures, incorporating driver control actions to evaluate vehicle behaviour. All such tests do not consider the influence of traction and braking, that will be a major topic within this paper.
A comprehensive theoretical framework for the analysis of vehicle handling has been extensively developed in the literature, but power-on and power-off behaviours still need to be described in a simple and accurate way. Earlier pioneering studies include those by Olley [8]. Foundational contributions by authors such as Abe [9], Genta [10], Gillespie [11], Guiggiani [4], and Mitschke [12], have established the fundamental principles governing lateral vehicle dynamics and the role of tyre characteristics. Later contributions in [3,13] were given too. Moreover, the works of Pacejka [14] have provided a detailed understanding of tyre force generation and its influence on vehicle behaviour.
To analyse vehicle handling behaviour, a wide range of mathematical models has been developed in the literature [15,16,17,18], with varying levels of complexity and fidelity. The simplest and most widely used representation is the linear single-track model, which describes the lateral dynamics of the vehicle using two degrees of freedom: sideslip angle and yaw rate (Figure 1(a)). Despite its simplicity, this model provides significant information related to the fundamental mechanisms governing understeer and oversteer behaviour and represents a cornerstone of vehicle dynamics analysis [3].
At a higher level of fidelity, multi-degree-of-freedom (multi-DOF) vehicle models are employed to account for additional dynamic effects, including roll, pitch, suspension elasto-kinematics, and load transfer. These models, typically ranging from 7 to 14 degrees of freedom (Figure 1(b)), enable a more accurate representation of the coupled vehicle dynamics and are widely used in advanced simulation environments [3,19,20,21,22]. In particular, high-fidelity multibody models allow the investigation of complex phenomena such as combined slip conditions, nonlinear tyre behaviour [23], and transient load redistribution [24].
Recent contributions in the literature have highlighted the importance of considering the coupling between longitudinal and lateral dynamics. The work by Lenzo et al. [25] investigates the handling performance of vehicles with different front-to-rear torque distributions, demonstrating how driveline architecture significantly influences the understeer characteristics. Their study combines experimental and modelling approaches to show that the handling behaviour can be actively modified through powertrain control. Frendo et al. [26] provide a critical analysis of the classical handling diagram and understeer gradient when longitudinal slip effects become significant. Their work clearly emphasizes the need to account for combined slip conditions and tyre nonlinearities to correctly describe vehicle behaviour.
Despite the extensive body of literature on vehicle handling and combined longitudinal–lateral dynamics, a clear gap can be identified. Existing studies typically rely on high-fidelity models or focus on specific dynamic scenarios, often providing detailed and complex descriptions of vehicle behaviour. However, a simple, accurate and physically grounded framework that directly links vehicle handling characteristics to tyre behaviour during power-on or power-off is still lacking.
In particular, the fundamental role of tyre characteristics in governing vehicle dynamic response is often implicitly acknowledged but not explicitly demonstrated.
The main objective of this paper is to fill this gap by showing, using a simple approach, that the dynamic behaviour of a vehicle in cornering conditions is primarily determined by tyre characteristics. By linking tyre mechanics to vehicle handling performance, the proposed simple model provides direct, universal physical insights. Unlike complex multibody models that rely on opaque numerical integration, our framework is designed to be applied as a fundamental interpretive method, directly capturing handling shifts without the need for any computation, i.e., senza computazione.
The study considers three representative driveline configurations — front-wheel drive (FWD), rear-wheel drive (RWD), and all-wheel drive (AWD) — and combines analytical modelling and Driver-in-the-Loop (DiL) experiments. By means of this approach, the paper aims to provide a systematic analysis of how tyre behaviour influences lateral vehicle dynamics. Moreover, this study provides a comprehensive interpretation of the mechanisms governing understeer and oversteer behaviour.
The remainder of the paper is organized as follows. Section 2 introduces the two degrees-of-freedom vehicle model. Section 3 presents the high-fidelity fourteen degrees-of-freedom vehicle model. Section 4 describes the tyre model formulation. Section 5 outlines the theoretical framework of handling diagrams. Section 6 details the proposed test procedure. The results are presented and discussed in Section 7, while the concluding remarks are summarized in Section 8.
2. Two Degrees-of-Freedom Vehicle Model
The simplest model for the analysis of lateral vehicle dynamics is the linearized two-wheel model, commonly referred to in the literature as the single-track model [1,3,4,8,9,10,11,12,13]. The model is shown in Figure 1(a). In this representation, the two wheels on each axle are lumped into a single equivalent wheel located on the vehicle longitudinal symmetry plane. As a result, the front and rear axles are each modelled by a single equivalent tyre.
The model is formulated by considering the vehicle as a rigid body with lumped mass m and yaw inertia J, while wheel inertia effects due to rotation are neglected. The front steering angle is treated as the primary input.
The equations of motion derived from this model, considering a constant longitudinal velocity , are presented in Equation (1).
The slip angles at the front and rear axles are determined by the vehicle kinematics and are expressed as:
where is the front steering angle, and are the longitudinal and lateral velocities at the center of gravity, is the yaw rate, and are the distances of the center of gravity from the front and rear axles, respectively.
From these expressions, under steady-state conditions, the steering angle can be directly related to the slip angles as:
where is the wheelbase and R is the radius of curvature. This expression highlights that the steering input consists of a purely kinematic contribution and a dynamic contribution associated with the difference between front and rear slip angles.
3. Fourteen Degrees-of-Freedom Vehicle Model
In order to complement the analysis performed with the simple model, a high-fidelity multibody vehicle model is considered. The model is characterized by 14 degrees of freedom (DOF) and is implemented in the real-time simulation environment VI-CarRealTime [28]. Detailed mathematical formulations of the 14-DOF multibody model can be found in [3].
The vehicle body is described through six degrees of freedom, accounting for the translational motions along the longitudinal x, lateral y, and vertical z directions, as well as the rotational motions about the three axes, namely roll , pitch , and yaw .
Each wheel is modelled with two degrees of freedom, representing its vertical motion relative to the vehicle body and its rotational motion about the axle. This results in a total of eight additional degrees of freedom associated with the four wheels.
The modelisation of roll and pitch dynamics enables the precise simulation of lateral and longitudinal load transfer. The suspension system is modeled through lumped parameters representing stiffness and damping characteristics. Each wheel is connected to the vehicle body via a spring-damper system, allowing the simulation of vertical motion of the unsprung masses. Tyre-road forces are computed individually at each wheel, allowing asymmetric effects to be fully captured. A key feature of the 14 DOFs model implemented in CarRealTime is the use of nonlinear tyre models, typically based on the Pacejka formulation [14]. For each wheel, both longitudinal and lateral forces are computed as functions of slip ratio , slip angle , and vertical load . This formulation allows the accurate representation of combined slip conditions. The model includes a detailed representation of the powertrain, allowing the simulation of different driveline configurations such as front-wheel drive (FWD), rear-wheel drive (RWD), and all-wheel drive (AWD). Torque distribution to the wheels is computed based on the driveline architecture and differential characteristics.
4. Tyre Model
In order to study the vehicle cornering behaviour, it is necessary to adopt an accurate representation of tyre characteristics. Among the available formulations, the semi-empirical model proposed by Pacejka [14] is widely used due to its ability to capture the nonlinear relationship between lateral force, slip angle, vertical load, and combined slip conditions.
In its basic form, the lateral force generated by a tyre can be expressed using the so-called Magic Formula:
where is the slip angle, and B, C, D, and E are empirical coefficients representing, respectively, the stiffness factor, shape factor, peak factor, and curvature factor.
A key aspect of tyre behaviour is the dependence of the lateral force on the vertical load . In the Pacejka formulation, the peak factor D is typically expressed as:
where is the lateral friction coefficient, which is itself a function of the vertical load.
The cornering stiffness, defined as the local slope of the – curve at small slip angles, reads
In addition to vertical load effects, the presence of longitudinal slip significantly affects the lateral force generation due to the so-called combined slip condition. When a tyre simultaneously transmits longitudinal force and lateral force , the available friction is shared between the two directions. This interaction indicates that an increase in longitudinal force reduces the maximum achievable lateral force [14].
Considering the Pacejka model, combined slip conditions are typically accounted for by introducing a reduction factor applied to the pure lateral force:
where is the lateral force under pure slip conditions, is the longitudinal slip ratio, and is the combined-slip weighting function for the lateral force:
It accounts for the reduction of lateral force caused by the presence of longitudinal slip. Under pure cornering conditions , and the lateral force equals the pure-slip lateral force. As the longitudinal slip ratio increases, the available tire-road friction is shared between longitudinal and lateral directions, resulting in a decrease in lateral force. Therefore, serves as a scaling factor that characterizes the influence of combined-slip conditions on tire lateral force generation.
5. Handling Diagram Theory
In this section, the handling diagram theory is derived and extended to incorporate longitudinal forces induced by power modulation during cornering.
Let us consider the single-track model in Figure 2, with the vehicle running a curve at constant longitudinal acceleration. The moments and arise due to unequal longitudinal forces at the two wheels of the same axle. Assuming the front steering angle is small and neglecting the lateral component of , the equilibrium in lateral direction reads (see Figure 2(a)):
Considering Figure 2(b), the vertical equilibrium reads:
Dividing Equation 9 by Equation 10, the following equations are obtained:
where and are the static vertical forces at the front and rear axles:
The outcome of Equation 11 is the following condition
If and vanish, the Equation 13 becomes
The resulting condition demonstrates that, under longitudinal acceleration in a curve, the effective axle characteristics at front and rear approximately equal to the centripetal acceleration divided by the gravity g.
Considering a vehicle running a curve at low speed, from kinematics the following condition applies
Based on the relationships derived above, it is possible to introduce a graphical representation to study vehicle behaviour in steady-state cornering conditions. In the following, the procedure adopted for the construction of the handling diagram is described.
Figure 3 illustrates the procedure adopted for the construction of the handling diagram. The vertical axis represents the normalized centripetal acceleration . The right-hand side of the horizontal axis represents the front and rear tyre slip angles and , while the left-hand side represents the difference between front and rear slip angles. In the right-hand quadrant of the diagram, the effective lateral characteristics of the front and rear axles are represented. For a given value of normalized centripetal acceleration , corresponding points are identified on both the front and rear effective characteristic curves. The associated slip angles and are then determined.
The handling curve is constructed by computing, at each level of lateral acceleration, the difference between the front and rear slip angles . This difference is reported on the left-hand side of the horizontal axis. As a result, the curve obtained in the left quadrant represents the handling curve.
Let us consider the representation of the handling diagram shown in Figure 4. The right-hand side of the horizontal axis represents the term , while the left-hand side retains the handling curve, expressed as the slip angle difference . The vertical axis remains the normalized lateral acceleration .
For a given manoeuvre, corresponding to a prescribed path radius R, the quantity is constant and can therefore be represented as a vertical line in the right-hand quadrant of the diagram.
At each value of normalized lateral acceleration , the corresponding value of the handling curve is determined from the left-hand side of the diagram. The horizontal distance between the handling curve and the line representing provides a direct measure of the steering angle required to maintain the prescribed trajectory. This graphical interpretation follows directly from the kinematic relationship in Equation 15.
Moreover, from Equation 13, the derived relationships indicate that the handling diagram theory can be extended to provide an approximate, insightful description of vehicle behaviour under combined longitudinal and lateral dynamic conditions, such as during acceleration in a corner, i.e., during power-on or power-off.
This capability is exploited in the present work to analyse and interpret the dynamic response of vehicles with different driveline configurations, including front-wheel drive, rear-wheel drive, and all-wheel drive architectures.
6. Test Procedure
To investigate the vehicle dynamic response during cornering, a dedicated experimental procedure is implemented based on the ISO 4138 steering pad manoeuvre. The steering pad manoeuvre is a standardized experimental procedure for steady-state cornering conditions [2].
The standardized manoeuvre consists of driving a vehicle along a circular path of constant radius R on a proving ground, while progressively increasing the vehicle speed. The objective is to obtain a sequence of steady-state operating points at increasing levels of lateral acceleration.
In the present study, a transient is added to the steady-state motion due to the application of a power-on or power-off. The procedure is summarized as follows:
- 1.
- The vehicle enters the circular path at low speed and stabilizes on the prescribed radius.
- 2.
- The vehicle is driven until a steady-state circular condition is achieved. The speed and the steering input applied by the driver are constant.
- 3.
- Controlled longitudinal inputs are introduced in the form of power-on or power-off. During the manoeuvre the steering angle is kept constant by the driver.
The controlled power changes lead to variations in understeer or oversteer behaviour. The resulting vehicle states are used to construct the corresponding handling diagrams, as described in Sec. Section 5.
The study examines three different driveline configurations: front-wheel drive (FWD), rear-wheel drive (RWD), and all-wheel drive (AWD). To represent these configurations, three corresponding vehicle models are implemented:
- 1.
- C-segment car (FWD)
- 2.
- D-segment car (RWD)
- 3.
- Sport Utility Vehicle (AWD)
The main parameters of the vehicles are summarized in Table 1.
In the case of the AWD vehicle, the drivetrain incorporates three differentials - front, rear, and central — with the central differential configured to deliver a 50:50 torque split between the front and rear axles.
The analysis is carried out using two approaches, with different levels of complexity and physical detail.
First, an analytical investigation is performed based on simple single-track model. In this case, the primary purpose is to provide a clear, intuitive, and efficient tool for the analysis of vehicle behaviour in cornering conditions. The fundamental role of tyre characteristics is highlighted. Second, high-fidelity simulations are conducted using a fourteen degrees-of-freedom vehicle model implemented in VI-CarRealTime. This model includes a detailed representation of vehicle subsystems, such as suspension kinematics, load transfer, and nonlinear tyre behaviour, providing a more accurate description of the vehicle dynamics. Driver-in-the-Loop (DiL) experiments are performed using both the fourteen degrees-of-freedom vehicle model and the dynamic driving simulator shown in Figure 5 [29], allowing the inclusion of driver interaction effects. The higher-fidelity numerical and experimental approaches are used to validate and support the trends identified with the simple model, confirming that the essential features of vehicle handling behaviour can be effectively captured through a reduced-order formulation centred on tyre characteristics.
7. Results and Discussion
This section presents the results obtained from the application of the proposed experimental procedure based on the ISO 4138 steering pad manoeuvre. The vehicle response is analysed in terms of handling diagrams, constructed as discussed in Section 5.
For each vehicle configuration, results are reported separately for power-on and power-off conditions. Handling diagrams are reported based on two models, namely the two degree-of-freedom model and the high-fidelity 14-DOF model used with Driver-in-the-Loop (DiL) simulations. In the reported results, the diagrams shown in Figure 3 and Figure 4 separately are merged into a single diagram since , and have quantitatively comparable values.
7.1. Power-on Manoeuvre
7.1.1. FWD Vehicle
Under power-on conditions, the FWD vehicle exhibits a marked increase in understeer behaviour, as evidenced by the handling diagrams shown in Figure 6.
The construction of the handling diagram reflects the different operating conditions experienced by the vehicle during the manoeuvre. The first branch of the diagram is obtained from zero lateral acceleration up to approximately . In this phase, the vehicle is driven along the steering pad with progressively increasing speed. In this range, the handling curve exhibits a monotonically increasing trend, indicating a clear understeer behaviour. This corresponds to a condition in which the front slip angle increases more rapidly than the rear slip angle , due to the characteristics of the tyres. The second branch of the handling diagram, corresponding to the line between 2 and 3 in Figure 6, is constructed by introducing the power-on manoeuvre at a given operating point. The presence of longitudinal slip at the front tyres and the rearward load transfer alter the effective tyre behaviour, reducing the lateral force capability of the front axle. Specifically, the longitudinal load transfer decreases the vertical load of the front axle by 17 % with respect to steady state condition, causing the peak factor D of the front axle tyres to decrease by about 15 %. The vertical load of the rear axle increases around 25%, raising the peak factor D of the rear axle tyres by about 20%. Moreover, the generation of longitudinal slip at the front axle introduces the combined slip weighting function , approximately 0.76. The effects of rearward load transfer and longitudinal slip result in a 35% decrease in the peak value of the front tyre characteristic compared to the steady-state condition. Due to the variations in lateral force capacity, the tyres on the front axle require a larger slip angle to generate the same lateral force, while the tyres on the rear axle require a smaller one.
This is directly reflected in the handling diagram. The increase in the difference clearly indicates that the vehicle exhibits a more pronounced understeer behaviour following the power-on manoeuvre. Here the and are derived according to Equation 2, while the lateral acceleration and centripetal acceleration are defined by the kinematic relationship:
where is the longitudinal speed, is the side slip angle rate and is the yaw angle velocity of the vehicle body.
With and , the lateral forces of front and rear axles are calculated through the Magic Formula in two operational phases. During the initial steady-state cornering phase, Equation 4 is implemented with no driving force. Then after power-on manoeuvre, due to the longitudinal slip and load transfer, the lateral force is calculated by Equation 7. Finally, the effective axle characteristics are generated by Equation 13.
Moreover, the turning radius and can be calculated using Equation 15. The corresponding forward velocities , can be then calculated. Within the right-hand part of the handling diagram, the y-axis is and the x-axis can be treated as . The relationship between y and x is , where . This implies that any condition of constant longitudinal speed v is a straight line originating from the origin. The value of v can be computed through .
The effective axle characteristics and relative values in the rest handling diagrams are all computed in the same method.
The increase in understeer results in an increase of the vehicle trajectory radius. The vehicle tends to move toward a larger circular path.
This behaviour is captured by the two modelling approaches. In the 2-DOF model, the effective axle characteristics are generated starting from tyre lateral characteristics and considering the scaling effect of both vertical load transfer and longitudinal slip. The 14-DOF with DiL provides a close to real representation.
Some differences can be observed between the 2-DOF model and the higher-fidelity approaches. These differences, evaluated in terms of the curvature radius variation following the power-on manoeuvre, are on the order of 7%. Actually, . The simple model is able to capture the dominant trends with reasonable accuracy while maintaining a significantly reduced level of complexity.
7.1.2. RWD Vehicle
For the RWD configuration, the application of power induces a transition toward oversteer behaviour, or, better, less understeer behaviour. The related handling diagram is shown in Figure 7.
The first branch of the handling diagram is constructed as the vehicle negotiates the steering pad with progressively increasing lateral acceleration with very low longitudinal acceleration. In this initial phase, the handling curve exhibits an increasing trend, indicating an understeering behaviour. The second branch of the handling diagram (between points 2 and 3 in Figure 7) is obtained by introducing the power-on manoeuvre. The application of driving torque at the rear axle significantly alters the tyre operating conditions, leading to a substantial modification of the effective rear tyre characteristic.
In particular, the generation of longitudinal slip at the rear tyres reduces their lateral force capability due to combined slip effects. Specifically, the weighting function is around 0.54, indicating that the rear axle retains only about half of its pure lateral force capacity. Moreover, the rearward load transfer increases the vertical load by 21% (raising the rear tyres peak factor D by approximately 18%), the effect of longitudinal slip makes the final peak value decrease by 36% compared with the steady-state condition. This results in a marked increase of . Although the lateral force capacity of the front axle is also reduced by longitudinal load transfer, this reduction is less severe than at the rear axle due to the absence of longitudinal slip.
This change is directly reflected in the handling diagram, where the second branch is shifted rightward with respect to the steady-state curve. The difference decreases and may become negative, indicating a transition from understeer to oversteer behaviour.
As a consequence, for a given steering input, the vehicle follows a trajectory with a reduced radius, exhibiting an oversteer response.
The two modelling approaches consistently capture this transition. The 2-DOF model reproduces the shift in the handling diagram through the modification of the effective rear axle characteristic, while the 14-DOF with Driver-in-the-Loop provides a more detailed representation of the nonlinear behaviour, confirming the same underlying physical mechanisms.
Small differences can be observed between the simple and the higher-fidelity models. When evaluated in terms of the variation of the curvature radius following the manoeuvre, these discrepancies are on the order of 7% (), further supporting the capability of the 2-DOF model to provide a reliable prediction of the vehicle response.
7.1.3. AWD Vehicle
In the AWD configuration, the power-on manoeuvre leads to an overall increase in understeer behaviour (see Figure 8).
The first branch of the handling diagram is constructed as the vehicle travels along the steering pad with progressively increasing lateral acceleration with very low longitudinal acceleration. In this phase, the handling curve exhibits a monotonically increasing trend, indicating an understeer behaviour.
The second branch of the handling diagram is obtained by introducing the power-on manoeuvre at a given operating point. In the AWD configuration, the driving torque is distributed between the front and rear axles, leading to a modification of tyres characteristics. In particular, the presence of longitudinal slip at both axles reduces the lateral force capability of the tyres due to combined slip effects. The combined slip weighting functions for the front and rear axles are approximately 0.82 and 0.98, respectively. At the same time, the longitudinal load transfer increases the vertical load on the rear axle by 32%, which consequently raises the rear tyres peak factor D by about 25% with respect to steady-state conditions. A 26% reduction in vertical load at the front axle decreases the front tyres peak factor D by 22%. The effects of combined slip and rearward load transfer results in a 24.5% increase in the peak effective characteristic of the rear axle, and a 36% decrease at the front axle. Consequently, due to these variations in lateral force capacity, a larger slip angle is required at the front axle to maintain the same lateral force, whereas a smaller slip angle is required at the rear axle.
In the handling diagram, the difference increases following the power-on manoeuvre, indicating a more pronounced understeer behaviour.
As a result, for a given steering input, the vehicle follows a trajectory with an increased radius, exhibiting a tendency to move toward a wider path.
The two modelling approaches consistently capture this behaviour. Differences can be observed between the simple and the higher-fidelity models. When considering the variation of the trajectory radius induced by the manoeuvre, discrepancies of approximately 8% () are observed.
7.1.4. Quantitative Assessment of Power-on Manoeuvres
To quantitatively evaluate the simple approach, the variations () of the fore and aft the power-on manoeuvre are defined as Key Performance Indicators (KPIs) in Table 2, with the 14-DOF model acting as the benchmark. These metrics directly quantify the physical trajectory, including path-radius, understeer gradient, and yaw rate gain variations. Furthermore, tyre utilization, calculated by , is explicitly extracted from the 14-DOF benchmark to better support the explanation of the relationship between tyre and vehicle behaviours. This demonstrates the physical boundary under which the simple model is applied. According to Table 2, the same handling shift trends can be identified as we have observed previously in the handling diagrams.
Through these explicit variations, it is evident that the simple model accurately captures the actual trends of the handling shifts, as demonstrated by the matching algebraic signs of across all configurations. Although differences in the highly sensitive derivative metrics (such as the understeer gradient) still exist, these deviations are theoretically expected, originating from higher-order multibody effects omitted in the simple model. Specifically, unmodeled phenomena, such as suspension elasto-kinematics, transient behaviour, nonlinear load transfer and the influence of human drivers, account for these errors. Moreover, at limit conditions, these unmodeled features become significantly critical. As theoretically demonstrated in Appendix A, such slight variations in effective axle characteristics can disproportionately alter the vehicle handling and stability at high lateral accelerations. Therefore, this study specifically focuses on the handling transitions near acceleration and deceleration operations, avoiding scenarios involving full tyre saturation or high lateral accelerations.
Despite these inherent simplifications, the simple analytical framework successfully reflects the dynamic behaviour of the high-fidelity multibody system, proving its value for rapid conceptual analysis and pedagogico applications. More importantly, as highlighted by the contrast between the ’Required’ and the ’NULL’ computational cost in the KPI tables, this framework is proposed as a universal explanatory tool rather than a numerical simulator. By directly mapping tyre mechanical behaviour to vehicle handling shifts, it provides immediate physical insights, thereby requiring no computational effort in engineering and educational scenarios, since our trained engineers can mentally visualize the graphs of the handling diagram and effective axle characteristics.
7.2. Power-off Manoeuvre
7.2.1. FWD Vehicle
Under power-off conditions, the FWD vehicle exhibits a transition toward oversteer behaviour. The handling diagram is shown in Figure 9.
The first branch of the handling diagram shows a clear understeer behaviour, as indicated by the increasing trend of the handling curve with lateral acceleration.
The second branch is obtained by introducing a power-off manoeuvre and is represented by the line between points 2 and 3 in Figure 9. The release of the throttle generates a deceleration, which induces a forward load transfer, increasing the vertical load on the front axle and reducing it at the rear. Under power-off conditions, the effect of longitudinal slip can be neglected ( is of the order of 0.001%), and the effective axle characteristics are primarily governed by longitudinal load transfer. Specifically, a 10% reduction in vertical load at the rear axle decreases its peak factor D by 9% compared with steady-state conditions. Conversely, the lateral force capability of the front axle is enhanced, with its peak factor D increasing by approximately 6% driven by a 7% increase in vertical load. Due to the variations in lateral force capacity caused by forward load transfer, the tyres on the front axle require a smaller slip angle to generate the same lateral force, while the tyres on the rear axle require a larger one. As a consequence, the difference decreases with respect to the first branch of the diagram. In the handling diagram, this behaviour is reflected by a transition to a less understeer behaviour.
As a result, for a given steering input, the vehicle follows a trajectory with a reduced radius.
Both modelling approaches consistently capture this transition, with the 2-DOF model reproducing the effect through the modification of the effective rear axle characteristic, and the higher-fidelity models confirming the same physical mechanisms.
In this case, no appreciable differences are observed among the models, indicating a very good agreement and further supporting the ability of the simple formulation to accurately reproduce the vehicle response.
7.2.2. RWD Vehicle
For the RWD vehicle, the power-off manoeuvre results in a pronounced oversteer behaviour. The handling diagram is shown in Figure 10.
The first branch of the handling diagram shows an understeering behaviour.
The second branch is constructed by applying a power-off manoeuvre. The resulting deceleration induces a forward load transfer, reducing the vertical load on the rear axle.
The 10% reduction in vertical load on the rear axle decreases its peak factor D by 9%, thereby reducing its lateral force capacity. Conversely, the peak factor D of the front axle increases by 8%,induced by a 9% increase in vertical load. Consequently, the front tyres require a smaller slip angle to generate the equivalent lateral force, while the rear tyres require a larger one.
In the handling diagram, the difference decreases, indicating a less understeer behaviour.
Consequently, for a given steering input, the vehicle follows a tighter trajectory, with a substantial reduction in turning radius and a pronounced tendency toward oversteer.
The two modelling approaches are in close agreement in describing this behaviour. No significant differences emerge among the models, confirming the consistency of the results.
7.2.3. AWD Vehicle
The AWD vehicle also exhibits an oversteer tendency under power-off conditions. The handling diagram is shown in Figure 11.
The first branch of the handling diagram exhibits an understeer behaviour.
The second branch is obtained by introducing a power-off manoeuvre. The resulting deceleration induces a forward load transfer, increasing the vertical load on the front axle and reducing it at the rear. Due to the variations in vertical load, a 9% increase at the front axle and a 12% decrease at the rear axle, the front axle’s peak factor D increases by 7% relative to the steady-state condition, whereas the peak factor D of the rear axle decreases by 10%. Therefore, to generate the same lateral force requires a smaller front slip angle and a larger rear slip angle. This leads to a reduction of the difference . In the handling diagram, this is reflected by a transition to a less understeer behaviour.
As a result, for a given steering input, the vehicle follows a trajectory with a reduced radius.
Both two modelling approaches consistently capture this behaviour. No significant differences are observed among the models.
7.2.4. Quantitative Assessment of Power-off Manoeuvres
The KPIs for the power-off manoeuvres are summarized in Table 3. Under power-off conditions, longitudinal load transfer becomes the dominant factor driving the shifts in handling characteristics, as captured by the handling diagrams before. Furthermore, the dynamic response of the simple 2-DOF model aligns more closely with the performance of the high-fidelity 14-DOF model in these scenarios. This improved correlation occurs because, at the lower lateral accelerations after powering off, the unmodeled higher-order multibody effects discussed in Section 7.1.4 have less influence.
Finally, the quantitative comparison of these KPIs further confirms the value and accuracy of the simple analytical framework.
8. Conclusions
This paper presented a simple, accurate, non-linear model for the investigation of vehicle handling behaviour in cornering conditions. Starting from the handling diagram theory, a nonlinear extension has been introduced to account for combined longitudinal and lateral dynamics arising during power-on and power-off manoeuvres.
A key outcome of the study is that the essential mechanisms governing understeer and oversteer behaviour can be effectively captured using a simple two degrees-of-freedom model, provided that tyre characteristics are properly represented. In particular, the handling diagram has proven to be a powerful and intuitive tool to directly relate vehicle response to the underlying tyre behaviour, highlighting how variations in vertical load and longitudinal slip modify the effective lateral force generation at each axle.
The results obtained for the three driveline configurations (FWD, RWD, and AWD) clearly show that power modulation has a significant impact on vehicle handling.
The simple analytical model and the high-fidelity 14-DOF model with the Driver-in-the-Loop show a strong qualitative agreement. While the high-fidelity and experimental approach provides a more detailed and accurate description of the vehicle response, the simple model is able to capture the same trends with remarkable clarity. This confirms that the simple framework can act as a universal explanatory tool. Because it transparently explains tyre mechanisms governing vehicle dynamics across different configurations, it empowers engineers to immediately evaluate handling tendencies during track-side testing or early design phases with zero computational cost.
The findings of this work reinforce the central role of tyres as the primary element governing vehicle dynamics and active safety. The proposed approach provides a clear and accessible framework to interpret complex vehicle behaviour, bridging the gap between simple analytical models and high-fidelity simulations.
Future work will aim to extend this analytical framework by isolating and quantifying the specific sources of deviation between the simple and high-fidelity models. Particular attention will be given to analyzing the impacts of suspension elasto-kinematics, non-linear load transfer, and driver interaction on vehicle handling characteristics.
Author Contributions
Conceptualization, G.M.; methodology, R.G., P.S., G.M.; software, R.G.,P.S.; validation, R.G., P.S. and G.M.; formal analysis, R.G., G.M.; investigation, R.G., P.S.; resources, R.G., P.S., G.M.; data curation, R.G., P.S., G.M.; writing—original draft preparation, R.G., P.S.; writing—review and editing, G.M., R.G., D.S.; visualization, R.G.; supervision, G.M., D.S.; project administration, G.M.; funding acquisition, G.M. All authors have read and agreed to the published version of the manuscript.
Funding
This research received no external funding.
Data Availability Statement
Data will be made available on request.
Acknowledgments
Danisi Engineering is acknowledged for having provided the validated rear wheel drive vehicle model used in this research work.
Conflicts of Interest
The authors declare no conflicts of interest.
Appendix A
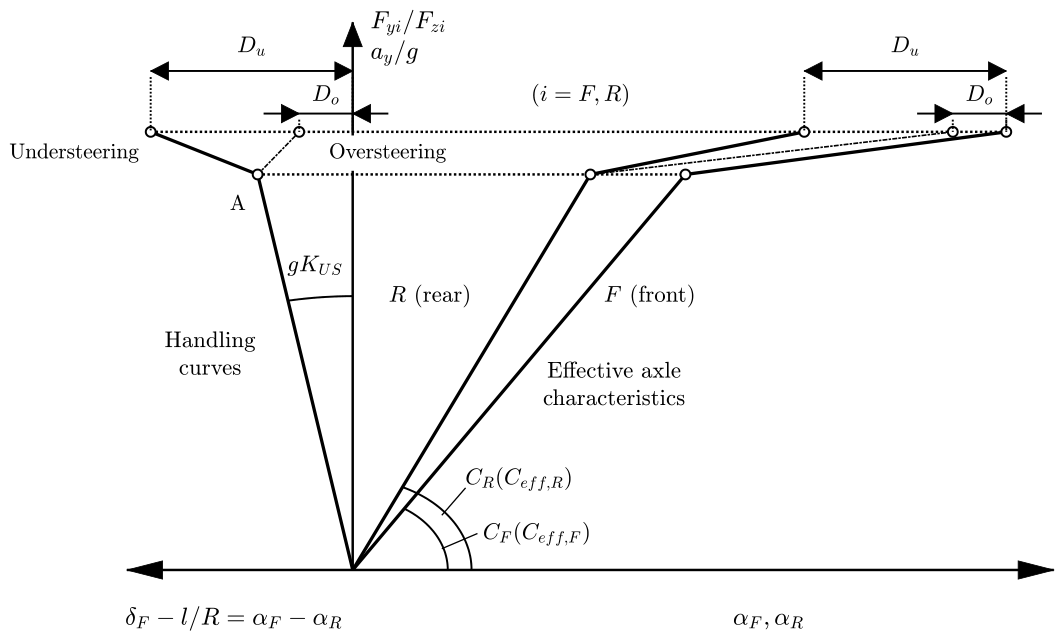
As illustrated in Figure A1, the handling diagram effectively elucidates the high sensitivity of vehicle handling and stability to minor variations in tyre characteristics, particularly at high lateral accelerations. To conceptualize this phenomenon, Figure A1 introduces a 2-phase linear abstraction of the effective axle characteristics and the corresponding handling curve. The diagram demonstrates that beyond a critical threshold (denoted as Point A), a marginal degradation in the rear axle characteristic can lead to a sudden transition from an understeer to an oversteer tendency. This indicates that in the near-limit non-linear region, small perturbations in the axle performance can translate into disproportionate shifts in the dynamic behaviour of the vehicle. Furthermore, given that effective axle characteristics are linked to chassis design, where suspension elasto-kinematics directly modulate the tyre forces, even slight variations in these underlying parameters can critically dominate the handling and stability of the vehicle at high lateral accelerations.
Figure A1.
Variation of the handling curve at high lateral acceleration, adapted from [3]. The effective axle characteristics and handling curve have been presented in simplified multi-linear form.
Figure A1.
Variation of the handling curve at high lateral acceleration, adapted from [3]. The effective axle characteristics and handling curve have been presented in simplified multi-linear form.
References
- Pacejka, H. B. Simplified Analysis of Steady-State Turning Behaviour of Motor Vehicles. Part 1. Handling Diagrams of Simple Systems. Veh. Syst. Dyn. 1973, 2, 161–172. [Google Scholar] [CrossRef]
- International Organization for Standardization. ISO 4138; Road Vehicles – Steady-State Circular Driving Behaviour – Open-Loop Test Methods. 2012.
- Mastinu, G.; Plöchl, M. Road and Off-Road Vehicle System Dynamics Handbook, 1st ed.; CRC Press: Boca Raton, USA, 2014; pp. 991–1010. [Google Scholar]
- Guiggiani, M. The Science of Vehicle Dynamics: Handling, Braking, and Ride of Road and Race Cars, 1st ed.; Springer: Dordrecht, Netherlands, 2014; pp. 113–201. [Google Scholar]
- International Organization for Standardization. ISO 7401; Road vehicles — Lateral transient response test methods — Open-loop test methods. ISO: Geneva, Switzerland.
- International Organization for Standardization. ISO 14792; Road vehicles — Lateral transient response test methods — Open-loop test methods using sinusoidal steering input. ISO: Geneva, Switzerland.
- International Organization for Standardization. ISO 13674; Road vehicles — Test method for the quantification of on-centre handling — Closed-loop steering test methods. ISO: Geneva, Switzerland.
- Olley, M. Road Manners of the Modern Car. In Proceedings of the Institution of Automobile Engineers, 1934. [Google Scholar]
- Abe, M. Vehicle Handling Dynamics: Theory and Application, 2nd ed.; Butterworth-Heinemann: Oxford, UK, 2015. [Google Scholar]
- Genta, G. Motor Vehicle Dynamics: Modeling and Simulation; World Scientific: Singapore, 1997. [Google Scholar]
- Gillespie, T. D. Fundamentals of Vehicle Dynamics; SAE International: Warrendale, PA, USA, 1992. [Google Scholar]
- Mitschke, M.; Wallentowitz, H. Dynamik der Kraftfahrzeuge; Springer Vieweg: Wiesbaden, Germany, 2014. [Google Scholar]
- Rajamani, R. Vehicle Dynamics and Control, 2nd ed.; Springer: New York, NY, USA, 2012. [Google Scholar]
- Pacejka, H. B. Tire and Vehicle Dynamics, 3rd ed.; Butterworth-Heinemann: Oxford, UK, 2012. [Google Scholar]
- Kolte, S.; Srinivasan, A.K.; Srikrishna, A. Development of Decentralized Integrated Chassis Control for Vehicle Stability in Limit Handling. SAE Int. J. Veh. Dyn. Stab. NVH 2016, 1, 1–10. [Google Scholar] [CrossRef]
- Alquran, M.; Mayyas, A.R. Design of a Nonlinear Stability Controller for Ground Vehicles Subjected to a Tire Blowout Using Double-Integral Sliding-Mode Controller. SAE Int. J. Veh. Dyn. Stab. NVH 2021, 5, 291–305. [Google Scholar] [CrossRef]
- Zha, Y.; Quan, X.; Ma, F.; Liu, G.; Zheng, X.; Yu, M. Stability Control for a Four-Wheel-Independent-Drive Electric Vehicle Based on Model Predictive Control. SAE Int. J. Veh. Dyn. Stab. NVH 2021, 5, 191–204. [Google Scholar] [CrossRef]
- Mastinu, G.R.M.; Previati, G.; Della Rossa, F.; Gobbi, M.; Fainello, M. How Drivers Lose Control of the Car. SAE Int. J. Veh. Dyn. Stab. NVH 2024, 8, 99–121. [Google Scholar] [CrossRef]
- VI-GRADE. VI-CarRealTime. Available online: https://www.vi-grade.com/en/products/vi-carrealtime (accessed on 5 March 2026).
- Mechanical Simulation Corporation. CarSim. Available online: https://www.carsim.com/products/carsim/index.php (accessed on 30 March 2026).
- IPG Automotive. CarMaker. Available online: https://www.ipg-automotive.com/solutions/product-portfolio/carmaker (accessed on 30 March 2026).
- MSC Software. Adams. Available online: https://www.cadence.com/en-US/home/tools/msc-software/adams.html (accessed on 30 March 2026).
- Xu, N.; Zhou, J.; Li, X.; Li, F. Analysis of the Effect of Inflation Pressure on Vehicle Handling and Stability under Combined Slip Conditions Based on the UniTire Model. SAE Int. J. Veh. Dyn. Stab. NVH 2021, 5, 259–277. [Google Scholar] [CrossRef]
- Abidou, D.; Abdellah, A.H.; Haggag, S. Optimizing Rear Spoiler Angle for Enhanced Vehicle Braking Performance. SAE Int. J. Veh. Dyn. Stab. NVH 2025, 9, 571–588. [Google Scholar]
- Lenzo, B.; Bucchi, F.; Sorniotti, A.; Frendo, F. On the Handling Performance of a Vehicle with Different Front-to-Rear Wheel Torque Distributions. Veh. Syst. Dyn. 2019, 57, 1685–1704. [Google Scholar]
- Frendo, F.; Greco, G.; Guiggiani, M. Critical Review of Handling Diagram and Understeer Gradient for Vehicles with Locked Differential. Veh. Syst. Dyn. 2006, 44, 431–447. [Google Scholar] [CrossRef]
- Liu, J.; Jayakumar, P.; Stein, J.L.; Ersal, T. A Study on Model Fidelity for Model Predictive Control-Based Obstacle Avoidance in High-Speed Autonomous Ground Vehicles. Veh. Syst. Dyn. 2006, 54, 1629–1650. [Google Scholar]
- VI-grade GmbH, VI-CarRealTime User Manual; VI-grade GmbH: Darmstadt, Germany, 2023.
- DriSMi. Driving Simulator. Available online: https://www.drismi.polimi.it (accessed on 5 March 2026).
Figure 1.
Vehicle dynamics models. (a) 2 DOF model, adapted from [3]. (b) 14 DOF model, adapted from [27].
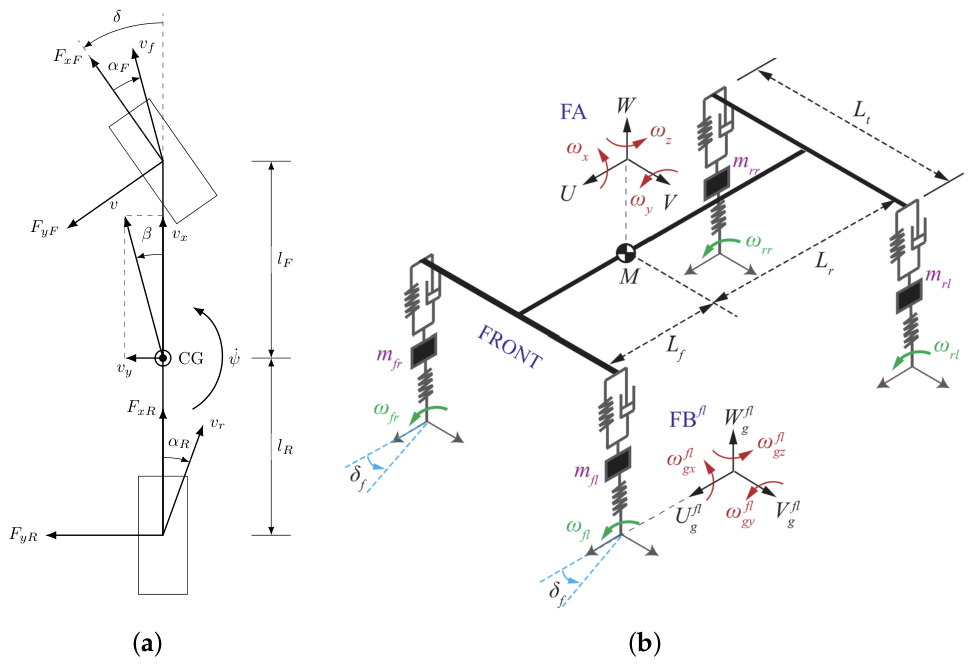
Figure 2.
External forces acting on single-track model of a vehicle running a curve at constant longitudinal acceleration: (a) top view; (b) lateral view.
Figure 2.
External forces acting on single-track model of a vehicle running a curve at constant longitudinal acceleration: (a) top view; (b) lateral view.
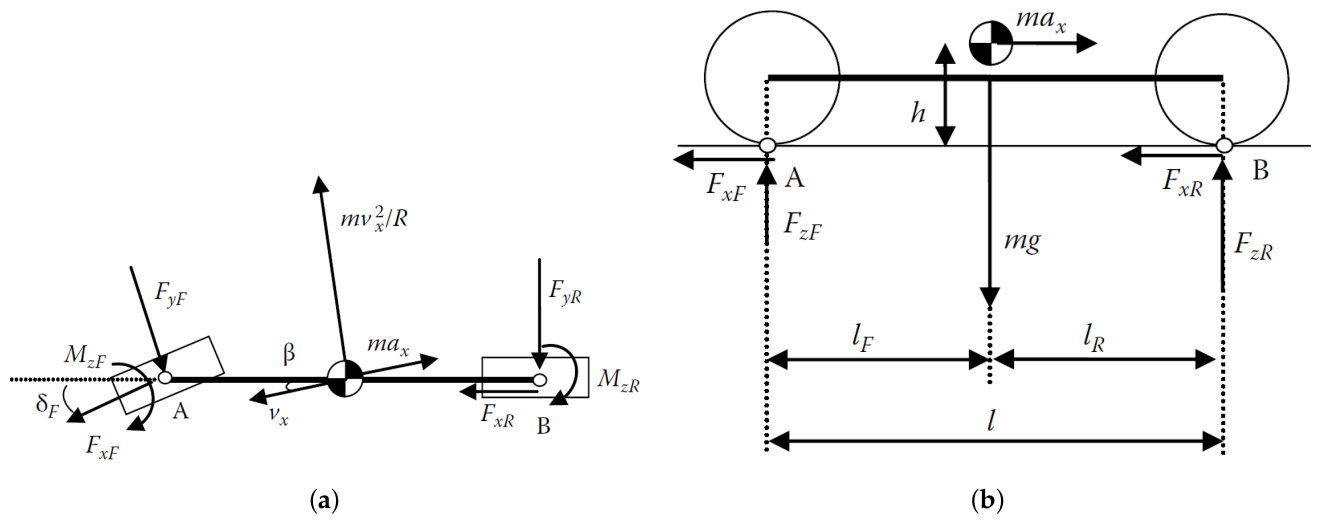
Figure 3.
Example of construction of the handling diagram: effective axle characteristic and handling curve.
Figure 3.
Example of construction of the handling diagram: effective axle characteristic and handling curve.
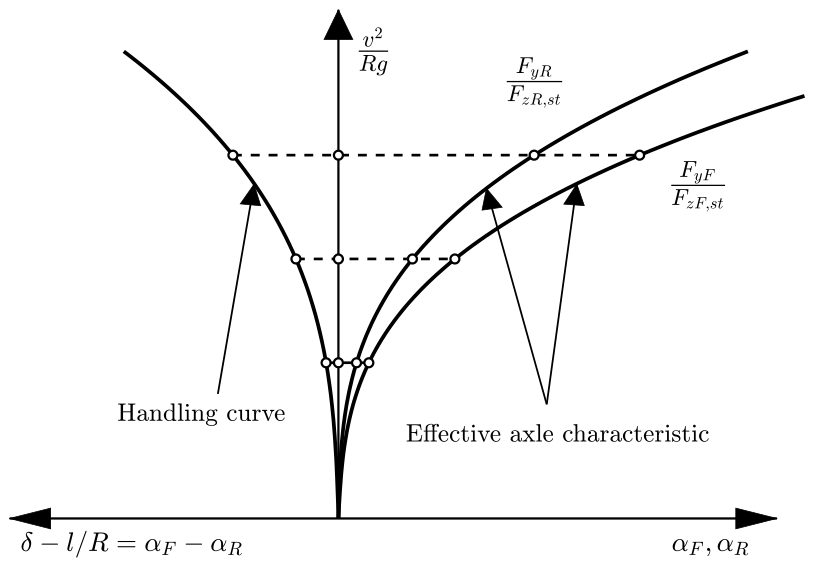
Figure 4.
Example of construction of the handling diagram: relationship between slip angles, steering angle, curvature radius.
Figure 4.
Example of construction of the handling diagram: relationship between slip angles, steering angle, curvature radius.
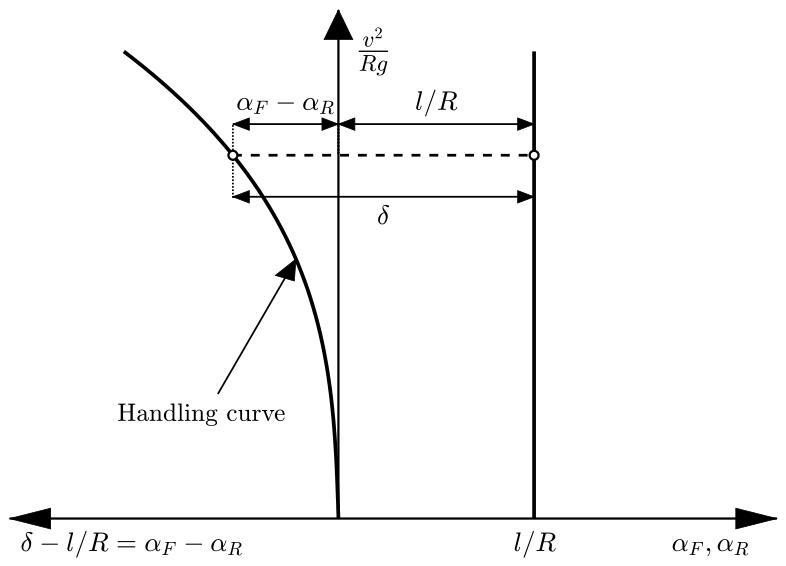
Figure 5.
Dynamic driving simulator at the DriSMi laboratory of the Politecnico di Milano [29].
Figure 5.
Dynamic driving simulator at the DriSMi laboratory of the Politecnico di Milano [29].
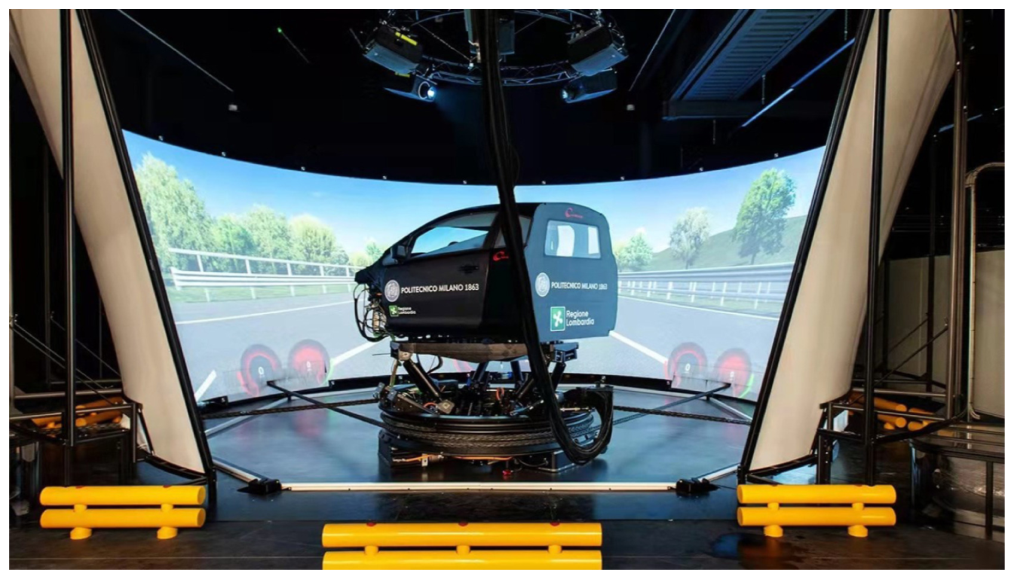
Figure 6.
Handling diagrams of different models under power-on conditions: (a) 2 wheel model of FWD vehicle. (b) 14 DOF model of FWD vehicle with DiL. Data in Table 1.
Figure 6.
Handling diagrams of different models under power-on conditions: (a) 2 wheel model of FWD vehicle. (b) 14 DOF model of FWD vehicle with DiL. Data in Table 1.
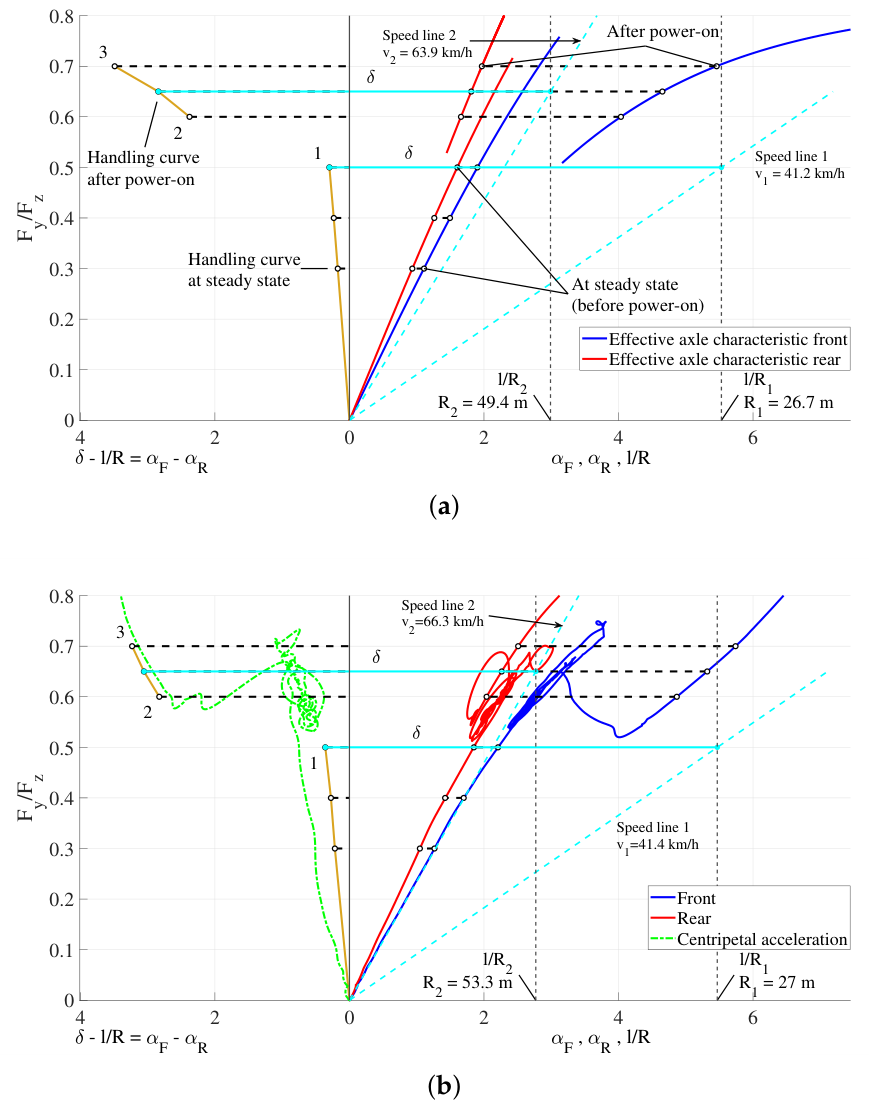
Figure 7.
Handling diagrams of different models under power-on conditions: (a) 2 wheel model of RWD vehicle. (b) 14 DOF model of RWD vehicle with DiL. Data in Table 1.
Figure 7.
Handling diagrams of different models under power-on conditions: (a) 2 wheel model of RWD vehicle. (b) 14 DOF model of RWD vehicle with DiL. Data in Table 1.
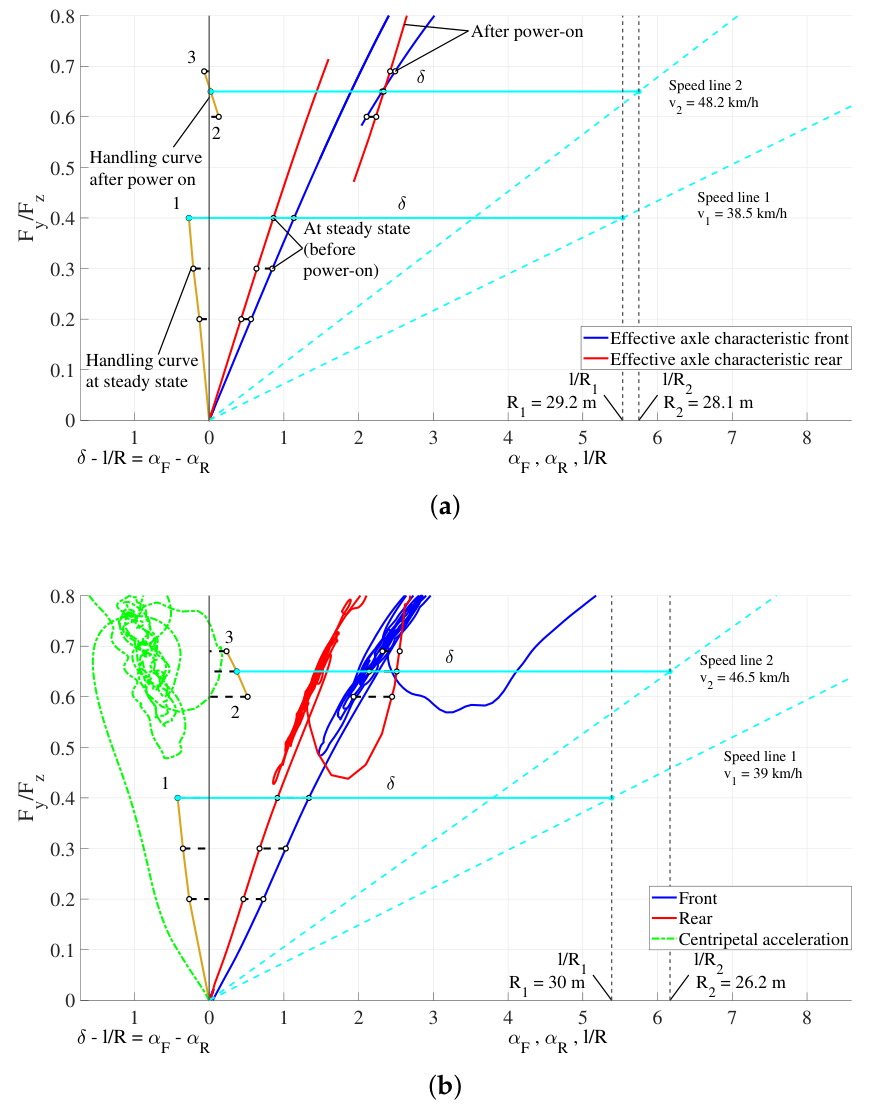
Figure 8.
Handling diagrams of different models under power-on conditions: (a) 2 wheel model of AWD vehicle. (b) 14 DOF model of AWD vehicle with DiL. Data in Table 1.
Figure 8.
Handling diagrams of different models under power-on conditions: (a) 2 wheel model of AWD vehicle. (b) 14 DOF model of AWD vehicle with DiL. Data in Table 1.
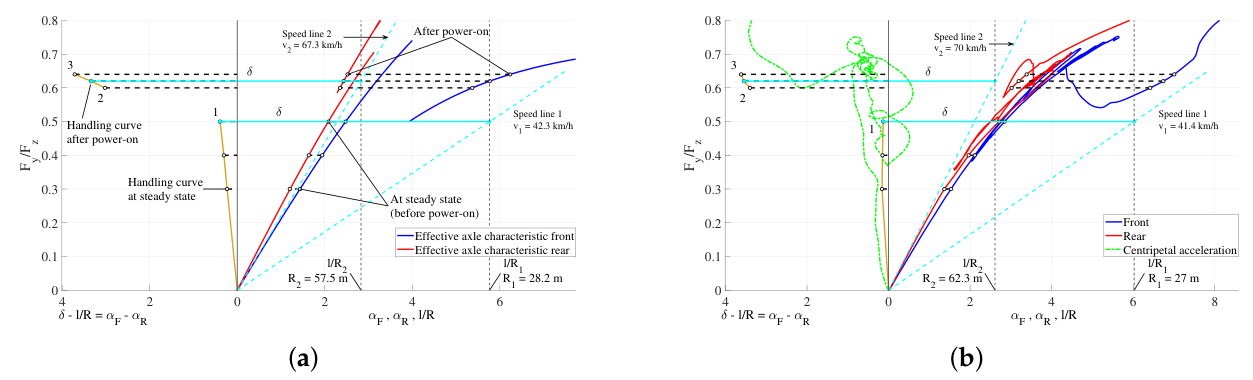
Figure 9.
Handling diagrams of different models under power-off conditions: (a) 2 wheel model of FWD vehicle. (b) 14 DOF model of FWD vehicle with DiL. Data in Table 1.
Figure 9.
Handling diagrams of different models under power-off conditions: (a) 2 wheel model of FWD vehicle. (b) 14 DOF model of FWD vehicle with DiL. Data in Table 1.
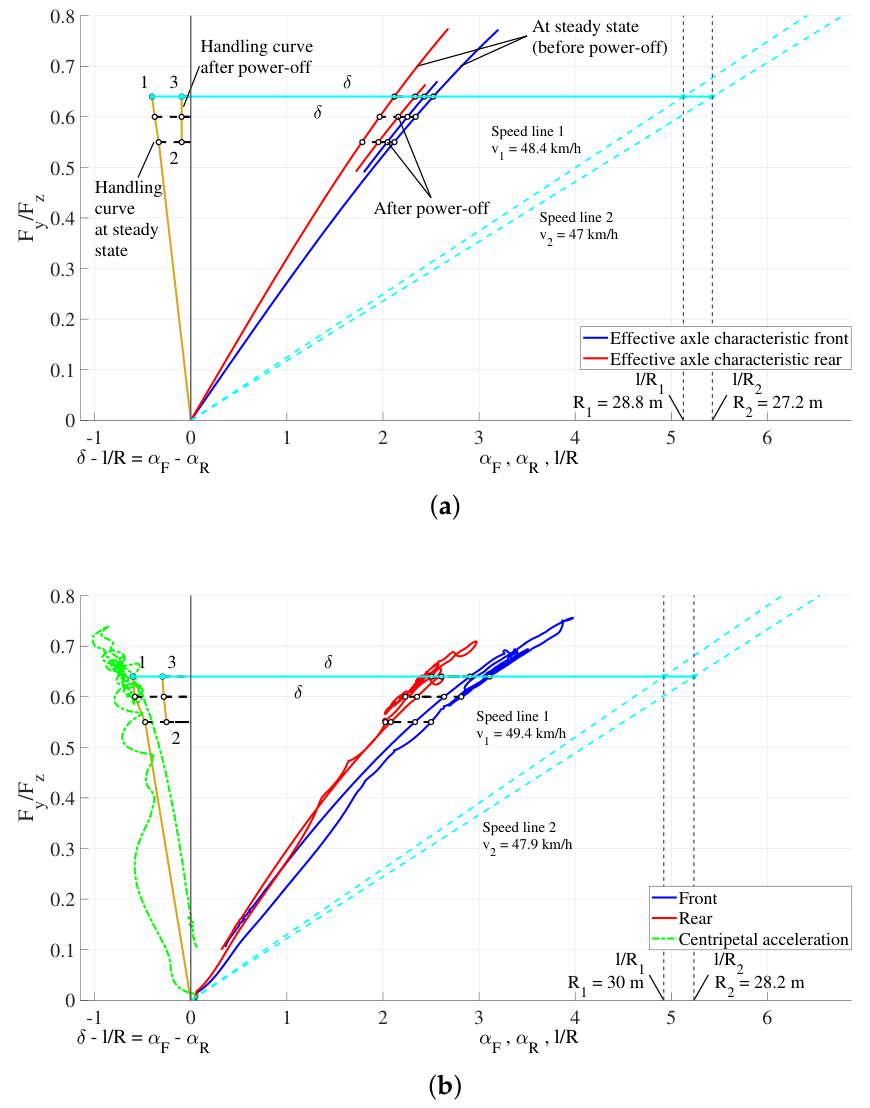
Figure 10.
Handling diagrams of different models under power-off conditions: (a) 2 wheel model of RWD vehicle. (b) 14 DOF model of RWD vehicle with DiL. Data in Table 1.
Figure 10.
Handling diagrams of different models under power-off conditions: (a) 2 wheel model of RWD vehicle. (b) 14 DOF model of RWD vehicle with DiL. Data in Table 1.
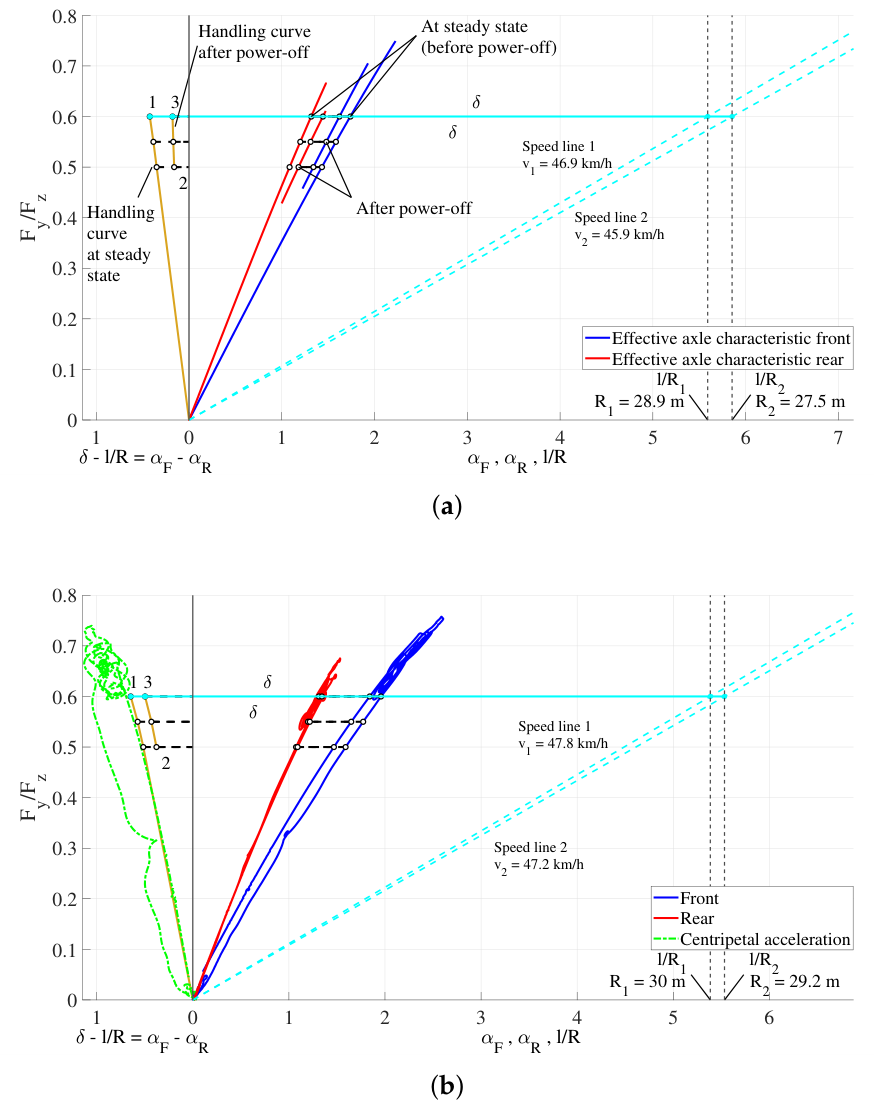
Figure 11.
Handling diagrams of different models under power-off conditions: (a) 2 wheel model of AWD vehicle. (b) 14 DOF model of AWD vehicle with DiL. Data in Table 1.
Figure 11.
Handling diagrams of different models under power-off conditions: (a) 2 wheel model of AWD vehicle. (b) 14 DOF model of AWD vehicle with DiL. Data in Table 1.
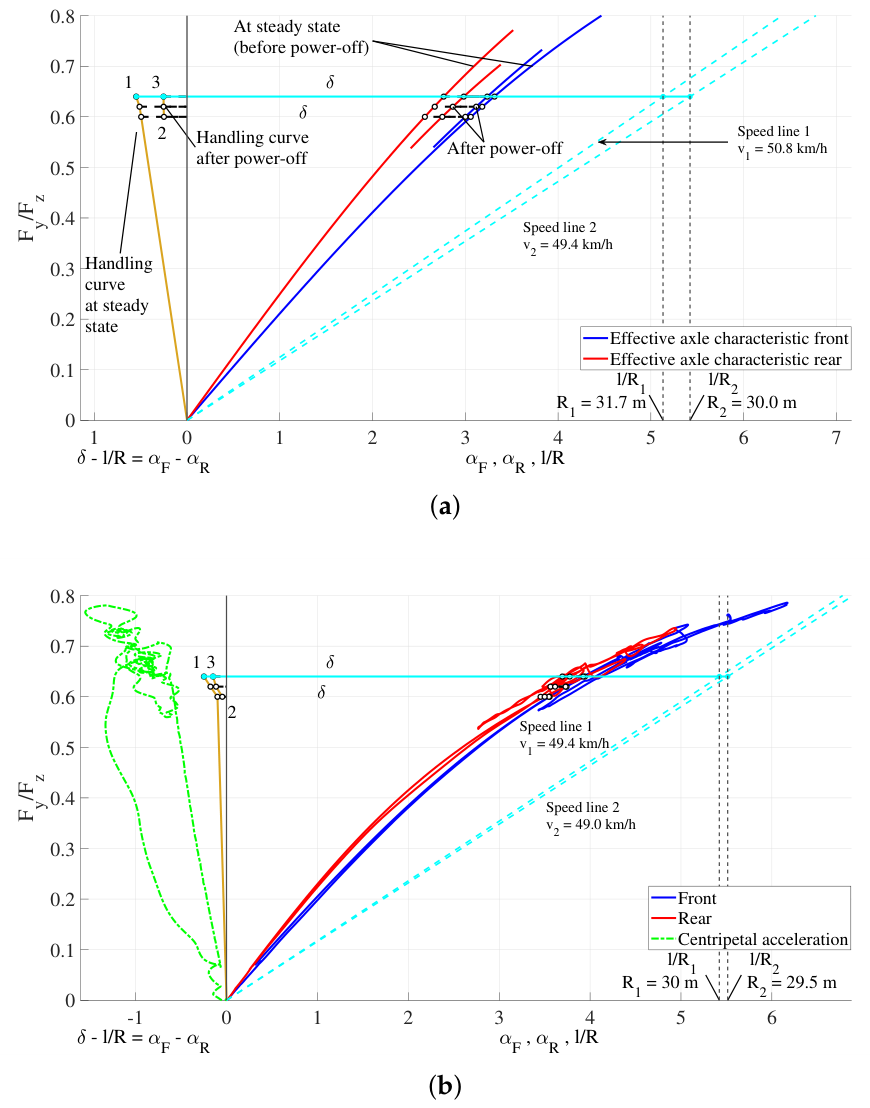

Table 1.
Main parameters of the vehicles considered in the present study.
| Parameters | C-segment car | D-segment car | Sport Utility Vehicle |
|---|---|---|---|
| m (kg) | 1383.6 | 1536.0 | 2125.8 |
| l (mm) | 2577.4 | 2820.0 | 2838.7 |
| h (mm) | 563.9 | 592.0 | 644.4 |
| (mm) | 1021.6 | 1315.7 | 1250.5 |
| (mm) | 1555.8 | 1504.3 | 1588.2 |
Table 2.
Quantitative Comparison of Dynamic Handling Shifts () for Power-On Manoeuvres.
| Performance Indices | 14-DOF Model | 2-DOF Model |
|---|---|---|
| FWD | ||
| Path radius (m) |
( = +26.3) |
( = +22.7) |
| Understeer gradient (rad/g) |
( = +0.0068) |
( = +0.0154) |
| Yaw rate gain ((deg/s)/deg) |
( = -1.90) |
( = -2.80) |
| Tyre utilization (front) |
– | |
| Tyre utilization (rear) |
– | |
| RWD | ||
| Path radius (m) |
( = -3.8) |
( = -1.1) |
| Understeer gradient (rad/g) |
( = -0.0029) |
( = -0.0015) |
| Yaw rate gain ((deg/s)/deg) |
( = +2.81) |
( = +1.74) |
| Tyre utilization (front) |
– | |
| Tyre utilization (rear) |
– | |
| AWD | ||
| Path radius (m) |
( = +35.3) |
( = +29.3) |
| Understeer gradient (rad/g) |
( = +0.0126) |
( = +0.0269) |
| Yaw rate gain ((deg/s)/deg) |
( = -2.65) |
( = -2.87) |
| Tyre utilization (front) |
– | |
| Tyre utilization (rear) |
– | |
| Computational cost | Required | NULL |
Note: The variation () is presented on the second line to highlight the consistent physical trend of the transition toward oversteer or understeer captured by both models, despite numerical offsets caused by unmodeled effects in the 2-DOF assumption.
Table 3.
Quantitative Comparison of Dynamic Handling Shifts () for Power-Off Manoeuvres.
| Performance Indices | 14-DOF Model | 2-DOF Model |
|---|---|---|
| FWD | ||
| Path radius (m) |
( = -0.8) |
( = -1.6) |
| Understeer gradient (rad/g) |
( = -0.0018) |
( = -0.0014) |
| Yaw rate gain ((deg/s)/deg) |
( = +0.95) |
( = +0.91) |
| Tyre utilization (front) |
– | |
| Tyre utilization (rear) |
– | |
| RWD | ||
| Path radius (m) |
( = -0.8) |
( = -1.4) |
| Understeer gradient (rad/g) |
( = -0.0002) |
( = -0.0009) |
| Yaw rate gain ((deg/s)/deg) |
( = +0.07) |
( = +0.47) |
| Tyre utilization (front) |
– | |
| Tyre utilization (rear) |
– | |
| AWD | ||
| Path radius (m) |
( = -0.5) |
( = -1.7) |
| Understeer gradient (rad/g) |
( = -0.0035) |
( = -0.0029) |
| Yaw rate gain ((deg/s)/deg) |
( = +0.93) |
( = +1.53) |
| Tyre utilization (front) |
– | |
| Tyre utilization (rear) |
– | |
| Computational cost | Required | NULL |
Disclaimer/Publisher’s Note: The statements, opinions and data contained in all publications are solely those of the individual author(s) and contributor(s) and not of MDPI and/or the editor(s). MDPI and/or the editor(s) disclaim responsibility for any injury to people or property resulting from any ideas, methods, instructions or products referred to in the content. |
© 2026 by the authors. Licensee MDPI, Basel, Switzerland. This article is an open access article distributed under the terms and conditions of the Creative Commons Attribution (CC BY) license.
Copyright: This open access article is published under a Creative Commons CC BY 4.0 license, which permit the free download, distribution, and reuse, provided that the author and preprint are cited in any reuse.