

Submitted:
22 July 2026
Posted:
22 July 2026
You are already at the latest version
Abstract
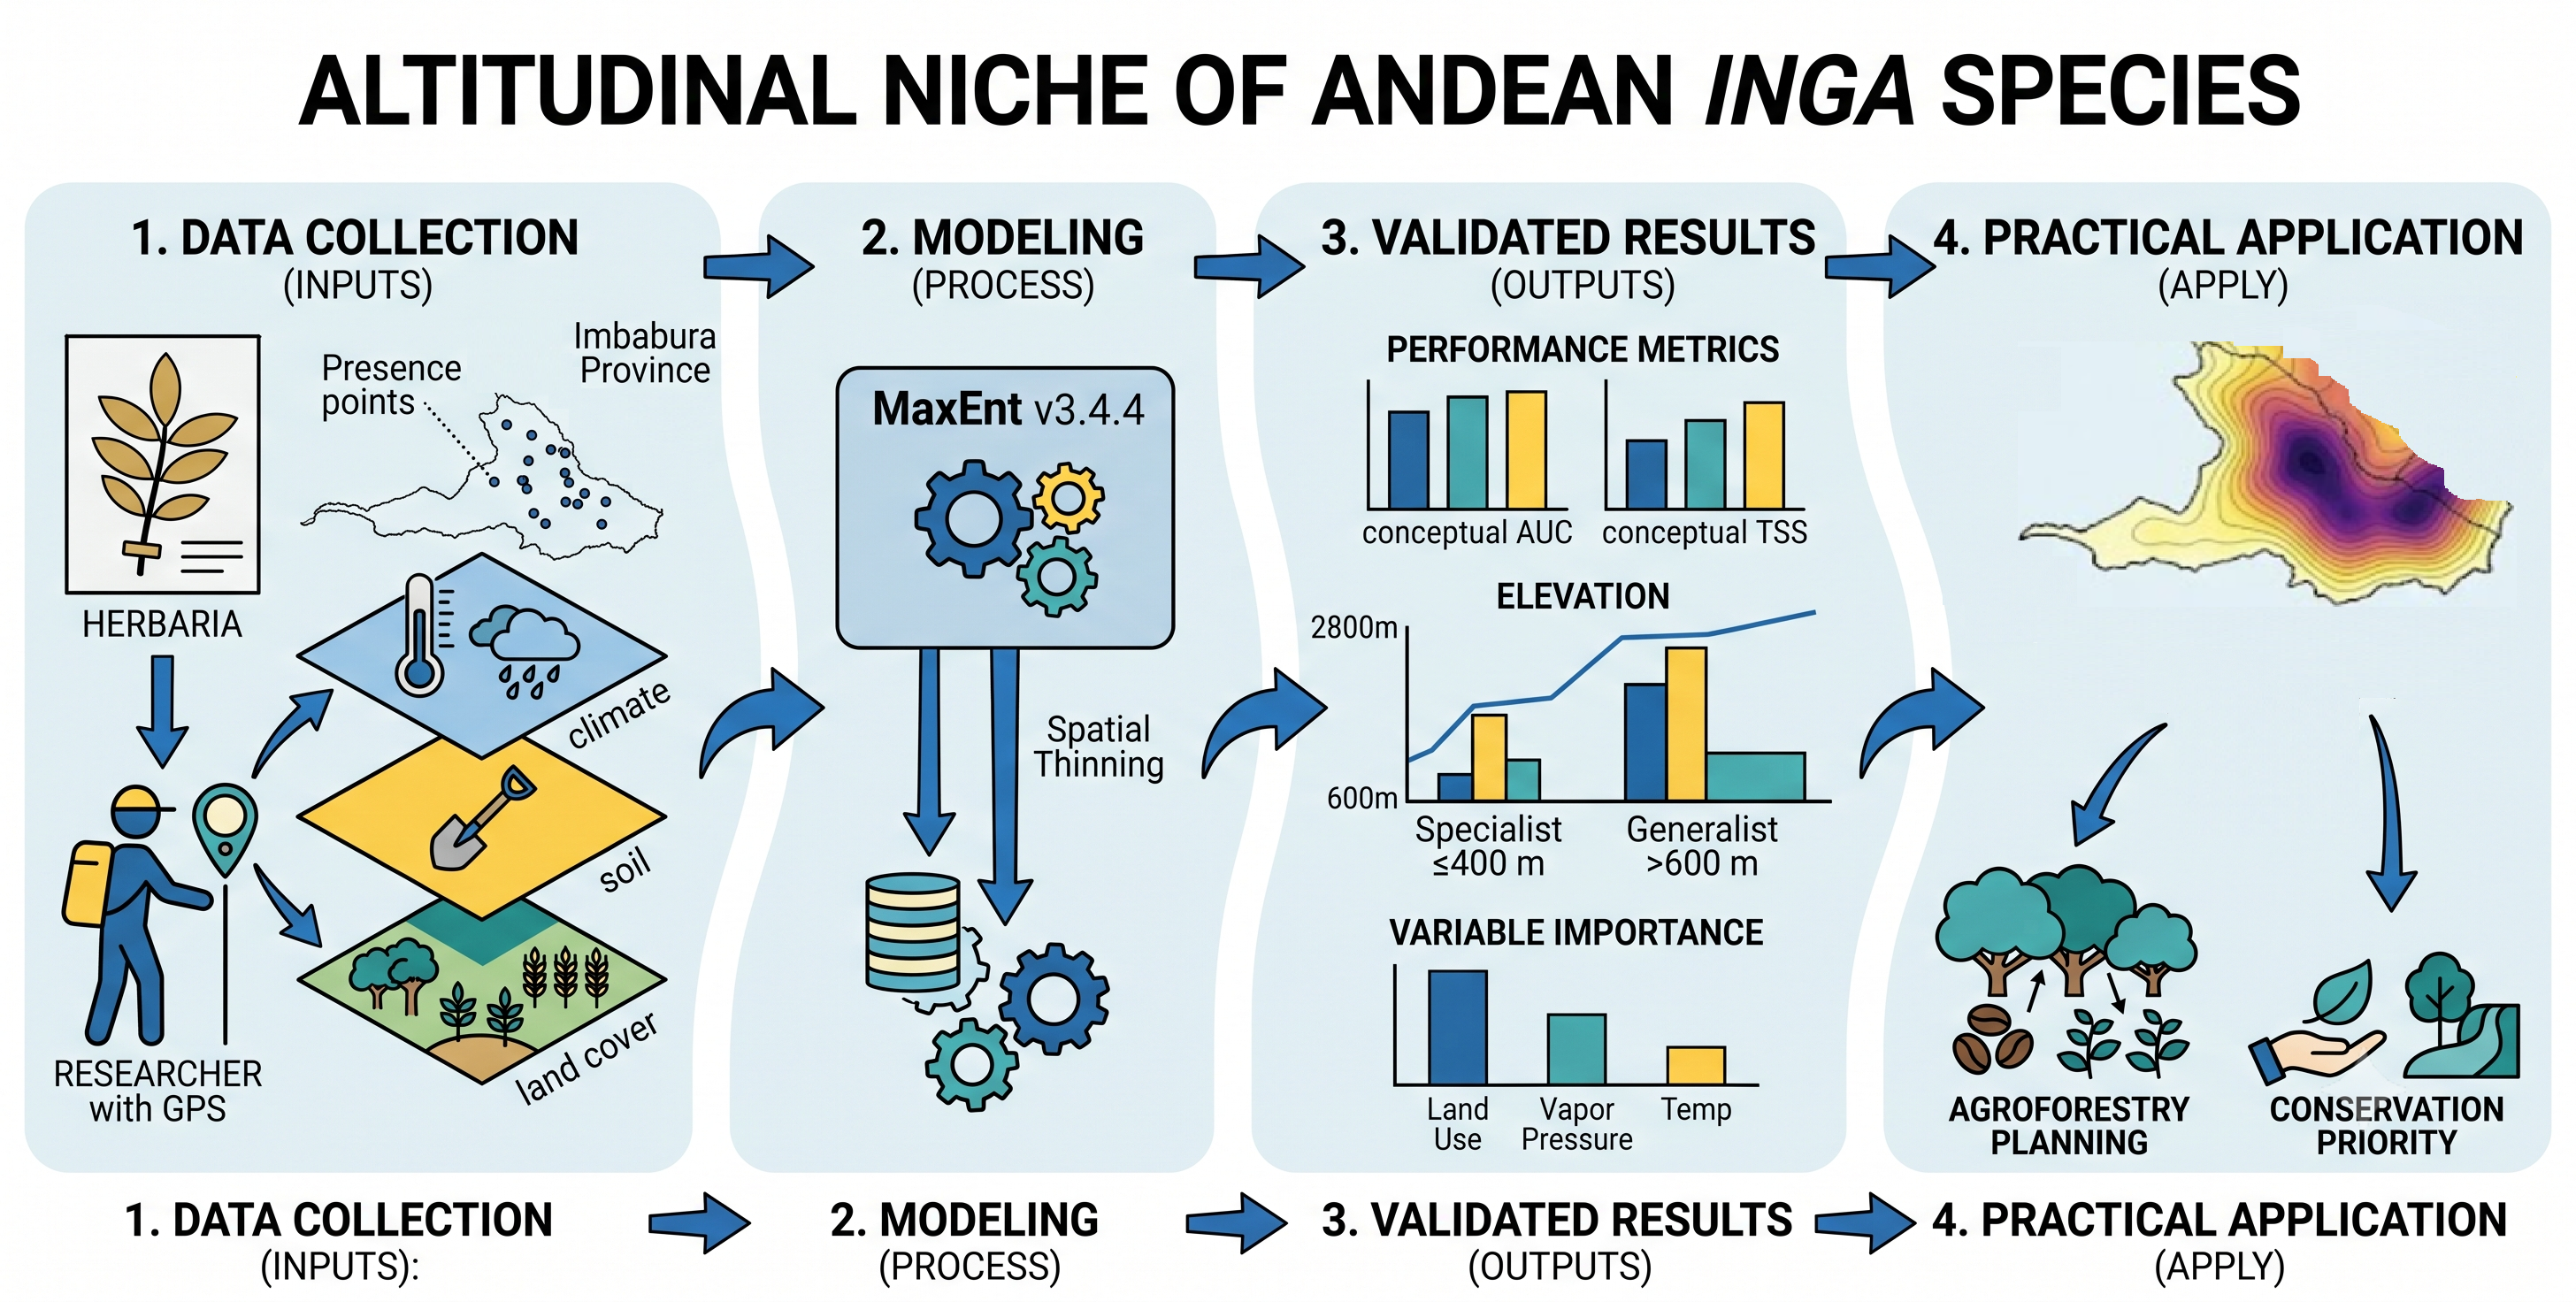
The genus Inga Mill. (Fabaceae: Mimosoideae) comprises approximately 300 species distributed across the American tropics, playing key ecological roles in Andean forest ecosystems. In this study, occurrence data for 17 Inga species in Imbabura Province, Ecuador, were compiled through the review of five national and international herbaria (HUTN, QCNE, MO, AAU, F) and field expeditions conducted during 2024–2026, yielding a total of 181 georeferenced records. Potential distribution models were generated using the Maximum Entropy algorithm (MaxEnt v.3.4.4) for 10 species with sufficient records (≥ 6 presence points), integrating bioclimatic (WorldClim 2.1), edaphic (SoilGrids 2.0), and land-cover variables, pre-selected after multicollinearity screening (Pearson |r| < 0.75). Model validation was performed using the Area Under the ROC Curve (AUC), True Skill Statistic (TSS), and Jackknife tests. Training AUC values ranged from 0.9519 (I. cocleensis) to 0.9968 (I. punctata); TSS values ranged from 0.72 (I. striata) to 0.98 (I. feuillei), confirming high discriminative capacity. Seven species were classified as habitat specialists restricted to altitudinal ranges ≤ 400 m, and three as generalists spanning > 600 m of elevation. Productive land-use systems, water vapor pressure, geopedological units, and bioclimatic temperature and precipitation variables were the most influential predictors. Areas of high suitability for multiple species simultaneously (≥ 40% overlap) were concentrated in the cantons of Cotacachi, Otavalo, and Ibarra, identifying priority zones for conservation and sustainable agroforestry management in the Ecuadorian Andes.
Keywords:
Fabaceae
; species distribution models
; niche partitioning
; true skill statistic
; multicollinearity
; habitat suitability
; tropical montane forests
; land-use planning
1. Introduction
The genus Inga Mill. belongs to the family Fabaceae, subfamily Mimosoideae, and comprises approximately 300 species distributed from Mexico to southern Brazil and Bolivia [1,2]. This genus constitutes one of the most diverse and ecologically important in Neotropical forests, where its species perform essential functions such as biological nitrogen fixation, shade provision in agroforestry systems, and food production for wildlife [3,4]. Its pioneer character and tolerance of degraded soils also make it a widely used component of shade-grown agroforestry systems and land-restoration schemes across the Neotropics [3,5].
In Ecuador, the genus Inga exhibits notable diversity, with more than 60 reported species distributed from Amazonian lowlands to inter-Andean valleys [6,7]. Imbabura Province, located in the Northern Sierra of Ecuador (0°07–°52′ N, 77°45–°79°10′ W), presents exceptional environmental heterogeneity with altitudinal gradients ranging from 400 to 4939 m a.s.l., generating a diversity of microhabitats that favor the presence of multiple species of this genus [8,9].
Species Distribution Models (SDMs) are fundamental tools for understanding geographic distribution patterns and the environmental factors that determine species presence [10,11]. Among available algorithms, Maximum Entropy (MaxEnt) has demonstrated superior performance for modeling species distributions with presence-only data, particularly when the number of records is limited [12,13]. MaxEnt estimates the maximum entropy probability distribution subject to constraints derived from environmental conditions at known presence sites [14]. However, recent consensus guidelines for SDM practice emphasize the need for multi-metric model evaluation, variable selection to control multicollinearity, and explicit treatment of sampling bias to ensure model transferability and conservation relevance [15,16].
Despite the ecological and socioeconomic importance of Inga in the Ecuadorian Andes, studies on its detailed geographic distribution and the environmental factors determining its presence are scarce [17]. This lack of information limits the capacity to implement effective conservation and sustainable management strategies for these species [18] and hinders the development of evidence-based land-use planning that incorporates agroforestry as a tool for territorial management.
We hypothesize that (i) the altitudinal gradient and associated edaphoclimatic conditions are the primary determinants of Inga species distribution in Imbabura, and (ii) specialist species with restricted altitudinal ranges will yield higher model performance metrics (AUC, TSS) than generalist species, owing to their tighter environmental tolerances. The present study aims to: (i) document the geographic distribution of Inga species in Imbabura Province; (ii) generate and rigorously validate potential distribution models using MaxEnt; and (iii) identify the environmental variables of greatest influence on the distribution of each species, with the aim of contributing to conservation planning and agroforestry management in the region.
2. Materials and Methods
2.1. Study Area
Imbabura Province is located in the Northern Sierra of Ecuador, between coordinates 0°07′ and 0°52′ N latitude and 77°45′ and 79°10′ W longitude, covering an area of 4611 km2. The study area encompasses six cantons (Ibarra, Otavalo, Cotacachi, Antonio Ante, Pimampiro, and Urcuquí) and presents an altitudinal gradient from 400 m in the subtropical zone of the biogeographic Chocó to 4939 m a.s.l. at Cotacachi volcano. This altitudinal variation generates five climatic belts: tropical, subtropical, temperate, cold, and páramo, with annual precipitation ranging from 250 to 3500 mm and mean temperatures between 6 °C and 24 °C [8,19].
2.2. Occurrence Data Collection and Spatial Thinning
Data on the occurrence of Inga species were obtained from two main sources: (a) a review of national and international herbarium databases, including the Herbarium of the Technical University of the North (HUTN), the National Herbarium of Ecuador at the National Institute of Biodiversity (QCNE), the Missouri Botanical Garden (MO), the Aarhus University Herbarium (AAU), and the Field Museum Herbarium (F) [20]; and (b) field expeditions conducted between 2024 and 2026, during which specimens were collected through targeted sampling in the province’s six cantons, under scientific collection permit No. MAE-DNB-CM-2024-0078 issued by the Ministry of Environment, Water, and Ecological Transition (MAATE). The geographic coordinates of all collected specimens were recorded using Kobotoobox. Duplicate records and those with imprecise coordinates (coordinate uncertainty > 1,000 m) were removed. In total, 181 georeferenced records of 17 Inga species were documented (Table S1)
To mitigate the spatial sampling bias inherent in herbarium records—which tend to cluster near roads and populated areas— To align with the 30 arc-second (~1 km2) resolution of the environmental predictors and avoid matching multiple occurrences to a single grid cell, we applied spatial thinning using the spThin package (v.0.2.0) in R [21], maintaining a minimum geographic distance of 1 km between retained records. This procedure reduced inter-point spatial autocorrelation while preserving maximum species coverage. After thinning, 10 species retained sufficient records (≥6 presence points) for MaxEnt modeling [22,23]. The complete georeferenced dataset is available through GBIF (https://doi.org/10.15468/dl.8sua8u).
2.3. Environmental Variables and Multicollinearity Screening
Five categories of environmental variables were initially compiled as predictors: (1) bioclimatic variables (Bio 1–19) from WorldClim 2.1 at 30 arc-sec resolution (≈1 km2) [24]; (2) topographic variables (elevation, Terrain Ruggedness Index TRI, slope) derived from the ALOS PALSAR digital elevation model at 12.5 m resolution [25]; (3) global soil variables (nitrogen, pH, texture, sand, silt, and clay content at 0–30 cm) from SoilGrids 2.0 at 250 m [26]; (4) national geopedological variables (soil order, geology) from the SIGTIERRAS program at 1:25,000 scale [27]; and (5) vegetation cover and productive systems from the Ministry of Environment, Water and Ecological Transition (MAATE) at 1:100,000 scale [28]. All layers were reprojected to WGS 84 coordinate system, resampled to a common 1 km2 resolution using bilinear interpolation (continuous variables) or nearest-neighbor assignment (categorical variables) in ARCGIS pro, and clipped to the geographic extent of Imbabura Province
To address multicollinearity prior to modeling, Pearson correlation coefficients were calculated among all continuous predictor variables. Variables exhibiting |r| > 0.75 with another variable of higher ecological interpretability were removed from the predictor set [15]. Topographic variables (elevation, TRI, slope) and global soil attributes (SoilGrids) exhibited high multicollinearity (Pearson |r| > 0.75) with the dominant bioclimatic and geopedological predictors, and were consequently excluded to prevent overfitting. This screening retained a final set of 12 uncorrelated predictors per species (Table 1; Table S2), substantially reducing the risk of model overfitting. From the initial 19 bioclimatic variables, only Bio1, Bio3, Bio7, Bio8, Bio9, Bio12, and Bio17 were retained after screening; Tmax, Tmin, and water vapor pressure (VAPR) were also included as continuous predictors.
2.4. MaxEnt Modeling and Parameter Tuning
Potential distribution models were generated using the Maximum Entropy algorithm (MaxEnt v.3.4.4) [14,29]. For each species, regularization multiplier (RM) and feature class (FC) combinations were evaluated using the ENMeval package (v.2.0.4) in R [30], testing RM values of 0.5, 1.0, 1.5, 2.0, and 3.0 with FC combinations of L (linear), LQ (linear + quadratic), and LQH (linear + quadratic + hinge). The optimal configuration for each species was selected based on minimum corrected Akaike Information Criterion (AICc), favoring parsimony. For species with N ≤ 10, only L and LQ feature classes were considered to prevent overparameterization. Background was generated from 10,000 randomly distributed points within the province extent, with a maximum of 500 iterations and a convergence threshold of 0.00001. Logistic output format was used for all models. Final regularization multipliers and selected feature classes per species are reported in Table S3 (Supplementary Materials).
Model validation was performed using two complementary approaches. For species with N ≥ 10, data were partitioned into 75% training and 25% test sets with 10 bootstrap replicates; mean and standard deviation of AUC values are reported. For species with N < 10 (I. spectabilis, I. cocleensis, I. acuminata), leave-one-out (LOO) cross-validation was used to obtain a more robust estimate of model uncertainty [22]. Model performance was evaluated using: (1) the Area Under the ROC Curve (AUC); (2) the True Skill Statistic (TSS = Sensitivity + Specificity – 1) [31]; and (3) the Jackknife test of variable importance [32,33]. The TSS ranges from −1 (no better than random) to +1 (perfect model), and values > 0.6 are considered good for conservation applications [31]. Habitat suitability maps were classified into four categories: low (0–0.25), medium (0.25–0.50), high (0.50–0.75), and very high (0.75–1.0) [34].
Although three species in this study (I. spectabilis, I. cocleensis, and I. acuminata) presented a limited number of occurrence records (N = 7, 6–8, and 7, respectively), they were retained in the modeling process due to their high ecological and agroforestry relevance in the region. Model robustness for these species was ensured through LOO cross-validation, restriction to L and LQ feature classes, elevated regularization multipliers (RM ≥1.5), and evaluation using TSS in addition to AUC.
3. Results
3.1. Species Richness and Altitudinal Distribution
A total of 17 Inga species were documented in Imbabura Province, distributed along an altitudinal gradient spanning from 600 to 2800 m a.s.l. (Table 2). Of these, seven species were classified as habitat specialists, restricted to narrow altitudinal ranges (≤450 m amplitude), while three species were classified as generalists with altitudinal ranges exceeding 600 m; the remaining seven species exhibited intermediate distributions. The species with the highest number of records were I. insignis (28 records), I. densiflora (25), and I. punctata (20). Inga insignis presented the widest altitudinal distribution (1100–2800 m a.s.l.), while I. cinnamomea and I. silanchensis were restricted to low subtropical zones (~600 m a.s.l.). A complete list of georeferenced occurrence records per species is provided in Table S1 (Supplementary Materials).
3.2. MaxEnt Model Performance
MaxEnt models generated for the 10 species with sufficient records showed satisfactory to excellent predictive performance (Table 3). Training AUC values ranged from 0.9519 (I. cocleensis) to 0.9968 (I. punctata). Test AUC values ranged from 0.7727 (I. striata) to 0.9983 (I. feuillei). TSS values, calculated at the threshold maximizing the sum of sensitivity and specificity, ranged from 0.72 (I. striata) to 0.98 (I. feuillei), confirming adequate to excellent discrimination capacity across species. Six of the 10 modeled species had test AUC values above 0.95 and TSS values above 0.90. I. striata and I. insignis presented the lowest test AUC (0.7727 and 0.8795) and TSS (0.72 and 0.81) values, which can be attributed to their wide distribution and broad environmental tolerance as generalist species well-documented phenomenon in niche modeling literature [35,36]. For species modeled via LOO cross-validation (I. spectabilis, I. cocleensis, I. acuminata), mean AUC ± SD are reported across leave-one-out partitions.
3.3. Environmental Variable Contribution and Jackknife Evaluation
The variable contribution analysis and systematic Jackknife tests revealed highly differentiated, species-specific patterns among the modeled taxa (Table 4, Figure 1). The percentage contribution (%) and permutation importance (%) represent two complementary measures: the former reflects the incremental improvement during model training, while the latter evaluates the sensitivity of the model to random permutation of each variable in the test data and is therefore more robust for identifying ecologically meaningful predictors [32,33].
The systematic Jackknife evaluation (Table 4, Figure 1) highlighted distinct ecological limits. The distribution of I. edulis is strongly constrained by isothermality (bio_3), which achieved the highest predictive gain both when used alone and when omitted. Water vapor pressure (VAPR) was the most important single predictor for I. densiflora, while maximum temperature (Tmax) dominated models for I. feuillei. Temperature annual range (bio_7) constituted the dominant predictor for I. insignis and I. striata, consistent with their broad altitudinal distributions. Productive land-use systems and bio_17 (Precipitation of Driest Quarter) were critical for I. cocleensis, reinforcing a strong ecological association between this species and traditional agroforestry landscapes and mesic microhabitats. The strong response of agricultural land-use layers for I. edulis and I. cocleensis further reinforces their documented association with Andean agroforestry systems [3,5].
3.4. Potential Suitability Areas
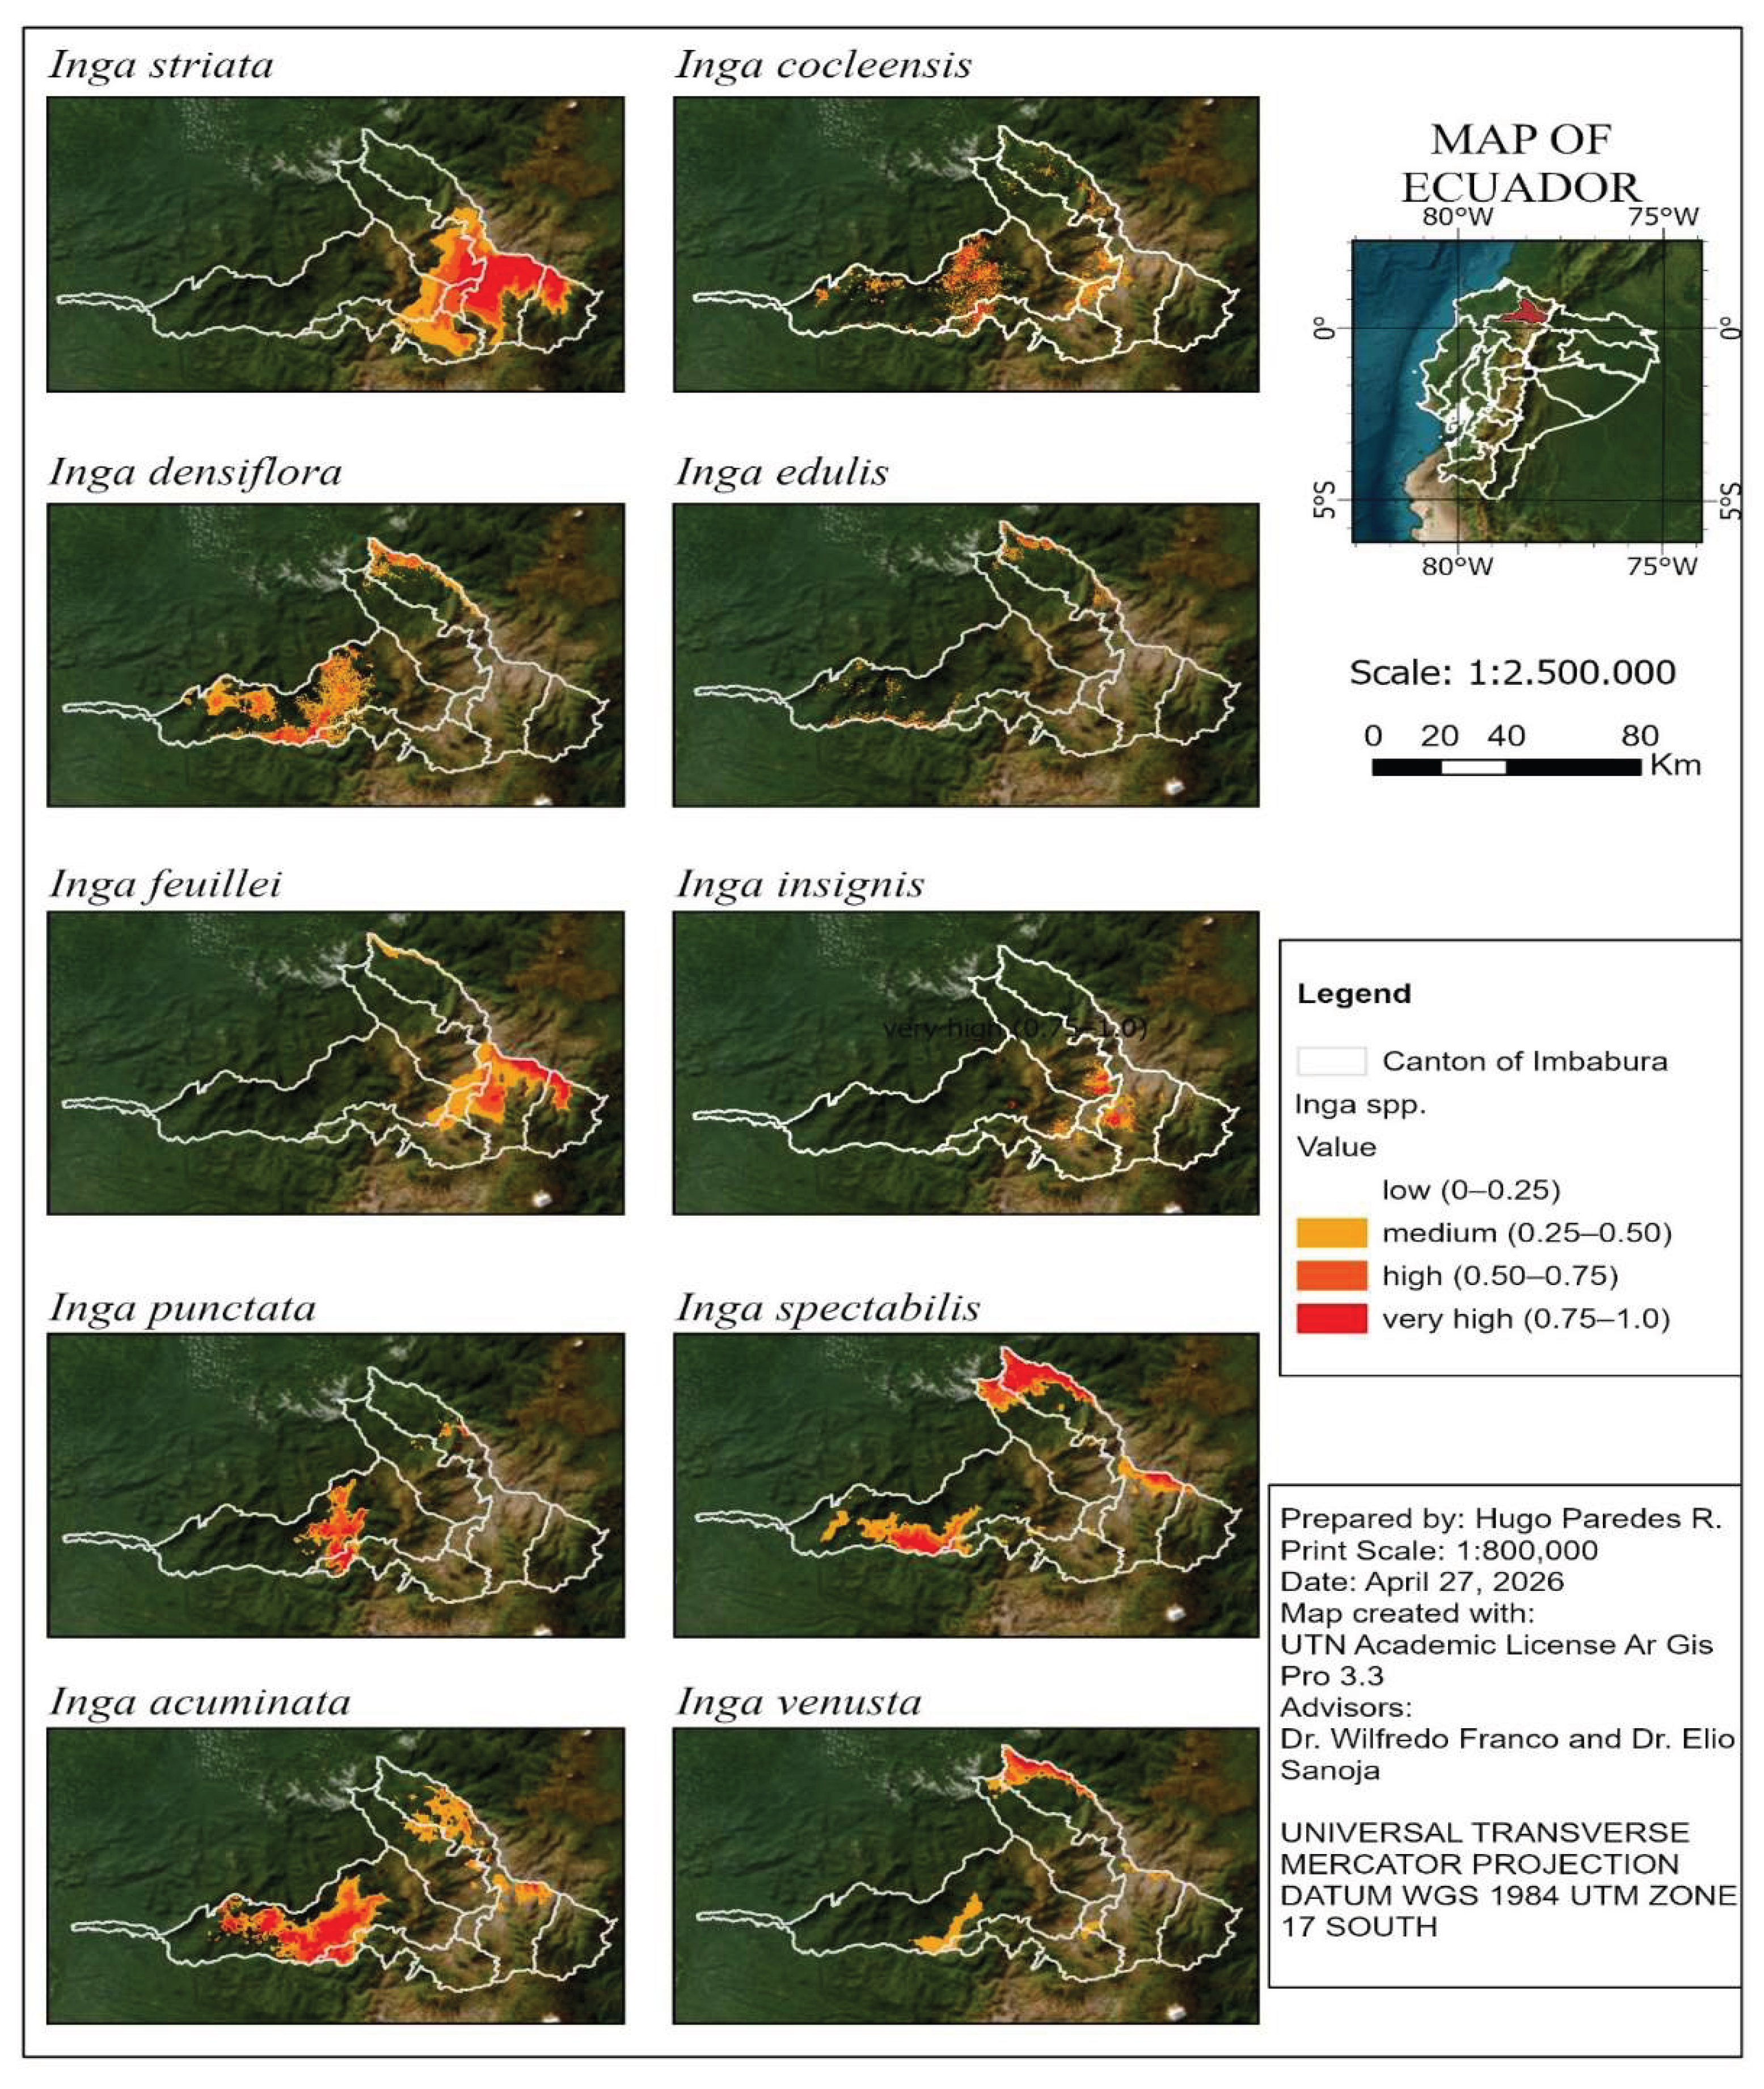
Potential distribution maps revealed high suitability areas concentrated mainly in three zones of the province: (1) the Chota–Mira valley (600–1200 m a.s.l.) for subtropical species such as I. edulis, I. spectabilis, and I. cocleensis; (2) the mid-temperate belt (1400–2200 m a.s.l.) for I. densiflora, I. punctata, and I. venusta; and (3) high inter-Andean valleys (2200–2800 m a.s.l.) for I. insignis and I. striata. Areas of overlapping high suitability (≥40% of grid cells classified as high or very high) for multiple species simultaneously identified in the cantons of Cotacachi, Otavalo, and Ibarra, coinciding with traditional agroforestry system zones [37,38]. These overlap zones represent critical territories for integrated land-use planning that simultaneously promotes biodiversity conservation and sustainable agricultural production.
Figure 2.
Potential habitat suitability maps for the 10 modeled Inga species in Imbabura Province, generated with MaxEnt v.3.4.4. Suitability categories: low (0–0.25), medium (0.25–0.50), high (0.50–0.75), and very high (0.75–1.0). White polygons indicate cantonal boundaries.
Figure 2.
Potential habitat suitability maps for the 10 modeled Inga species in Imbabura Province, generated with MaxEnt v.3.4.4. Suitability categories: low (0–0.25), medium (0.25–0.50), high (0.50–0.75), and very high (0.75–1.0). White polygons indicate cantonal boundaries.
4. Discussion
The results of this study demonstrate that the distribution of Inga in Imbabura is strongly determined by the altitudinal gradient and associated edaphoclimatic conditions, consistent with patterns reported for other Fabaceae genera in the tropical Andes [39,40]. The identification of 17 species in a single province (4611 km2) represents notable richness, comparable to that reported for larger regions such as the Ecuadorian Amazon (>40 species in ~120,000 km2; [6,7]) and higher than that documented in equivalent altitudinal studies in the Colombian Andes (~12 species per province; [17]).
The high performance of MaxEnt models (AUC > 0.95 and TSS > 0.90 for 7 of 10 species) validates the utility of this algorithm for modeling tropical species distributions with limited presence data, as previously documented [12,13,22]. The combination of AUC and TSS as complementary metrics provides a more robust assessment than AUC alone: while AUC is a threshold-independent measure of overall discriminative capacity [16], TSS accounts simultaneously for commission and omission errors and is less sensitive to model prevalence, making it more suitable for conservation decision-making [31]. The relatively lower AUC and TSS values for I. striata (Test AUC = 0.7727; TSS = 0.72) and I. insignis (Test AUC = 0.8795; TSS = 0.81) reflect the inherent difficulty of modeling generalist species with wide environmental tolerance, a well-documented phenomenon in niche modeling literature [35,36] consistent with our initial hypothesis.
Temperature annual range (bio_7) emerged as the dominant predictor for I. insignis and I. striata, suggesting that these wide-ranging generalists respond primarily to broad thermal variation across their elevational gradients. In contrast, isothermality (bio_3) was most critical for I. edulis and I. spectabilis, indicating that thermal stability—rather than absolute temperature—determines their distribution. Maximum temperature (Tmax) dominated the I. feuillei model, consistent with its restriction to cooler inter-Andean belts above 2000 m a.s.l. Water vapor pressure (VAPR) was the primary predictor for I. densiflora and I. venusta, reflecting the importance of atmospheric humidity across their mid-elevation ranges.
The importance of productive land-use systems as a key predictor variable for several species (I. cocleensis: 39.35% contribution; I. densiflora: 20.70%) suggests a close association between Inga species and modified agricultural landscapes, reinforcing the historical role of this genus in traditional Andean agroforestry systems [3,5]. This relationship has direct implications for land-use planning, as it indicates that the persistence of several Inga species depends on the maintenance of traditional agroforestry practices that are being progressively abandoned [41,42].
Some methodological considerations should be acknowledged. First, three species were modeled with a restricted number of occurrence records ( for I. spectabilis, I. cocleensis, and I. acuminata). Although this sample size sits at the lower limit for spatial analysis, the integration of LOO cross-validation, stringent feature class constraints (L and LQ only), and conservative regularization multipliers () effectively controlled overfitting risk [22,30], rendering these models valuable preliminary tools for regional agroforestry zoning. Second, the spatial homogenization of predictors to a 1 km2 grid—while necessary to match global bioclimatic baselines—unavoidably smooths fine-scale topographic and edaphic variations. Consequently, microhabitat dynamics for localized taxa like I. cinnamomea and I. silanchensis should be interpreted with caution until higher-resolution downscaled climatic surfaces become available for the region
The generated suitability maps identify priority areas for in situ conservation of Inga in Imbabura, particularly in altitudinal transition zones. These areas partially overlap with the Mira River Watershed Protective Forest and the Cotacachi–Cayapas Ecological Reserve [48,49]. Protection gaps were identified in the subtropical zones of the northwestern province, where I. cinnamomea and I. silanchensis present restricted distributions and may be vulnerable to ongoing deforestation [50,51]. Future studies incorporating Representative Concentration Pathways (RCP 4.5 and 8.5) for 2050 and 2070 would allow a quantitative assessment of range shifts and potential contraction zones for these Andean species.
5. Conclusions
This study documents the presence of 17 Inga species in Imbabura Province, Ecuador, providing the first detailed characterization of the geographic distribution of this genus in the northern Ecuadorian Andes. MaxEnt models, validated through multi-metric assessment (AUC, TSS, Jackknife) and complemented by multicollinearity screening (Pearson |r| < 0.75) and spatial thinning, demonstrated high predictive performance (Training AUC range: 0.9519–0.9968; TSS range: 0.72–0.98). Productive land-use systems, water vapor pressure, geopedological units, and bioclimatic temperature and precipitation variables (bio_3, bio_7, bio_12, bio_17) were the most influential factors. The classification of species into specialists and generalists—supported by both AUC and TSS evidence—provides a framework for prioritizing conservation actions focused on species with restricted distributions and high vulnerability. uture studies should incorporate climate change scenarios based on the Shared Socioeconomic Pathways (e.g., SSP2-4.5 and SSP5-8.5) from the CMIP6 framework, apply target-group background corrections, and explore connectivity modeling to identify priority corridors between fragmented suitable areas.
Supplementary Materials
The following supporting information can be downloaded from https://doi.org/10.5281/zenodo.21347629: Table S1: Complete georeferenced occurrence records for 17 Inga species in Imbabura (species, latitude, longitude, altitude, source, collection date, dendrometric data); Table S2: Pearson correlation matrix of continuous environmental variables and final predictor set per species after multicollinearity screening; Table S3: Optimal regularization multiplier (RM) and feature classes (FC) selected via ENMeval AICc minimization, and MaxEnt model performance metrics for each modeled species.
Author Contributions
Conceptualization, H.O.P.R. and W.R.F.; methodology, H.O.P.R. and W.R.F.; software, H.O.P.R.; validation, W.R.F. and E.S.; formal analysis, H.O.P.R.; investigation, H.O.P.R. and O.H.E.T.; resources, O.H.E.T.; data curation, H.O.P.R.; writing—original draft preparation, H.O.P.R.; writing—review and editing, W.R.F., E.S. and O.H.E.T.; visualization, H.O.P.R.; supervision, W.R.F. and E.S.; project administration, H.O.P.R.; funding acquisition, H.O.P.R. All authors have read and agreed to the published version of the manuscript.
Funding
This research did not receive external funding. Logistical and laboratory support was provided by the Universidad Técnica del Norte (UTN) and the Forest Sciences Research Group (GICFOR) project Investiga UTN-2025-1449; publication costs were covered by UTN.
Data Availability Statement
The occurrence data used in this study are available through the Global Biodiversity Information Facility (GBIF) via the specific download DOI: https://doi.org/10.15468/dl.8sua8u. Regional herbarium records from the Universidad Técnica del Norte (Herbario UTN) can be accessed through the GBIF publishing organization gateway at https://www.gbif.org/occurrence/search?publishing_org=e1f3033f-176a-4e5e-8b97-7f1f000fcc2a. Environmental datasets are publicly available from the sources cited in the manuscript (WorldClim 2.1, SoilGrids 2.0, and ALOS PALSAR). The field-based dataset for the genus Inga in Imbabura (compiled via KoboToolbox) and the MaxEnt model output files are available from the corresponding author upon reasonable request and are also deposited at Zenodo (https://doi.org/10.5281/zenodo.21347629).
Acknowledgments
The authors thank the staff of HUTN, QCNE, MO, AAU, and F herbaria for facilitating access to their collections. We also thank the field teams that participated in the 2024–2025 expeditions across Imbabura Province. Special acknowledgment is extended to the Universidad Técnica del Norte for providing the financial and institutional support necessary for the publication of this article. Field collection was conducted under MAATE scientific collection permit No. MAE-DNB-CM-2024-0078.
Conflicts of Interest
The authors declare no conflict of interest.
References
- Pennington, T.D. The Genus Inga: Botany; Royal Botanic Gardens, Kew: London, UK, 1997. [Google Scholar]
- Richardson, J.E.; Pennington, R.T.; Pennington, T.D.; Hollingsworth, P.M. Rapid diversification of a species-rich genus of Neotropical rain forest trees. Science 2001, 293, 2242–2245. [Google Scholar] [CrossRef] [PubMed]
- Hands, M.R. The uses of Inga in the acid soils of the rainforest zone. In The Genus Inga: Utilization; Pennington, T.D., Fernandes, E.C.M., Eds.; Royal Botanic Gardens: Kew, UK, 1998; pp. 6–30. [Google Scholar]
- Koptur, S. Extrafloral nectary-mediated interactions between insects and plants. In Insect–Plant Interactions; Bernays, E.A., Ed.; CRC Press: Boca Raton, FL, USA, 1992; pp. 81–129. [Google Scholar]
- Dawson, I.K.; Guariguata, M.R.; Loo, J.; Weber, J.C.; Lengkeek, A.; Bush, D.; Cornelius, J.; Guarino, L.; Kindt, R.; Orwa, C.; et al. What is the relevance of smallholders’ agroforestry systems for conserving tropical tree species and genetic diversity? Biodivers. Conserv. 2013, 22, 301–324. [Google Scholar] [CrossRef]
- Jørgensen, P.M.; León-Yánez, S. Catalogue of the Vascular Plants of Ecuador . Monogr. Syst. Bot. Mo. Bot. Gard. 1999, 75, 1–1182. [Google Scholar]
- Neill, D.A.; Ulloa, C. Adiciones a la Flora del Ecuador: Segundo Suplemento, 2005–2010; Fundación Jatun Sacha: Quito, Ecuador, 2011. [Google Scholar]
- Palacios, W.A. Familias y Géneros Arbóreos del Ecuador; MAE-FAO: Quito, Ecuador, 2016. [Google Scholar]
- Sierra, R. Propuesta Preliminar de un Sistema de Clasificación de Vegetación para el Ecuador Continental; Proyecto INEFAN/GEF: Quito, Ecuador, 1999. [Google Scholar]
- Guisan, A.; Zimmermann, N.E. Predictive habitat distribution models in ecology. Ecol. Model. 2000, 135, 147–186. [Google Scholar] [CrossRef]
- Elith, J.; Leathwick, J.R. Species distribution models: Ecological explanation and prediction across space and time. Annu. Rev. Ecol. Evol. Syst. 2009, 40, 677–697. [Google Scholar] [CrossRef]
- Phillips, S.J.; Anderson, R.P.; Schapire, R.E. Maximum entropy modeling of species geographic distributions. Ecol. Model. 2006, 190, 231–259. [Google Scholar] [CrossRef]
- Elith, J.; Phillips, S.J.; Hastie, T.; Dudík, M.; Chee, Y.E.; Yates, C.J. A statistical explanation of MaxEnt for ecologists. Divers. Distrib. 2011, 17, 43–57. [Google Scholar]
- Phillips, S.J.; Dudík, M. Modeling of species distributions with Maxent: New extensions and a comprehensive evaluation. Ecography 2008, 31, 161–175. [Google Scholar] [CrossRef]
- Dormann, C.F.; Elith, J.; Bacher, S.; et al. Collinearity: A review of methods to deal with it and a simulation study evaluating their performance. Ecography 2013, 36, 27–46. [Google Scholar]
- Lobo, J.M.; Jiménez-Valverde, A.; Real, R. AUC: A misleading measure of the performance of predictive distribution models. Glob. Ecol. Biogeogr. 2008, 17, 145–151. [Google Scholar]
- Tejedor-Garavito, N.; lvarez, E.; Arango, S. Distribución potencial de especies arbóreas en los Andes colombianos. Rev. Biol. Trop. 2012, 60, 1–18. [Google Scholar]
- Cuesta, F.; Peralvo, M.; Valarezo, N. Los Bosques Montanos de los Andes Tropicales; UICN: Quito, Ecuador, 2009. [Google Scholar]
- Pourrut, P.; Révére, O.; Romo, I.; Villacrés, H. Clima del Ecuador. In El Agua en el Ecuador; CEDIG: Quito, Ecuador, 1995; pp. 13–26. [Google Scholar]
- Thiers, B. Index Herbariorum: A Global Directory of Public Herbaria and Associated Staff. Available online: http://sweetgum.nybg.org/science/ih/ (accessed on 10 May 2026).
- Aiello-Lammens, M.E.; Boria, R.A.; Radosavljevic, A.; Vilela, B.; Anderson, R.P. spThin: An R package for spatial thinning of species occurrence records for use in ecological niche models. Ecography 2015, 38, 541–545. [Google Scholar] [CrossRef]
- Wisz, M.S.; Hijmans, R.J.; Li, J.; Peterson, A.T.; Graham, C.H.; Guisan, A. Effects of sample size on the performance of species distribution models. Divers. Distrib. 2008, 14, 763–773. [Google Scholar] [CrossRef]
- GBIF.org (10 May 2026) GBIF Occurrence Download. https://doi.org/10.15468/dl.8sua8u. [CrossRef]
- Fick, S.E.; Hijmans, R.J. WorldClim 2: New 1-km spatial resolution climate surfaces for global land areas. Int. J. Climatol. 2017, 37, 4302–4315. [Google Scholar] [CrossRef]
- DAAC, A.S.F. ALOS PALSAR Radiometric Terrain Corrected High Res. Available online: https://asf.alaska.edu (accessed on 10 May 2026).
- Poggio, L.; de Sousa, L.M.; Batjes, N.H.; Heuvelink, G.B.; Kempen, B.; Ribeiro, E.; Rossiter, D. SoilGrids 2.0. Soil 2021, 7, 217–240. [Google Scholar] [CrossRef]
- SIGTIERRAS. Sistema Nacional de Información y Gestión de Tierras Rurales e Infraestructura Tecnológica; MAG: Quito, Ecuador, 2017. [Google Scholar]
- MAATE. Mapa de Cobertura y Uso de la Tierra del Ecuador Continental; MAATE: Quito, Ecuador, 2022. [Google Scholar]
- Phillips, S.J.; Anderson, R.P.; Dudík, M.; Schapire, R.E.; Blair, M.E. Opening the black box: An open-source release of Maxent. Ecography 2017, 40, 887–893. [Google Scholar] [CrossRef]
- Muscarella, R.; Galante, P.J.; Soley-Guardia, M.; Boria, R.A.; Kass, J.M.; Uriarte, M.; Anderson, R.P. ENMeval: An R package for conducting spatially independent evaluations and estimating optimal model complexity for MaxEnt ecological niche models. Methods Ecol. Evol. 2014, 5, 1198–1205. [Google Scholar] [CrossRef]
- Allouche, O.; Tsoar, A.; Kadmon, R. Assessing the accuracy of species distribution models: Prevalence, kappa and the true skill statistic (TSS). J. Appl. Ecol. 2006, 43, 1223–1232. [Google Scholar] [CrossRef]
- Merow, C.; Smith, M.J.; Silander, J.A. A practical guide to MaxEnt for modeling species’ distributions. Ecography 2013, 36, 1058–1069. [Google Scholar] [CrossRef]
- Phillips, S.J.; Anderson, R.P.; Schapire, R.E. Maximum entropy modeling of species geographic distributions. Ecol. Model. 2006, 190, 231–259. [Google Scholar] [CrossRef]
- Liu, C.; White, M.; Newell, G. Selecting thresholds for the prediction of species occurrence with presence-only data. J. Biogeogr. 2013, 40, 778–789. [Google Scholar] [CrossRef]
- Hernandez, P.A.; Graham, C.H.; Master, L.L.; Albert, D.L. The effect of sample size and species characteristics on performance of different species distribution modeling methods. Ecography 2006, 29, 773–785. [Google Scholar] [CrossRef]
- Syfert, M.M.; Smith, M.J.; Coomes, D.A. The effects of sampling bias and model complexity on the predictive performance of MaxEnt species distribution models. PLoS ONE 2013, 8, e55158. [Google Scholar] [CrossRef] [PubMed]
- Beer, J.; Muschler, R.; Kass, D.; Somarriba, E. Shade management in coffee and cacao plantations. Agrofor. Syst. 1998, 38, 139–164. [Google Scholar] [CrossRef]
- Rice, R.A.; Greenberg, R. Cacao cultivation and the conservation of biological diversity. Ambio 2000, 29, 167–173. [Google Scholar] [CrossRef]
- Young, K.R.; Ulloa, C.U.; Luteyn, J.L.; Knapp, S. Plant evolution and endemism in Andean South America. Bot. Rev. 2002, 68, 4–21. [Google Scholar] [CrossRef]
- Pennington, R.T.; Lavin, M.; Oliveira-Filho, A. Woody plant diversity, evolution, and ecology in the tropics. Annu. Rev. Ecol. Evol. Syst. 2009, 40, 437–457. [Google Scholar] [CrossRef]
- Harvey, C.A.; Villalobos, J.A.G. Agroforestry systems conserve species-rich but modified assemblages of tropical birds and bats. Biodivers. Conserv. 2007, 16, 2257–2292. [Google Scholar] [CrossRef]
- Schroth, G.; Harvey, C.A. Biodiversity conservation in cocoa production landscapes. Biodivers. Conserv. 2007, 16, 2237–2244. [Google Scholar] [CrossRef]
- Buytaert, W.; Cuesta-Camacho, F.; Tobón, C. Potential impacts of climate change on the environmental services of humid tropical alpine regions. Glob. Ecol. Biogeogr. 2011, 20, 19–33. [Google Scholar]
- Loza, M.I.; Moraes, R.; Jørgensen, P.M. Variación de la diversidad y composición florística en relación a la elevación en un bosque montano boliviano. Ecol. Boliv. 2010, 45, 87–100. [Google Scholar]
- Dexter, K.G.; Chave, J. Evolutionary patterns of range size, abundance and species richness in Amazonian angiosperm trees. PeerJ 2016, 4, e2402. [Google Scholar] [CrossRef] [PubMed]
- Phillips, S.J.; Dudík, M.; Elith, J.; Graham, C.H.; Lehmann, A.; Leathwick, J.; Ferrier, S. Sample selection bias and presence-only distribution models: Implications for background and pseudo-absence data. Ecol. Appl. 2009, 19, 181–197. [Google Scholar] [CrossRef] [PubMed]
- Kessler, M. Patterns of diversity and range size of selected plant groups along an elevational transect in the Bolivian Andes. Biodivers. Conserv. 2001, 10, 1897–1921. [Google Scholar] [CrossRef]
- Myers, N.; Mittermeier, R.A.; Mittermeier, C.G.; da Fonseca, G.A.B.; Kent, J. Biodiversity hotspots for conservation priorities. Nature 2000, 403, 853–858. [Google Scholar] [CrossRef] [PubMed]
- Mittermeier, R.A.; Turner, W.R.; Larsen, F.W.; Brooks, T.M.; Gascon, C. Global biodiversity conservation: The critical role of hotspots. In Biodiversity Hotspots; Springer: Berlin, Germany, 2011; pp. 3–22. [Google Scholar]
- Mosandl, R.; Günter, S.; Stimm, B.; Weber, M. Ecuador suffers the highest deforestation rate in South America. In Gradients in a Tropical Mountain Ecosystem of Ecuador; Springer: Berlin, Germany, 2008; pp. 37–40. [Google Scholar]
- Sierra, R.; Stallings, J. The dynamics and social organization of tropical deforestation in Northwest Ecuador, 1983–1995. Hum. Ecol. 1998, 26, 135–161. [Google Scholar] [CrossRef]
Figure 1.
Jackknife tests of relative importance of environmental variables in the MaxEnt potential distribution models for the 10 modeled Inga species in Imbabura Province. Dark blue bars represent model gain when a single variable is used in isolation; light green bars indicate the gain when the model is run omitting that specific variable; the red bar indicates the total model gain using all variables combined.
Figure 1.
Jackknife tests of relative importance of environmental variables in the MaxEnt potential distribution models for the 10 modeled Inga species in Imbabura Province. Dark blue bars represent model gain when a single variable is used in isolation; light green bars indicate the gain when the model is run omitting that specific variable; the red bar indicates the total model gain using all variables combined.
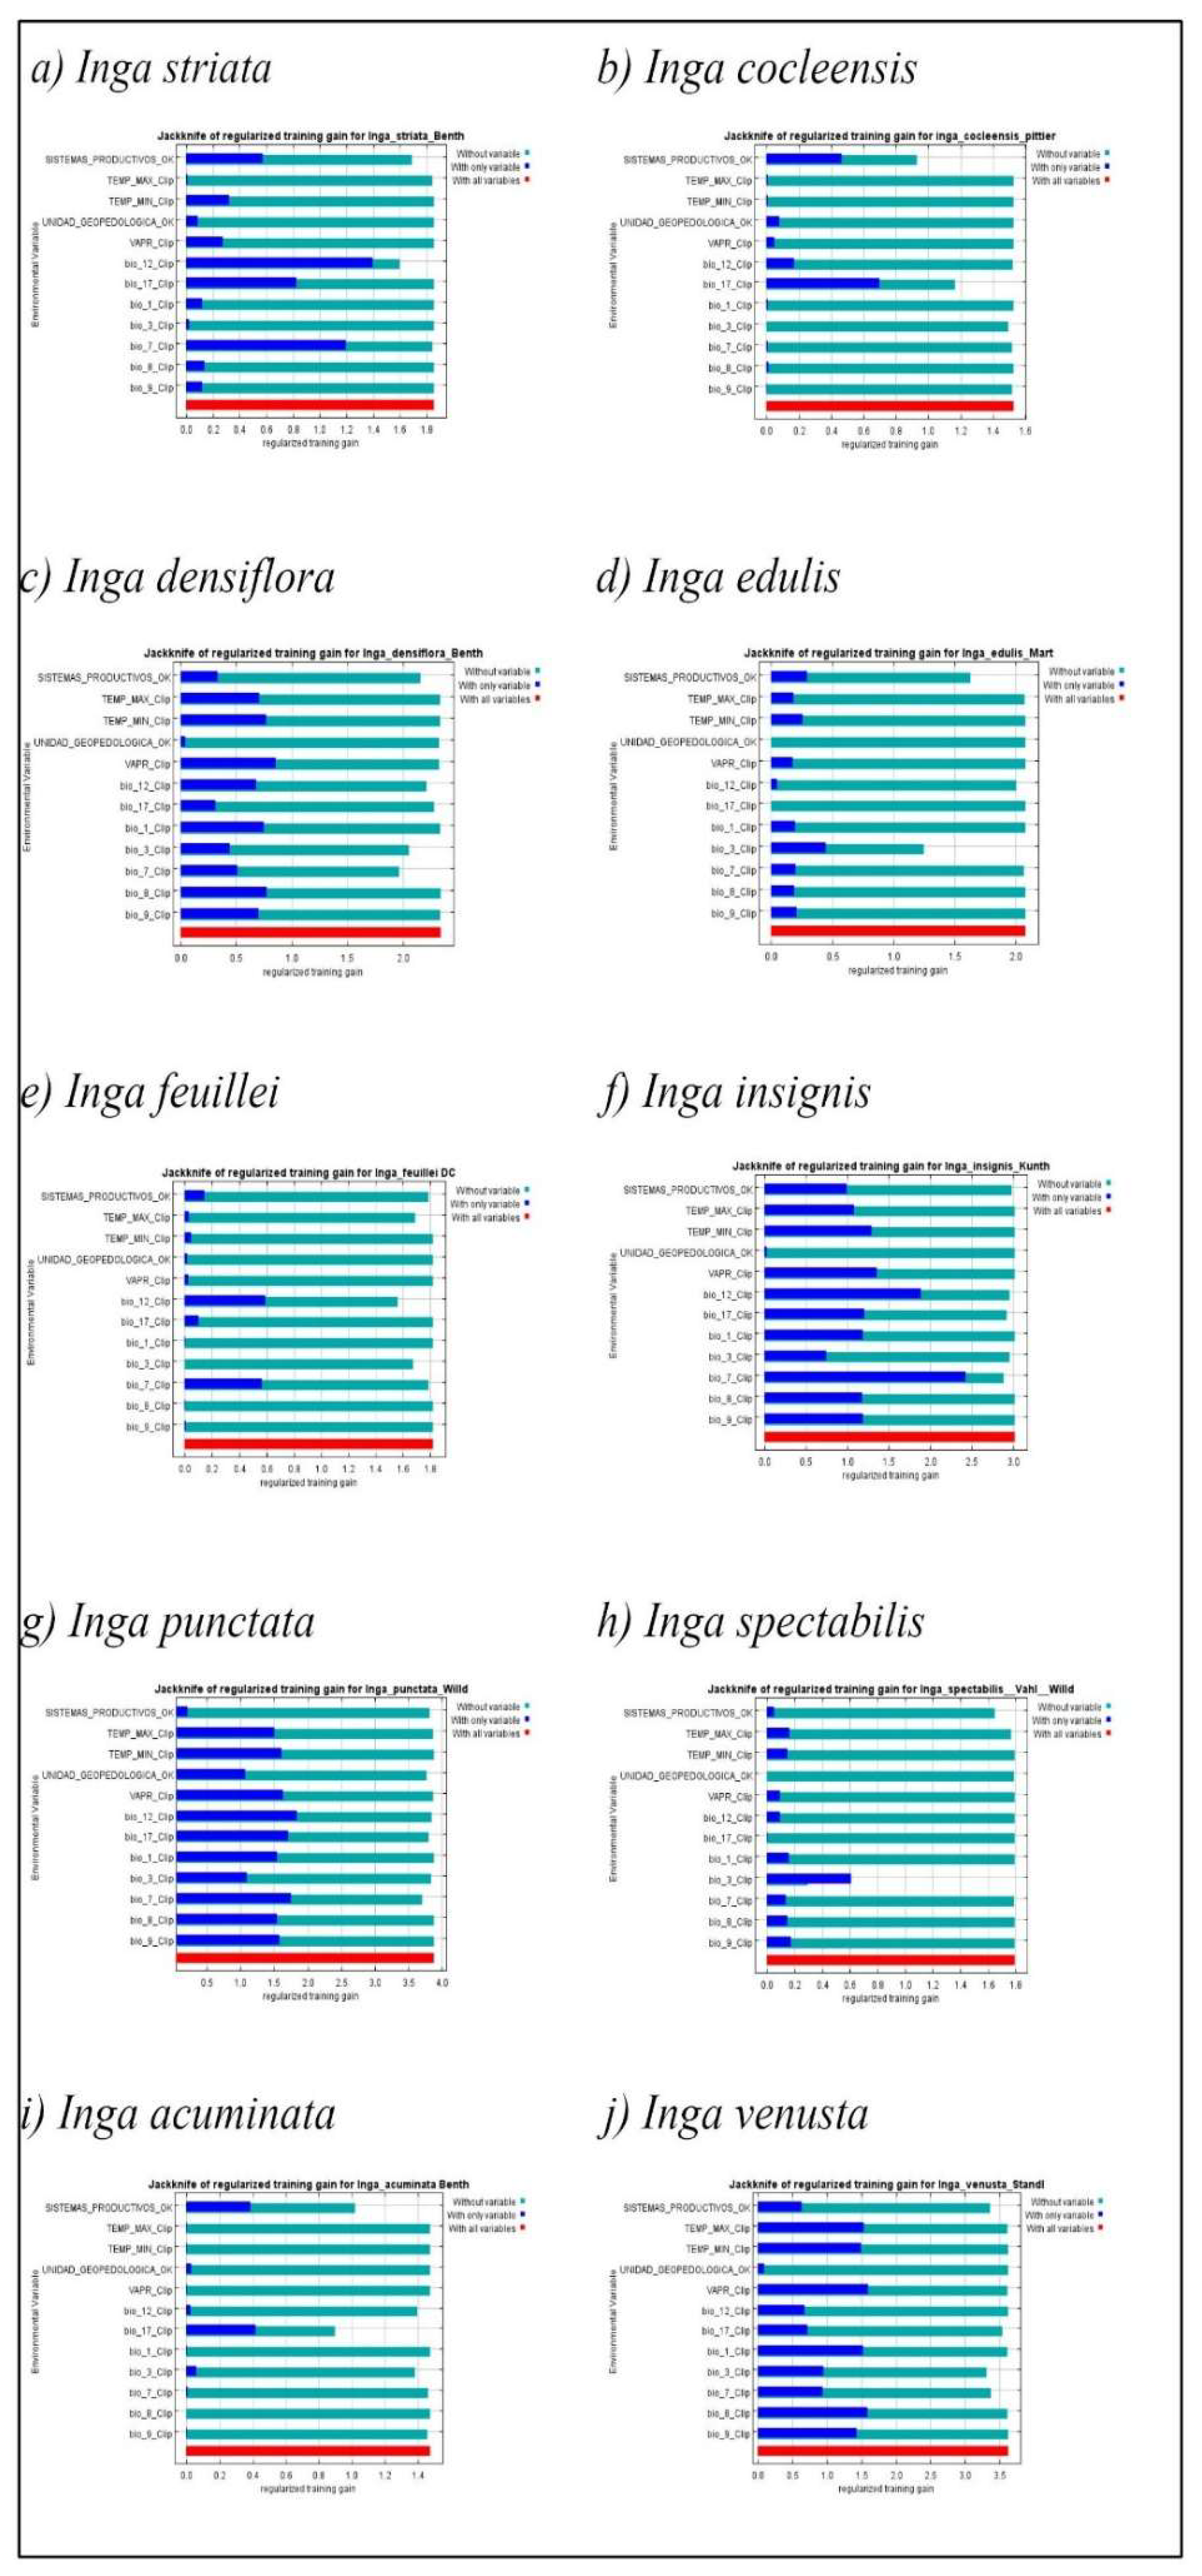

Table 1.
Environmental variables used in MaxEnt modeling after multicollinearity screening.
| Variable Category | Source | Format | Resolution/Scale | Variables Retained |
| Climate (Bio1, Bio3, Bio7, Bio8, Bio9, Bio12, Bio17) |
WorldClim 2.1 | Raster | 30 arc-sec (~1 km2) | Species-dependent (see Table S2) |
| Temperature (Tmax, Tmin) |
WorldClim 2.1 | Raster | 30 arc-sec (~1 km2) | All retained |
| Water Vapor Pressure (VAPR) | WorldClim 2.1 | Raster | 30 arc-sec (~1 km2) | All retained |
| Geopedology (Soil Order, Geology) |
SIGTIERRAS | Polygon → Raster | 1:25,000 | All retained |
| Vegetation Cover / Productive Systems |
SIGTIERRAS | Polygon → Raster | 1:25,000 | All retained |
Table 2.
Edaphoclimatic characteristics of Inga species in Imbabura. Continuous variables represent the mean ± standard deviation extracted from occurrences.
Table 2.
Edaphoclimatic characteristics of Inga species in Imbabura. Continuous variables represent the mean ± standard deviation extracted from occurrences.
| Species | Altitude (m a.s.l.) | Temp. (°C) | Precip. (mm) | Soil Order | Texture | pH | Distribution Type |
| I. edulis | 700–1000 | 21–22 | 1500–2000 | Mollisol | Clay-Loam | Slightly Acidic | Specialist |
| I. feuillei | 2000–2200 | 15–16 | 500–750 | Mollisol | Sandy Loam | Alkaline | Specialist |
| I. silanchensis | 600–700 | 22–23 | 3000–3500 | Inceptisol | Loam | Acidic | Specialist |
| I. spectabilis | 800–900 | 21–22 | 1750–2000 | Mollisol | N/A* | N/A* | Specialist |
| I. marginata | 1600–1700 | 17–19 | 1750–3000 | Inceptisol | Sandy Loam | Neutral | Specialist |
| I. cinnamomea | 600 | 22–23 | 3000–3500 | Inceptisol | Loam | Acidic | Specialist |
| I. venusta | 1600–1800 | 17–18 | 2500–3000 | Incept.+Entisol | Clay-Loam | Slightly Acidic | Specialist |
| I. punctata | 1600–2035 | 17–18 | 2500–3000 | Inceptisol | Sandy Loam | Neutral | Specialist |
| I. vera | 2400–2600 | 13–14 | 1250–1500 | Incept.+Entisol | Clay-Loam | Slightly Acidic | Intermediate |
| I. cocleensis | 1619–2036 | 17–18 | 2500–3000 | Inceptisol | Sandy Loam | Neutral | Specialist |
| I. acuminata | 1546–1821 | 16–18 | 1750–2000 | Incept.+Entisol | Sandy Loam | Mod. Acidic | Intermediate |
| I. multijuga | 2600–2800 | 12–13 | 750–1000 | Inceptisol | Loam | Neutral | Intermediate |
| I. oerstediana | 650–787 | 18–23 | 2000–2500 | Incept.+Entisol | Loam | Mod. Acidic | Generalist |
| I. insignis | 1100–2800 | 11–21 | 500–1500 | Incept.+Mollisol | Loam/Sandy | Variable | Generalist |
| I. sapindoides | 600–2800 | 12–23 | 750–2500 | Inceptisol | Clay-Loam | Slightly Acidic | Generalist |
| I. striata | 1800–2804 | 15–17 | 250–1750 | Incept.+Mollisol | Sandy Loam | Neutral | Intermediate |
| I. densiflora | 685–1839 | 14–21 | 1000–3000 | Incept.+Mollisol | Clay-Sandy | Slightly Acidic | Intermediate |
N/A: Soil properties could not be determined due to the marginal or limited nature of historical sampling sites. Temp.: mean annual temperature (WorldClim); Precip.: mean annual precipitation (WorldClim); pH and Texture were extracted from SIGTIERRAS geopedological layers.
Table 3.
MaxEnt model performance for Inga species in Imbabura Province, Ecuador.
| Species | N (training) | Validation Method | Training AUC | Test AUC (±SD) | TSS | Model Quality |
| I. acuminata | 7 | LOO (k=7) | 0.9579 | 0.9958 ± 0.019 | 0.97 | Excellent* |
| I. cocleensis | 6 | LOO (k=6) | 0.9519 | 0.9841 ± 0.031 | 0.95 | Excellent* |
| I. densiflora | 22 | Bootstrap (n=10) | 0.9672 | 0.9788 ± 0.012 | 0.94 | Excellent |
| I. edulis | 14 | Bootstrap (n=10) | 0.9786 | 0.9871 ± 0.018 | 0.95 | Excellent |
| I. feuillei | 11 | Bootstrap (n=10) | 0.9786 | 0.9983 ± 0.006 | 0.98 | Excellent |
| I. insignis | 23 | Bootstrap (n=10) | 0.9741 | 0.8795 ± 0.031 | 0.81 | Good |
| I. punctata | 20 | Bootstrap (n=10) | 0.9968 | 0.9976 ± 0.004 | 0.97 | Excellent |
| I. spectabilis | 7 | LOO (k=7) | 0.9831 | 0.9867 ± 0.027 | 0.94 | Excellent* |
| I. striata | 14 | Bootstrap (n=10) | 0.9543 | 0.7727 ± 0.048 | 0.72 | Good |
| I. venusta | 16 | Bootstrap (n=10) | 0.9957 | 0.9970 ± 0.008 | 0.96 | Excellent |
* Species validated via leave-one-out (LOO) cross-validation due to limited sample size (N ≤ 7). Training AUC represents the performance of the final model built with 100% of the training occurrences. TSS: True Skill Statistic; LOO: leave-one-out cross-validation. TSS thresholds: ≥0.80 = Excellent; 0.60–0.79 = Good; <0.60 = Poor [31].
Table 4.
Main contributing variables per species in MaxEnt models (Imbabura, Ecuador).
| Species |
Main Variable (% contribution) |
Jackknife: Highest gain alone |
Jackknife: Most decreased without |
Permutation Importance (%) |
| I. acuminata | bio_17 (43.56%) | bio_17 | bio_12 | bio_9 (20.51%) |
| I. cocleensis | Productive Systems (39.35%) | bio_17 | Productive Systems | bio_17 (52.46%) |
| I. densiflora | VAPR (29.86%) | VAPR | bio_7 | Productive Systems (20.70%) |
| I. edulis | bio_3 (36.99%) | bio_3 | bio_3 | bio_9 (29.59%) |
| I. feuillei | Tmax (37.88%) | bio_12 | bio_12 | bio_7 (26.31%) |
| I. insignis | bio_7 (73.69%) | bio_7 | bio_12 | bio_7 (73.69%) |
| I. punctata | VAPR (27.40%) | bio_12 | bio_7 | bio_7 (28.73%) |
| I. spectabilis | bio_3 (59.80%) | bio_3 | bio_3 | bio_9 (37.06%) |
| I. striata | bio_7 (50.38%) | bio_12 | bio_7 | bio_7 (50.38%) |
| I. venusta | VAPR (25.43%) | bio_1 | bio_3 | bio_3 (23.66%) |
Bio1: Annual Mean Temperature; Bio3: Isothermality (BIO2/BIO7) (×100); Bio7: Temperature Annual Range (BIO5–BIO6); Bio8: Mean Temperature of Wettest Quarter; Bio9: Mean Temperature of Driest Quarter; Bio12: Annual Precipitation; Bio17: Precipitation of Driest Quarter; VAPR: Water Vapor Pressure; Tmax: Maximum Temperature.
Disclaimer/Publisher’s Note: The statements, opinions and data contained in all publications are solely those of the individual author(s) and contributor(s) and not of MDPI and/or the editor(s). MDPI and/or the editor(s) disclaim responsibility for any injury to people or property resulting from any ideas, methods, instructions or products referred to in the content. |
© 2026 by the authors. Licensee MDPI, Basel, Switzerland. This article is an open access article distributed under the terms and conditions of the Creative Commons Attribution (CC BY) license (http://creativecommons.org/licenses/by/4.0/).
Copyright: This open access article is published under a Creative Commons CC BY 4.0 license, which permit the free download, distribution, and reuse, provided that the author and preprint are cited in any reuse.


