
Submitted:
21 July 2026
Posted:
22 July 2026
You are already at the latest version
Abstract
Background/Objectives: Albania occupies a key geographic position in the Balkan Pen-insula, yet its fine scale population structure and genetic relationship with neighboring European populations, remain incompletely characterized. This study investigated the regional genetic structure of the Albanian population and its affinities within the broader European context using autosomal short tandem repeats (STR) markers. Methods: A total of 2000 unrelated individuals representing all 12 administrative regions of Albania were genotyped for 16 autosomal STR loci (D3S1358, VWA, D16S539, D2S1338, D8S1179, D21S11, D18S51, D19S433, THO1, FGA, D10S1248, D22S1045, D2S441, D1S1656, D12S391 and SE33) together with the Amelogenin sex marker. Individuals were grouped into Northern, Central and Southern Albania. Population structure was evaluated using Principal Component Analysis (PCA), pairwise Weir-Cockerham F_ST estimates, Nei’s standard genetic distance, and phylogenetic reconstruction. Comparative analysis in-cluded reference populations from Greece, Italy, Montenegro, Bosnia and Herzegovina, Slovenia, Slovakia, Hungary, Germany and France, using published allele frequency data. Results: PCA demonstrated extensive overlap among individuals from all three Albanian regions, with no distinct regional clustering. The principal components explained only a small proportion of the total genetic variation (PC1 = 0.80%; PC2 = 0.77%), indicating minimal population substructure. F_ST estimates between Northern, Central and South Albania were consistently close to zero, with bootstrap – derived 95% confidence inter-vals overlapping zero for all comparisons, confirming the absence of statistically signif-icance regional differentiation. Nei’s genetic distances among the analyzed European populations varies from approximately 0.004 to 0.014, consistent with the low levels of differentiation typically observed among European STR datasets. Phylogenetic analysis identified three major clusters: Albania and Greece formed the closest genetic pair, with Montenegro and subsequently Italy joinig this southeastern cluster: France and Germany clustered together; whereas Bosnia nd Herzegovina, Slovenia, Slovakia and Hungary formed a distinct Central Balkan/Central European cluster. Conclusions: The Albanian population exhibits a high degree of genetic homogeneity across its geographic regions, reflecting extensive historical gene flow and limited inter-nal population stratification. Comparative analyses place Albanians in close genetic proximity to neighboring southeastern European populations, particularly Greece, while preserving the broader genetic structure expected across Europe.
Keywords:
genetic distances
; autosomal STR markers
; population structure
; Albania
1. Introduction
The genetic structure of human populations is shaped by a complex interplay of historical, demographic, and evolutionary forces. Patterns of migration, isolation, admixture, and cultural continuity leave identifiable signatures in allele frequency distributions, allowing measurements of genetic distance to serve as powerful tools for reconstructing population history [1,2]. In this context, the study of genetic relationships between populations provides insight not only into their biological affinities but also into the historical events that contributed to their formation.
The Albanian population, located at a geographical and cultural crossroads in the Western Balkans, provides a particularly informative case for such analyses. The region has experienced multiple waves of human movement – from prehistoric settlements and Indo-European expansions to the Roman, Byzantine, Slavic and Ottoman periods [3,4]– each potentially contributing to the present-day genetic landscape. Despite this dynamic history, linguistic continuity and documented long-term settlement patterns suggest a degree of population stability that may be reflected in the genetic composition of contemporary Albanians [5].
Comparative analyses of allele frequencies in Albanian populations and neighboring Balkan groups have consistently supported the hypotheses of common ancestry, genetic drift, and historical gene flow. Studies of highly polymorphic HLA loci demonstrate close genetic affinities between Albanians and geographically close populations such as Greeks, Macedonians, Bulgarians, and Italians, reflecting regional continuity and historical interactions [6], however a different study highlights that the Albanian population exhibits distinct patterns in Rh blood group distribution, characterized by a low prevalence of the weak D phenotype and a specific distribution of the three most common variant alleles within this Caucasian group [7]. Autosomal STR allele frequency data from Albania further provide a powerful framework for estimating genetic distances (F_ST) and performing comparative population analyses within the Balkans.
Genome-wide SNP analyses of Western Balkan populations reveal clustering patterns consistent with isolation by distance and extensive historical gene flow between neighboring groups [8]. Ancient DNA studies indicate that modern Albanians derive a significant portion of their ancestry from ancient Western Balkan populations, with later admixture events contributing to present-day allele frequency distributions [9]
Genetic distance measures, such as F_ST or Nei’s standard genetic distance, provide quantitative estimates of divergence and allow for the placement of Albanian populations within a broader European and Mediterranean genetic context [10,11]. Previous studies have shown both regional specificity and apparent affinities with other Southeastern European populations [12,13], raising questions about the relative contributions of ancient Balkan substrates and subsequent demographic events.
In this study, we evaluated the genetic relationships among three geographically defined regions of Albania – Northern, Central and Southern Albania, to assess the extent of internal population structure. Allele frequency data were analyzed using R statistics to estimate genetic distances between the Albanian population and selected European populations.
2. Materials and Methods
2.1. DNA Extraction, STR Typing and Fragment Analysis
Genomic DNA was isolated from saliva swabs using QIAamp DNA Investigator Kit. Manual extraction of 1000 samples and robotic extraction of other 1000 samples with QiaCUBE were performed. Both methods were performed according to the manual of the QIAamp DNA Investigator Kit for saliva samples. The commercial STR kit for genotyping used for this study is NGM SelectTM kit (Thermo Fisher) a five dyes kit which simultaneously amplifies 16 separate STRs: D3S1358, VWA, D16S539, D2S1338, D8S1179, D21S11, D18S51, D19S433, THO1, FGA, D10S1248, D22S1045, D2S441, D1S1656, D12S391 and SE33 and the sex determining marker Amelogenin. PCR reactions using mix and primers according to following changes-reaction volumes were halved and the final volume of PCR product is 12.5 µl. Reference samples were amplified with NGM SelectTM kit (Thermo Fisher) in VeritiTM96-Well Thermal Cycler according to manufacturer’s instructions. For electrophoresis, 1 µl of the PCR product was combined with 8,7 µl of formamide and 0,3 µl of Liz 600 . Fragment separation was performed using ABI PRISM® 3500 Genetic Analyzer (Applied Biosystems) using POP-4 polymer and the collection software Data Collection, version 2.0. Data was sized using GeneMapperTM ID-X Software version 1.5.
2.2. Data Distribution and Analysis
Allele frequencies were calculated by data obtained from DNA analysis of 2000 unrelated individuals representing 12 counties which are the top administrative divisions of Albania. These counties with the main cities representing them and the number of samples per each are presented in Figure 1.
Tirana is the capital and the largest city of Albania, is the country’s most densely populated urban center and in this study is represented with of 645 samples, followed by Durrës with 206 samples; Fier - 202 samples; Elbasan - 188 samples; Korçë - 143 samples; Shkodër - 140 samples, Vlorë - 132 samples, Berat and Lezhë respectively with 85 samples; Dibër - 80 samples; Kukës -53 samples and Gjirokastër with 41 samples.
For the purposes of this study, the 12 administrative counties of Albania were grouped into three geographically defined, non-administrative regions: Northern, Central, and Southern Albania.
Population structure was evaluated by Principal Component Analysis (PCA), pairwise Weir-Cockerham F_ST estimates, Nei’s standard genetic distance, and phylogenetic reconstruction, using R statistics program To investigate the genetic relationships of the Albanian population within a broader European context, comparative analyses were performed using available published allele frequency data from Greece, Montenegro, Bosnia and Herzegovina, Italy, France, Germany, Hungary, Slovenia, and Slovakia. Reference allele frequencies were obtained from the STRidER database [15] . Comparative population data were included only when allele frequencies for the identical set of 16 autosomal STR loci were available, thereby ensuring methodological consistency and reliable estimation of genetic relationships. The Pairwise genetic relationships were evaluated by calculating Nei’s standard genetic distances using the R statistical software.
3. Results
3.1. Distribution of Data for Three Main Regions
The geographic distributions of the 2,000 Albanian individuals included in this study are illustrated in Figure 2 (and b). Principal Component Analysis (PCA) based on autosomal STR markers showed in Figure 2 a, indicates a largely homogeneous genetic structure within the Albanian population. Most individuals cluster tightly around the center of distribution, indicating limited genetic differentiation and a high degree of common ancestry. The first principal component (PC1), accounting for 0.8% of the total variance, and the second principal component (PC2), explaining 0.77% of the variance, do not reveal any discernible subpopulation stratification. The compact clustering pattern supports the conclusion that the sampled population is genetically cohesive when assessed using autosomal STR markers, with minimal internal structure. The organization in three non-administrative regions as North Albania includes Shkodër, Kukës, Dibër and Lezhë with 358 samples in total; Central Albania includes Tirana, Durrës and Elbasan with 1039 in total and South Albania including Vlora, Berat, Fier, Gjirokastër and Korçë with 603 samples in total is showed in Figure 2 b. Individuals from all three regions overlap largely within a single, dense cluster, indicating the absence of a clear genetic substructure and suggesting extensive gene flow throughout the country. The first principal component (PC1), explaining 0.8% of the total variance, and the second principal component (PC2), accounting for 0.77% of the variance, do not distinguish between regional groups, further supporting the lack of population stratification. In both PCA plots only a small number of outliers are observed, these are scattered across regions and do not form distinct clusters, possibly reflecting individual-level variation rather than systematic regional differentiation. These results indicates that there is no strong genetic separation between the regions and the differences are very small and not significant.
3.1.1. Evidence of Minimal Regional Genetic Differentiation in the Albanian Population
Nei’s genetic distance calculated by comparing the allele frequencies of three regions is shown in Figure 3 and bootstrap distributions of Weir-Cockerham F_ST in Figure 4.
The matrix demonstrates very low overall differentiation among regions, with the closest relationship observed between the Center and South regions. The North region shows slightly higher distances relative to the other two groups, although all values remain low. Bootstrap distributions of pairwise Weir–Cockerham F_ST estimates among the Albanian regional groups (Center vs North, Center vs South, and North vs South) indicate extremely low levels of population differentiation. In all comparisons, the median F_ST values are positioned close to zero, and the 95% confidence intervals broadly overlap zero, suggesting negligible genetic structure among regions. The density curves are narrow and centered around low positive values, consistent with only minor allele frequency differences across regional groups. Among the three comparisons, the North vs South contrast shows a slightly right-shifted distribution relative to the other pairs, indicating marginally higher differentiation; however, the effect remains very small and biologically limited. These findings support substantial genetic continuity and extensive shared ancestry across Albania, with no evidence of meaningful regional subdivision based on autosomal STR markers.
3.2. Patterns of Genetic Affinity Across European Populations
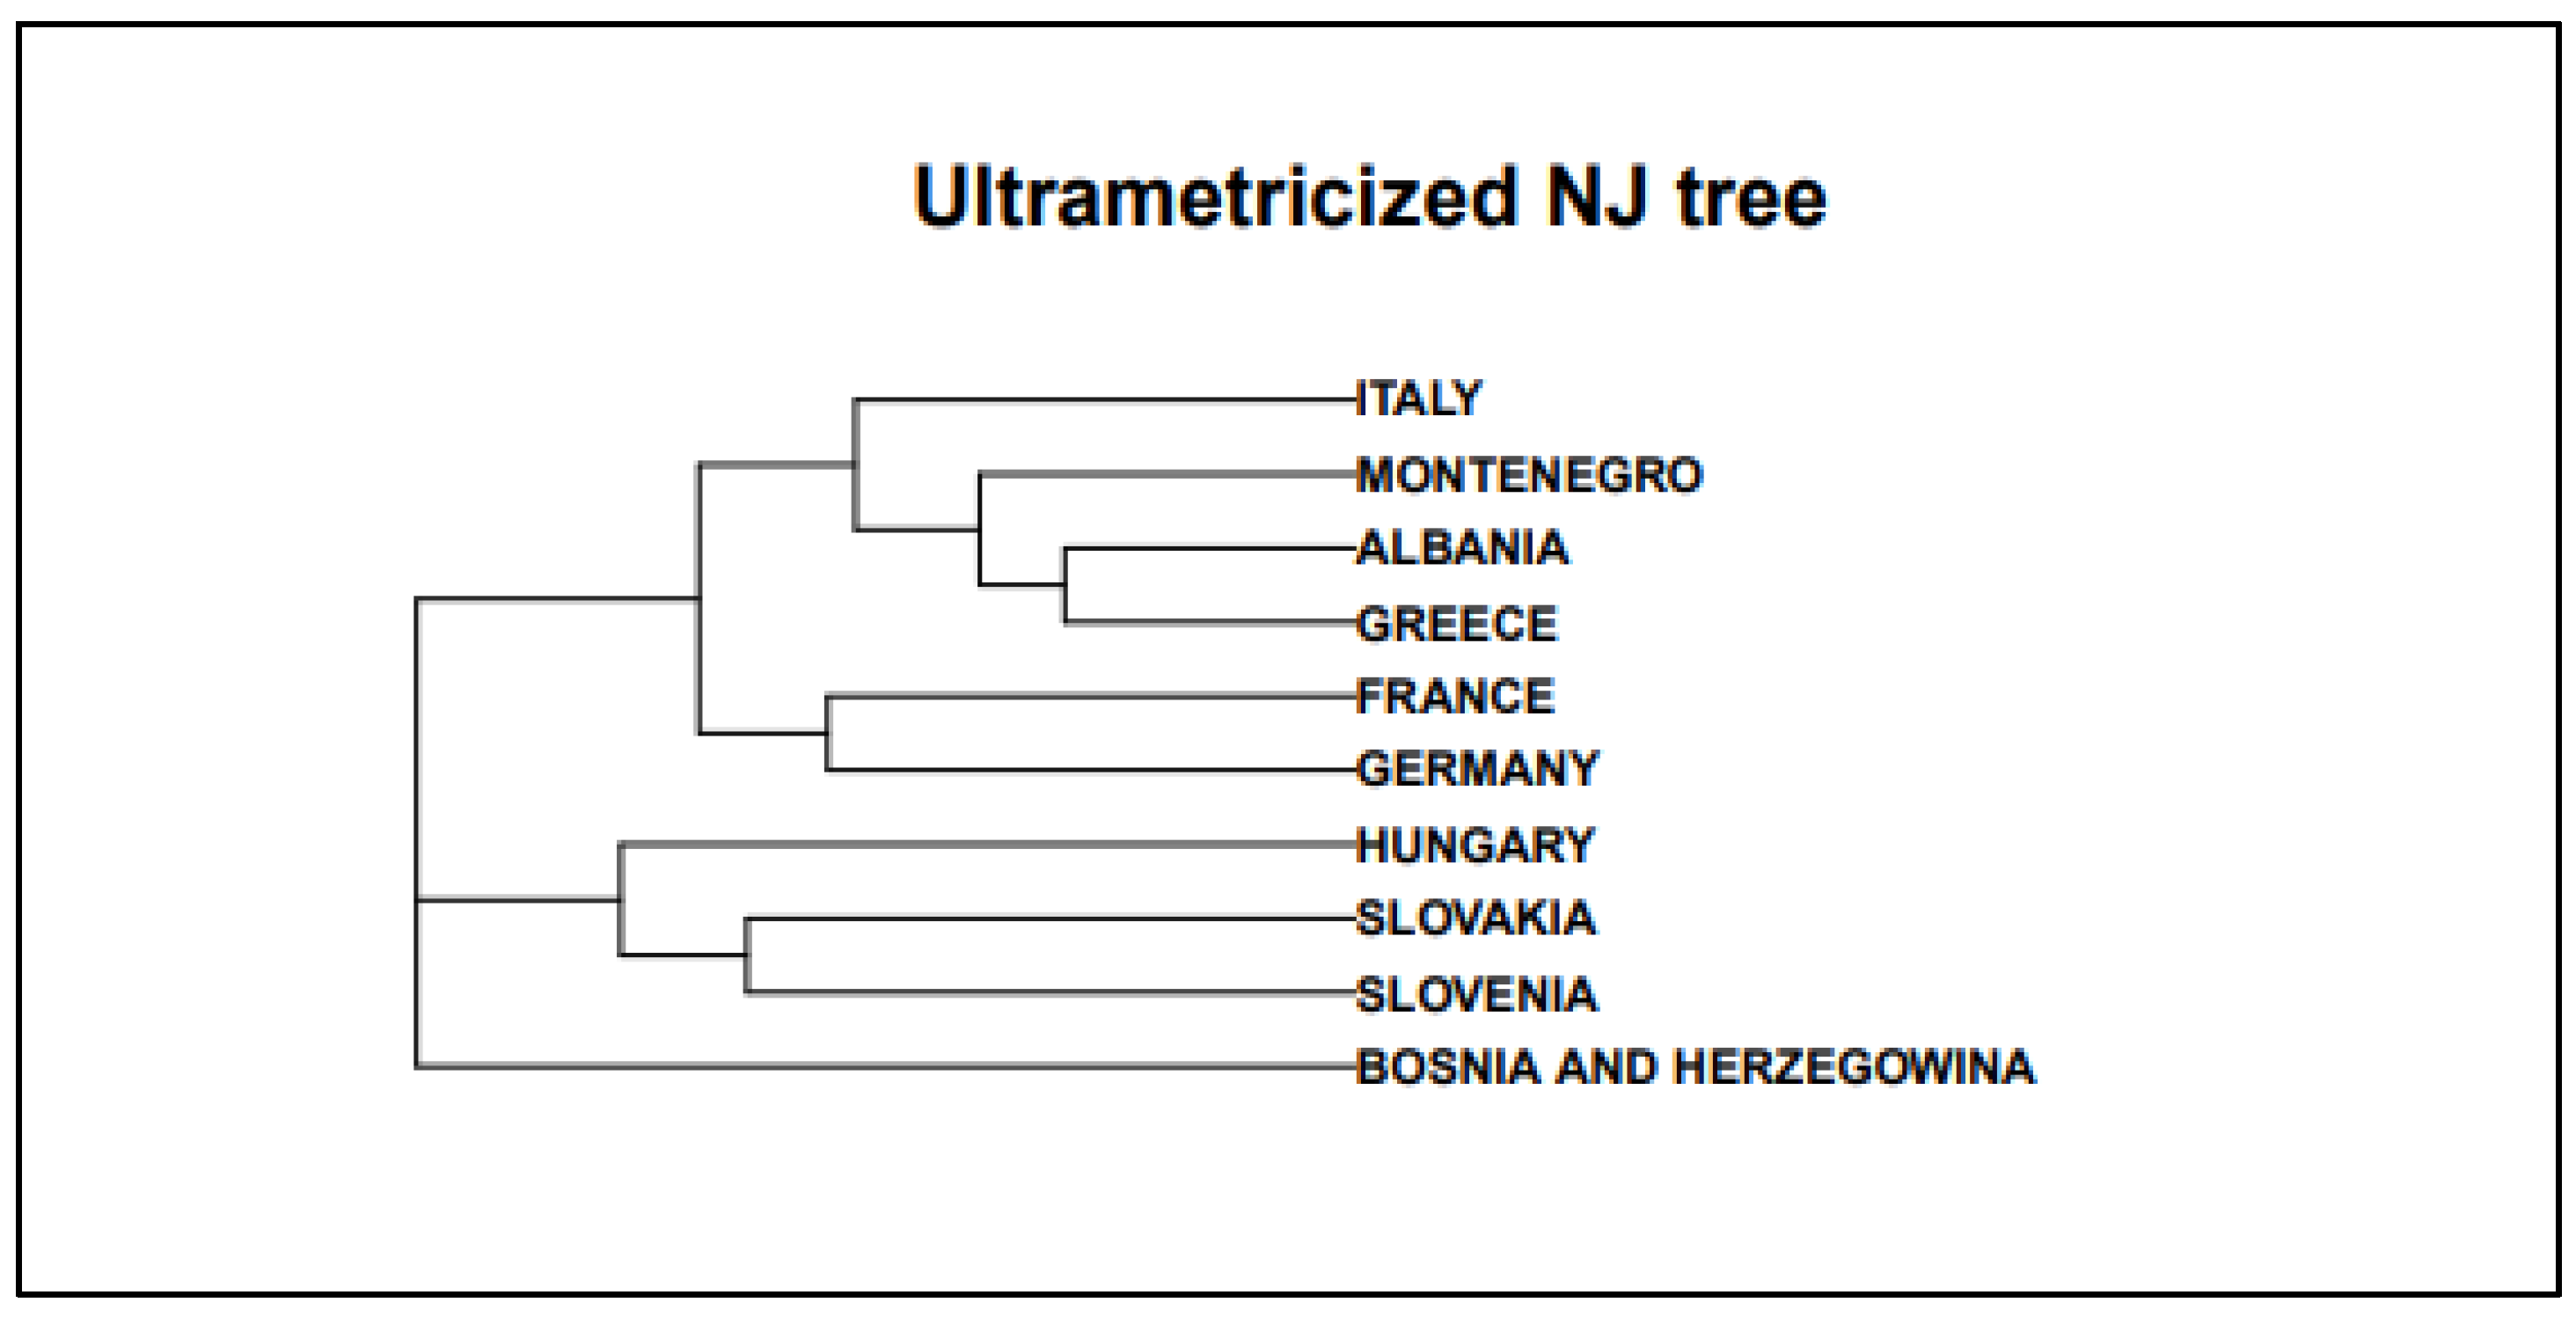
Multidimensional scaling (MDS) among Greece, Montenegro, Bosnia and Herzegovina, Italy, France, Germany, Hungary, Slovenia and Slovakia are presented in Figure 5 and the Nei’s distance in Figure 6.
The multidimensional scaling (MDS) analysis based on pairwise genetic distances revealed a clear geographic organization of the studied European populations (Figure 5). The first two dimensions accounted for 55.7% of the total variation (MDS1 = 34.7%, MDS2 = 21.0%). The Albanian population clustered within the southeastern European genetic landscape, showing the closest affinities with Greece and Montenegro, while Italy occupied an intermediate position. Meanwhile, France, Germany, Hungary, Slovenia, and Slovakia formed a distinct Central/Western European cluster. Bosnia and Herzegovina was differentiated primarily along the second dimension, suggesting subtle genetic distinctiveness within the Balkan region. The MDS configuration supports a high degree of genetic continuity between Albania and neighboring southeastern European populations, consistent with shared demographic history and extensive historical gene flow.
The ultrametric neighbor-joining (NJ) tree reveals a clear geographical structuring among the analyzed populations. A well-defined cluster is observed that includes Italy, Montenegro, Albania, and Greece, indicating a high degree of genetic similarity within the Mediterranean and Balkan regions. Within this cluster, Italy and Montenegro appear as the most closely related pair, with Albania joining next, followed by Greece, suggesting a gradient of relatedness consistent with regional proximity and historical gene flow. France and Germany branch sequentially from this cluster, reflecting increasing divergence towards Western and Central Europe. A second large cluster includes Hungary, Slovakia, Slovenia, and Bosnia - Herzegovina, with Slovenia and Bosnia and Herzegovina forming the closest subgroup, followed by Slovakia and then Hungary. The overall topology suggests a primary split between Southern/Western European and Central/Eastern European populations, highlighting the influence of geographical and historical factors on population structure. The ultrametric nature of the tree indicates relatively uniform rates of divergence across lineages, consistent with a molecular clock assumption.
4. Discussion
To evaluate potential genetic structure among Albanian regional populations (North, Center, and South), we performed both Principal Component Analysis (PCA) and pairwise F_ST analyses with bootstrap confidence intervals. Principal Component Analysis (PCA) for Albanian population was performed using R statistics program. PCA is a widely used multivariate method in population genetics for reducing high-dimensional genotype data to a few uncorrelated axes (principal components), enabling visualization of population structure, relatedness, and historical demography [16].
The PCA revealed a strong overlap among individuals from all three regions. No distinct clustering patterns were observed, and individuals from North, Center, and South formed a single, largely homogeneous cluster. Importantly, the first two principal components explained very small proportions of total genetic variation (PC1 = 0.8%, PC2 = 0.77%), indicating minimal population substructure. The absence of clear separation suggests high genetic similarity across regions. Similar patterns of genetic homogeneity within geographically compact European populations have been reported in genome-wide and STR-based studies, where PCA often reveals clustering primarily at broader continental or inter-population scales rather than within small national territories [16,17].
These findings were further supported by the pairwise Weir–Cockerham F_ST estimates. All regional comparisons (Center vs North, Center vs South, and North vs South) yielded F_ST values extremely close to zero. The bootstrap distributions were tightly centered around zero, and the 95% confidence intervals overlapped zero in all cases. This indicates that genetic differentiation between regions is negligible and not statistically meaningful. Very low F_ST values have likewise been observed among Balkan populations and within-country subgroups, reflecting extensive historical gene flow and shared demographic history [13,18]. The concordance between PCA (a multivariate clustering approach) and F_ST (a population differentiation metric) strengthens the conclusion that the Albanian population exhibits a high degree of genetic homogeneity across regional divisions. Previous studies focusing specifically on Albanian and neighboring Balkan populations have also demonstrated close genetic affinities and limited internal substructure, consistent with long-term regional continuity and admixture [12,19].
Several factors may explain this pattern. Albania is geographically compact, and historical gene flow, internal migration, and shared demographic history likely contributed to maintaining genetic continuity across regions. Even when cultural, dialectal, or historical distinctions exist, these do not necessarily correspond to measurable genetic differentiation, a pattern commonly observed in European populations [16] Pairwise genetic differentiation among the analyzed European populations was assessed using Nei’s genetic distance [20], and the resulting matrix was visualized both through multidimensional scaling (MDS) and a heatmap representation. The genetic distances varies approximately from 0.004 to 0.014, indicating low levels of differentiation typical of intra-European STR datasets.
The close spatial proximity of Albania and Greece in the MDS configuration indicates strong genetic affinity, a finding corroborated by their low pairwise Nei distances in the heatmap. These findings are consistent with previous studies demonstrating substantial genetic continuity within the Balkan Peninsula based on autosomal STR and Y-chromosomal markers [21]. The heatmap further confirms this structure, showing darker (lower) distance values among geographically proximate populations and comparatively higher distances between Southeastern European populations and Western European groups. This pattern reflects a gradual increase in genetic differentiation with geographic distance and is consistent with the model of isolation by distance described for European populations [16] .
Italy’s intermediate placement in both the MDS plot and the distance matrix supports its role as a genetic bridge between Southeastern and Western/Central Europe. Such transitional positioning has been documented in previous Mediterranean-focused genetic studies, where Italy often exhibits affinities with both Balkan and Western European gene pools [5,21].
While clear clustering is observed, the magnitude of Nei distances remains low across all comparisons, underscoring the overall genetic homogeneity of European populations. The observed differentiation therefore reflects subtle regional structuring rather than deep population subdivision. This pattern aligns with genome-wide analyses demonstrating that European genetic diversity forms clinal gradients closely mirroring geography rather than discrete, sharply separated clusters [16,22].
Both the MDS visualization and the Nei distance heatmap consistently demonstrate that STR variation among the studied populations is primarily structured by geographic proximity. Southeastern European populations form a relatively cohesive cluster, differentiated but not strongly separated from Central and Western European groups. These findings are consistent with previous studies demonstrating that the genetic structure of European populations has been shaped by extensive historical migration, continuous gene flow, and long-term regional demographic continuity, resulting in genetic variation that closely follows geographic patterns [23,24].
5. Conclusions
Our findings demonstrate that the Albanian population is characterized by remarkable genetic homogeneity, with negligible population substructure across the northern, central, and southern regions of the country. The absence of significant regional differentiation, as supported by PCA and pairwise F_ST analyses, suggests extensive historical gene flow and long-term demographic continuity within Albania. Comparative analyses further place the Albanian population within the southeastern European genetic landscape, revealing the strongest affinities with neighboring populations, particularly Greece, Montenegro, and Italy, while maintaining the broader patterns of genetic variation observed across Europe. These results are consistent with the demographic history of the Balkan Peninsula, where repeated migrations, population interactions, and geographic proximity have contributed to a shared genetic background.
Beyond providing new insights into the population history of Albania, this study establishes one of the most comprehensive autosomal STR reference datasets currently available for the country. The findings have important implications for forensic genetics, population genetics, and human evolutionary studies by providing a robust reference framework for future comparative analyses and genomic investigations in the Western Balkans. The integration of high-resolution genomic markers and ancient DNA data in future studies will further refine our understanding of the evolutionary processes underlying the genetic landscape of Albania and southeastern Europe.
Supplementary Materials
The following supporting information can be downloaded at the website of this paper posted on Preprints.org.
Author Contributions
Conceptualization, M, X., D. D., and S. M.; methodology, M.X and E. Z.; software and formal analysis I.S.; validation, E. Z, D.D., and M. X.; investigation, M. X.; resources, E.Z.; data curation, writing—original draft preparation, M, X., E. Z.; writing—review and editing, M.X., D. D., E. Z., and S. M; visualization, E.Z; supervision, M, X. All authors have read and agreed to the published version of the manuscript.
Institutional Review Board Statement
The study was conducted in accordance with the Declaration of Helsinki. The samples used for this study were taken according to the law 108/2018 for Albanian State Police. The consent document from the Ethics Committee of the Institute of Scientific Police with Protocol Number 5582 date approval 2024. .
Informed Consent Statement
Informed consent was obtained from all subjects involved in the study.
Data Availability Statement
The data supporting the findings of this study are available within the article and its Supplementary Materials.
Conflicts of Interest
The authors declare no conflicts of interest.
References
- Cavalli-Sforza, L. L.; Menozzi, P.; Piazza, A. The History and Geography of Human Genes; Princeton University Press, 1994. [Google Scholar]
- Nei, M.; Kumar, S. Molecular Evolution and Phylogenetics; Oxford University Press, 2000. [Google Scholar]
- Wilkes, J. The Illyrians; Blackwell., 1995. [Google Scholar]
- Winn, S. M. M. The Prehistory of the Balkans; Thames & Hudson., 1992. [Google Scholar]
- Hofmanová, Z.; Kreutzer, S.; Hellenthal, G.; Sell, C.; Diekmann, Y.; Díez-del-Molino, D.; Van Dorp, L.; López, S.; Kousathanas, A.; Link, V.; et al. Early Farmers from across Europe Directly Descended from Neolithic Aegeans. Proc. Natl. Acad. Sci. U.S.A. 2016, 113, 6886–6891. [Google Scholar] [CrossRef] [PubMed]
- Sulcebe, G.; Sanchez-Mazas, A.; Tiercy, J.-M.; Shyti, E.; Mone, I.; Ylli, Z.; Kardhashi, V. HLA Allele and Haplotype Frequencies in the Albanian Population and Their Relationship with the Other European Populations. Int. J. Immunogenet 2009, 36, 337–343. [Google Scholar] [CrossRef] [PubMed]
- Xhetani, M.; Seferi, I. Distribution of Rhesus Blood Group Antigens and Weak D Alleles in the Population of Albania. Blood Transfus. 2014. [Google Scholar] [CrossRef] [PubMed]
- Kovacevic, L.; Tambets, K.; Ilumäe, A.-M.; Kushniarevich, A.; Yunusbayev, B.; Solnik, A.; Bego, T.; Primorac, D.; Skaro, V.; Leskovac, A.; et al. Standing at the Gateway to Europe - The Genetic Structure of Western Balkan Populations Based on Autosomal and Haploid Markers. PLoS ONE 2014, 9, e105090. [Google Scholar] [CrossRef] [PubMed]
- Davranoglou, L.-R.; Lauka, A.; Aristodemou, A.; Maróti, Z.; Bojaxhi, G.; Muhaj, A.; Mikerezi, I.; Wesolowski, D.; Joseph, B.D.; Heraclides, A. Ancient DNA Evidence for the History of the Albanians. Nat. Hum. Behav. 2026. [Google Scholar] [CrossRef] [PubMed]
- Reynolds, J.; Weir, B. S.; Cockerham, C. C. Estimation of the Coancestry Coefficient: Basis for a Short-Term Genetic Distance. Genetics 1983, 105(3), 767–779. [Google Scholar] [CrossRef] [PubMed]
- Masatoshi Nei, Sudhir Kumar Molecular Evolution and Phylogenetics.
- Battaglia, V.; Fornarino, S.; Al-Zahery, N.; Olivieri, A.; Pala, M.; Myres, N.M.; King, R.J.; Rootsi, S.; Marjanovic, D.; Primorac, D.; et al. Y-Chromosomal Evidence of the Cultural Diffusion of Agriculture in Southeast Europe. Eur. J. Hum. Genet 2009, 17, 820–830. [Google Scholar] [CrossRef] [PubMed]
- Bosch, E.; Calafell, F.; González-Neira, A.; Flaiz, C.; Mateu, E.; Scheil, H.-G.; Huckenbeck, W.; Efremovska, L.; Mikerezi, I.; Xirotiris, N.; et al. Paternal and Maternal Lineages in the Balkans Show a Homogeneous Landscape over Linguistic Barriers, except for the Isolated Aromuns. Ann. Hum. Genet 2006, 70, 459–487. [Google Scholar] [CrossRef] [PubMed]
- Regional Statistical Yearbook. 2021.
- STRidER Database.
- Novembre, J.; Johnson, T.; Bryc, K.; Kutalik, Z.; Boyko, A.R.; Auton, A.; Indap, A.; King, K.S.; Bergmann, S.; Nelson, M.R.; et al. Genes Mirror Geography within Europe. Nature 2008, 456, 98–101. [Google Scholar] [CrossRef] [PubMed]
- Lao, O.; Lu, T.T.; Nothnagel, M.; Junge, O.; Freitag-Wolf, S.; Caliebe, A.; Balascakova, M.; Bertranpetit, J.; Bindoff, L.A.; Comas, D.; et al. Correlation between Genetic and Geographic Structure in Europe. Curr. Biol. 2008, 18, 1241–1248. [Google Scholar] [CrossRef] [PubMed]
- Peričić, M.; Lauc, L.B.; Klarić, I.M.; Rootsi, S.; Janićijević, B.; Rudan, I.; Terzić, R.; Čolak, I.; Kvesić, A.; Popović, D.; et al. High-Resolution Phylogenetic Analysis of Southeastern Europe Traces Major Episodes of Paternal Gene Flow Among Slavic Populations. Mol. Biol. Evol. 2005, 22, 1964–1975. [Google Scholar] [CrossRef] [PubMed]
- Kushniarevich, A.; Utevska, O.; Chuhryaeva, M.; Agdzhoyan, A.; Dibirova, K.; Uktveryte, I.; Möls, M.; Mulahasanovic, L.; Pshenichnov, A.; Frolova, S.; et al. Genetic Heritage of the Balto-Slavic Speaking Populations: A Synthesis of Autosomal, Mitochondrial and Y-Chromosomal Data. PLoS ONE 2015, 10, e0135820. [Google Scholar] [CrossRef] [PubMed]
- Nei, M. Genetic Distance between Populations. Am. Nat. 1972, 106, 283–292. [Google Scholar] [CrossRef] [PubMed]
- Capelli, C.; Redhead, N.; Romano, V.; Calì, F.; Lefranc, G.; Delague, V.; Megarbane, A.; Felice, A.E.; Pascali, V.L.; Neophytou, P.I.; et al. Population Structure in the Mediterranean Basin: A Y Chromosome Perspective. Ann. Hum. Genet 2006, 70, 207–225. [Google Scholar] [CrossRef] [PubMed]
- Serre, D.; Pääbo, S. Evidence for Gradients of Human Genetic Diversity Within and Among Continents. Genome Res. 2004, 14, 1679–1685. [Google Scholar] [CrossRef] [PubMed]
- Hellenthal, G.; Busby, G.B.J.; Band, G.; Wilson, J.F.; Capelli, C.; Falush, D.; Myers, S. A Genetic Atlas of Human Admixture History. Science 2014, 343, 747–751. [Google Scholar] [CrossRef] [PubMed]
- Ralph, P.; Coop, G. The Geography of Recent Genetic Ancestry across Europe. PLoS Biol. 2013, 11, e1001555. [Google Scholar] [CrossRef] [PubMed]
Figure 1.
Administrative top divisions with the main cities and number of samples analyzed per each based on the number of inhabitants per counties – data published from INSTAT year 2021[14].
Figure 1.
Administrative top divisions with the main cities and number of samples analyzed per each based on the number of inhabitants per counties – data published from INSTAT year 2021[14].
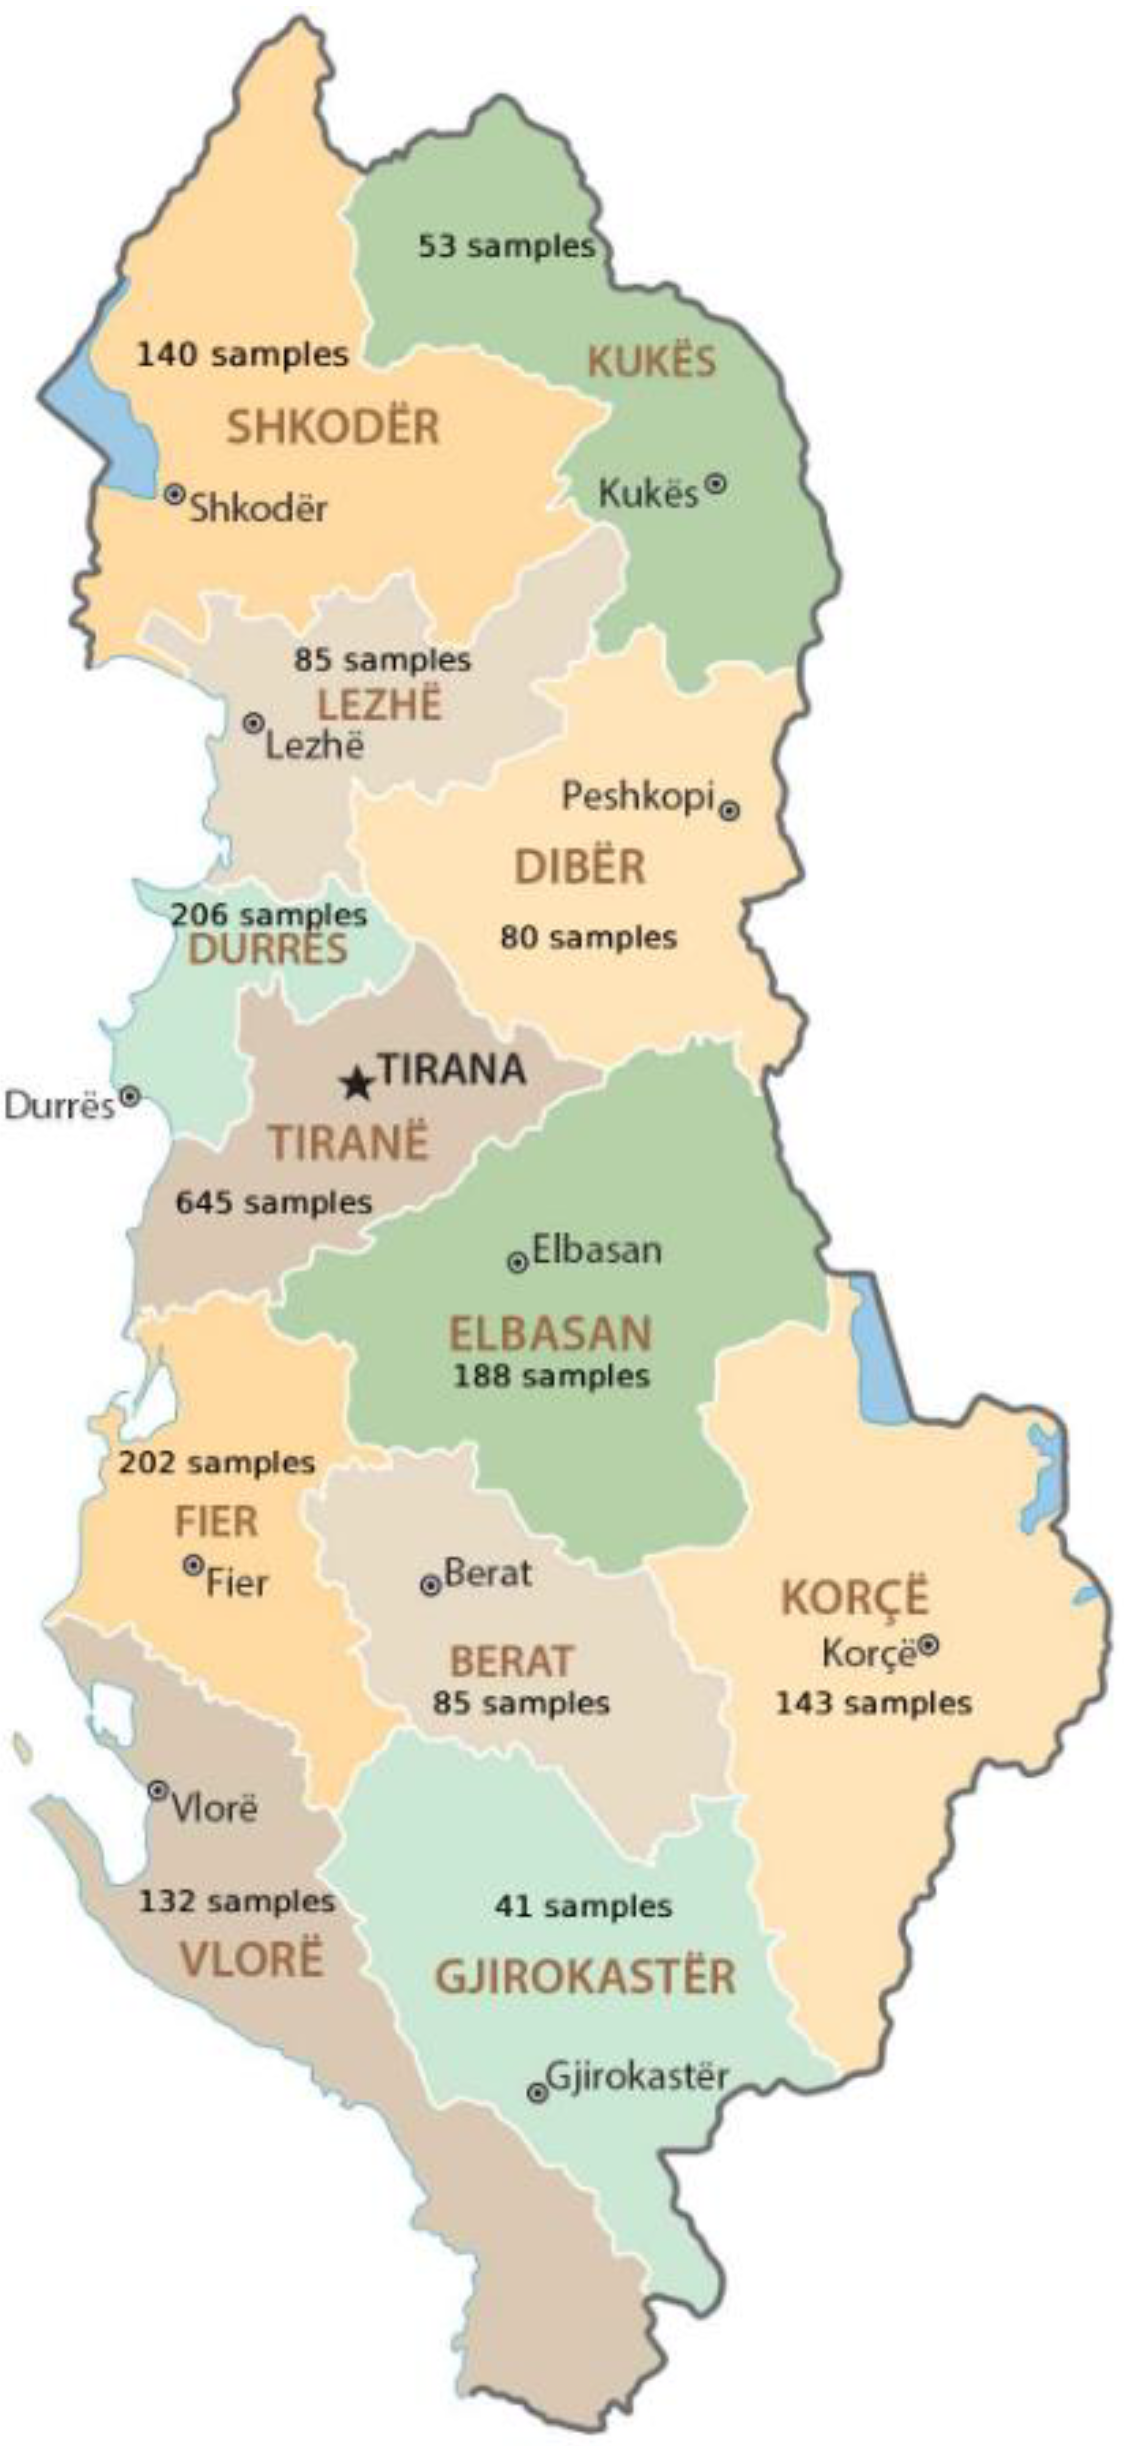
Figure 2.
a) Principal Component Analysis (PCA) plot of the Albanian population based on autosomal STR markers. Each dot represents an individual genotype. b) Principal Component Analysis (PCA) of the Albanian population, stratified by geographic region (Center, North and South). Each dot represents an individual, colored according to regional origin.
Figure 2.
a) Principal Component Analysis (PCA) plot of the Albanian population based on autosomal STR markers. Each dot represents an individual genotype. b) Principal Component Analysis (PCA) of the Albanian population, stratified by geographic region (Center, North and South). Each dot represents an individual, colored according to regional origin.
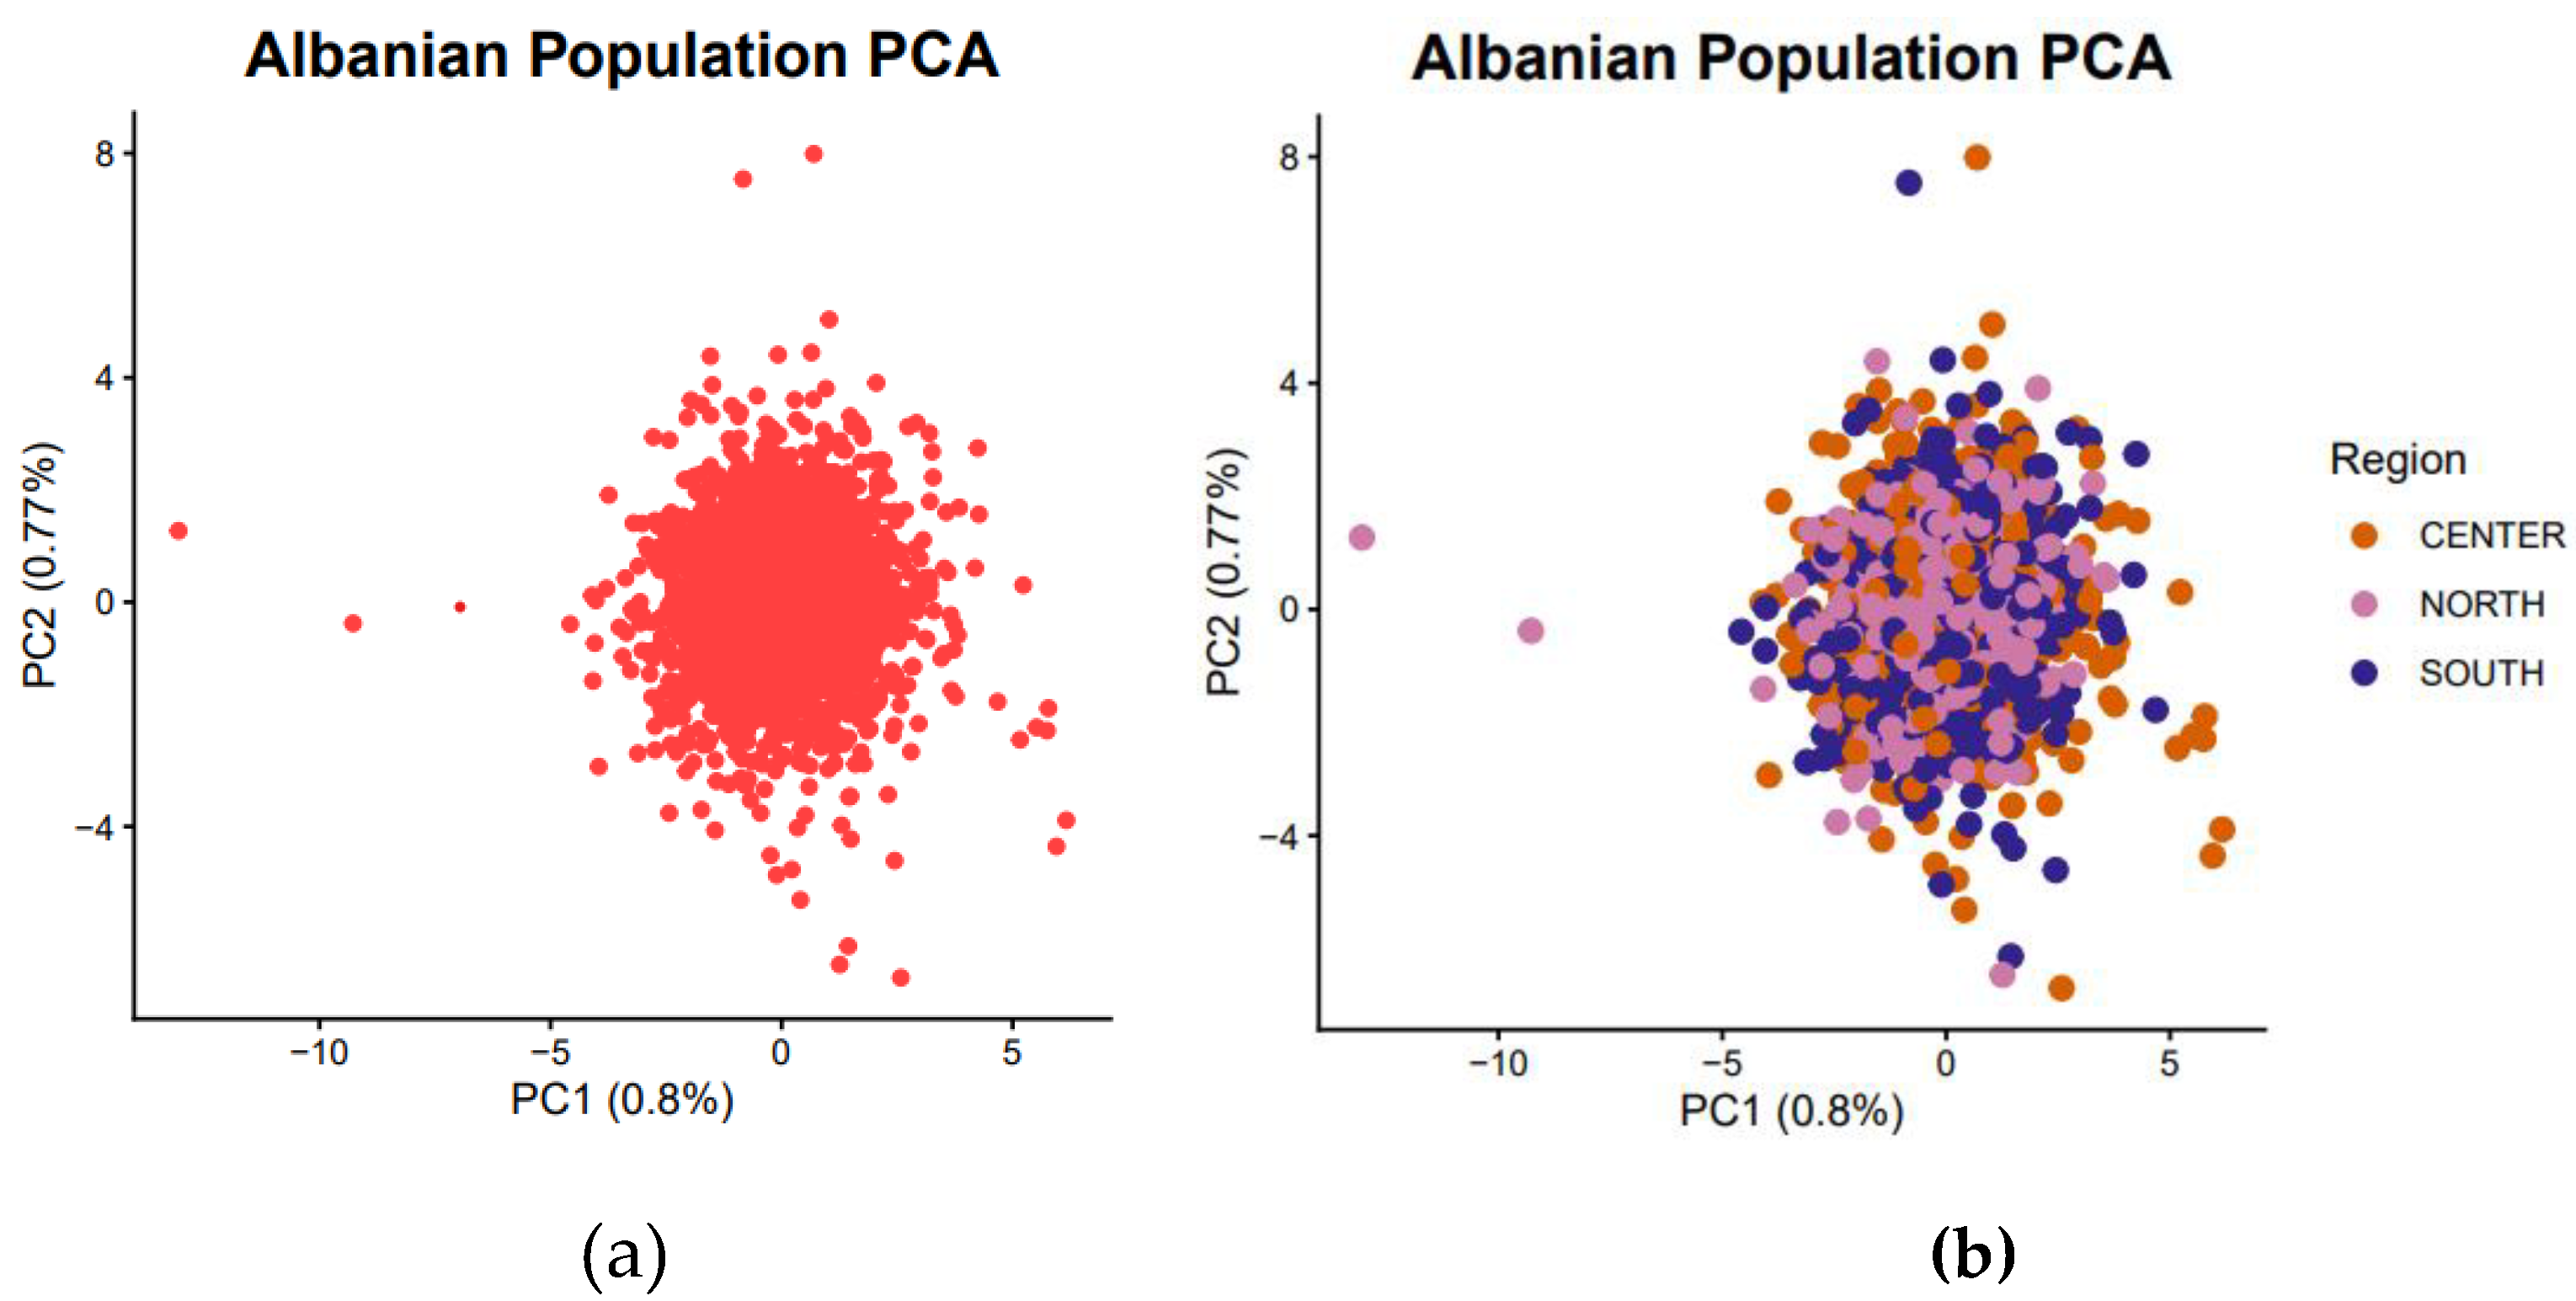
Figure 3.
Heatmap of pairwise Nei’s genetic distances among Albanian geographic regions (Center, South, and North) based on autosomal STR markers. Darker shades indicate lower genetic distances and greater similarity, whereas lighter shades represent higher distances and increased differentiation.
Figure 3.
Heatmap of pairwise Nei’s genetic distances among Albanian geographic regions (Center, South, and North) based on autosomal STR markers. Darker shades indicate lower genetic distances and greater similarity, whereas lighter shades represent higher distances and increased differentiation.
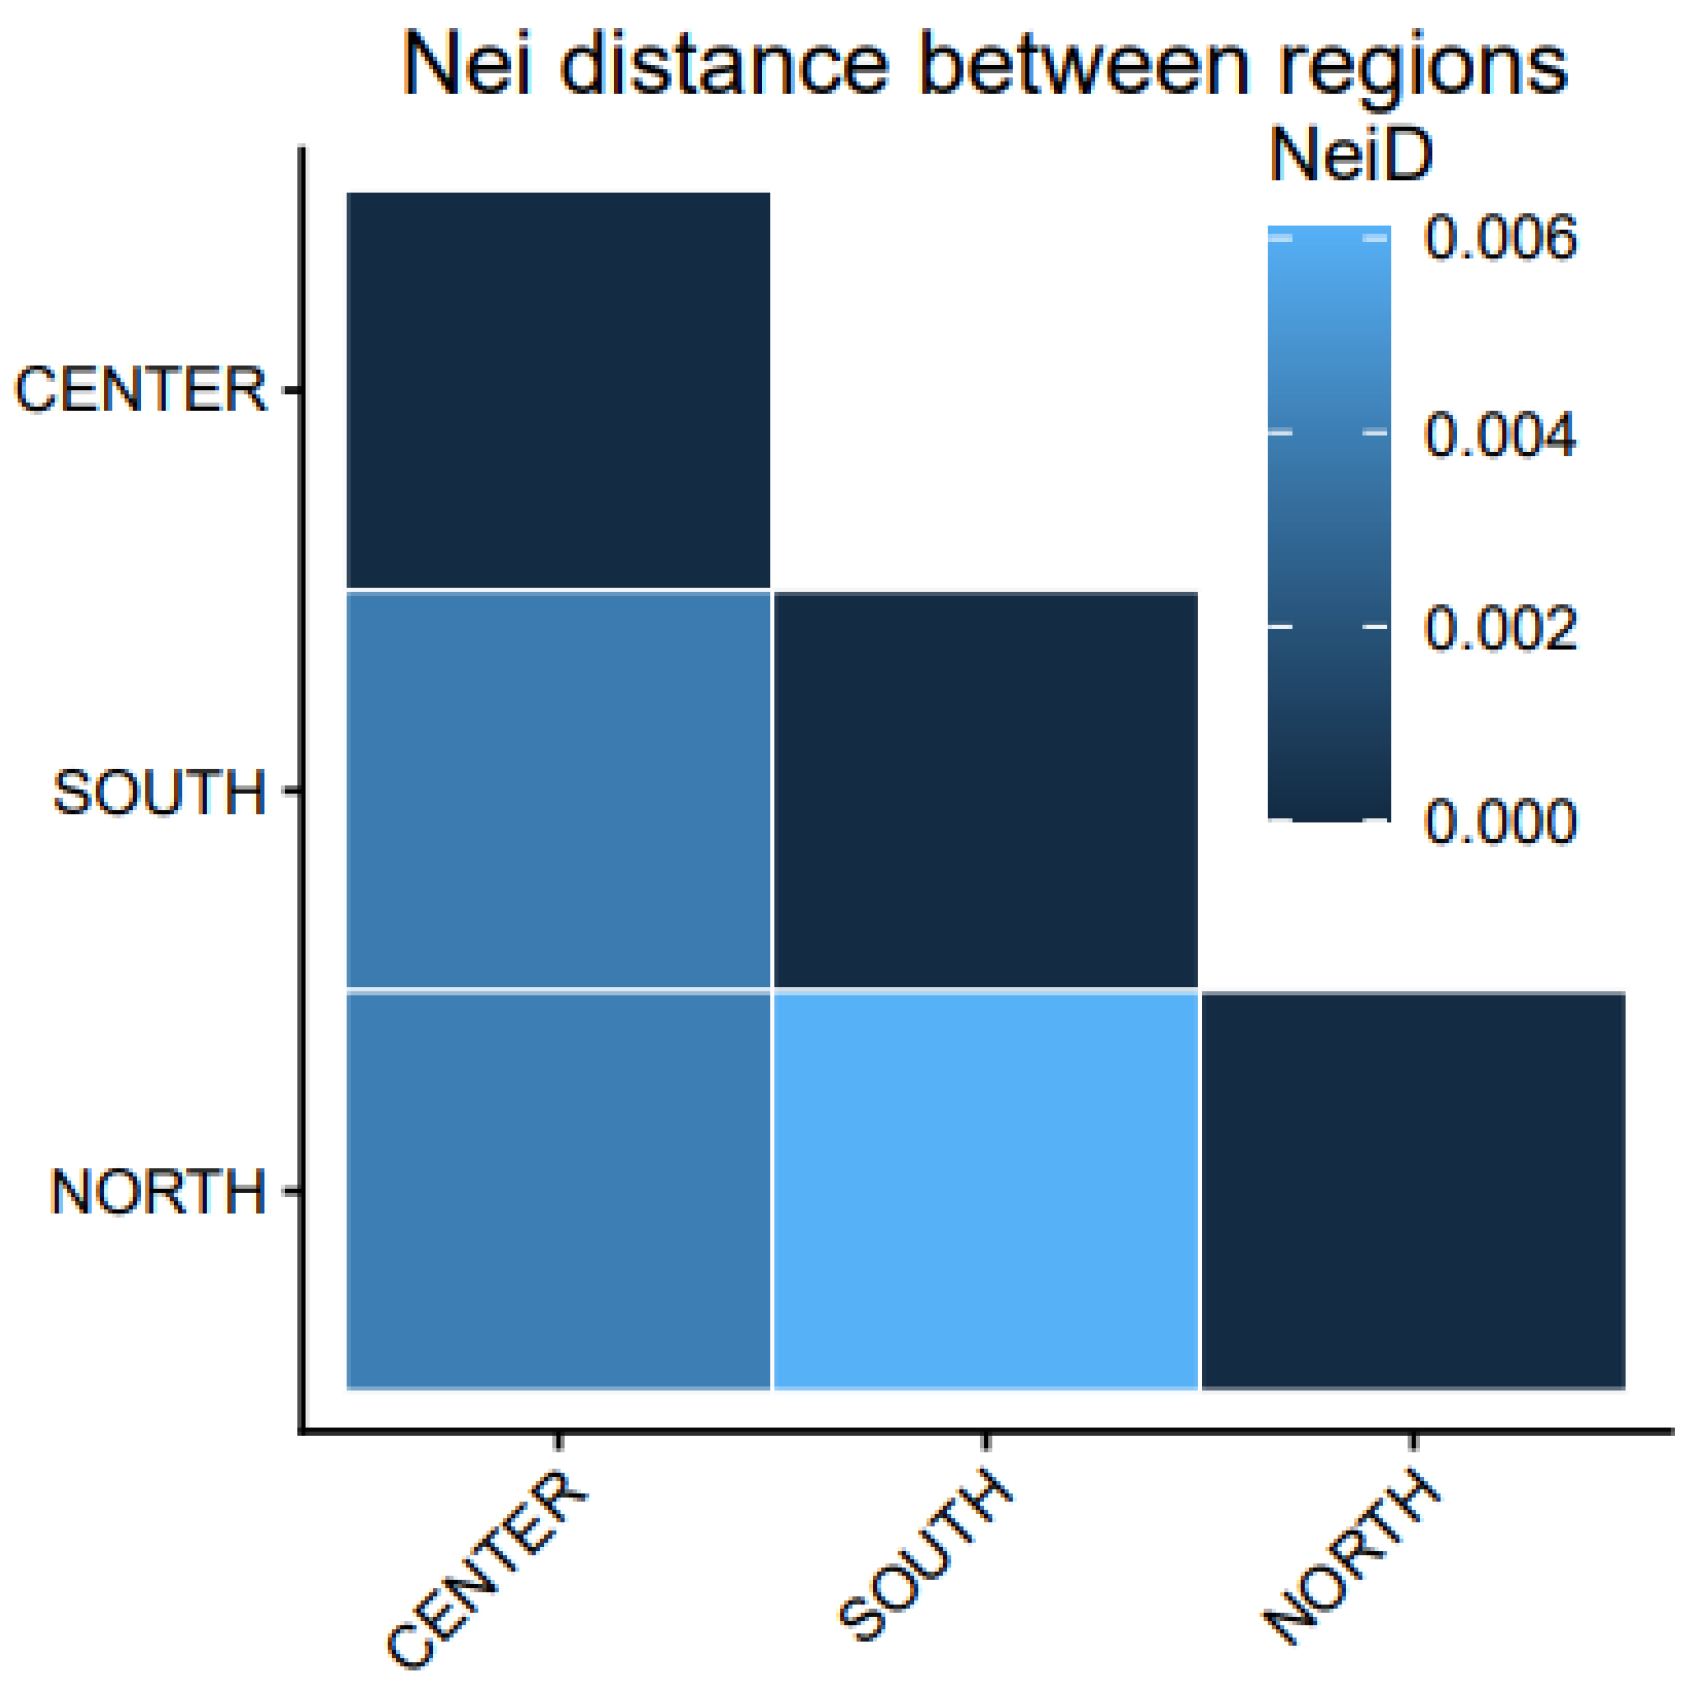
Figure 4.
Bootstrap distributions of pairwise Weir–Cockerham F_ST estimates among Albanian geographic regions based on autosomal STR markers. Comparisons shown are Center vs North, Center vs South, and North vs South. Red curves represent the bootstrap density distributions of F_ST values. Black horizontal segments indicate the 95% confidence intervals, and black dots denote the median F_ST estimate for each comparison.
Figure 4.
Bootstrap distributions of pairwise Weir–Cockerham F_ST estimates among Albanian geographic regions based on autosomal STR markers. Comparisons shown are Center vs North, Center vs South, and North vs South. Red curves represent the bootstrap density distributions of F_ST values. Black horizontal segments indicate the 95% confidence intervals, and black dots denote the median F_ST estimate for each comparison.
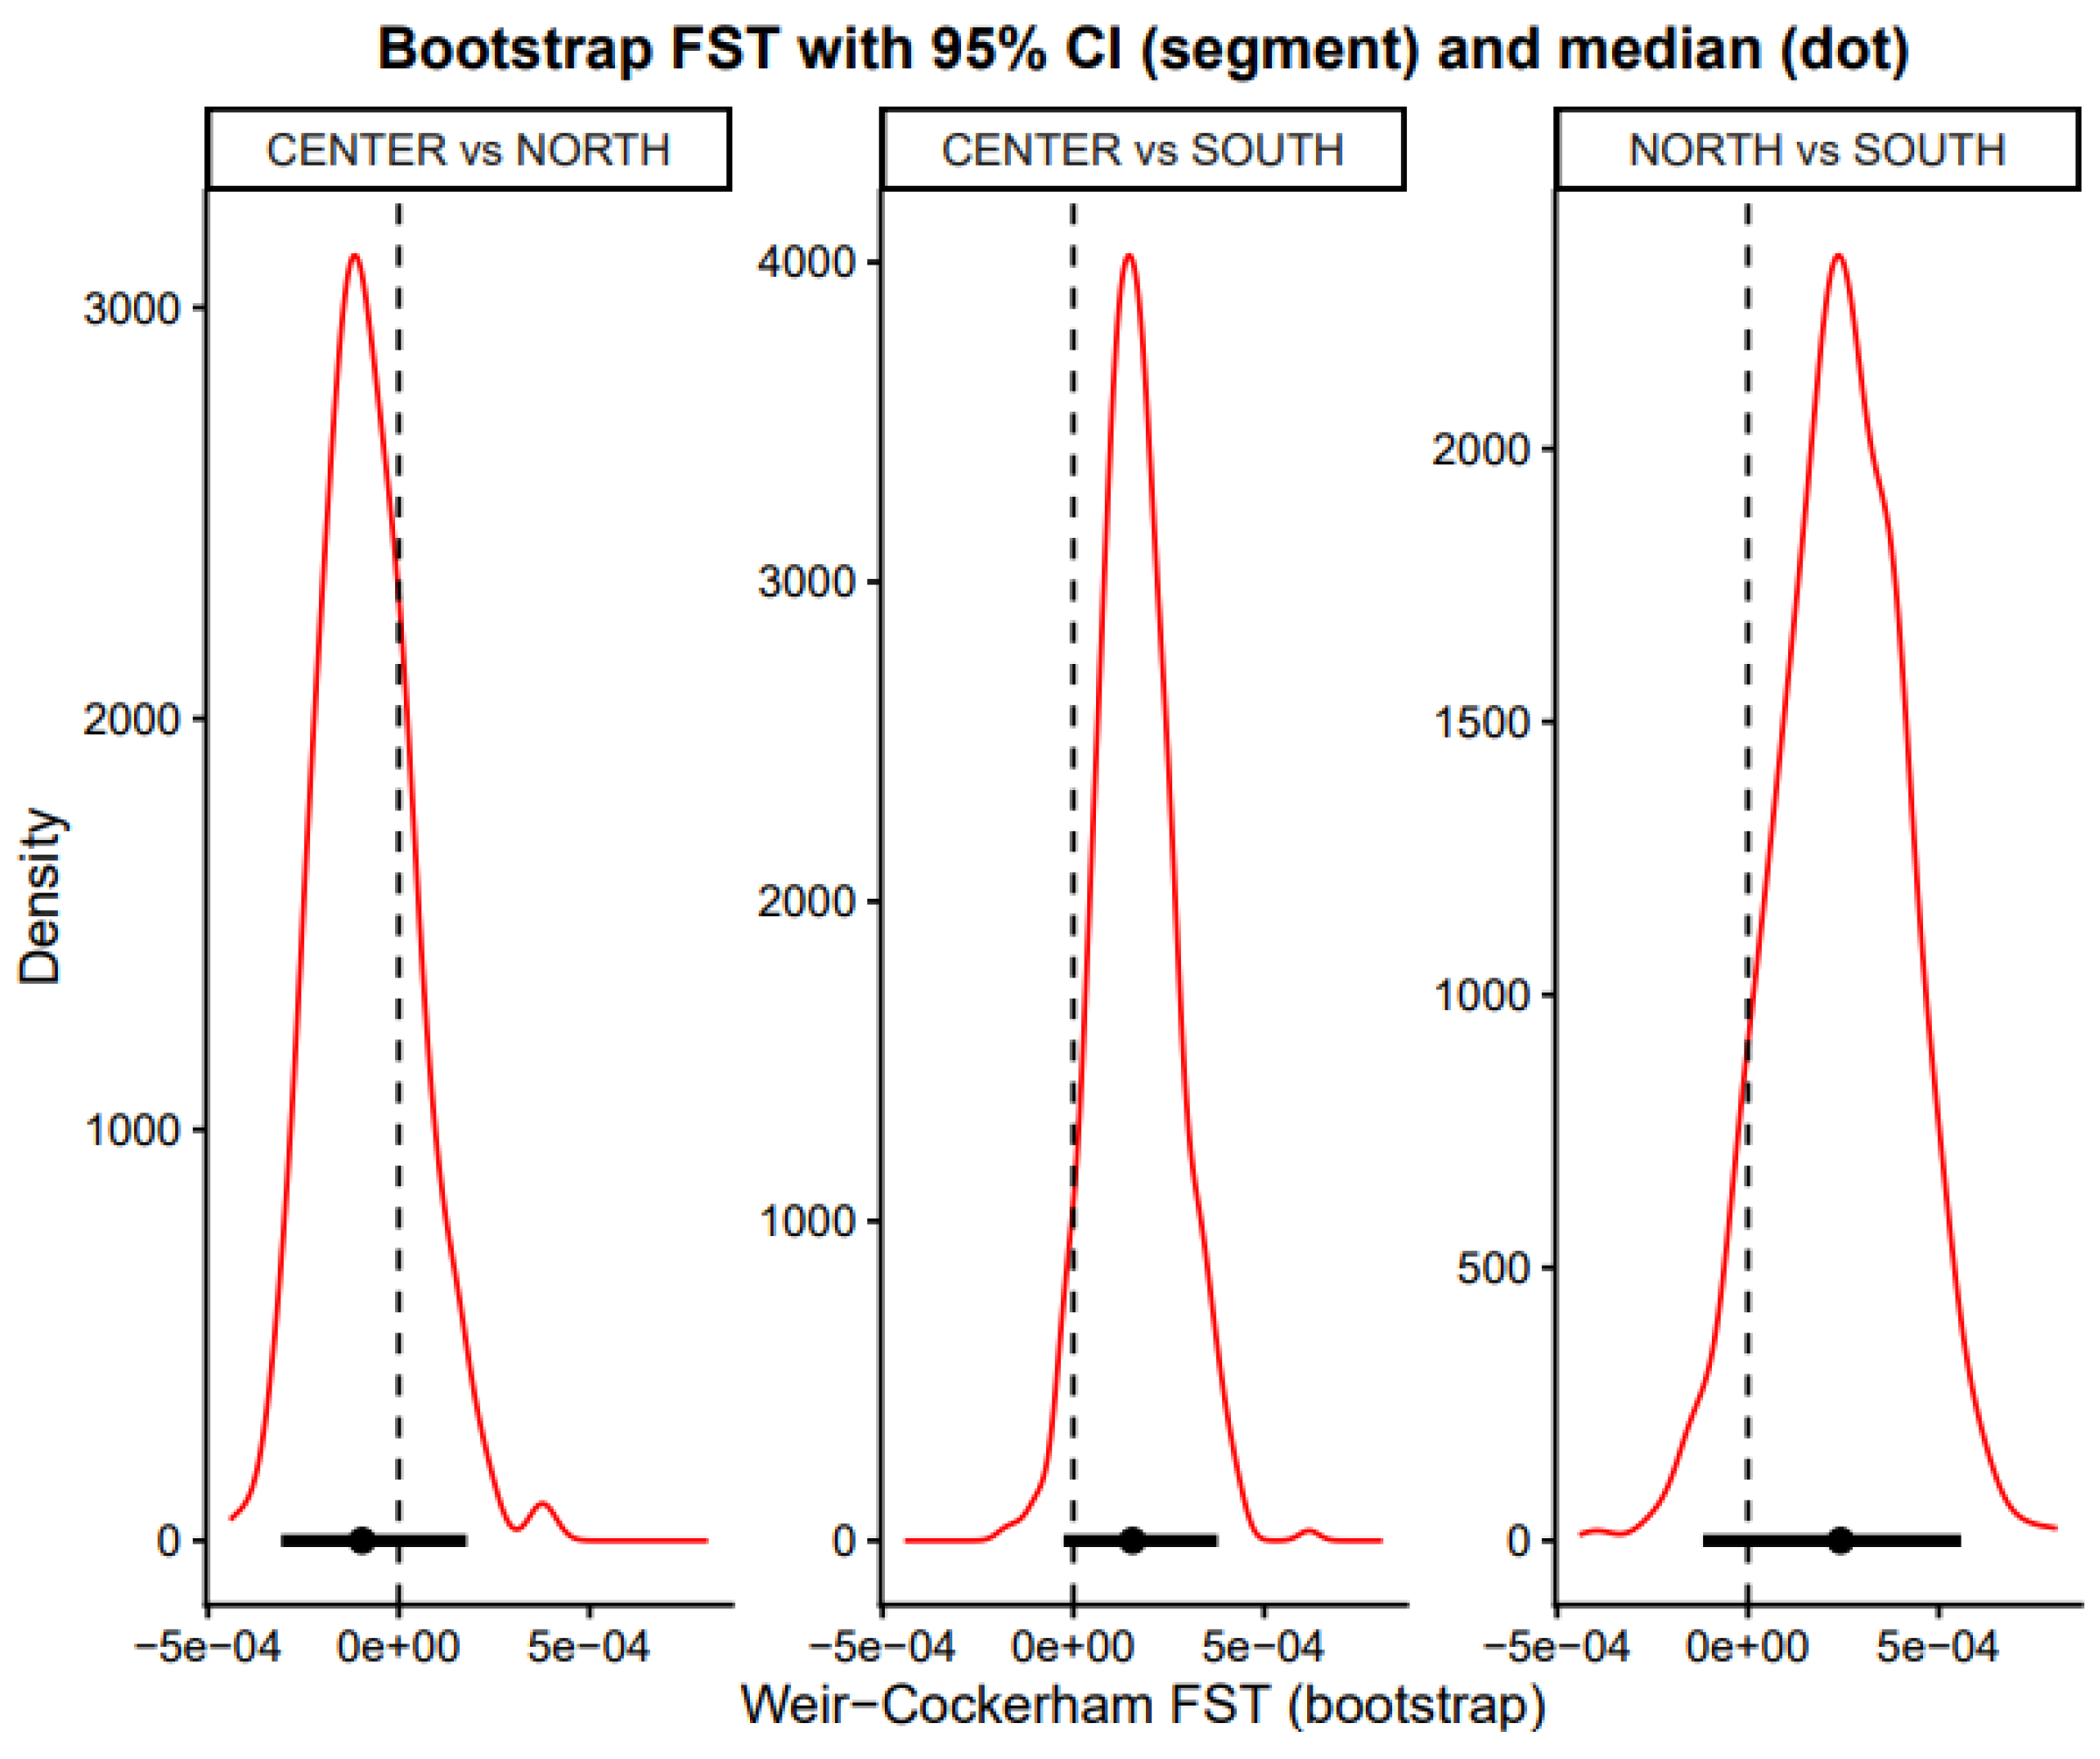
Figure 5.
The multidimensional scaling (MDS) analysis based on pairwise genetic distances among studied European populations.
Figure 5.
The multidimensional scaling (MDS) analysis based on pairwise genetic distances among studied European populations.
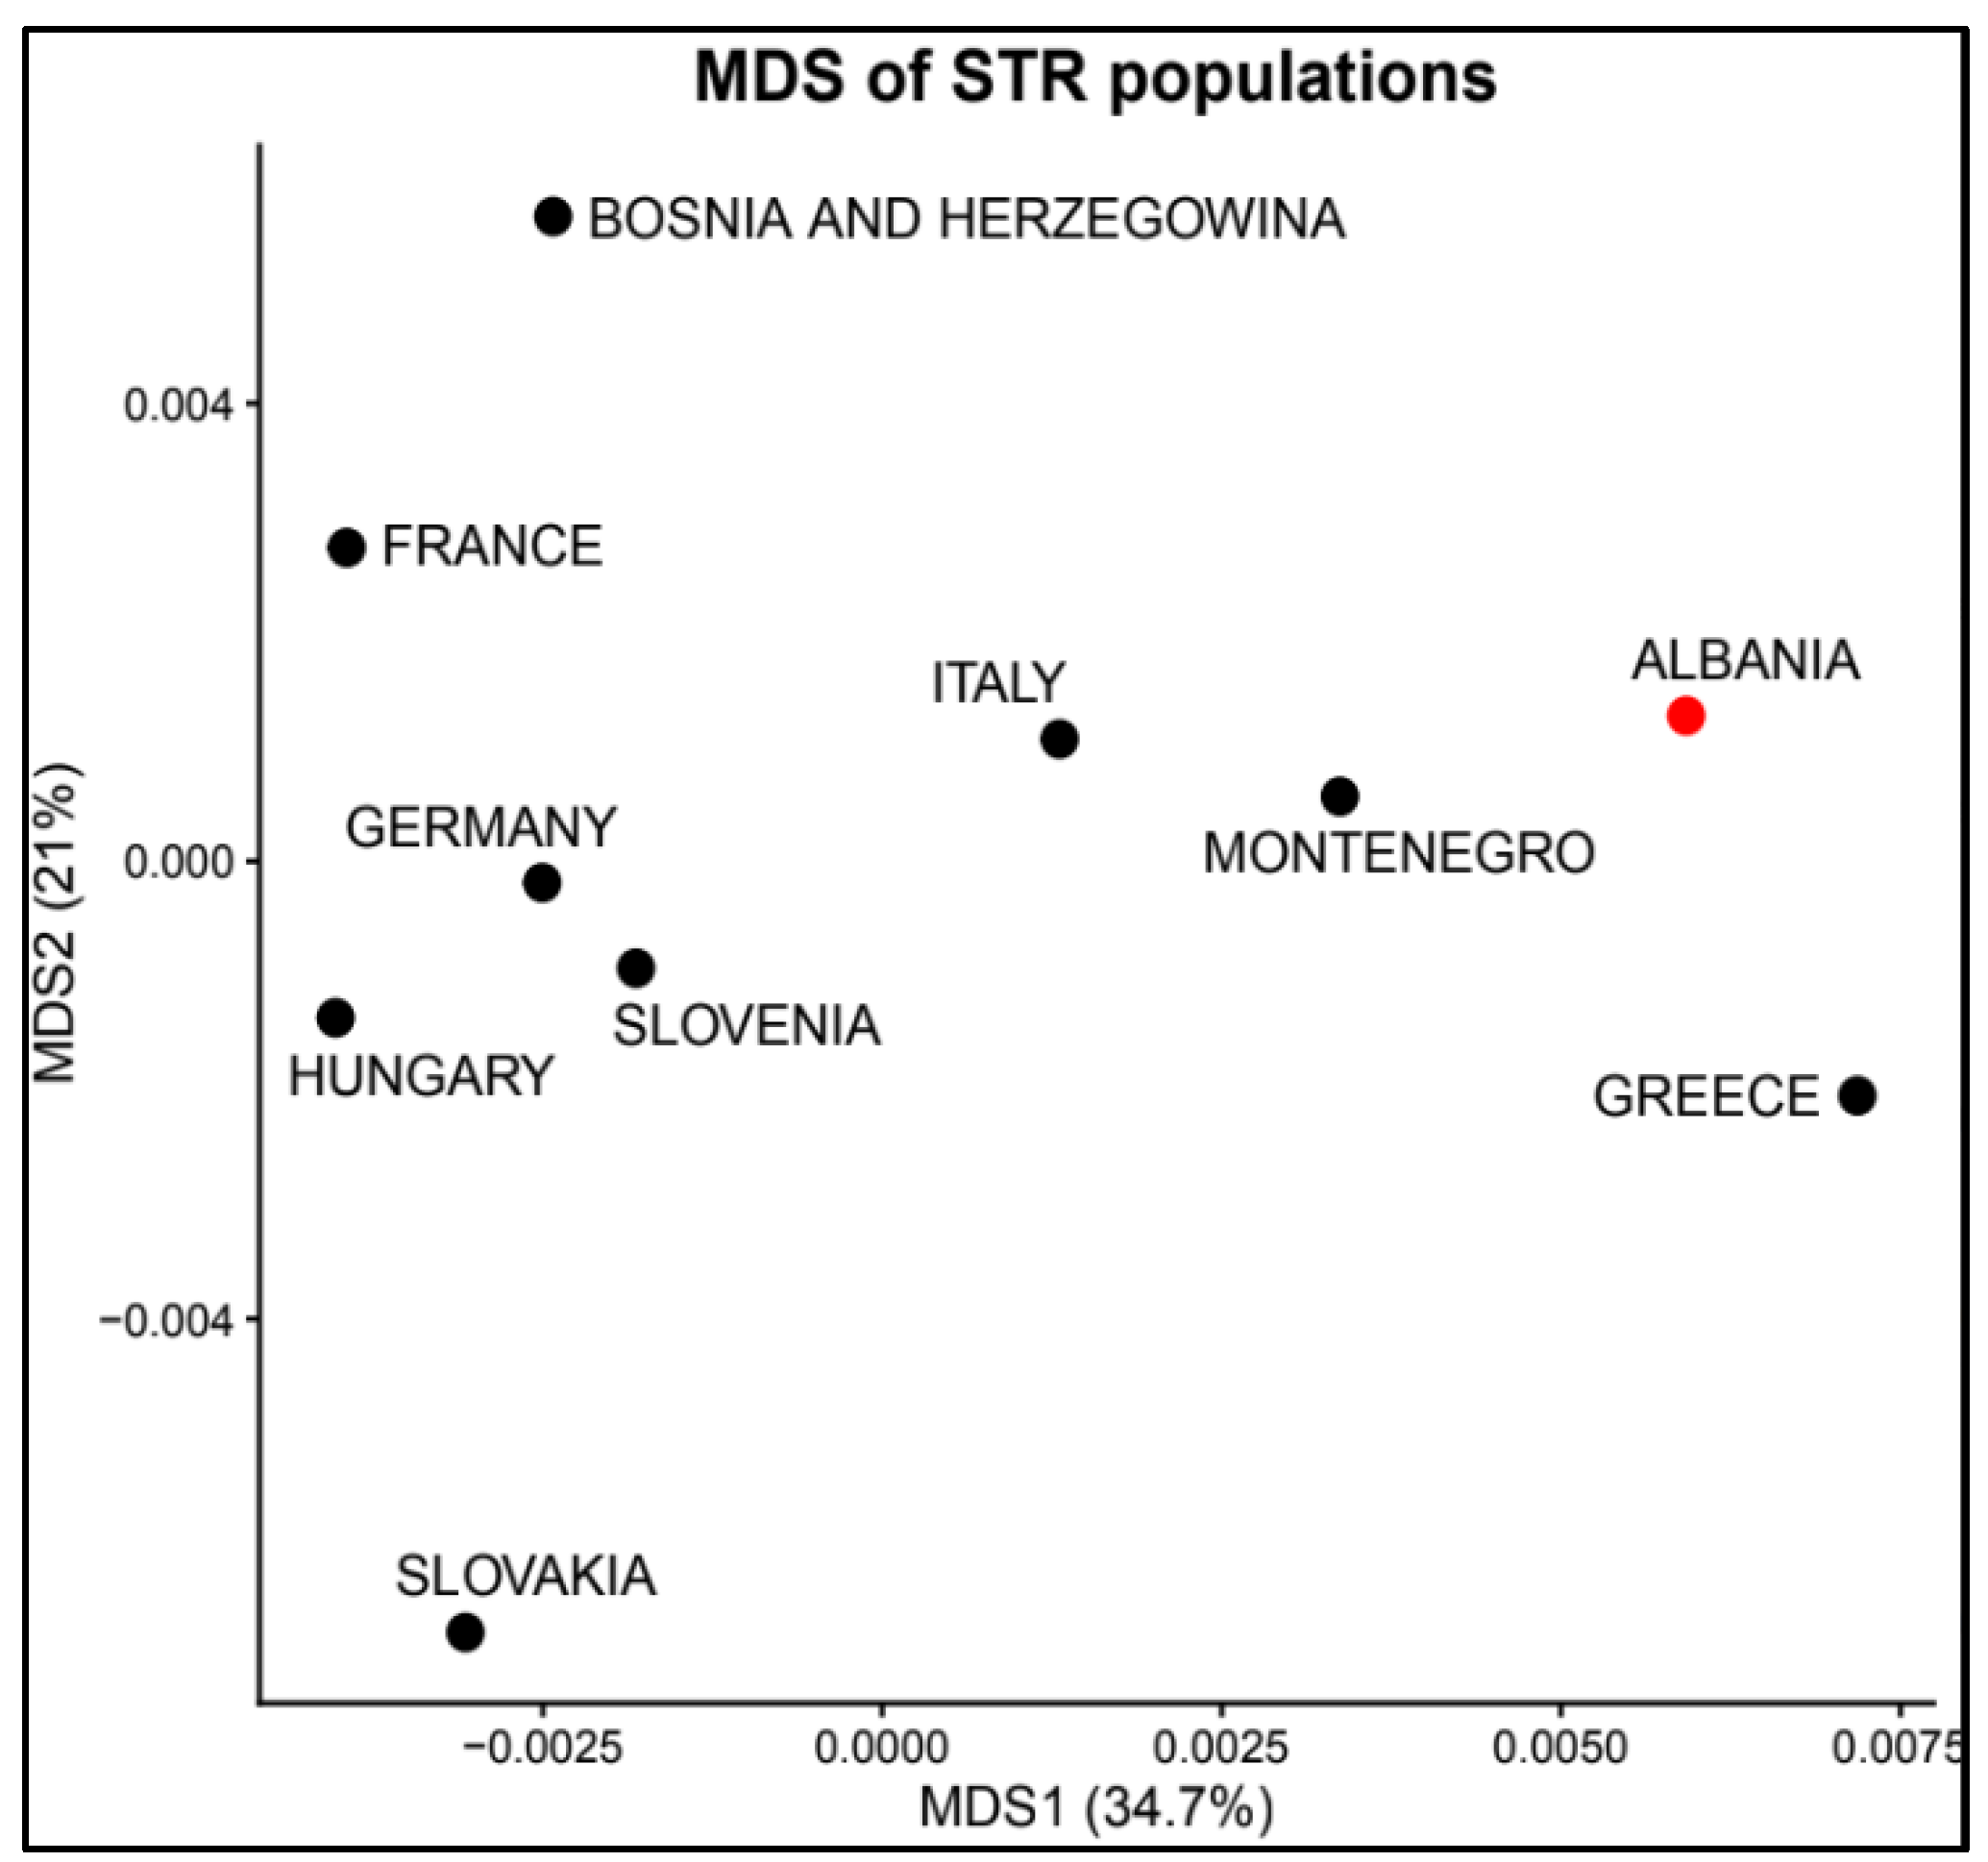
Figure 6.
Neighbor-Joining (NJ) Ultrametric Tree illustrating genetic relationships among European populations based on distance measurements. The tree demonstrates two age groups: a Mediterranean/Balkan group (Italy, Montenegro, Albania, and Greece) and a Central/Eastern European group (Hungary, Slovakia, Slovenia, and Bosnia and Herzegovina). France and Germany occupy intermediate positions between these groups. Branch lengths are proportional to genetic distance, and the ultrametric scaling indicates equal distances from the root to the tip, consistent with a molecular clock assumption.
Figure 6.
Neighbor-Joining (NJ) Ultrametric Tree illustrating genetic relationships among European populations based on distance measurements. The tree demonstrates two age groups: a Mediterranean/Balkan group (Italy, Montenegro, Albania, and Greece) and a Central/Eastern European group (Hungary, Slovakia, Slovenia, and Bosnia and Herzegovina). France and Germany occupy intermediate positions between these groups. Branch lengths are proportional to genetic distance, and the ultrametric scaling indicates equal distances from the root to the tip, consistent with a molecular clock assumption.
Disclaimer/Publisher’s Note: The statements, opinions and data contained in all publications are solely those of the individual author(s) and contributor(s) and not of MDPI and/or the editor(s). MDPI and/or the editor(s) disclaim responsibility for any injury to people or property resulting from any ideas, methods, instructions or products referred to in the content. |
© 2026 by the authors. Licensee MDPI, Basel, Switzerland. This article is an open access article distributed under the terms and conditions of the Creative Commons Attribution (CC BY) license (http://creativecommons.org/licenses/by/4.0/).
Copyright: This open access article is published under a Creative Commons CC BY 4.0 license, which permit the free download, distribution, and reuse, provided that the author and preprint are cited in any reuse.


