
Submitted:
21 July 2026
Posted:
22 July 2026
You are already at the latest version
Abstract
This research aims to help design artifacts that better fit their users, to promote their well-being. In urban spaces, well-being is affected by physical factors (such as the air quality) and by mental factors (the feeling the space affords its users). Focusing on mental well-being, a growing body of research focuses on the visual experience of urban spaces, and specifically on the aspect of visual impression. Studies of visual impression seek to link visual features of spaces to linguistic descriptions used by their users (e.g., referring to a space as “inviting”). Such works can be used to identify relations between visual features and our experience of space that are potentially generalizable, and thus useful for designing. However, as an emerging subfield, the study of visual impression of urban spaces is currently fragmented and would benefit from syntheses of the work done to date. Here, we systematically review studies of visual impression in urban settings, and or-ganize these across three dimensions: (1) purpose, (2) method and (3) findings. We identify research gaps in the field, challenges, and potential paths for moving forward.
Keywords:
urban design
; visual impression
; systematic review
1. Introduction
Predicting how an urban space will be experienced by humans can enable us to align our designs with the needs of users, and promote well-being in the built environment. As vision plays a dominant role in our interaction with the environment [1], understanding the relationship between objective visual features of the environment and the subjective experience of users is of great importance to urban design research. Verbal language is a powerful medium for conveying one’s subjective experience to others. Therefore, studying how users respond verbally to what they see is important for the progress of urban design. The primary aim of this article is to organize recent empirical findings concerning users’ visual experience of urban spaces, as captured in verbal form.
According to Norman, who famously stated that “attractive things work better”, the visual experience of artifacts goes beyond aesthetic pleasure, and contributes to the success (or failure) of designs [2]. In the context of urban spaces, the importance of considering the user’s experience as a critical part of the design was highlighted in early works, e.g. by Lozano who specifically discussed visual factors [3], by Williams who emphasized their aesthetics [4], among others.
Since then, researchers have been constructing a growing body of knowledge concerning how users perceive, interpret and experience urban space. Common areas of exploration include wayfinding [5], visual interest [6,7], aesthetic experience [8], neurocognitive response [9] ,and association of visual features with linguistic descriptions [10] (the latter being the focus of this study).
Past studies have produced valuable findings regarding various links between visual features of spaces and the way they are experienced by users. For example, Ohno has investigated the “frame effect” in buildings and found that the shape of an exit opening can affect the descriptions assigned to the view framed by it [11]. Further, Nishio and Ito have found that the degree to which an outdoor environment feels “calm” can vary by the sky factor (the degree of daylighting) [12]. Synthesizing these findings could be useful for various purposes, such as creating design guidelines. However, the wide range of studies conducted obscures the underlying structure of the field, and thus poses challenges for cross-study syntheses. To address this challenge, we are systematically reviewing works of this subfield.
In this work, we review literature that reports on links between visual features of urban spaces with users’ impressions. To structure our review, we have formulated three research questions: (RQ1) What aspects of visual impression does research aim to understand? (RQ2) How has visual impression in urban space been empirically studied? (RQ3) What relationships between visual features of the urban environment and users’ experience have been established?
2. Materials and Methods
To answer our research questions, we executed a systematic literature review using PRISMA — a widely used protocol for conducting literature reviews [13] which increases robustness and reproducibility. PRISMA has been applied in a wide range of domains, such as psychiatry [14], biology [15], computer science [16,17], pedagogy [18,19], and design [20,21,22]. PRISMA reviews are conducted in two major steps of (1) record selection, and (2) record classification and synthesis. We elaborate on each of these steps below.
2.1. Selection
To retrieve a set of candidate records for screening and determination of eligibility, we searched the complete Web of Science Core Collection dataset which includes over 90 million records to date (March 2026). Our search string was devised to retrieve any record which reports on an empirical investigation of visual impression in the context of urban space, while excluding articles that focus on other modalities, on the aspect of deriving impression from memory without the aid of visual stimulus, or on design pedagogy. Additionally, we refined the search by focusing only on articles written in English which are publicly available (open-access) and are in relevant research areas. The search yielded a total of 199 records for further review and screening. The details of the search procedure are summarized below:
- Record Type: Article
- Language: English
- Availability: Open access
- Research Areas: Areas with low relevance (surgery, meteorology, etc.) were excluded
- Search String: ("impression" OR "perception" OR "experience") AND ("urban" OR "city" OR "cityscape" OR "streetscape" OR "built environment" OR "built-environment") AND ("empirical" OR "experiment" OR "survey" OR "questionnaire" OR "interview" OR "user feedback" OR "user response" OR "field study" OR "observational study") AND (NOT ("auditory" OR "sound" OR "memory" OR "tactile" OR "education" OR "educational" OR "pedagogical"))
Next, we screened the collection of retrieved papers manually by reading their titles and abstracts, using the following inclusion criteria:
- The record has not been retracted
- The record is a research article (not a review article)
- The record contains a descriptive scientific contribution (as opposed to normative papers which propose new indices, methods, etc.)
- Empirical data regarding how users experience urban space was analyzed
- The focused aspect of the environment is its visual quality (as opposed to auditory quality, etc.)
- Visual impression is captured by asking users to report it, i.e. it is not derived based on physiological indicators such as EEG, etc. Note that, papers which investigated physiological factors alongside verbal descriptions, such as Chinazzo et al. [23], were included
- The user group investigated is representative of the general population (not declared to be domain experts) and are physiologically healthy (not visually impaired)
Only articles which fulfilled all criteria were included, and the rest (N=47) were screened out, resulting in (N=72) records for further consideration and determination of eligibility .Eligibility of the remaining records was determined by reading the full text and confirming that the study fulfills all the following criteria:
- Empirical results are reported concerning the visual impression of human users
- The empirical results establish a relationship between visual elements and users’ subjective feedback (reported in any form)
- The stimulus presented to users represents an urban environment, in a broad sense. For example, environments defined as “urban forests” were included, while those that were defined as “nature” without reference to an urban environment were excluded.
- If the investigation was done in a lab setting, the stimulus presented to users was realistic (e.g. photograph, immersive model) and not an abstraction (e.g., line drawing representing the environment or a visual pattern in it)
Using these criteria, we excluded approximately one third of the remaining records (N=26) and identified a collection of highly relevant records (N=46) for a detailed review, classification and synthesis, as reported below. The process of paper selection is summarized below in Figure 1.
2.2. Classification &Synthesis
Classification of the selected records was done by four independent researchers, following the method proposed by Ucci et al. [24], to increase robustness and ensure validity [25]. The four classifiers were split into two pairs according to their time zones, to ease communication. Each pair classified exactly half of the records (N=23), and each record was classified twice – once by each team member. This enabled us to evaluate inter-classifier reliability, and to minimize bias in the results of the classification process.
Each record was classified by considering according to three dimensions: (1) the purpose of the work, (2) the method used, and (3) the primary findings reported. These dimensions correspond with our three research questions. The information extracted from each record is summarized below in Table 1.
Following the classification of all records, synthesis was conducted in two steps. First, synthesis was done within teams, by resolving intra-team differences in classification. In this, discrepancies were discussed in both asynchronous and synchronous settings, and the final arbitration authority rested with the first author. Second, intra-team differences were resolved by adding or merging categories, as needed, aiming to produce a classification that was (1) as simple as possible, (2) inclusive of the findings in all of the records surveyed.
3. Results
This section is organized into three subsections (3.1-3.3), each addressing one of our research questions (RQ1-RQ3). Regarding inter-rater reliability, we report on agreement rates for two of the classification tasks which employed discrete choice, and can therefore be quantitatively evaluated. Inter-rater reliability was first calculated within each team and then across teams. (Table 2).
3.1. Foci of Past Works (RQ1)
The selected studies can be classified into three major types based on their research focus (i.e. the kind of information that the work attempts to extract):
- Studies investigating users’ preference concerning the visual qualities of a space
- Studies investigating users’ impression as reflected in descriptions attributed to a given artifact or environment.
- Hybrid studies which combine 1 and 2
We organize the surveyed records into these three categories below. For each category, we provide a concise characterization of typical studies, as well as an overview of the classification outcome in the form of a table. An overview of the distribution across these categories is given in Figure 2.
Studies of type 1 attempt to answer the following question: given an artifact (or a set of artifacts), would users consider it preferable? While some studies explicitly indicate that their focus is on studying preference, e.g. [26], terms that strongly imply preference such as “desirability” of a design are included within the category as well. Table 3 summarizes the studies focused users’ preferences, which shows that researchers are studying preference across a wide range of scales, from specific objects such as green roofs [27] or wind turbines [28], and up to large outdoor environments such as urban forests [26] or streetscapes [29]. A notable portion of the studies focused on green spaces or elements, as illustrated in Figure 3.
Studies of type 2 attempt to answer the following question: given an artifact (or its visual representation), how would a human user describe it verbally? When investigating the ways that we describe designs, researchers may focus on associating an urban space with a single specific description, e.g. “safe” [38] or with multiple description which may or may not be directly linked, e.g. [“safe”, “lively”, “beautiful”, “wealthy”, “depressing”, “boring”] [39]. The studies investigating users’ experience in terms of verbal descriptions are organized in Table 4. The table includes the details for each study, the object which the user was required to view or consider, and the specific aspect emphasized in the investigation. Studies investigating multiple aspects of the human visual experience were classified as “diverse”.
Studies of type 3 attempt to answer questions that pertain both to the general experience of a design and to specific preferences. Therefore, participants in these studies are requested to associate a verbal description with a visual object, and to assess the desirability of the object. Studies in this category are organized in Table 5.
3.2. Approaches for Studying Visual Impression of Urban Space (RQ2)
Visual impression in urban space is being studied using a diverse set of approaches. We characterize these by focusing on the materials used as stimuli, the procedure for data collection and the analysis of the data. An overview of the types of stimuli used and the different methods employed for data collection is given in Figure 4.
3.2.1. Visual Stimuli
The most common material used as stimuli is two-dimensional photographs of urban spaces shown to participants, which have been used in over half of the studies (N=28). Within this group, one quarter of the studies (N=7) have also employed photomontage techniques using software such as Adobe Photoshop, to produce design alternatives, e.g. [34].
Second are studies that used the actual space as the stimulus, commonly referred to as studies “in-the-wild” (N=12), e.g. [60]. A few studies conducted in-the-wild employed a hybrid approach, which also included other stimuli, such as digitally produced drawings of alternatives [26], or a photomontage of the location the participant is situated at [64].
Third are studies that involved the display of virtual yet realistic stimuli. In one case, panoramic virtual images of real spaces were shown to participants in virtual reality [39]. In another case, a virtual model of an existing environment was constructed, and multiple alternatives were rendered [66], and in another a virtual model was constructed without a specific real-world referent (yet inspired by North-Italian landscape) [52].
In three cases, the investigation did not employ a visual stimulus. Despite this, they relied on past visual experiences and the visual impression of participants, and were thus retained in the review.
3.2.2. Method of Data Collection
Methods for data collection are divided into two major categories, following the distinction between the studies which investigate users’ preferences concerning a visual scene and those that investigate the descriptions that users may attribute to it (introduced in 3.1).
To extract users’ preferences, human subjects were requested to conduct four kinds of tasks. First, choice survey tasks in which users are presented with a set of design alternatives to choose from [29]. Second, rating tasks, e.g. using a Likert scale, in the form of a questionnaire administered in a laboratory setting [28] or in-situ [26]. Third, passive observation tasks, in which eye movements are recorded while viewing a stimulus, and linked to rating data [34]. Fourth, usage tasks, in which walking behavior is recorded and analyzed to infer the users’ subjective preferences from observable data, such as walking behavior [30].
When extracting descriptions assigned to visual scenes, four different tasks were used. First, rating tasks in which a subject evaluates the correspondence between a visual representation of a space and a verbal description, which can be done via a Likert scale, .e.g. [54] or via a semantic differential scale, e.g. [51]. Among these, one study also included questions regarding one’s attention to specific visual elements [47]. Second, matching tasks were administered. In these, a subject is asked to focus on a given verbal description, and selects the best match out of a set of visual representations, typically via pairwise comparison, e.g. [42]. The latter was also done without collecting new data from human participants, by utilizing existing open datasets [38] such as Place Pulse [72]. Third, in a single study, a sorting task was administered, which required subjects to group sets of photos based on shared attributes, then order them according to the extent they match a given description [44]. Finally, a single study has employed a semi-structured interview for extracting descriptions from users [55].
Studies that attempted to extract both preferences and descriptions have commonly used a combination of two or more of the above approaches. Additionally, one study involved its participants in the data collection activity by asking them to take photos that captured their impressions [56].
3.2.3. Verbal Description Studies
The complete set of verbal descriptions investigated (in applicable studies) is summarized in Figure 5 below. Closely related terms are grouped under a single term, e.g. “integrated” and “unified” are both included within “integrated”. Note that one study [48] has used the positive-negative affect schedule (PANAS) [73] and its 20 descriptors to extract visual impression, yet these referred to the individual rather than the spaces experienced (e.g. “scared”, “distressed”, etc.), and were thus excluded from this figure.
3.3. Current Empirical Findings Regarding the Visual Impression of Urban Space (RQ3)
3.3.1. Findings Concerning Preference
With respect to users’ preferences, we organize our findings into three types of studies, based on the overarching research question pursued. Findings for each type are organized in the form of a table.
Type (1) studies examine whether a specific visual element is desirable or undesirable in binary terms – e.g., does the existence of a visual element X (or its absence) correlate with positive or negative preference? Such studies answer the following question: if a certain element is added or removed, what would be the impact on users’ preference? For example, Hamza et al. found the presence of wind turbines in specific environments (landscape, seascape) desirable [28]. Current findings concerning the relations between presence/absence and preference are summarized in Table 6.
Type (2) studies report on hierarchies of elements in terms of desirability – e.g. is a visual element X preferred over another visual element Y? These studies answer the following question: given a set of elements to choose from, which one would be preferable from the perspective of users? For example, a study of urban green spaces has found that adolescents preferred recreational infrastructure over the biophysical environment [33]. Current findings concerning visual element identified as preferable among sets of elements are given in Table 7.
Type (3) studies examine the desirable amount or degree of certain elements – e.g., will a large amount of element X be preferable over a smaller amount of it? For example, focusing on urban forests, Buckwitz et al. have found a medium amount of ground vegetation to be desirable [26]. Current findings concerning the desirable amount or degree of elements are given in Table 8. For reference, results prior to synthesis, including sources, are given in Appendix A (Table A1).
The above findings can aid planners and decision-makers in designing urban spaces by pointing to desirable alternatives and by highlighting non-desirable ones which they may want to avoid. For instance, based on [27], planners of extensive green roofs can consider reducing gaps in vegetation, and removing weeds. At the same time, the above findings should be interpreted with caution, as the relationships reported may be associated with the specific group under investigation, and since findings occasionally conflict (discussed in 4.3).
3.3.2. Findings Concerning Description
With respect to users’ description of urban space, primary findings that link visual elements with descriptions were extracted and synthesized. These findings (Table 9) are organized on two levels – first by the description which was assigned to the visual environment (“safe”, “clean”) then by the type of environment studied. Findings reported here are those which do not display clear dependency on the specific group sampled.
Alongside these findings, works have reported on various factors which pose challenges in trying to establish robust knowledge concerning visual impression. First, context dependency of certain elements (e.g. vegetation, sky) was observed [38,43]. Second, asymmetries among different groups were noted. For instance, gender differences in using the description “safe” with respect to a streetscape were found (women evaluating the same streetscape as less safe than men) [41]. Third, visual elements may interact nonlinearly, e.g. greenery can mitigate the negative effects of dense buildings or roads, up to certain threshold [42]. Fourth, visual impression is affected by cognitive processes such as visual attention. Worse yet, attentional processes can be in-turn affected by past knowledge or experience – e.g. higher site familiarity was found to increase or redirect attention to children playing [47], and this experience was deemed as preferable/positive.
Finally, in addition to teaching us about positive/negative relations between visual factors and verbal description, studies have deepened our understanding of visual impression in at least three ways: (1) by identifying visual elements which are potentially neutral – e.g., in one study, hue did not play an important role in creating an environment which is visually comfortable [46]; (2) by helping us evaluate the extent that users’ impression have (or have not) matched the design intention [56]; (3) by demonstrating that certain types of features correlate more with a given description – e.g., Florio et al. have found bottom-up visual features (contrast, edges, low-frequency structure, attention-grabbing regions) to correlate more strongly with perceived complexity than top-down semantic features [44].
4. Discussion
This section is organized into four subsections. The first three correspond to our research questions (4.1, 4.2, 4.3). The last provides recommendations for future study of visual impression of urban space, and highlights the challenges involved in understanding the response of human users to their environment (4.4).
4.1. Characterization of Past Works Based on the Focus of the Investigation
Overall, three primary types of studies were identified, based on their goal:
Goal 1: Understanding users’ preference with respect to an urban environment
Goal 2: Understanding the descriptions assigned by users to an urban environment
Goal 3: Understanding both preferences and descriptions.
The primary difference between these studies is the question that they attempt to answer. Given a visual element X, type 1 studies are interested in finding out whether users will deem X desirable, type 2 studies are interested in finding out how users will describe it, and type 3 studies are interested in both.
This tripartite distinction is important since verbal feedback from users can contain descriptive information (which may be neutral) and information about their preferences. For example, three out of the four most commonly studied terms are ones that imply preference (“beautiful”, “safe”, “pleasant”). This means that such studies contribute to our understanding users’ preferences, even when preference is not stated as the focus of the study. By contrast, neutral terms (e.g. “layered”), which dominate the list of terms studied, do not necessarily contain information concerning users’ preference.
Therefore, we recommend considering these three goals when defining the scope of future studies on visual impression, to clearly communicate the research aims and contributions to readers.
4.2. How Have We Empirically Studied Visual Impression in Urban Space? (RQ2)
4.2.1. Stimuli
The primary stimulus was two-dimensional photos of the space under investigation. Studies conducted in the wild have emerged, but still consist of a little over a quarter of the total, despite the rise in such studies in other fields, e.g. in human-computer interaction [74]. To produce ecologically valid results, researchers can attempt to reproduce past results in real-world settings, or conduct new experiments in which the visual stimulus presented is the real object, rather than a representation of it. An alternative to the “in-the-wild” approach is to form realistic 3D virtual representations – a technique which is becoming increasingly feasible with reduced costs of immersive headsets. However, the assumption that our response to virtual and physical representations of the environment has recently been called into question [75]. Thus, it is important that studies which rely on virtual stimuli are validated by comparing users’ responses to virtual versions of the urban environment and their physical counterparts. Nonetheless, our ability to do so is limited, since one of the usages of virtual stimuli is to present users with counterfactual situations, i.e. ones which do not yet exist in physical space [66]. A low-cost intermediate solution is to produce counterfactual images then present them to participants in-situ [64].
4.2.2. Data Collection
Among the seven approaches identified, the least employed methods were interviews (used in a single study) and requesting participants to take photos of visual elements of interest, thereby enabling greater freedom in terms of attention and selection (also used in a single study). These approaches can complement highly structured tasks which are characteristic of quantitative studies. While the value of highly constrained tasks is clear (e.g. choice tasks facilitate comparability) they are limited at least in two ways: (1) given any verbal description, they assume that its interpretation is comparable among different individuals, yet linguistics tells us that this is not necessarily true [76,77]; (2) given the environment under investigation, visual stimuli that may have been of interest are excluded a priori during material preparation. Interviews can enable researchers to inquire into differences in their understanding of verbal terms and how they can be matched with urban environments [78], thereby helping to address (1). Encouraging users to take photos and participate in the collection of visual stimuli can help reduce bias when selecting visual elements for study. Photo collection may be further structured by methods such as “photo diary” [79], in which the viewer both collects the visual stimulus and comments on it at different levels (both objectively and subjectively). Since both interviews and photo collection are costly, however, they cannot be expected to replace other data collection approaches, but rather to support and enrich them.
4.2.3. Verbal Descriptions Investigated
The most common description was “safe”, reflecting the importance researchers assign to designing safe urban environments. Overall, descriptions commonly appear in positive form, where applicable (e.g. “beautiful” rather than “ugly”), showing a tendency to focus on the existence/absence of positive experience. Yet the absence of a positive experience does not necessarily imply a negative experience (absence of beauty does not necessarily imply presence of ugliness). Therefore, future work can further study the links between negative descriptions and visual impression of urban space. Also, while a significant portion of the studies focused on green environments, the description “natural” occurred only once. The emerging approach of biophilic design has established that nature-like forms correlate with positive experience among humans [80,81]. Therefore, there is room to expand our investigation into what is visually experienced as natural and what is not, such that designed elements can draw on the benefits of biophilia, despite their artificial nature.
Additionally, our findings have shown that more than half of the descriptions studied were employed only in a single study, reflecting potential fragmentation in the literature. Considering this, future studies can refer to past literature for examining the verbal descriptions employed, to select ones which are suitable for their purposes. In this manner, we can build a body of knowledge regarding how specific descriptions are used in multiple contexts and by different groups, which is essential for building a robust understanding of the relation between language and space (as both words and visual environments are information-rich).
Finally, studies exploring neutral verbal descriptions can benefit from the inclusion of data concerning the users’ emotional states (e.g. valence [82]), to help resolve ambiguity regarding the meaning one assigns to the description. This can be done in tandem with qualitative methods such as interviews, suggested earlier (4.2.2), to understand how the description assigned reflects one’s subjective experience.
4.3. What Links Have Been Established Between Features of the Urban Environment and Descriptions Attributed to Them by Human Users? (RQ3)
This subsection integrates findings concerning preferences and descriptions. The surveyed works offer a broad perspective on the relations between urban spaces and visual impression, as studies were conducted in a wide range of environments, and with different foci in terms of the human experience under investigation. The largest body of knowledge identified is concerned with the design of urban green spaces. However, even in this case, the amount of evidence we currently have regarding visual impression in within each category is relatively small and sporadic, since the category of urban green spaces includes a diverse set of sub-categories (e.g., urban forest, urban parks), each with its specific characteristics (e.g., functions and visual elements). Nonetheless, several observations can be made on the basis of current evidence.
First, a notable number of elements were identified as potentially desirable, and such information can be instructive in designing urban spaces. For example, in the context of urban parks, a simple perimeter shape was preferred over a complex one [59]. As the study was executed in a single country, however, it remains to be clarified whether the findings are culturally dependent. Given the relatively small number of studies conducted in similar/identical spaces, the need for further validation extends beyond the specific study mentioned here, and can be taken as a general recommendation for the subfield as a whole.
Second, when examining the list of features associated with verbal descriptions (Table 9), a difficulty emerges concerning interpretation – while certain features are based on clear-cut definitions, e.g. background vegetation reaches up to 50% of the height of the building [66], other features are not readily quantifiable or definable. For instance, features such as “fragmented (visual) regions” or “sharp edges” [44] may be employed differently in different studies, which poses challenges during synthesis across the field. Therefore, researchers can consider creating a catalogue of qualitative visual features in verbal form paired with operational definitions to be used by the community, to help align our efforts to understand how specific visual aspects of the environment are experienced.
Third, while studies of visual impression typically assume that visual features directly determine our experience, the survey revealed that conceptualization and interpretation can also play an important role. For example, in the context of rural greenways, it was found that elements which provide opportunities for social/physical activity were evaluated as desirable [52]. Such findings highlight the importance of understanding the underlying reasons for users’ responses, and their contribution to forming impressions.
Finally, several challenges in studying visual impression exist. Among these, individual differences pose a significant hurdle. As the experience of visual stimuli may vary with background knowledge [47], culture [83] and other factors, it may be fruitful to aim to study the range of descriptions that an urban environment affords, rather than attempting to determine whether a single description is its best match. Indeed, research has shown that a single verbal description (“oku” in Japanese, meaning depth or mystery) can be associated with different visual features by different people (layers, barriers and other visual features) [78], thus pointing to the importance of employing an inclusive lens in terms of the descriptions and visual features studied.
Furthermore, evidence shows that findings concerning preference may conflict, even for environments of the same type, thus posing challenges in its application. For example, in the context of urban forests, one study reported that high amounts of deadwood were evaluated as desirable [26], while in another study users were pleased with having no deadwood at all [71]. Such conflicting evidence may be attributed to a large number of factors such as the user group, the specific type of forest being studied, or the activity in which participants engaged, which poses challenges for resolution. Finally, differences across groups have been established (e.g., the public preferred flower beds more than professionals [32]), thus highlighting the difficulty of identifying universal preferences.
5. Conclusions
Based on a review of recent studies, we propose guidelines and highlight opportunities and challenges for studying the visual impression of urban space.
First, to improve clarity, researchers are encouraged to clearly state the specific type of research question their study addresses:
- How do users experience and describe a given urban space?
- What visual features of urban spaces do users prefer?
- Both of the above
Second, ecological validity can be improved by including in-the-wild experiments (currently emerging) or by using immersive virtual environments for presenting visual stimuli display (as opposed to the common method of using photos).
Third, researchers have produced a broad and diverse body of knowledge concerning visual impression in different settings. Yet, if we aim for generalizable insights, existing works must be further validated and extended. Two useful strategies are:
- replicating past findings (none were identified in this review)
- conducting additional experiments in previously studied environments concerning other features or verbal descriptions
Finally, to overcome differences in the definition of visual features across studies, a catalogue of visual features paired with operational definitions may be developed in future work.
Funding
This research received no external funding.
Data Availability Statement
Data will be provided upon request.
Acknowledgments
During the preparation of this manuscript/study, the authors occasionally used Microsoft CoPilot, version 2605, for the purposes of data extraction. In all cases, the output was reviewed by the authors, compared with the source and edited manually. The authors and take full responsibility for the content of this publication.
Conflicts of Interest
The authors declare no conflicts of interest.
Appendix A

Table A1.
Links between preference and visual features (degree).
| Environment | Sub-type | Element | Preferred Features | Source |
| Urban green space | Urban forest | - | tree stands (diverse), ground vegetation (medium), deadwood (high) | [26] |
| Urban green space | Urban forest | - | cover (continuous), , shrub layer | [31] |
| Urban green space | Urban park | park | size (up to ~15 ha), vegetation (high density, healthy), perimeter shape (simpler) | [59] |
| Urban green space | Urban park | flowers | High color diversity | [65] |
| Urban green space | Greenway | greenery | High amount | [35] |
| Urban green space | Recreational other | vegetation | moderate distance | [33] |
| Urban green space | Recreational trail | - | low traffic | [33] |
| Urban green space | - | meadows and lawns | lawn (neat) | [68] |
| Other | - | green roof | continuous green roof surface | [27] |
| Other | - | flowers (border) | color (green, cool, high brightness, high contrast), plant patches(many) | [57] |
| Other | Road corridors | - | trees (dense, close to road, seasonally diverse) | [61] |
Table A2.
Links visual verbal descriptions and visual features.
|
Description /Feature |
Environment |
Positive Contributor |
Negative Contributor | Source |
| Safe | Streetscape | high proportion of open/accessible areas | Enclosed/unmanaged elements (walls, poles, alleys) | [38] |
| Streetscape | Urbanization, living amenities, natural environment, street color, edges | Tourists spots, points of interest | [41] | |
| Streetscape | High proportion of trees, greenery | Densities of buildings, roads, sidewalks, vehicles, and people | ||
| Streetscape | Daytime (a minimum illuminance of approximately 1.8 lx) | Dark environment | [45] | |
| Streetscape | Higher green visibility and dynamic elements (boats, people, vehicles) | - | [39] | |
| Urban forest | Daylight | - | [60] | |
| Complex | Streetscape | Fragmented regions, high contrast, sharp edges, high variability of color or luminance | - | [44] |
| Integrated | Rural buildings | background vegetation reaches roughly 0–50% of building height | vegetation exceeding building height (>100%) | [53] |
| Trees help at 40-50% coverage, but climbers require 70-80% coverage. | - | [54] | ||
| Pleasant, comfortable | Public open space | Adults’ passive experience of children playing | - | [47] |
| Buildings | Higher color value (mid–high range), moderate value contrast, low chroma, and weaker chroma | - | [46] | |
| Cycling track | Trees with low bushes placed between the cycle track and the street | [64] | ||
| Restorative, calming | Schoolyards | Schoolyards with trees in leaf (children), seasonal variation in foliage | - | [66] |
| Urban green space | Unstructured experiences of nature | - | [55] | |
| Urban green space | green/blue spaces | - | [67] | |
| Rural greenway | Opportunities for social and physical activities, planting variety | - | [52] | |
| Urban forest | daylight | - | [60] | |
| Urban park | Plant type (single layer grassland) | - | [48] | |
| Streetscape | Vegetation | fences | [43] | |
| Designed meadow | High level of care | - | [68] | |
| Neat/clean | Urban green space | Mowing | - | [68] |
| Streetscape | - | Construction sites | [56] | |
| Legible | Streetscape | - | Construction sites | [56] |
| Lively, rich | Moderate enclosure and high visual diversity enhance perceptions | [40] | ||
| Streetscape | Higher green visibility and dynamic elements (boats, people, vehicles) | - | [39] |
References
- Sinnett, S.; Spence, C.; Soto-Faraco, S. Visual Dominance and Attention: The Colavita Effect Revisited. Percept. Psychophys. 2007, 69, 673–686. [Google Scholar] [CrossRef] [PubMed]
- Norman, D.A. Emotional Design. Ubiquity 2004, 2004, 1. [Google Scholar] [CrossRef]
- Lozano, E.E. Visual Needs in the Urban Environment. Town Plan. Rev. 1974, 45, 351. [Google Scholar] [CrossRef]
- Williams, S.H. Urban Aesthetics. Town Plan. Rev. 1954, 25, 95. [Google Scholar] [CrossRef]
- Hollander, J.B.; Sussman, A.; Lowitt, P.; Angus, N.; Situ, M.; Magnuson, A. Insights into Wayfinding: Urban Design Exploration through the Use of Algorithmic Eye-Tracking Software. J. Urban Des. 2023, 28, 274–295. [Google Scholar] [CrossRef]
- Simpson, J.; Freeth, M.; Simpson, K.J.; Thwaites, K. Visual Engagement with Urban Street Edges: Insights Using Mobile Eye-Tracking. J. Urban. Int. Res. Placemaking Urban Sustain. 2019, 12, 259–278. [Google Scholar] [CrossRef]
- Kiefer, P.; Giannopoulos, I.; Kremer, D.; Schlieder, C.; Raubal, M. Starting to Get Bored: An Outdoor Eye Tracking Study of Tourists Exploring a City Panorama. In Proceedings of the Symposium on Eye Tracking Research and Applications; ACM: Safety Harbor Florida, 26 March 2014; pp. 315–318. [Google Scholar]
- Brielmann, A.A.; Buras, N.H.; Salingaros, N.A.; Taylor, R.P. What Happens in Your Brain When You Walk Down the Street? Implications of Architectural Proportions, Biophilia, and Fractal Geometry for Urban Science. Urban Sci. 2022, 6, 3. [Google Scholar] [CrossRef]
- Bower, I.S.; Clark, G.M.; Tucker, R.; Hill, A.T.; Lum, J.A.G.; Mortimer, M.A.; Enticott, P.G. Built Environment Color Modulates Autonomic and EEG Indices of Emotional Response. Psychophysiology 2022, 59, e14121. [Google Scholar] [CrossRef] [PubMed]
- Law, S.; Valentine, C.; Kahlon, Y.; Seresinhe, C.I.; Tang, J.; Morad, M.G.; Fujii, H. Generative AI for Architectural Façade Design: Measuring Perceptual Alignment Across Geographical, Objective, and Affective Descriptors. Buildings 2025, 15. [Google Scholar] [CrossRef]
- Ohno, R. Studies on Environmental Perception during Locomotion—a Review of Empirical Studies by the Ohno Laboratory. Jpn. Archit. Rev. 2018, 1, 194–206. [Google Scholar] [CrossRef]
- Nishio, S.; Ito, F. The Effect of Sky Factor and the Change on Impression of Townscape: With the Experiment for Evaluation Impression While Walking. J. Archit. Plan. Trans. AIJ 2015, 80, 907–914. [Google Scholar] [CrossRef]
- Page, M.J.; McKenzie, J.E.; Bossuyt, P.M.; Boutron, I.; Hoffmann, T.C.; Mulrow, C.D.; Shamseer, L.; Tetzlaff, J.M.; Akl, E.A.; Brennan, S.E.; et al. The PRISMA 2020 Statement: An Updated Guideline for Reporting Systematic Reviews. BMJ 2021, n71. [Google Scholar] [CrossRef] [PubMed]
- Zarate, D.; Stavropoulos, V.; Ball, M.; De Sena Collier, G.; Jacobson, N.C. Exploring the Digital Footprint of Depression: A PRISMA Systematic Literature Review of the Empirical Evidence. BMC Psychiatry 2022, 22, 421. [Google Scholar] [CrossRef] [PubMed]
- Miller, T.; Michoński, G.; Durlik, I.; Kozlovska, P.; Biczak, P. Artificial Intelligence in Aquatic Biodiversity Research: A PRISMA-Based Systematic Review. Biology 2025, 14, 520. [Google Scholar] [CrossRef] [PubMed]
- Harie, Y.; Gautam, B.P.; Wasaki, K. Computer Vision Techniques for Growth Prediction: A Prisma-Based Systematic Literature Review. Appl. Sci. 2023, 13, 5335. [Google Scholar] [CrossRef]
- Kwao Dawson, J.; Twum, F.; Hayfron Acquah, J.B.; Missah, Y.M. PRISMA Archetype-Based Systematic Literature Review of Security Algorithms in the Cloud. Secur. Commun. Netw. 2023, 2023, 1–17. [Google Scholar] [CrossRef]
- Kahlon, Y.; Law, S.; Kishimoto, M.; Majumder, A.; Gath-Morad, M.; Osaragi, T.; Nagamine, M.; Herr, C. Gaze Sharing: A Survey of Its Applications in Education and Future Directions. Comput. Educ. X Real. 2026, 8, 1–15. [Google Scholar] [CrossRef]
- Samala, A.D.; Usmeldi; Taali; Ambiyar; Bojic, L.; Indarta, Y.; Tsoy, D.; Denden, M.; Tas, N.; Dewi, I.P. Metaverse Technologies in Education: A Systematic Literature Review Using PRISMA. Int. J. Emerg. Technol. Learn. IJET 2023, 18, 231–252. [Google Scholar] [CrossRef]
- Liu, Y.S.; Yigitcanlar, T.; Guaralda, M.; Degirmenci, K.; Liu, A.; Kane, M. Leveraging the Opportunities of Wind for Cities through Urban Planning and Design: A PRISMA Review. Sustainability 2022, 14, 11665. [Google Scholar] [CrossRef]
- Krishnan, S.K.; T, N.; R, K. Systematic Literature Review of Product Feature Prioritization Frameworks in Startups Building Digital Products Using PRISMA. In Proceedings of the 2023 IEEE 11th Region 10 Humanitarian Technology Conference (R10-HTC), Rajkot, India, October 16 2023; IEEE; pp. 1137–1143. [Google Scholar]
- Kahlon, Y.; Fujii, H. Questions in Design Computing Research and Ways for Exploring Them: A Systematic Review of the DCC Conference. Des. Sci. 2025, 11, 1–38. [Google Scholar] [CrossRef]
- Chinazzo, G.; Chamilothori, K.; Wienold, J.; Andersen, M. Temperature–Color Interaction: Subjective Indoor Environmental Perception and Physiological Responses in Virtual Reality. Hum. Factors J. Hum. Factors Ergon. Soc. 2021, 63, 474–502. [Google Scholar] [CrossRef] [PubMed]
- Ucci, M.; Law, S.; Andrews, R.; Fisher, A.; Smith, L.; Sawyer, A.; Marmot, A. Indoor School Environments, Physical Activity, Sitting Behaviour and Pedagogy: A Scoping Review. Build. Res. Inf. 2015, 43, 566–581. [Google Scholar] [CrossRef]
- Larsen, K.R.; Lukyanenko, R. Validity in Design Science. SSRN Electron. J. 2025. [Google Scholar] [CrossRef]
- Buckwitz, S.; Djahangard, M.; Yousefpour, R. Assessing the Recreational Value and Preferences in the City Forest of Freiburg, Germany. Urban For. Urban Green. 2025, 107, 128804. [Google Scholar] [CrossRef]
- Vanstockem, J.; Vranken, L.; Bleys, B.; Somers, B.; Hermy, M. Do Looks Matter? A Case Study on Extensive Green Roofs Using Discrete Choice Experiments. Sustainability 2018, 10, 309. [Google Scholar] [CrossRef]
- Hamza, N.; Borg, R.P.; Camilleri, L.; Baniotopoulos, C. Experts versus the Public: Perceptions of Siting Wind Turbines and Performance Concerns. Energies 2022, 15, 7743. [Google Scholar] [CrossRef]
- Cortesão, J.; Brandão Alves, F.; Raaphorst, K. Photographic Comparison: A Method for Qualitative Outdoor Thermal Perception Surveys. Int. J. Biometeorol. 2020, 64, 173–185. [Google Scholar] [CrossRef] [PubMed]
- Zou, J.; Jiang, H.; Ying, W.; Qiu, B. Scenic Influences on Walking Preferences in Urban Forest Parks from Top-View and Eye-Level Perspectives. Forests 2024, 15, 2020. [Google Scholar] [CrossRef]
- Trummer, J.; Hegetschweiler, K.T. How Do Forest Visitors Perceive Forest Management Forms? Public Acceptance of Coppice-with-Standards in Urban Forests. Trees For. People 2023, 14, 100439. [Google Scholar] [CrossRef]
- Poje, M.; Vukelić, A.; Židovec, V.; Prebeg, T.; Kušen, M. Perception of the Vegetation Elements of Urban Green Spaces with a Focus on Flower Beds. Plants 2024, 13, 2485. [Google Scholar] [CrossRef] [PubMed]
- Arnberger, A.; Eder, R.; Allex, B.; Wallner, P.; Weitensfelder, L.; Hutter, H.-P. Urban Green Space Preferences for Various Health-Related Psychological Benefits of Adolescent Pupils, University Students and Adults. Urban For. Urban Green. 2024, 98, 128396. [Google Scholar] [CrossRef]
- Shi, Y.; Zhang, J.; Shen, X.; Chen, L.; Xu, Y.; Fu, R.; Su, Y.; Xia, Y. Designing Perennial Landscapes: Plant Form and Species Richness Influence the Gaze Perception Associated with Aesthetic Preference. Land 2022, 11, 1860. [Google Scholar] [CrossRef]
- Zheng, J.; Chen, Y.; Guan, L. Which Factors Affect the Visual Preference and User Experience: A Case Study of the Mulan River Greenway in Putian City, China. Forests 2024, 15, 1529. [Google Scholar] [CrossRef]
- Sikorska, D.; Macegoniuk, S.; Łaszkiewicz, E.; Sikorski, P. Energy Crops in Urban Parks as a Promising Alternative to Traditional Lawns – Perceptions and a Cost-Benefit Analysis. Urban For. Urban Green. 2020, 49, 126579. [Google Scholar] [CrossRef]
- Pilarczyk, A.; Kondak, A.; Grzelka, K.; Vizzari, M.; Bieda, A. Assessing the Perception of Urban Landscape from the Perspective of Residents of Multi-Storey Buildings. Cities 2026, 169, 106594. [Google Scholar] [CrossRef]
- Kim, S.; Choi, J.; Kang, Y. Modeling and Explaining Perceived Fear of Crime from Street View Imagery Using a GeoAI Framework. ISPRS Int. J. Geo-Inf. 2025, 15, 18. [Google Scholar] [CrossRef]
- Luo, J.; Zhao, T.; Cao, L.; Biljecki, F. Water View Imagery: Perception and Evaluation of Urban Waterscapes Worldwide. Ecol. Indic. 2022, 145, 109615. [Google Scholar] [CrossRef]
- Xu, Y.; Fan, X. Street View Image-Based Emotional Perception Modeling of Old Residential Communities: An Explainable Framework Integrating Random Forest and SHAP. ISPRS Int. J. Geo-Inf. 2025, 14, 471. [Google Scholar] [CrossRef]
- Zhu, Y.; Su, F.; Han, X.; Fu, Q.; Liu, J. Uncovering the Drivers of Gender Inequality in Perceptions of Safety: An Interdisciplinary Approach Combining Street View Imagery, Socio-Economic Data and Spatial Statistical Modelling. Int. J. Appl. Earth Obs. Geoinf. 2024, 134, 104230. [Google Scholar] [CrossRef]
- Pan, C.; Li, H.; Wang, L.; Wu, J.; Guo, J.; Qiu, N.; Liu, X. Data Science Basis and Influencing Factors for the Evaluation of Environmental Safety Perception in Macau Parishes. Adv. Contin. Discret. Model. 2024, 44. [Google Scholar] [CrossRef]
- Han, X.; Wang, L.; He, J.; Jung, T. Restorative Perception of Urban Streets: Interpretation Using Deep Learning and MGWR Models. Front. Public Health 2023, 11, 1141630. [Google Scholar] [CrossRef] [PubMed]
- Florio, P.; Leduc, T.; Sutter, Y.; Brémond, R. Visual Complexity of Urban Streetscapes: Human vs Computer Vision. Mach. Vis. Appl. 2024, 35, 7. [Google Scholar] [CrossRef]
- Wei, L.; Bizjak, G.; Kobav, M. Evaluating the Impact of Road Lighting on Pedestrian Reassurance through the Day-Dark Approach. Light. Res. Technol. 2025, 57, 264–277. [Google Scholar] [CrossRef]
- Li, Y.; Xu, B.; Liu, Y. A Study on the Visual Comfort of Urban Building Colors under Overcast and Rainy Weather. Buildings 2024, 14, 1552. [Google Scholar] [CrossRef]
- Ding, P.; Jensen, F.S.; Carstensen, T.A.; Jørgensen, G. Exploring Adults’ Passive Experience of Children Playing in Cities: Case Study of Five Urban Public Open Spaces in Copenhagen, Denmark. Cities 2023, 136, 104250. [Google Scholar] [CrossRef]
- Duan, Y.; Li, S. Effects of Plant Communities on Human Physiological Recovery and Emotional Reactions: A Comparative Onsite Survey and Photo Elicitation Study. Int. J. Environ. Res. Public. Health 2022, 19, 721. [Google Scholar] [CrossRef] [PubMed]
- Delclòs-Alió, X.; Den Hoed, W. Perceptions of Potential Cycling Infrastructure in a Low-Cycling Context: Evidence from a Medium-Sized Urban Area. Int. J. Sustain. Transp. 2024, 18, 999–1011. [Google Scholar] [CrossRef]
- Switalski, M.; Van Strien, M.; Grêt-Regamey, A. Measuring Place Rather than Space: Integrating Landscape Qualities for the Urban–Rural Gradient Using People’s Perceptions and Machine Learning. J. Land Use Sci. 2025, 20, 61–81. [Google Scholar] [CrossRef]
- Sun, D.; Li, Q.; Gao, W.; Huang, G.; Tang, N.; Lyu, M.; Yu, Y. On the Relation between Visual Quality and Landscape Characteristics: A Case Study Application to the Waterfront Linear Parks in Shenyang, China. Environ. Res. Commun. 2021, 3, 115013. [Google Scholar] [CrossRef]
- Fumagalli, N.; Maccarini, M.; Rovelli, R.; Berto, R.; Senes, G. An Exploratory Study of Users’ Preference for Different Planting Combinations along Rural Greenways. Sustainability 2020, 12, 2120. [Google Scholar] [CrossRef]
- Garrido-Velarde, J.; Montero-Parejo, M.J.; Hernández-Blanco, J.; García-Moruno, L. Visual Analysis of the Height Ratio between Building and Background Vegetation. Two Rural Cases of Study: Spain and Sweden. Sustainability 2018, 10, 2593. [Google Scholar] [CrossRef]
- Garrido Velarde, J.; Montero Parejo, M.J.; Hernández Blanco, J.; García Moruno, L. Using Native Vegetation Screens to Lessen the Visual Impact of Rural Buildings in the Sierras de Béjar and Francia Biosphere Reserve: Case Studies and Public Survey. Sustainability 2019, 11, 2595. [Google Scholar] [CrossRef]
- Liu, J.; Green, R.J. Green Connections: Children’s Experiences with Nature and Perceived Psychological Well-Being in Beijing, China. Urban For. Urban Green. 2025, 109, 128823. [Google Scholar] [CrossRef]
- Li, C.; Li, P.; Huang, X. Liked and Disliked Streetscape Imagery: Relation to Emotional Motivation and Block Distribution From Tourist Bus Visitors. Sage Open 2022, 12, 21582440221117129. [Google Scholar] [CrossRef]
- Zhuang, J.; Qiao, L.; Zhang, X.; Su, Y.; Xia, Y. Effects of Visual Attributes of Flower Borders in Urban Vegetation Landscapes on Aesthetic Preference and Emotional Perception. Int. J. Environ. Res. Public. Health 2021, 18, 9318. [Google Scholar] [CrossRef] [PubMed]
- Zhang, Y.; Lai, N.; Ye, E.; Zhou, H.; You, X.; Dong, J. Balancing Landscape and Purification in Urban Aquatic Horticulture: Selection Strategies Based on Public Perception. Horticulturae 2025, 11, 1044. [Google Scholar] [CrossRef]
- Al-Saedi, D.F.S.; Chamani, A. Integrating Public Perception and Quantitative Metrics for Improved Urban Park Planning in Isfahan, Iran. Trees For. People 2024, 18, 100729. [Google Scholar] [CrossRef]
- Tsiakiris, G.; Rahm, J.; Hedblom, M.; Johansson, M. The Perception of Walking on an Urban Forest Path in Daylight and under Electric Lighting. Trees For. People 2025, 22, 101012. [Google Scholar] [CrossRef]
- Eroğlu, E.; Acar, C. A Visual Assessment of Roadside Poplar Plantings in Turkey. Tarım Bilim. Derg. 2018, 185–198. [Google Scholar] [CrossRef]
- Kim, S.S.; Lee, J.-S.; Lee, D.H.; Choi, Y. Citizens’ Preference and Perception of Street Trees of Main Boulevards in Busan, South Korea. Sustainability 2021, 13, 3141. [Google Scholar] [CrossRef]
- Hoyle, H.; Hitchmough, J.; Jorgensen, A. Attractive, Climate-Adapted and Sustainable? Public Perception of Non-Native Planting in the Designed Urban Landscape. Landsc. Urban Plan. 2017, 164, 49–63. [Google Scholar] [CrossRef]
- Lusk, A.C.; Da Silva Filho, D.F.; Dobbert, L. Pedestrian and Cyclist Preferences for Tree Locations by Sidewalks and Cycle Tracks and Associated Benefits: Worldwide Implications from a Study in Boston, MA. Cities 2020, 106, 102111. [Google Scholar] [CrossRef]
- Hoyle, H.; Norton, B.; Dunnett, N.; Richards, J.P.; Russell, J.M.; Warren, P. Plant Species or Flower Colour Diversity? Identifying the Drivers of Public and Invertebrate Response to Designed Annual Meadows. Landsc. Urban Plan. 2018, 180, 103–113. [Google Scholar] [CrossRef]
- Paddle, E.; Gilliland, J. Orange Is the New Green: Exploring the Restorative Capacity of Seasonal Foliage in Schoolyard Trees. Int. J. Environ. Res. Public. Health 2016, 13, 497. [Google Scholar] [CrossRef] [PubMed]
- Jakstis, K.; Dubovik, M.; Laikari, A.; Mustajärvi, K.; Wendling, L.; Fischer, L.K. Informing the Design of Urban Green and Blue Spaces through an Understanding of Europeans’ Usage and Preferences. People Nat. 2023, 5, 162–182. [Google Scholar] [CrossRef]
- Hughes, J.P.; Lengieza, M.L.; Knight, G. Beauty Not Sustainability: Support for Mowing and Rewilding Is Most Influenced by Subjective Visual Appeal Not Ecological Friendliness. Urban For. Urban Green. 2025, 113, 129076. [Google Scholar] [CrossRef]
- She, J.; Wu, R.; Pi, B.; Huang, J.; Bao, Z. Emotional State as a Key Driver of Public Preferences for Flower Color. Horticulturae 2025, 11, 54. [Google Scholar] [CrossRef]
- Cureau, R.J.; Pigliautile, I.; Kousis, I.; Pisello, A.L. Multi-Domain Human-Oriented Approach to Evaluate Human Comfort in Outdoor Environments. Int. J. Biometeorol. 2022, 66, 2033–2045. [Google Scholar] [CrossRef] [PubMed]
- Salak, B.; Trummer, J.; Hegetschweiler, K.T.; Fraefel, M.; Wunderlich, A.C.; Bauer, N.; Troll, H.; Hunziker, M. Integrating Physical and Social Variables to Enhance Understanding of Urban Forestry Key-Indicators: Insights from a Socio-Cultural Forest Monitoring. Urban For. Urban Green. 2026, 118, 129311. [Google Scholar] [CrossRef]
- Salesses, M.P. Place Pulse : Measuring the Collaborative Image of the City. MS thesis, Massachusetts Institute of Technology, 2012. [Google Scholar]
- Watson, D.; Clark, L.A.; Tellegen, A. Development and Validation of Brief Measures of Positive and Negative Affect: The PANAS Scales. J. Pers. Soc. Psychol. 1988, 54, 1063–1070. [Google Scholar] [CrossRef] [PubMed]
- Chamberlain, A.; Crabtree, A.; Rodden, T.; Jones, M.; Rogers, Y. Research in the Wild: Understanding “in the Wild” Approaches to Design and Development. Proceedings of Designing Interactive Systems Conference, June 11 2012; ACM: Newcastle Upon Tyne United Kingdom; pp. 795–796. [Google Scholar]
- Numan, W.; Kahlon, Y.; Fujii, H.; Oki, T. Divergent Environmental Evaluation Patterns in Immersive Virtual vs. Physical Outdoor Environments: Towards Informing Architectural Design in VR. J. Archit. Plan. Trans. AIJ 2026, 91, 1617–1628. [Google Scholar] [CrossRef]
- Findlay, J.N. Philosophical Investigations. By Ludwig Wittgenstein. German Text with English Translation by G. E. M. Anscombe. (Basil Blackwell, Oxford. 1953. Pp. x + Xe, 232 + 232e. Price 37s. 6d.). Philosophy 1955, 30, 173–179. [Google Scholar] [CrossRef]
- Evans, V. How Words Mean: Lexical Concepts, Cognitive Models, and Meaning Construction; Oxford linguistics: Oxford; Oxford university press, 2009; ISBN 978-0-19-923466-0. [Google Scholar]
- Nguyen-Tran, K.; Kahlon, Y.; Oki, T.; Marsatyasti, N.; Murata, R.; Fujii, H. Exploring Users’ Visual Impression of a Japanese Streetscape by Correlating Attention With Speech. Utilizing Eye-Tracking Technology for Computer-Aided Architectural Planning. In Proceedings of the 27th International Conference of the Association for ComputerAided Architectural Design Research in Asia (CAADRIA), Sydney, Australia, 2022; pp. 475–484. [Google Scholar]
- Fujii, H. MAAI: Dynamic Equilibrium in Architecture. New Gener. Comput. 2019, 37, 285–305. [Google Scholar] [CrossRef]
- Kellert, S.R.; Calabrese, E.F. The Practice of Biophilic Design; 2015. [Google Scholar]
- Gillis, K.; Gatersleben, B. A Review of Psychological Literature on the Health and Wellbeing Benefits of Biophilic Design. Buildings 2015, 5, 948–963. [Google Scholar] [CrossRef]
- Barrett, L.F. Valence Is a Basic Building Block of Emotional Life. J. Res. Personal. 2006, 40, 35–55. [Google Scholar] [CrossRef]
- Goh, J.O.; Park, D.C. Culture Sculpts the Perceptual Brain. In Progress in Brain Research; Elsevier, 2009; Vol. 178, pp. 95–111. ISBN 978-0-444-53361-6. [Google Scholar]
Figure 1.
Information flow in paper selection.
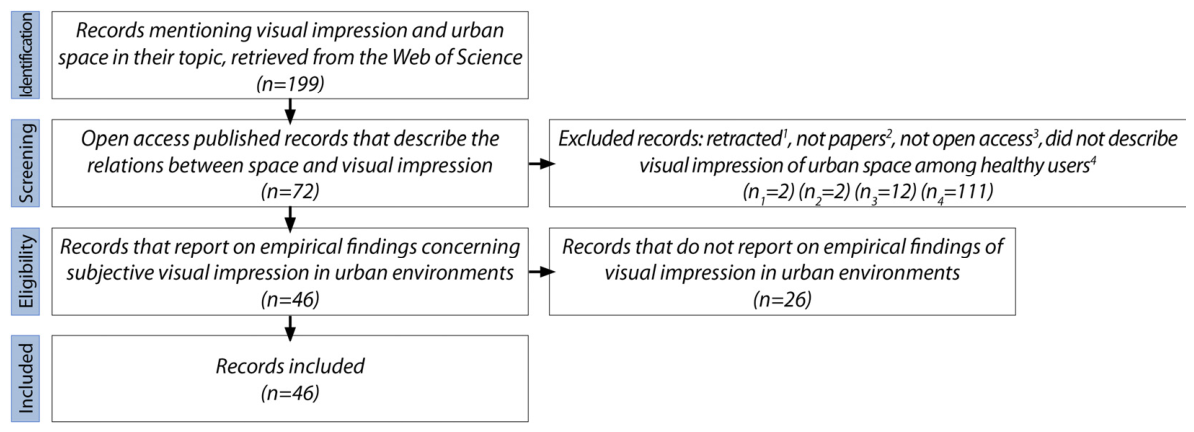
Figure 2.
Distribution of surveyed works in terms of research focus.
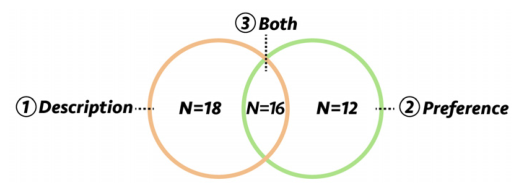
Figure 3.
Distribution of works investigating preference in terms of the visual object studied.

Figure 4.
Stimuli types and methods used for extracting users’ visual impression.
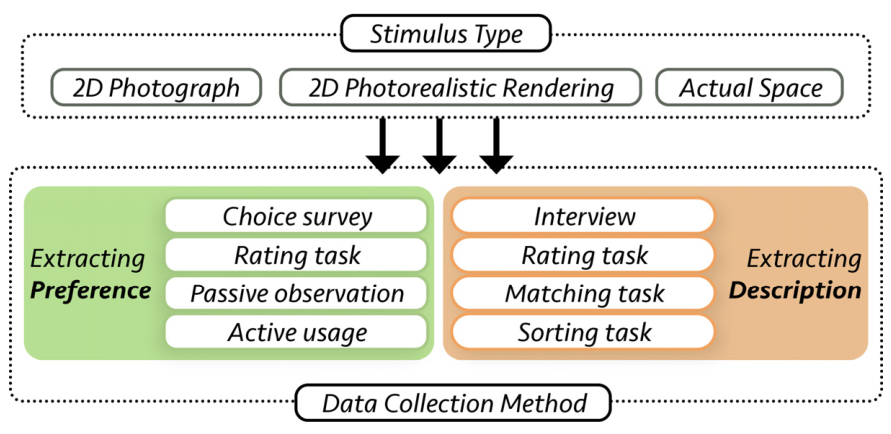
Figure 5.
Occurrences of verbal descriptions investigated by the surveyed studies.
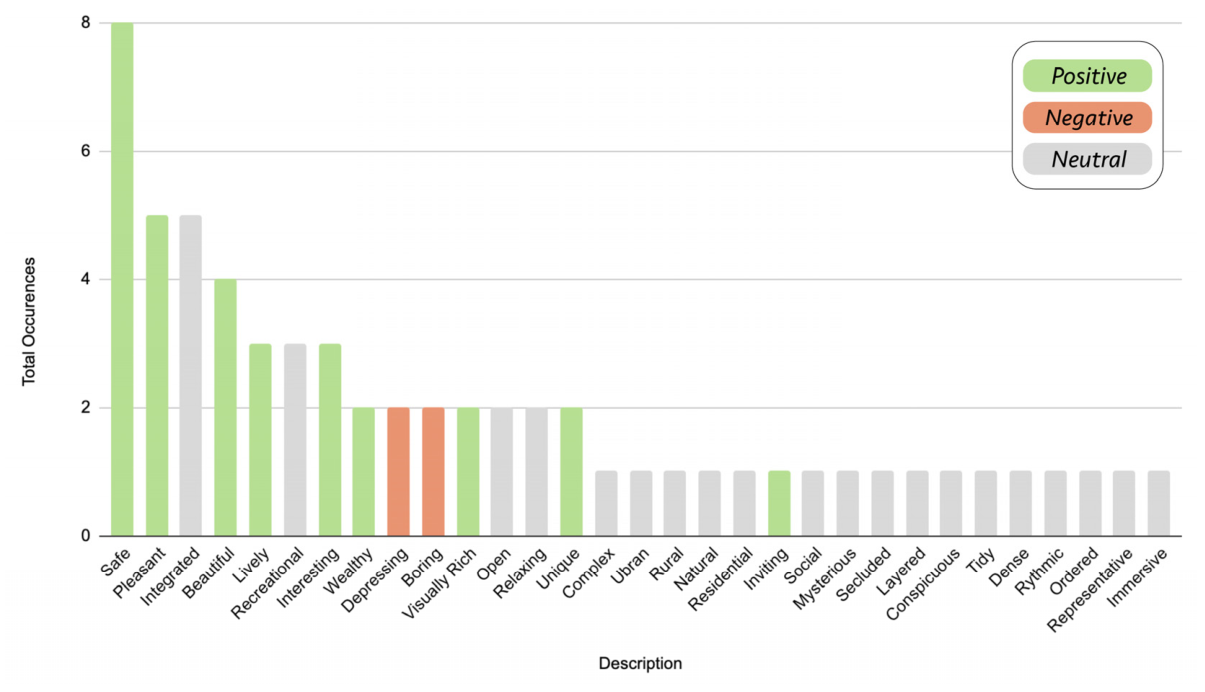
Table 1.
Summary of information extracted from surveyed records.
| Dimension | RQ | Information | Explanation/Comment |
| Purpose | 1 | Goal pursued | The relationship between impression and visual features researchers are trying to extract |
| Method | 2 | Data used | The data used in the empirical investigation (questionnaire/interview/etc.) |
| Method | 2 | Focused variables | The subjective experiences (i.e. “openness”) and visual features that were investigated |
| Results | 3 | Findings reported | Empirical findings concerning the relationship between the focused variables |
Table 2.
Inter-rater agreement for relevant items.
| Related Question | Category | Agreement (Team A) | Agreement (Team B) | Agreement (Overall) |
| RQ1 | Research Focus | 89.13% | 86.95% | 88.04% |
| RQ2 | Stimulus Type | 95.65% | 100% | 97.82% |
Table 3.
Studies investigating users’ preference of urban environments.
| ID | Title (abbr.) | 1st Author | Source | Environment | Element |
| 1 | Assessing the recrea-… | Buckwitz | [26] | Urban forest | - |
| 2 | Scenic Influences… | Zou | [30] | Urban forest | - |
| 3 | How do forest… | Trummer | [31] | Urban forest | - |
| 4 | Perception of the | Poje | [32] | Urban green space | - |
| 5 | Urban green space… | Arnberger | [33] | Urban green space | - |
| 6 | Designing Perennial… | Shi | [34] | Peren. landscape | - |
| 7 | Which Factors Affect… | Zheng | [35] | River greenway | - |
| 8 | Photographic… | Cortesao | [29] | Streetscape | - |
| 9 | Energy crops in… | Sikorska | [36] | Urban park | Energy crops |
| 10 | Assessing the perce-… | Pilarczyk | [37] | Urban landscape | Buildings |
| 11 | Experts vs the Public… | Hamza | [28] | Landscape (diverse) | Wind turbines |
| 12 | Do Looks Matter?… | Vanstockem | [27] | Unspecified | Green roofs |
Table 4.
Studies investigating verbal descriptions or urban environments.
| ID | Title (abbr.) | 1st Author | Source | Environment/ Element | Aspect Investigated |
| 1 | Modeling and... | Kim | [38] | Streetscape | Safety |
| 2 | Street View... | Xu | [40] | Streetscape | Diverse |
| 3 | Uncovering the... | Zhu | [41] | Streetscape | Safety |
| 4 | Data science... | Pan | [42] | Streetscape | Safety |
| 5 | Restorative... | Han | [43] | Streetscape | Restorativeness |
| 6 | Visual complexity... | Florio | [44] | Streetscape | Visual Complexity |
| 7 | Evaluating the... | Wei | [45] | Road environs. | Safety |
| 8 | A Study on the... | Li | [46] | Buildings | Visual comfort |
| 9 | Exploring adults'... | Ding | [47] | Open space | Pleasantness |
| 10 | Effects of Plant... | Duan | [48] | Vegetation | Restorativeness |
| 11 | Water View... | Luo | [39] | Waterscape | Diverse |
| 12 | Perceptions of... | Delclos-Alio | [49] | Infrastructure | Visual comfort |
| 13 | Measuring place... | Switalski | [50] | City (diverse) | Diverse |
| 14 | On the relation... | Sun | [51] | Watersc., parks | Diverse |
| 15 | An Exploratory... | Fumagalli | [52] | Greenway | Restorativeness |
| 16 | Visual Analysis... | Garrido | [53] | Buil., landscape | Integration/fit |
| 17 | Using Native... | Garrido | [54] | Buil., landscape | Integration/fit |
| 18 | Green connections... | Liu | [55] | Outdoor env. | Restorativeness |
Table 5.
Hybrid studies investigating both verbal description and preference.
| ID | Title (abbr.) | 1st Author | Src. | Environment/ Element | Aspect Investigated |
| 1 | Liked and Disliked... | Li | [56] | Streetscape | Diverse |
| 2 | Effects of Visual... | Zhuang | [57] | Flower borders | Diverse |
| 3 | Balancing Landscape... | Zhang | [58] | Aquatic horti. | Diverse |
| 4 | Integrating public... | Al-Saedi | [59] | Urban parks | Satisfaction |
| 5 | The perception... | Tsiakiris | [60] | Urban forest | Restorativeness |
| 6 | A Visual Assessment... | Eroglu | [61] | Urban corridors | Diverse |
| 7 | Citizens' Preference... | Kim | [62] | Trees | Diverse |
| 8 | Attractive, climate... | Hoyle | [63] | Non-native plants | Naturalness |
| 9 | Pedestrian and... | Lusk | [64] | Trees (cycl. Lanes) | Diverse |
| 10 | Plant species... | Hoyle | [65] | Urban meadow | Diverse |
| 11 | Orange Is the... | Paddle | [66] | Trees, (school) | Restorativeness |
| 12 | Informing the... | Jakstis | [67] | Green/blue spaces | Restorativeness |
| 13 | Beauty not... | Hughes | [68] | Urban green space | Diverse |
| 14 | Which Factors... | Zheng | [35] | Greenway | Diverse |
| 15 | Emotional State as... | She | [69] | Vegetation | Diverse |
| 16 | Multi-domain... | Cureau | [70] | Parks | Comfort |
| 17 | Integrating physical... | Salak | [71] | Urban forest | Diverse |
Table 6.
Linking preferences to visual features: effects of of element presence.
| Environment | Sub-type | Desirable Element | Source |
| Urban green space | Urban park | Energy crops | [36] |
| Urban forest | Deadwood (absence), shade, shrubs | [31] | |
| Recreational trail | Forest background | [31] | |
| Streetscape | Sidewalk, cycle tracks | Trees | [64] |
| Other | Landscape, seascape | Wind turbines | [28] |
Table 7.
Hierarchy among elements in terms of their desirability.
| Environment | Sub-type | Desirable Element | As compared with | Source |
| Urban green space | Urban forest | Daylight | Artificial lighting | [60] |
| Schoolyard | Leafy trees | Leafless trees | [66] | |
| Urban woodland | Non-native plants | Native plants | [63] | |
| - | Blue/white flowers | Red/orange flowers | [69] | |
| - | Trees | Shrubs, hedges, flower beds, lawns | [32] | |
| - | Structurally diverse and natural green elements | Structurally similar and artificial green elements | [67] | |
| Streetscape | Main boulevard | Yoshino cherry trees, trident maple trees | Japanese black pine tree, maidenhair tree, saw-leaf zelkova | [62] |
| - | Indirect daylight | Direct daylight | [29] | |
| - | Cultural/heritage street | Construction site, modern buildings | [56] | |
| Other | Road corridors | Seasonally diverse trees | Evergreen trees | [61] |
| Urban aquatic horticulture | Flowering plants | Non-flowering plants | [58] | |
| - | Open space, natural elements | Closed space, artificial elements | [37] |
Table 8.
Desirable features of visual elements.
| Environment | Sub-type | Element | Desirable Features |
| Park size | Up to ~15 ha | ||
| Park perimeter | Simple shape | ||
| Urban green space | Urban park | Vegetation | High density, healthy |
| Flowers | High color diversity | ||
| Urban forest | Tree stands | Diverse | |
| Ground vegetation | Medium amount | ||
| Deadwood | High amount | ||
| Cover | Continuous | ||
| Recreational trail | Vegetation | Moderate distance | |
| Traffic | Low | ||
| Greenway | Greenery | High amount | |
| - | Green roof | Continuous surface | |
| Meadows/lawns | Neat | ||
| Other | Road corridors | Trees | Dense, near road, season. diverse |
| Other | - | Flower border | Green/cool color, high brightness, high contrast, many plant patches |
Table 9.
Links visual verbal descriptions and visual features.
| Description /Feature | Environment | Positive Contributors | Negative Contributors |
| Safe | Streetscape | High proportion of open/accessible areas, urbanization, living amenities, natural environment, street color, edges, high proportion of trees, greenery, daytime (min. illuminance ~1.8 lx), high green visibility, dynamic elements (boats, people, vehicles) | Enclosed/unmanaged elements (walls, poles, alleys), tourists spots, points of interest, dense buildings, roads, sidewalks, vehicles, and people, dark environment |
| Urban forest | Daylight | - | |
| Complex | Streetscape | Fragmented regions, high contrast, sharp edges, high variability of color/luminance | - |
| Integrated | Rural buildings | Background vegetation reaches 0–50% of building height, trees reach 40-50% coverage, climbers reach 70-80% coverage | vegetation exceeding building height (>100%) |
| Pleasant, Comforta. | Public open space | Adults’ passive experience of children playing | - |
| Buildings | Higher color value (mid–high range), moderate value contrast, low chroma | - | |
| Cycling track | Trees with low bushes placed between the cycle track and the street | ||
| Restorative, calming | Schoolyards | Schoolyards with trees in leaf, seasonal variation in foliage | - |
| Urban green space | Unstructured experiences of nature | - | |
| Rural greenway | Opportunities for social and physical activity, planting variety | - | |
| Urban forest | Daylight | - | |
| Urban park | Plant type (single layer grassland) | - | |
| Streetscape | Vegetation | fences | |
| Designed meadow | High level of care | - | |
| Neat/clean | Urban green space | Mowing | Construction sites |
| Legible | Streetscape | - | Construction sites |
| Lively, rich | Streetscape | Moderate enclosure, high visual diversity, high green visibility, dynamic elements (boats, people, vehicles) | - |
Disclaimer/Publisher’s Note: The statements, opinions and data contained in all publications are solely those of the individual author(s) and contributor(s) and not of MDPI and/or the editor(s). MDPI and/or the editor(s) disclaim responsibility for any injury to people or property resulting from any ideas, methods, instructions or products referred to in the content. |
© 2026 by the authors. Licensee MDPI, Basel, Switzerland. This article is an open access article distributed under the terms and conditions of the Creative Commons Attribution (CC BY) license.
Copyright: This open access article is published under a Creative Commons CC BY 4.0 license, which permit the free download, distribution, and reuse, provided that the author and preprint are cited in any reuse.


