
Submitted:
21 July 2026
Posted:
22 July 2026
You are already at the latest version
Abstract
Small multirotor UAVs frequently operate in crosswind conditions, yet the aerodynamic interaction between windward and leeward propeller pairs remains incompletely understood. This study investigates the performance of a quadcopter propeller system under lateral crosswind using steadystate RANS simulations with the Transition SST turbulence model, validated against wind tunnel measurements (thrust and torque deviations within 5.4%). A parametric matrix of five rotational speeds (8,000 − 12,000 RPM) and six freestream velocities (0 − 10 m/s) is systematically examined. While thrust and power coefficients of all propellers increase monotonically with freestream velocity, the figure of merit (FM) of leeward propellers exhibits a previously unreported non-monotonic response: it decreases from hover, reaches a minimum near 6 m/s, and partially recovers at higher velocities. Windward propellers show no such degradation. Our velocity contour and streamline analyses reveal that this behaviour originates from windward wake ingestion into the leeward inflow region, which peaks at intermediate freestream velocities and is progressively alleviated as the stronger crosswind convects the wake downstream. The non-monotonic FM response is therefore a direct consequence of the competition between wake-induced inflow degradation and freestreamdriven aerodynamic augmentation. Our findings provide a systematic aerodynamic dataset essential for crosswind attitude control and propulsion system design in multirotor UAVs.
Keywords:
UAVs
; aerodynamics
; CFD
; propeller
; drones
1. Introduction
Small multirotor unmanned aerial vehicles (UAVs) have seen rapid growth in commercial and research deployment over the past decade, with applications spanning aerial photography, agricultural monitoring, infrastructure inspection, search and rescue, and logistics [1,2,3]. Among multirotor configurations, the quadcopter is the most widely adopted platform owing to its mechanical simplicity, payload versatility, and ease of autonomous control [4,5]. In practice, quadcopters routinely operate in environments subject to atmospheric wind disturbances, as well as ground- and wall-proximity effects [6]. Crosswind conditions impose a lateral freestream velocity on the rotor system, fundamentally altering the inflow environment relative to still-air hover and creating aerodynamic asymmetry between propeller pairs. Understanding the aerodynamic response of the quadcopter propeller system to such conditions is therefore essential for robust propulsion system design and effective crosswind attitude control [7,8,9]. The aerodynamics of isolated propellers under axial and non-axial inflow have been studied extensively. Leishman [10] provides a foundational treatment of rotor aerodynamics, establishing momentum theory and blade element methods that underpin modern propeller analysis. Building on this foundation, blade element momentum theory has since been extended with dedicated low-Reynolds-number corrections for stall delay, tip loss, and three-dimensional flow effects, substantially improving efficiency predictions for small UAV propellers relative to uncorrected formulations [11,12].
For small-scale UAV rotors operating at low Reynolds numbers, the aerodynamic behaviour departs from classical rotor theory due to laminar-to-turbulent boundary-layer transition on the blade surfaces. Liu et al. [13] compared blade element momentum theory, actuator disk, and full computational fluid dynamics (CFD) approaches for a small multirotor propeller, demonstrating that Reynolds-averaged Navier–Stokes (RANS)-based CFD provides the most physically consistent predictions of thrust and power across varying rotational speeds and onset flow conditions. A recent benchmarking study by Goyal et al. [14] further compared blade element, vortex-based, and RANS-based CFD aerodynamic models for isolated propellers operating at both positive and negative thrust, reinforcing the reliability of RANS predictions relative to lower-fidelity approaches. In a related study, Liu et al. [15] experimentally and numerically examined the overlapping effect in compact multirotor configurations, showing that coaxial thrust loss can reach up to and decreases linearly with increasing lateral offset between rotors. The Transition Shear Stress Transport (SST) turbulence model [16], which extends the k-omega SST formulation of Menter [17] by incorporating laminar-to-turbulent intermittency equations, has been shown to improve predictive accuracy over fully turbulent closures for propeller flows at low Reynolds numbers and has been widely adopted in small-scale propeller simulations [18,19]. Propeller rotation is commonly modelled using the Multiple Reference Frame (MRF) approach [20], which solves the flow within each rotating domain in a rotating reference frame while the surrounding domain remains stationary, providing an efficient steady-state approximation suitable for parametric studies. This approach has been applied in propeller and multirotor simulations [13,21], and its validity for steady-state aerodynamic performance prediction has been established in the literature [22]. The influence of a lateral freestream on propeller performance has received increasing attention. Zhang et al. [23] found that lateral wind reduced single-propeller thrust at rotational speeds above revolutions per minute (RPM), with the effect dependent on wind velocity. Kartal and Feyzioğlu [24] similarly reported a direct correlation between rotational speed and aerodynamic loading for a quadcopter propeller across a wide RPM range using combined experimental and CFD analysis, though without considering an external crosswind. Lei et al. [25] showed that crosswinds can produce both beneficial and detrimental effects on quadcopter thrust depending on rotor spacing and wind speed. Murakami et al. [26] investigated crossflow effects on multirotor propellers and reported that low-velocity crosswinds reduced the figure of merit while high-velocity crosswinds increased it, highlighting the non-trivial relationship between freestream velocity and propeller efficiency. Rubin and Zhao [27] further extended classical actuator disk theory to account for propellers operating at incidence, demonstrating that the thrust increase with angle of attack results primarily from a wing-equivalent lift component, providing a theoretical basis for understanding crosswind-induced loading changes. More recently, Chae et al. [28] used wind-tunnel velocity and force measurements to show that rotor-rotor interaction in a small tandem rotor pair under crosswind depends strongly on crosswind speed and inter-rotor distance, with the front rotor wake partially shielding the rear rotor from the crosswind. These findings collectively underscore that the aerodynamic response to lateral flow is highly non-linear, yet the inter-rotor wake interaction mechanism under varying crosswind velocities remains incompletely characterized.
Rotor-to-rotor aerodynamic interactions in multirotor systems have been the subject of extensive investigation. Intaratep et al. [29] demonstrated experimentally that inter-rotor interactions reduced quadcopter thrust by for two propellers and for four propellers relative to scaled single-rotor performance. Shukla and Komerath [30] showed that small propeller separations at low Reynolds numbers produced adverse blade-vortex interactions, while Lei and Wang [31] numerically identified an optimal hub-to-hub separation of for hover efficiency. Barcelos et al. [32] employed potential flow theory to examine aerodynamic interactions in quadcopter configurations, reporting that diamond layouts achieve up to higher rotor efficiency compared with square layouts. Beyond quadcopter geometries, propeller-propeller interference has also been extensively examined for eVTOL and distributed-propulsion configurations: Zhou et al. [33] documented rotor-to-rotor interaction for small UAV propellers experimentally, Stokkermans et al. [34] and de Vries et al. [35] characterized interaction effects between propellers in typical eVTOL arrangements, and Piccinini et al. [36] and Zanotti and co-workers [37,38] quantified thrust and power losses of up to 40% for tandem and side-by-side propeller pairs using mid-fidelity and high-fidelity numerical methods. Arslan et al. [39] further investigated the aerodynamic interference between vertically aligned quadcopters at varying rotor speeds and separation distances, demonstrating that both rotational speed and inter-rotor spacing significantly influence the magnitude of thrust degradation in the downstream rotor. Liu et al. [15] additionally demonstrated that the thrust loss in a coaxial arrangement reaches up to and decreases linearly as the lateral offset between rotors increases. In forward flight, Yoon et al. [40] and Ko and Lee [41] found that downstream rotors consistently experienced reduced thrust due to wake ingestion from upstream rotors, while Combey et al. [42] reported thrust losses of up to and power losses of up to 20% in multirotor forward and transition flight.
Studies directly addressing the three-blade quadcopter crosswind problem are comparatively limited. Misiorowski et al. [43] examined rotor interactional effects for a quadcopter in edgewise flight using high-fidelity CFD, identifying super-vortex structures that cause lateral wake displacement. Oo et al. [18] investigated turbulent onset flow effects on two horizontally placed UAV rotors and found that the figure of merit of the downstream rotor decreased under onset flow conditions, attributing this to absorption of the upstream wake into the downstream inflow. Dougherty et al. [19] extended this to a full quadcopter configuration, showing that front propeller increased while back propeller decreased under a fixed onset flow, with the velocity of onset flow identified as the dominant performance driver relative to turbulence intensity. In a related experimental study, Liu et al. [44] characterized the aerodynamic interference between two rotors at varying lateral and axial separations under hovering, vertical, and horizontal flight conditions using combined wind-tunnel and CFD analysis, revealing a significant wake interaction region within 1D to 3D beneath the upper rotor and a corresponding thrust-coefficient reduction of up to 45%. Liu et al. [15] additionally examined the aerodynamic performance of the multirotor overlapping effect, providing quantitative thrust loss estimates applicable to compact quadcopter designs. However, none of these studies examined the velocity-dependent evolution of inter-rotor wake interaction across a wide parametric range of both rotational speed and freestream velocity, and the non-monotonic figure of merit response reported in the present work has not previously been identified.
The present work addresses this gap by conducting a systematic parametric CFD investigation of a full quadcopter configuration across a matrix of five rotational speeds from to and 6 freestream velocities from to . The Transition SST turbulence model and MRF approach are employed, with the numerical framework validated against wind tunnel measurements of an isolated Gemfan 7037 three-blade propeller. The central finding is a non-monotonic figure of merit response in leeward propellers, characterized by an efficiency dip at intermediate crosswind velocities that is identified as a direct consequence of windward wake ingestion. This mechanism and its velocity-dependent attenuation are documented through thrust and power coefficient analysis, three-dimensional streamline visualization, and axial velocity contour analysis at the inflow and downwash planes.
2. Experimental Materials and Numerical Methods
2.1. Propeller Geometry
The propeller investigated in this study, Gemfan 7037, is a commercially available three-blade rotor with a nominal diameter of , a geometric pitch of , and a propeller radius of . The blades are manufactured from reinforced carbon nylon, with a hub thickness of and a maximum blade chord length of . Three-blade propellers are widely employed in small-scale multirotor UAV applications due to their favorable compromise between thrust generation, aerodynamic efficiency, and dynamic balance [19]. As no manufacturer-supplied computer-aided design (CAD) geometry was available, the physical propeller was digitized using a Kreon Laser Line Scanner equipped with a Skyline measuring arm and Solano Blue 3D scanner which has a documented measurement accuracy of , ensuring high geometric fidelity of the acquired surface data. The scanning process generated a high-resolution surface mesh, which was subsequently imported into SolidWorks for geometric reconstruction.
Cross-sectional slice planes were created at uniform radial intervals normal to the blade span, from which two-dimensional airfoil profiles were extracted. Spline curves were fitted to each sectional profile and subsequently lofted along the spanwise direction to reconstruct the blade geometry. The hub and hub cap geometries were then incorporated through an iterative refinement process to produce the final solid CAD model. A visual comparison between the reconstructed CAD model and the physical propeller is presented in Figure 1. The normalized chord length () and geometric pitch angle distributions along the blade span are presented as functions of the normalized radial position () in Figure 2. These distributions provide a quantitative description of the blade geometry and demonstrate that the reconstructed CAD model accurately represents the physical propeller. The chord length at the radial station, , and is used as the reference length for defining the relative mesh element sizes in the subsequent meshing process.
2.2. Numerical Simulation Setup
The numerical methodology follows the domain structure and modelling approach established by Oo et al. [18] and Dougherty et al. [19] for propeller simulations of similar scale. This section describes the computational domain, mesh generation, mesh independence study, solver settings, and the parametric simulation matrix.
2.2.1. Computational Domains
The computational domain consists of an outer stationary fluid region and one or four inner rotating zones, each enclosing a propeller. This type of domain decomposition is widely used in propeller CFD simulations. The outer domain is a cubic box with a side length of . Each inner rotating region is modelled as a cylindrical volume with a radius of and a height of , centered on the propeller hub. The rotor disk plane is positioned asymmetrically within the cylinder, with clearance to the top surface and to the bottom surface. Propeller rotation is modelled using the MRF approach, where the flow within each inner region is solved in a rotating reference frame, while the outer region is solved in a stationary frame. This method provides an efficient steady-state approximation of rotor aerodynamics and is widely used for multirotor simulations [45,46,47]. Two configurations are considered: a single-propeller setup for mesh independence and validation cases, and a four-propeller configuration for crosswind studies. In the quadcopter arrangement, the propeller hubs are spaced at in a square layout. A Cartesian coordinate system is adopted. The origin is located at the hub centre of rotor 1. The Y-axis is defined as the vertical direction, and the flight direction is aligned with the positive X-axis. The hub centres of the four rotors are positioned at and . Rotors located at form the windward pair, while those at form the leeward pair. A uniform freestream velocity is imposed in the negative Z-direction for crosswind cases. Boundary conditions are defined as follows: the bottom face of the outer domain is specified as a velocity inlet, while the top face is set as a zero-gauge pressure outlet. Free-slip conditions are applied on all lateral boundaries of the outer domain. No-slip conditions are imposed on all blade surfaces. For still-air conditions, the inlet velocity is set to zero. For crosswind cases, a uniform inlet velocity of 2, 4, 6, 8, or is applied from the bottom face as indicated in Figure 3.
2.2.2. Mesh Generation
All meshes were generated using ANSYS Meshing. A multi-region meshing strategy with progressively refined resolution is employed. The outer domain is discretised using a patch-conforming method with a maximum element size of . A body of influence (BOI) is defined in the wake region beneath each propeller to enhance the resolution of tip vortices and wake development, with a maximum element size of (). The rotating domains are meshed using surface sizing applied to the cylindrical interfaces. The mesh resolution across the rotating–stationary interfaces is carefully controlled to maintain a limited size ratio to ensure numerical stability and solution accuracy. On the blade surfaces, a refined face sizing is applied with a maximum element size of (), significantly smaller than the interface mesh to adequately resolve near-blade flow features. A prism inflation layer system with 10 layers is used to resolve the boundary layer, with a (first-layer height, and a growth rate of , resulting in a wall-normal resolution of approximately at spanwise location. This satisfies the requirements of the Transition SST turbulence model, which requires the first cell centre to be located within the viscous sublayer (). The overall mesh topology is illustrated in Figure 4, showing: (a) the full computational domain, (b) a rotor-plane cross-section, (c) the BOI and interface region, and (d) blade boundary layer inflation.
2.2.3. Mesh Independence Studies
A mesh independence study was conducted using the single-propeller configuration operating at . Six mesh levels were generated by simultaneously refining the blade surface mesh, rotating domain interface mesh, and body-of-influence (BOI) region. The resulting thrust, , and aerodynamic torque, , were monitored for each mesh level. The mesh convergence results are presented in Figure 5. Both thrust and torque approach asymptotic values as the mesh density increases. Differences between the medium and fine meshes are below in thrust and in torque, indicating that further refinement has a negligible influence on the predicted aerodynamic performance. The medium mesh, containing approximately 1.3 million cells, was therefore selected for all subsequent simulations to balance computational cost and solution accuracy.
2.2.4. Solvers Setting
All simulations were performed in ANSYS Fluent 2024 R2 using the steady-state, pressure-based solver with the Coupled pressure-velocity coupling scheme. Spatial discretization employed the Least Squares Cell Based gradient method, second-order pressure interpolation, and second-order upwind schemes for momentum, turbulent kinetic energy, specific dissipation rate, intermittency, and momentum-thickness Reynolds number.
The four-equation Transition SST turbulence model was selected for all cases. This model extends the k-omega SST formulation of Menter [17,48] by adding an intermittency equation and a transition onset criterion expressed in terms of the momentum-thickness Reynolds number. The additional equations enable prediction of laminar-to-turbulent boundary-layer transition on the blade surfaces. The SST formulation itself employs the k-epsilon model in the freestream away from walls and switches to the k-omega model in the near-wall region, combining the strengths of both approaches. The Transition SST model is therefore more physically appropriate than a fully turbulent closure [16,49], which would omit the laminar portion of the boundary layer and potentially overestimate skin friction and underestimate separation behaviour. Convergence was monitored through both the scaled residuals of all governing equations and the thrust and torque on the propeller surfaces. Simulations were deemed converged when the scaled residuals of continuity, momentum, and all turbulence variables fell below . The inlet turbulence intensity was set to for all cases. The still-air condition uses a zero-velocity inlet.
2.2.5. Quadcopter Simulation Matrix
A total of 30 quadcopter simulations were performed, comprising five rotor speeds and six freestream velocity conditions. The rotor rotational speeds were selected as , and , covering the typical operating range of three-blade small multirotor UAVs during hover [50]. This range is consistent with the measured hover speed of the present quadcopter under no-wind conditions, which was determined through outdoor flight testing to be approximately , corresponding to a per-rotor thrust of approximately and a total vehicle thrust of . Freestream velocities of 0, 2, 4, 6, 8, and were considered to represent conditions ranging from still air to moderate crosswind environments. For each simulation case, all four propellers operated at the same rotational speed. Adjacent propellers rotated in opposite directions to maintain torque balance, following the conventional quadcopter configuration as shown in Figure 3. The aerodynamic performance of each propeller is characterized by three non-dimensional coefficients. The thrust coefficient and power coefficient are defined as:
where is the propeller thrust, is the aerodynamic torque, ω is the rotational speed in radians per second, n is the rotational speed in revolutions per second (rev/s), is the air density, and D is the propeller diameter. The figure of merit is introduced as a measure of hover efficiency, defined as the ratio of the ideal induced power to the actual shaft power:
2.3. Experimental Setup and Validation
Experiments were conducted on an isolated propeller operating under still-air conditions to provide validation data for the CFD model. This approach follows the validation methodology applied in comparable studies, where computational thrust and torque predictions for an isolated propeller are compared against load-cell measurements across multiple rotational speeds. The propeller and motor were mounted on an aluminum support structure that positioned the propeller disk at the centre of the test section, with sufficient clearance from the walls and floor to avoid ground effect and wall interference. The structure was attached to an ATI Axia 80 M2 six-axis force and torque sensor, which simultaneously recorded thrust and aerodynamic torque. Data was sampled over 30 seconds at each operating condition, and time-averaged values were used as the representative steady-state results. Rotational speed was controlled by sending pulse-width modulation (PWM) signals to an electronic speed controller (ESC) connected to the brushless motor. The actual rotational speed was verified at each test point using a laser tachometer. Five rotational speeds were tested: 8,000, 9,000, 10,000, 11,000, and , corresponding to the conditions used in the single-propeller CFD simulations. The sensor was reset to its origin before each test ran to minimize systematic drift. A schematic diagram and photograph of the experimental apparatus are shown in Figure 6. Figure 7 presents a comparison of the numerically predicted and experimentally measured thrust and aerodynamic torque across the five tested rotational speeds. Both thrust and torque increase monotonically with rotational speed, consistent with the quadratic dependence on rotor speed predicted by propeller theory. The CFD results show good agreement with the experimental data across the full speed range, with a maximum deviation of 3.8% in thrust and in torque. These levels of agreement confirm that the present numerical framework, including the Transition SST turbulence model, MRF approach, and mesh configuration, accurately predicts the aerodynamic performance of the Gemfan 7037 propeller. The validated single-propeller model is therefore extended with confidence to the four-rotor quadcopter configuration for the parametric crosswind study.
3. Numerical and Experimental Results
3.1. Aerodynamic Coefficients Under Crosswind Conditions
A study of the thrust coefficient , power coefficient , and figure of merit for the windward propellers (2 and 4) and leeward propellers (1 and 3) across freestream velocities from 0 to at five rotational speeds is presented in Figure 8. Both and increase monotonically with for all propellers and settings, reflecting the additional momentum exchange induced by the crosswind. At a given , rises more steeply at higher rotational speeds, consistent with the stronger rotor-induced velocity dominating the inflow momentum. The distributions show a similar trend, with leeward propellers exhibiting marginally larger increases at high , suggesting greater aerodynamic loading asymmetry between the two propeller pairs.
The behavior, however, diverges markedly between windward and leeward propellers. For windward propellers (Figure 8e), increases monotonically with , indicating that the onset flow augments inflow momentum without disrupting propeller efficiency. For leeward propellers (Figure 8f), exhibits a non-monotonic response, it initially decreases from hover, reaches a local minimum near = , and subsequently recovers at higher velocities. This behavior is most pronounced at , where drops by approximately 0.03 between = 0 and before partially recovering at . The suppression of at intermediate crosswind velocities, while and both increase, implies a disproportionate rise in power consumption relative to thrust, a signature of degraded inflow quality rather than reduced aerodynamic loading.
3.2. Flow Field Structure and Wake Ingestion
To identify the physical mechanism underlying the leeward deficit, the three-dimensional flow structure was examined through velocity streamlines at = 6 and in Figure 9. At , the wake from windward propellers is deflected downstream at a shallow angle, with a portion of the wake trajectory intersecting the inflow region of the leeward propellers. At , the stronger freestream convects the wake further downstream, reducing the spatial overlap between the windward wake and the leeward inflow planes. This qualitative observation is consistent with the recovery seen in Figure 8f at higher velocities and motivates a more detailed examination of the velocity distribution at various locations.
Figure 10 and Figure 11 present the vertical velocity component on cross-sectional slices at five streamwise stations ( = to ) for = 6 and respectively, together with corresponding streamwise velocity profiles sampled at 17 points per plane. At = 6 m/s, pronounced negative regions are visible directly upstream of the leeward propellers, indicating downward-directed wake impinging on the leeward inflow. The profiles at = -1 and 0 deviate substantially from the freestream reference, with local velocity deficits centered near = 0 at the leeward rotor disk locations. At , the negative regions are displaced further downstream and the profiles return closer to the freestream distribution, confirming reduced wake ingestion. These observations directly support the trend in Figure 8f: maximum wake ingestion at coincides with the minimum, while the recovery at corresponds to wake convection past the leeward disks.
3.3. Inflow Plane Velocity Distribution
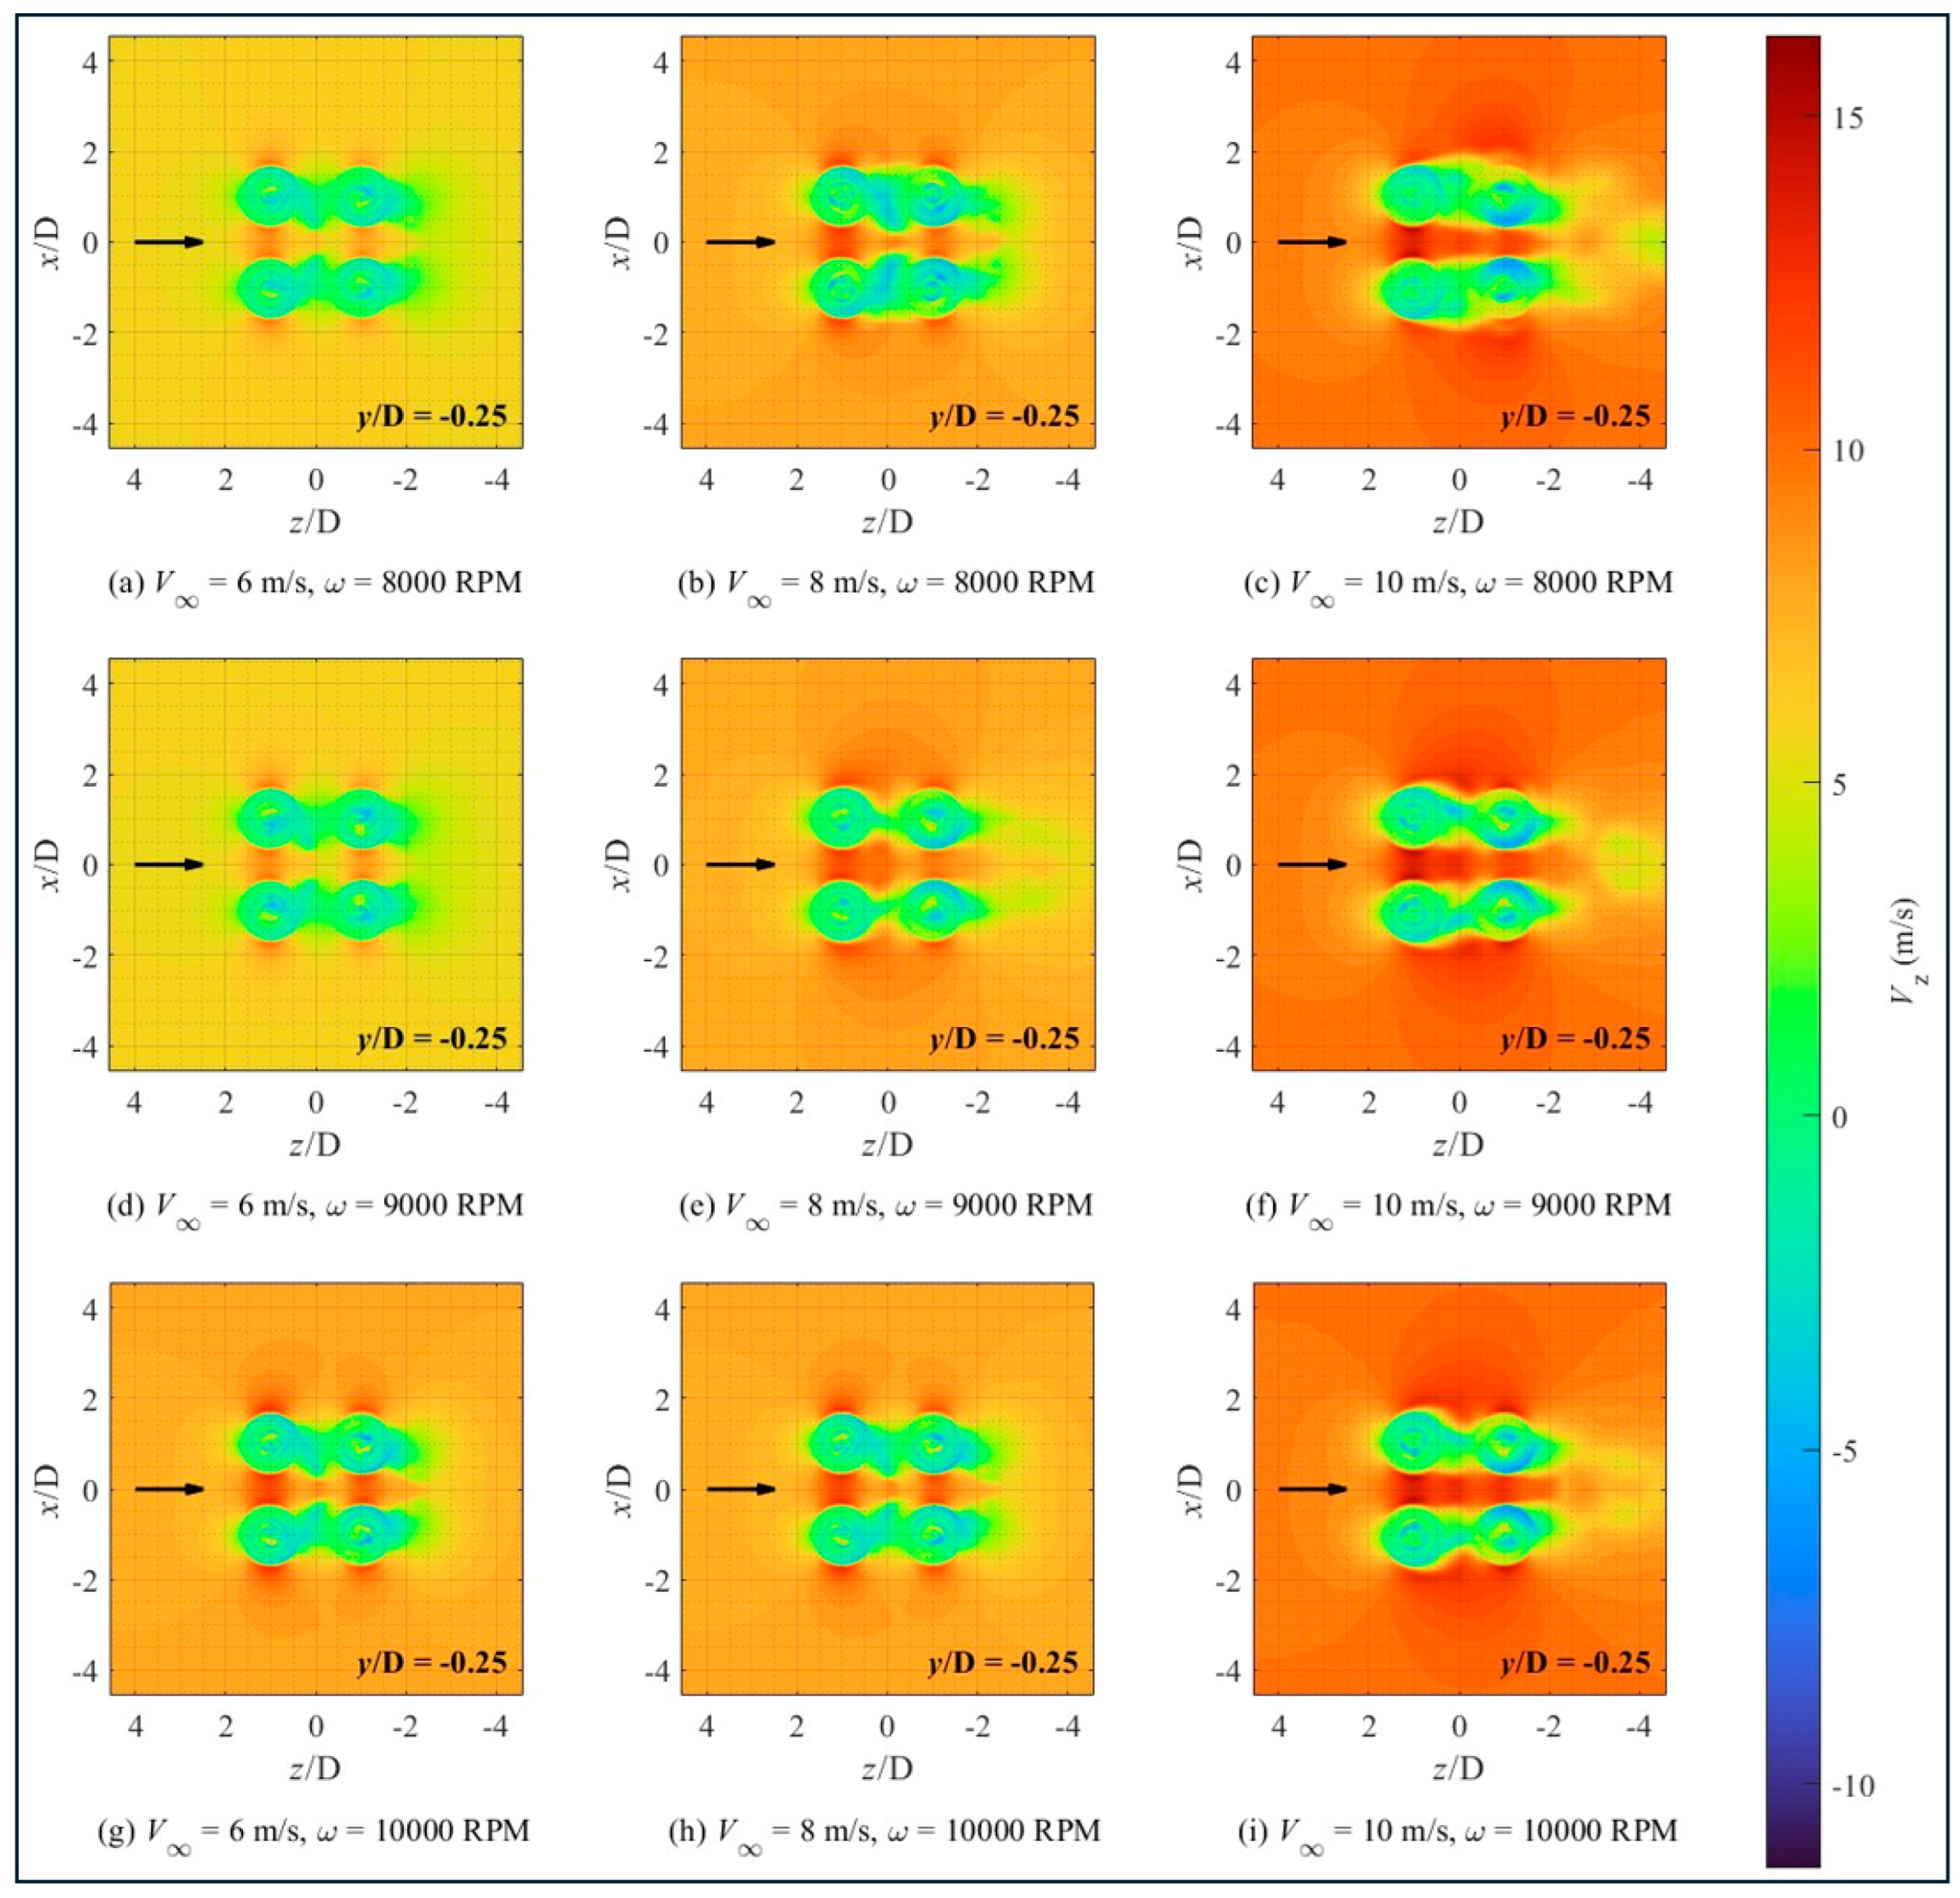
Figure 12 and Figure 13 present contours of the axial velocity component at planes located 0.23D above ( = +0.23) and below ( = −0.23) the rotor disk, corresponding to the inflow and downwash planes respectively, across = 6, 8, and 10 m/s at 8,000, 9,000, and .
In the inflow plane (Figure 12), the most prominent feature is the evolution of inflow non-uniformity at the leeward rotors ( ≈ 0) with increasing . At = 6 m/s (subplots a, d, g), a region of substantially reduced or locally reversed is visible on the windward side of the leeward rotor disks, indicating that the wake shed by the windward rotors has been laterally deflected by the freestream into the inflow region of the leeward rotors. The windward rotors ( ≈ 2), by contrast, exhibit uniform inflow distributions under all conditions with no evidence of upstream wake contamination. As increases from 6 to 10 m/s, the low- contamination region at the leeward disks progressively contracts and becomes largely absent at = 10 m/s (subplots c, f, i), indicating that the windward wake has been convected clear of the leeward inflow region. The effect of rotational speed on inflow distortion is secondary: at the contaminated area is marginally larger than at , consistent with the lower induced velocity at reduced providing less resistance to lateral wake deflection.
In the downwash plane (Figure 13), the most diagnostically significant observation is the asymmetric and attenuated downwash structure of the leeward rotors at = 6 m/s. Compared to the windward rotors, whose downwash contours remain approximately circular with well-defined high- cores throughout, the leeward rotor downwash regions are elongated toward the windward side and exhibit a markedly weaker axial velocity core, directly reflecting the reduced axial momentum output resulting from degraded inflow quality. The windward rotor downwash contours remain symmetric across all conditions, with the high- core intensifying with and expanding slightly with , consistent with normal aerodynamic gains at higher advance ratios. At = 10 m/s, the leeward downwash asymmetry partially recovers, though a residual windward side offset persists due to the continued lateral deflection of the wake by the freestream. Considered together, the inflow and downwash contours provide complementary flow-field evidence for the non-monotonic figure of merit behavior of the leeward rotors. At = 6 m/s, the leeward rotors simultaneously experience inflow contamination (Figure 12) and attenuated downwash (Figure 13), together reducing effective thrust generation efficiency and suppressing . As increases to , the windward wake is progressively convected clear of the leeward inflow region, partially restoring inflow quality, while the additional power demand imposed by the higher freestream velocity simultaneously increases. The non-monotonic behavior is therefore a direct consequence of the competing effects of wake-induced inflow degradation and freestream-driven aerodynamic augmentation.
3.4. Individual Propeller Thrust and Torque Response
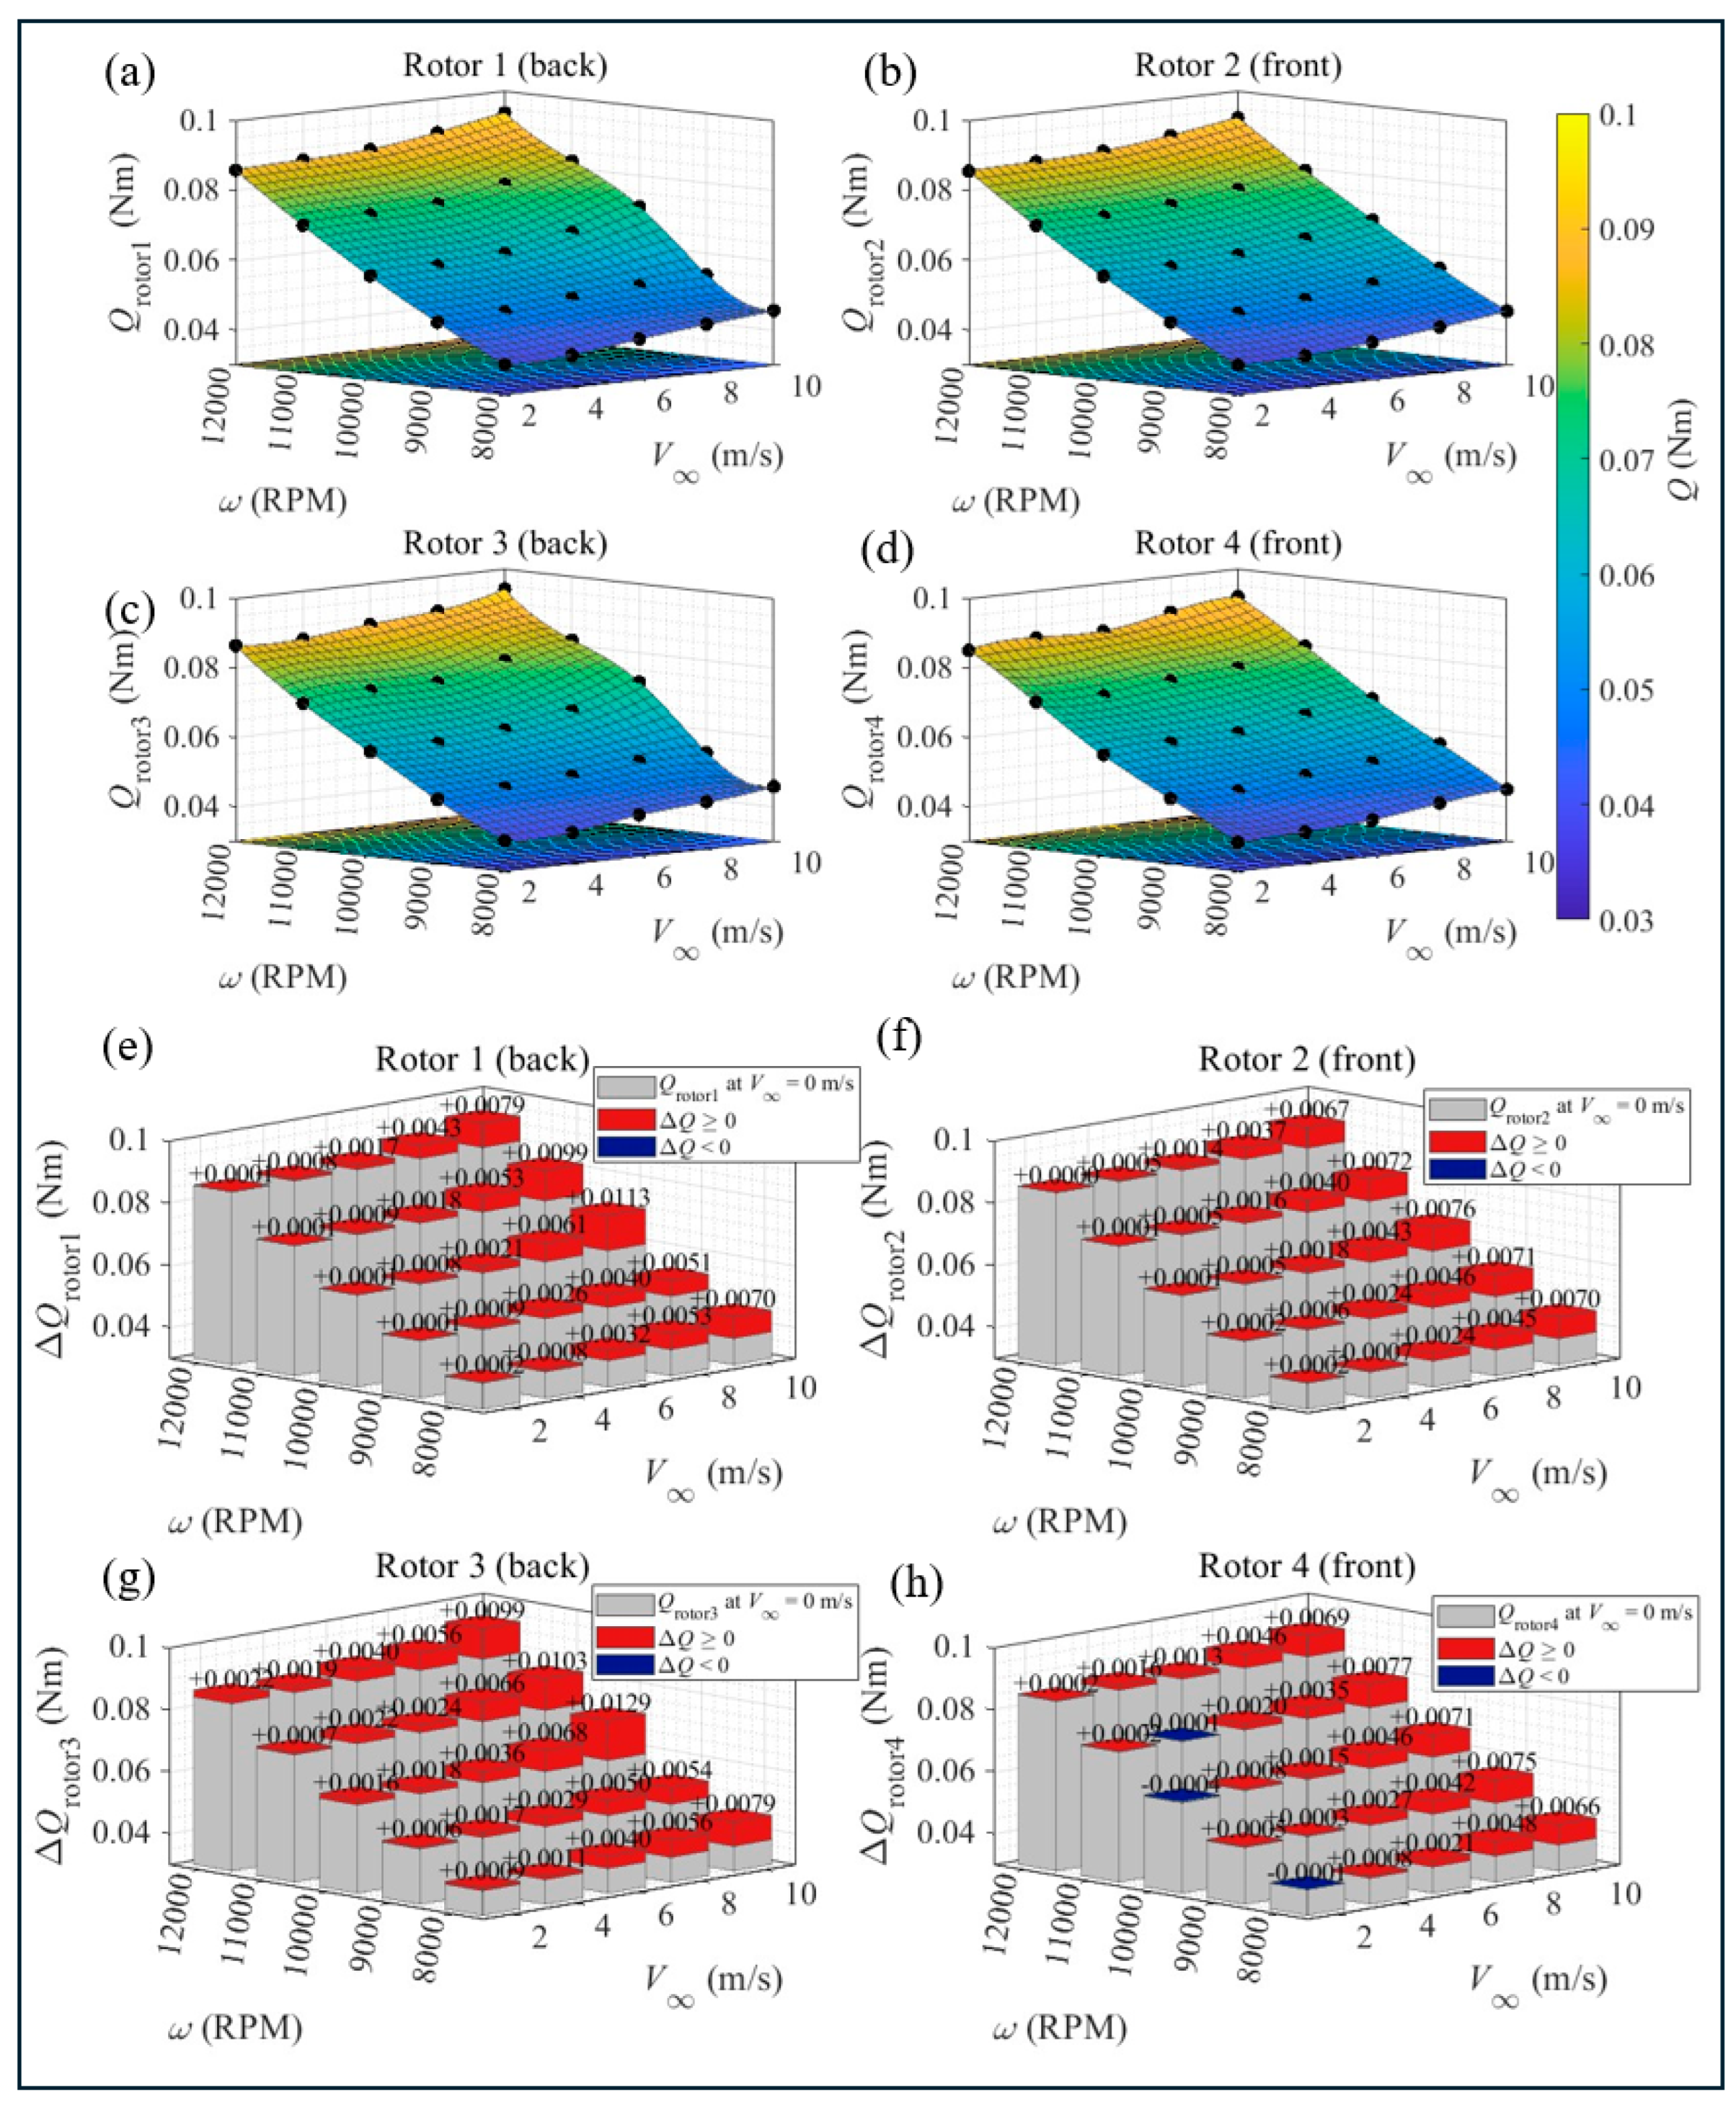
The absolute thrust and torque surfaces for each of the four propellers across the full –velocity parametric space, together with the incremental changes and relative to hover, are presented in Appendix B. Both thrust and torque increase monotonically with for all propellers across the parametric range. The distributions (Figure A1) reveal a systematic and persistent asymmetry between windward and leeward propellers. Windward propellers (2 and 4) consistently produce larger positive values than their leeward counterparts at equivalent and . At = 10 m/s and 8,000 , windward propellers reach peak increments of approximately N, while leeward propellers record increments of approximately N under the same conditions, a deficit of roughly 17%. This windward advantage persists across all settings and widens with increasing , indicating that the asymmetry is driven by the freestream itself rather than by rotational speed alone. The distributions (Figure A2) exhibit a structurally similar asymmetry. Windward propellers show larger torque increments with increasing , while leeward propellers exhibit smaller values and, near-zero or slightly negative increments across multiple settings at . The suppression of in the leeward pair at low freestream velocities is physically consistent with the thrust suppression: a reduced effective angle of attack lowers both the lift and drag components of the blade section force, simultaneously reducing thrust and resistive torque. This co-suppression of and in the leeward propellers is therefore a direct aerodynamic signature of wake ingestion rather than an artefact of mechanical or numerical origin.
The combined evidence from Figure 8, Figure 9, Figure 10, Figure 11, Figure 12 and Figure 13 and B1–B2 establishes that the non-monotonic behaviour of leeward propellers originates from windward wake ingestion, which peaks at intermediate freestream velocities and attenuates as increases. The windward propellers, operating in undisturbed flow, respond predictably to the crosswind, while the leeward propellers experience a transient aerodynamic degradation whose severity is governed by the balance between rotor-induced downwash velocity and freestream convection speed.
4. Discussion and Conclusions
In this work, we investigated the aerodynamic performance of a quadcopter propeller system under lateral crosswind conditions using steady-state RANS simulations validated against wind tunnel measurements, with maximum deviations of in thrust and in torque. The following main conclusions are drawn from our present work:
- Thrust and power coefficients of all propellers increase monotonically with the freestream velocity. Windward propellers consistently produce larger thrust increments than leeward propellers at equivalent crosswind speeds, indicating an inherent thrust asymmetry between propeller pairs under crosswind.
- Windward propeller increases monotonically with freestream velocity due to augmented inflow momentum. In contrast, leeward propellers exhibit a non-monotonic response: decreases from hover to a local minimum near , then partially recovers at higher velocities. This behaviour persists across all tested rotational speeds and is most pronounced at , with an drop of approximately 0.03.
- Our velocity contour and streamline analysis identifies windward wake ingestion as the governing mechanism. At , the windward wake intersects the leeward inflow region, producing axial velocity deficits and attenuated downwash at the leeward disks. As increases, the wake is progressively convected downstream, restoring leeward inflow quality and recovering . The non-monotonic response therefore reflects the competing effects of wake-induced inflow degradation at intermediate velocities and freestream-driven aerodynamic augmentation at higher velocities.
- The thrust and torque asymmetry documented here provides a quantitative basis for crosswind attitude control compensation. The velocity regime, where leeward efficiency is minimized, represents a critical operating condition requiring active control intervention to maintain stable hover and maneuvering performance. These findings provide a systematic aerodynamic dataset applicable to propulsion system design and flight control law development for multirotor UAVs operating in windy environments.
Author Contributions
Conceptualization, H.C. and D.Z.; methodology, H.C. and D.Z.; software, H.C. and D.Z.; validation, H.C. and X.L.; formal analysis, H.C.; investigation, H.C., D.Z., X.L. and J.G.; resources, D.Z.; data curation, H.C. and X.L.; writing—original draft preparation, H.C.; writing—review and editing, D.Z. and X.L.; visualization, H.C.; supervision, D.Z.; funding acquisition, D.Z. All authors have read and agreed to the published version of the manuscript.
Funding
The research reported in this article was financially supported by the University of Canterbury, New Zealand (No. 452DISDZ).
Data Availability Statement
The data that support the findings of this study are available from the corresponding author upon reasonable request.
Acknowledgments
The authors would like to thank the financial support by the University of Canterbury with the grant number 452DISDZ. HC would like to thank Jiaming Gao for his technical help and research support. The first author would like to thank Prof. D.Z. for this supervision.
Conflicts of Interest
The authors declare no conflict of interest.
Abbreviations
The following abbreviations are used in this manuscript:
| BOI | Body of influence |
| CAD | Computer-aided design |
| CFD | Computational fluid dynamics |
| ESC | Electronic speed controller |
| eVTOL | Electric vertical take-off and landing |
| MRF | Multiple reference frame |
| PWM | Pulse-width modulation |
| RANS | Reynolds-averaged Navier-Stokes |
| RPM | Revolutions per minute |
| SST | Shear stress transport |
| UAV | Unmanned aerial vehicle |
Appendix A
In the present study, the flow is assumed to be incompressible and statistically steady. The aerodynamic flow field around the UAV is governed by the incompressible Reynolds-averaged Navier–Stokes (RANS) equations coupled with the γ−Reθ transition SST turbulence model. The governing equations employed in the present simulations are summarized as follows.
Appendix A.1
Appendix A.2
Boussinesq’s Eddy-Viscosity Hypothesis
To close the RANS equations, the Reynolds stresses are modelled using Boussinesq’s eddy-viscosity hypothesis:
where is the turbulent eddy viscosity, is the turbulent kinetic energy, and is the Kronecker delta, while is the mean strain-rate tensor defined as:
Appendix A.3
γ−Reθ Transition SST Turbulence Model
The γ−Reθ transition SST model developed by Langtry and Menter combines SST turbulence model with two additional transport equations for intermittency and transition momentum-thickness Reynolds number .
The transport equation for turbulent kinetic energy is written as:
The transport equation for the specific dissipation rate is expressed as:
where the turbulent viscosity is related to the turbulent kinetic energy and specific dissipation by:
The intermittent transport equation is written as:
The transport equation for the transition momentum-thickness Reynolds number is:
where is the specific dissipation rate, and denote the production and destruction terms of turbulent kinetic energy, respectively. represents the dissipation term in the specific dissipation-rate equation, while denotes the cross-diffusion term in the SST turbulence model. and are the intermittency production terms associated with transition onset and separation-induced transition, respectively, whereas and represent the corresponding destruction terms. is the source term governing the transport of the transition momentum-thickness Reynolds number. , , , and are model constants corresponding to the turbulent Prandtl numbers for the , intermittency and transition Reynolds-number equations, respectively. The terms and scale the production and destruction of the turbulent kinetic energy and are dependent on the intermittency as in Section 4.7.2 of the 2024 Ansys Fluent Theory Guide.
Appendix B
Individual Propeller Thrust/Torque Response across the RPM–velocity parametric space:
Figure A1.
(a-d) Thrust response of individual rotors across the RPM–velocity parametric space and (e-h) Absolute thrust increment relative to hover.
Figure A1.
(a-d) Thrust response of individual rotors across the RPM–velocity parametric space and (e-h) Absolute thrust increment relative to hover.
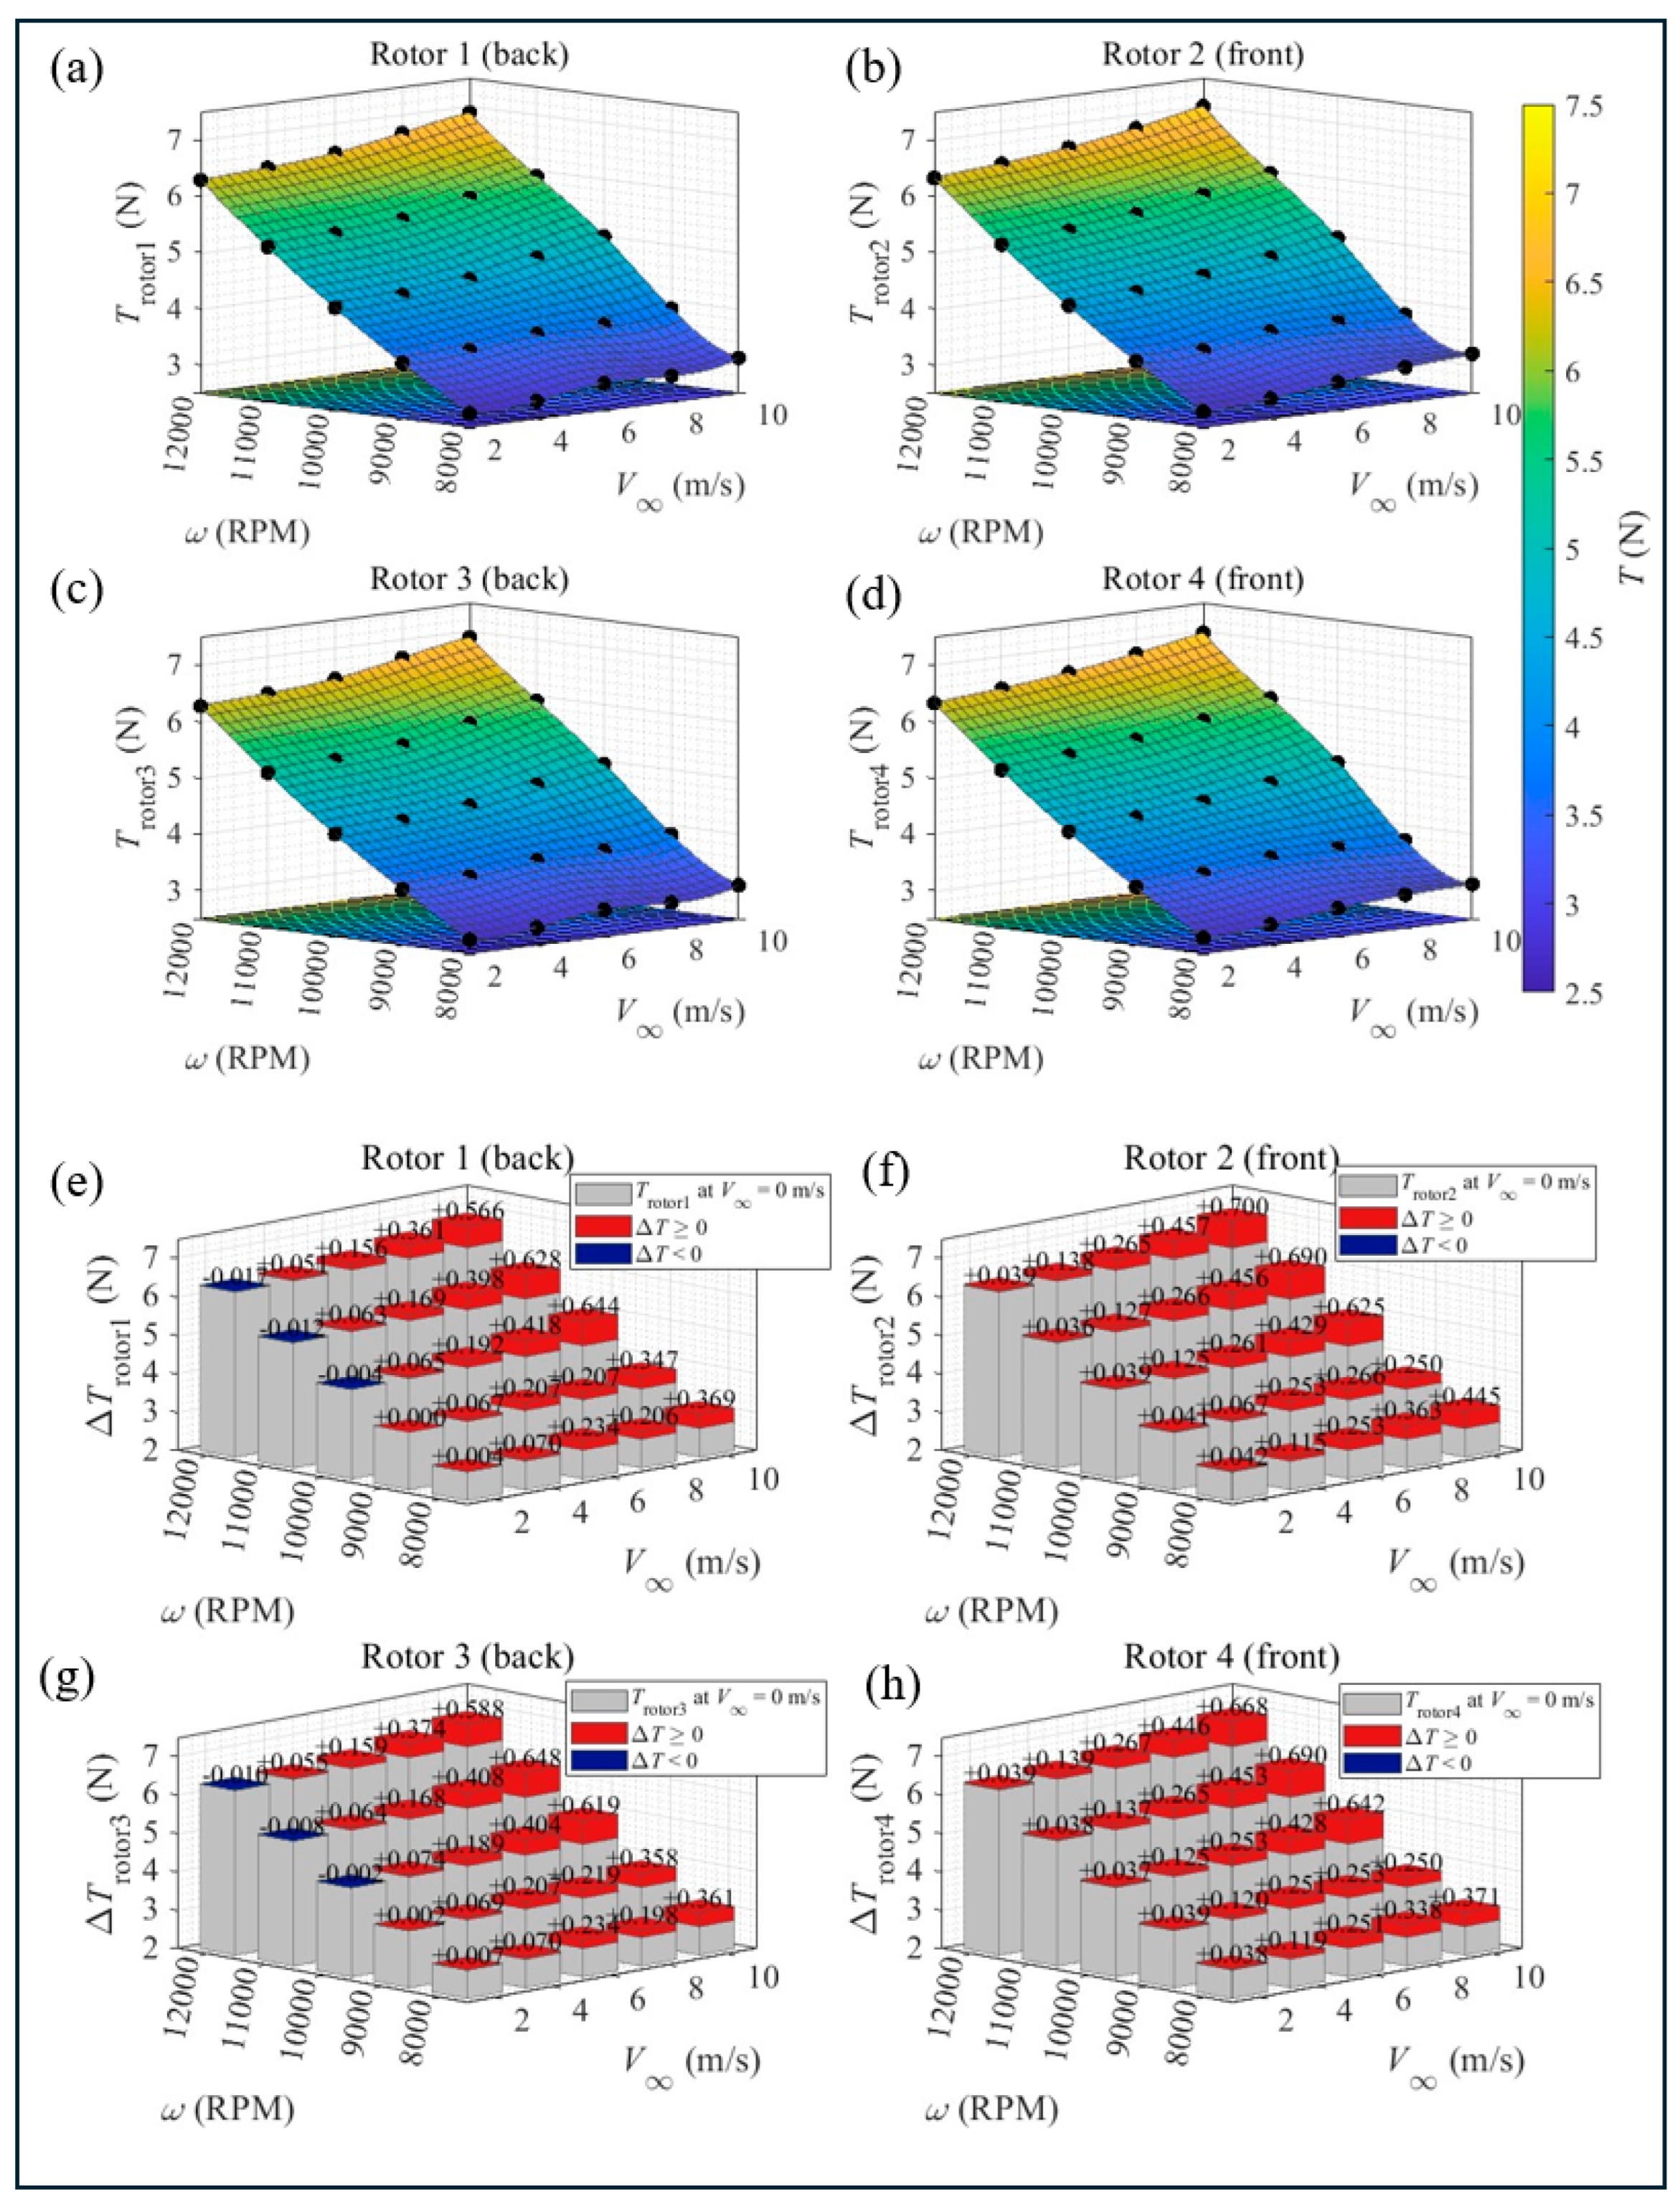
Figure A2.
(a-d) Torque response of individual rotors across the RPM–velocity parametric space and (e-h) Absolute torque increment relative to hover.
Figure A2.
(a-d) Torque response of individual rotors across the RPM–velocity parametric space and (e-h) Absolute torque increment relative to hover.
References
- Floreano, D.; Wood, R.J. Science, Technology and the Future of Small Autonomous Drones. Nature 2015, 521, 460–466. [Google Scholar] [CrossRef] [PubMed]
- Colomina, I.; Molina, P. Unmanned Aerial Systems for Photogrammetry and Remote Sensing: A Review. ISPRS J. Photogramm. Remote Sens. 2014, 92, 79–97. [Google Scholar] [CrossRef]
- Grand View Research. Drone Market Size, Share & Growth Report, 2026-2033; Grand View Research: San Francisco, CA, USA, 2026; Available online: https://www.grandviewresearch.com/industry-analysis/drone-market-report (accessed on 16 July 2026).
- Bangura, M.; Melega, M.; Naldi, R.; Mahony, R. Aerodynamics of Rotor Blades for Quadrotors. arXiv 2016, arXiv:1601.00733. [Google Scholar]
- Civil Aviation Authority of New Zealand. Part 101—Unmanned Aircraft (Including Balloons), Kites, and Rockets Operating Rules; Civil Aviation Rules; CAANZ: Wellington, New Zealand, 2021. [Google Scholar]
- Paz, C.; Suárez, E.; Gil, C. CFD Analysis of the Aerodynamic Effects on the Stability of the Flight of a Quadcopter UAV in the Proximity of Walls and Ground. J. Wind Eng. Ind. Aerodyn. 2020, 206, 104378. [Google Scholar] [CrossRef]
- Lei, Y.; Huang, Y.; Wang, H. Effects of Wind Disturbance on the Aerodynamic Performance of a Quadrotor MAV during Hovering. J. Sens. 2021, 2021, 6681716. [Google Scholar] [CrossRef]
- Throneberry, G.; Takeshita, A.; Hocut, C.M.; Shu, F.; Abdelkefi, A. Wake Propagation and Characteristics of a Multi-Rotor Unmanned Vehicle in Forward Flight. Drones 2022, 6, 130. [Google Scholar] [CrossRef]
- Craig, W.; Paley, D. Geometric Attitude and Position Control of a Quadrotor in Wind. J. Guid. Control Dyn. 2020, 43, 870–883. [Google Scholar] [CrossRef]
- Leishman, G.J. Principles of Helicopter Aerodynamics, 2nd ed.; Cambridge University Press: New York, NY, USA, 2006. [Google Scholar]
- MacNeill, R.; Verstraete, D. Blade Element Momentum Theory Extended to Model Low Reynolds Number Propeller Performance. Aeronaut. J. 2017, 121, 835–857. [Google Scholar] [CrossRef]
- McCrink, M.H.; Gregory, J.W. Blade Element Momentum Modeling of Low-Reynolds Electric Propulsion Systems. J. Aircr. 2017, 54, 163–176. [Google Scholar] [CrossRef]
- Liu, X.; Zhao, D.; Oo, N.L. Comparison Studies on Aerodynamic Performances of a Rotating Propeller for Small-Size UAVs. Aerosp. Sci. Technol. 2023, 133, 108148. [Google Scholar] [CrossRef]
- Goyal, J.; Sinnige, T.; Avallone, F.; Ferreira, C. Benchmarking of Aerodynamic Models for Isolated Propellers Operating at Positive and Negative Thrust. AIAA J. 2024, 62, 3758–3775. [Google Scholar] [CrossRef]
- Liu, X.; Zhao, D.; Oo, N.L. Experimental and Numerical Studies of the Multirotor Overlapping Effect on Aerodynamic Performances of Small-Size UAVs. In Proceedings of the AIAA AVIATION 2023 Forum, San Diego, CA, USA, 12–16 June 2023; p. 4463. [Google Scholar] [CrossRef]
- Langtry, R.B.; Menter, F.R. Correlation-Based Transition Modeling for Unstructured Parallelized Computational Fluid Dynamics Codes. AIAA J. 2009, 47, 2894–2906. [Google Scholar] [CrossRef]
- Menter, F.R. Two-Equation Eddy-Viscosity Turbulence Models for Engineering Applications. AIAA J. 1994, 32, 1598–1605. [Google Scholar] [CrossRef] [PubMed]
- Oo, N.L.; Zhao, D.; Sellier, M.; Liu, X. Experimental Investigation on Turbulence Effects on Unsteady Aerodynamics Performances of Two Horizontally Placed Small-Size UAV Rotors. Aerosp. Sci. Technol. 2023, 141, 108535. [Google Scholar] [CrossRef]
- Dougherty, S.; Oo, N.L.; Zhao, D. Effects of Propeller Separation and Onset Flow Condition on the Performance of Quadcopter Propellers. Aerosp. Sci. Technol. 2024, 145, 108837. [Google Scholar] [CrossRef]
- Luo, J.Y.; Gosman, A.D. Prediction of Impeller-Induced Flow in Mixing Vessels Using Multiple Frames of Reference. In Proceedings of the Institute of Chemical Engineers Symposium Series, Rugby, UK, 1994; Vol. 136, pp. 549–556. [Google Scholar]
- Pérez Gordillo, A.M.; Escobar, J.A.; Lopez Mejia, O.D. Influence of the Reynolds Number on the Aerodynamic Performance of a Small Rotor. Aerospace 2023, 10, 130. [Google Scholar] [CrossRef]
- Walvekar, O.; Chakravarthy, S. An Unsteady Reynolds–Averaged Navier–Stokes–Large Eddy Simulation Study of Propeller–Airframe Interaction in Distributed Electric Propulsion. Aerospace 2024, 11, 17. [Google Scholar] [CrossRef]
- Zhang, T.; Barakos, G.N.; Foster, M. Multi-Fidelity Aerodynamic Design and Analysis of Propellers for a Heavy-Lift eVTOL. Aerosp. Sci. Technol. 2023, 135, 108185. [Google Scholar] [CrossRef]
- Kartal, M.A.; Feyzioğlu, A. Aerodynamic Performance and Energy Modeling of a Quadcopter Drone at Different RPM: An Experimental and CFD Investigation of Future Design UAVs. Int. J. Low.-Carbon Technol. 2025, 20, 2026–2039. [Google Scholar] [CrossRef]
- Lei, Y.; Wang, J.; Li, Y. The Aerodynamic Performance of a Novel Overlapping Octocopter Considering Horizontal Wind. Aerospace 2023, 10, 902. [Google Scholar] [CrossRef]
- Murakami, M.; Abe, H.; Aono, H.; Ishikawa, H. Effects of Wind Environment on Propeller Performance of Multirotor Drone in Hover. In Proceedings of the ASME Fluids Engineering Division Summer Meeting, San Francisco, CA, USA, 28 July–1 August 2019; Vol. 59070, p. V004T04A004. [Google Scholar]
- Rubin, R.L.; Zhao, D. New Development of Classical Actuator Disk Model for Propellers at Incidence. AIAA J. 2021, 59, 1040–1054. [Google Scholar] [CrossRef]
- Chae, S.; Lee, S.; Hwang, S.; Jeong, S.; Kim, J. Effects of Rotor-Rotor Interaction for a Small Tandem Rotor Operating in a Crosswind. Phys. Fluids 2024, 36, 065147. [Google Scholar] [CrossRef]
- Intaratep, N.; Alexander, W.N.; Devenport, W.J.; Grace, S.M.; Dropkin, A. Experimental Study of Quadcopter Acoustics and Performance at Static Thrust Conditions. In Proceedings of the 22nd AIAA/CEAS Aeroacoustics Conference, Lyon, France, 30 May–1 June 2016; p. 2873. [Google Scholar] [CrossRef]
- Shukla, D.; Komerath, N. Multirotor Drone Aerodynamic Interaction Investigation. Drones 2018, 2, 43. [Google Scholar] [CrossRef]
- Lei, Y.; Wang, H. Aerodynamic Optimization of a Micro Quadrotor Aircraft with Different Rotor Spacings in Hover. Appl. Sci. 2020, 10, 1272. [Google Scholar] [CrossRef]
- Barcelos, D.; Kolaei, A.; Bramesfeld, G. Aerodynamic Interactions of Quadrotor Configurations. J. Aircr. 2020, 57, 1074–1090. [Google Scholar] [CrossRef]
- Zhou, W.; Ning, Z.; Li, H.; Hu, H. An Experimental Investigation on Rotor-to-Rotor Interactions of Small UAV Propellers. In Proceedings of the 35th AIAA Applied Aerodynamics Conference, Denver, CO, USA, 5–9 June 2017; p. 3744. [Google Scholar] [CrossRef]
- Stokkermans, T.C.A.; Usai, D.; Sinnige, T.; Veldhuis, L.L.M. Aerodynamic Interaction Effects Between Propellers in Typical eVTOL Vehicle Configurations. J. Aircr. 2021, 58, 815–833. [Google Scholar] [CrossRef]
- de Vries, R.; van Arnhem, N.; Sinnige, T.; Vos, R.; Veldhuis, L.L.M. Aerodynamic Interaction Between Propellers of a Distributed-Propulsion System in Forward Flight. Aerosp. Sci. Technol. 2021, 118, 107009. [Google Scholar] [CrossRef]
- Piccinini, R.; Tugnoli, M.; Zanotti, A. Numerical Investigation of the Rotor-Rotor Aerodynamic Interaction for eVTOL Aircraft Configurations. Energies 2020, 13, 5995. [Google Scholar] [CrossRef]
- Zanotti, A.; Algarotti, D. Aerodynamic Interaction Between Tandem Overlapping Propellers in eVTOL Airplane Mode Flight Condition. Aerosp. Sci. Technol. 2022, 124, 107518. [Google Scholar] [CrossRef]
- Zanotti, A.; Velo, A.; Pepe, C.; Savino, A.; Grassi, D.; Riccobene, L. Aerodynamic Interaction Between Tandem Propellers in eVTOL Transition Flight Configurations. Aerosp. Sci. Technol. 2024, 147, 109017. [Google Scholar] [CrossRef]
- Arslan, K.M.; Zhao, L.; Xue, K. Investigation of Aerodynamic Interference Between Vertically Aligned Quadcopters at Varying Rotor Speeds and Separations. Drones 2025, 9, 712. [Google Scholar] [CrossRef]
- Yoon, S.; Lee, H.C.; Pulliam, T.H. Computational Analysis of Multi-Rotor Flows. In Proceedings of the 54th AIAA Aerospace Sciences Meeting, San Diego, CA, USA, 4–8 January 2016; p. 0812. [Google Scholar] [CrossRef]
- Ko, J.; Lee, S. Quantification of Wake Interaction Effects on Multi-Rotor Configurations in Forward Flight. Aerosp. Sci. Technol. 2023, 135, 108188. [Google Scholar] [CrossRef]
- Combey, K.; Elsayed, O.A.; Qaissi, K.; Chouiyakh, H.; Mustapha, F. Numerical Analysis of Multirotor Aerodynamic Interactions in Forward and Transition Flight. J. Aircr. 2026, 63, 959–975. [Google Scholar] [CrossRef]
- Misiorowski, M.; Gandhi, F.; Oberai, A.A. Computational Study on Rotor Interactional Effects for a Quadcopter in Edgewise Flight. AIAA J. 2019, 57, 5309–5319. [Google Scholar] [CrossRef]
- Liu, C.; Li, B.; Wei, Z.; Zhang, Z.; Shan, Z.; Wang, Y. Effects of Wake Separation on Aerodynamic Interference Between Rotors in Urban Low-Altitude UAV Formation Flight. Aerospace 2024, 11, 865. [Google Scholar] [CrossRef]
- Hage, C.; Sophy, T.; Aglzim, E.H. CFD Analyses of the Aerodynamic Effects on a Quadcopter Propeller in the Proximity of Fixed and Horizontal Moving Obstacles. In Proceedings of the 14th International Conference on Mechanical and Intelligent Manufacturing Technologies (ICMIMT), Cape Town, South Africa, 25–27 May 2023; pp. 273–278. [Google Scholar] [CrossRef]
- Vikram, P.; Balasubramanian, E.; Manova, M.; Surendar, G. Aerodynamic Interaction Studies on Amphibious Vehicle in Forward and Hovering Flight. Int. J. Automot. Mech. Eng. 2019, 16, 7391–7412. [Google Scholar] [CrossRef]
- Liu, X.; Zhao, D.; Oo, N.L. CFD Investigation on Wind Power Harvesting from Small-Scale Wind Turbines for Powering Residential Buildings in New Zealand. J. R. Soc. N. Z. 2025, 55, 977–1004. [Google Scholar] [CrossRef] [PubMed]
- Menter, F.R.; Kuntz, M.; Langtry, R. Ten Years of Industrial Experience with the SST Turbulence Model. Turbul. Heat Mass Transf. 2003, 4, 625–632. [Google Scholar]
- Cheng, H.; Zhao, D.; Oo, N.L.; Liu, X.; Dong, X. Numerical Investigation on Intermittent Maximum Ice Accretion and Aerodynamic Performances of RG-15 Aerofoil at Low Reynolds Number. Aerospace 2024, 11, 7. [Google Scholar] [CrossRef]
- Grand View Research. Commercial Drone Market Size, Share & Trends Analysis Report; Grand View Research: San Francisco, CA, USA, 2024; Available online: https://www.grandviewresearch.com/industry-analysis/global-commercial-drones-market (accessed on 1 July 2026).
- Pawar, S.; Brizzolara, S. Relevance of Transition Turbulent Model for Hydrodynamic Characteristics of Low Reynolds Number Propeller. Appl. Ocean Res. 2019, 87, 165–178. [Google Scholar] [CrossRef]
Figure 1.
(a) CAD propeller model. (b) Comparison of the CAD model (top) and the physical propeller (bottom).
Figure 1.
(a) CAD propeller model. (b) Comparison of the CAD model (top) and the physical propeller (bottom).
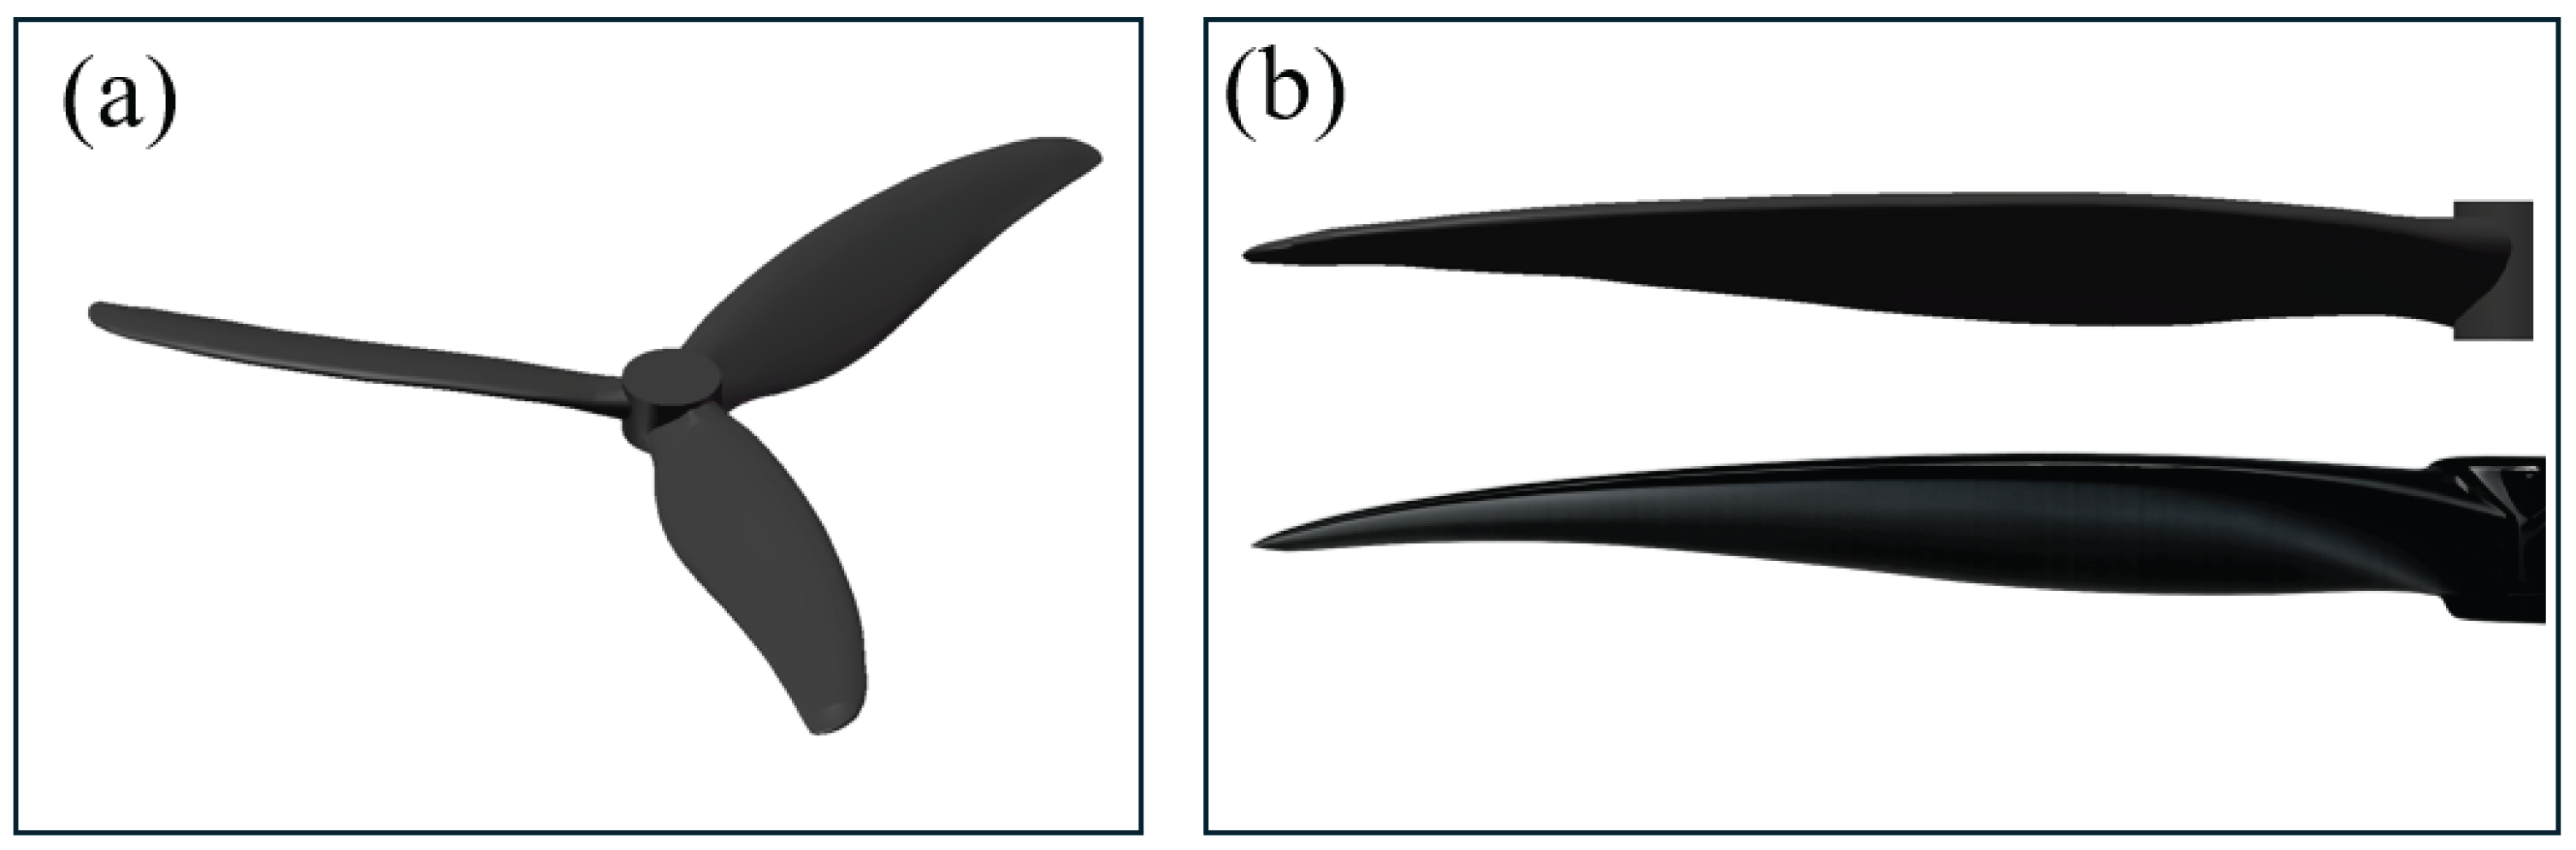
Figure 2.
Plot of the propellers normalized chord length and pitch angle distribution.
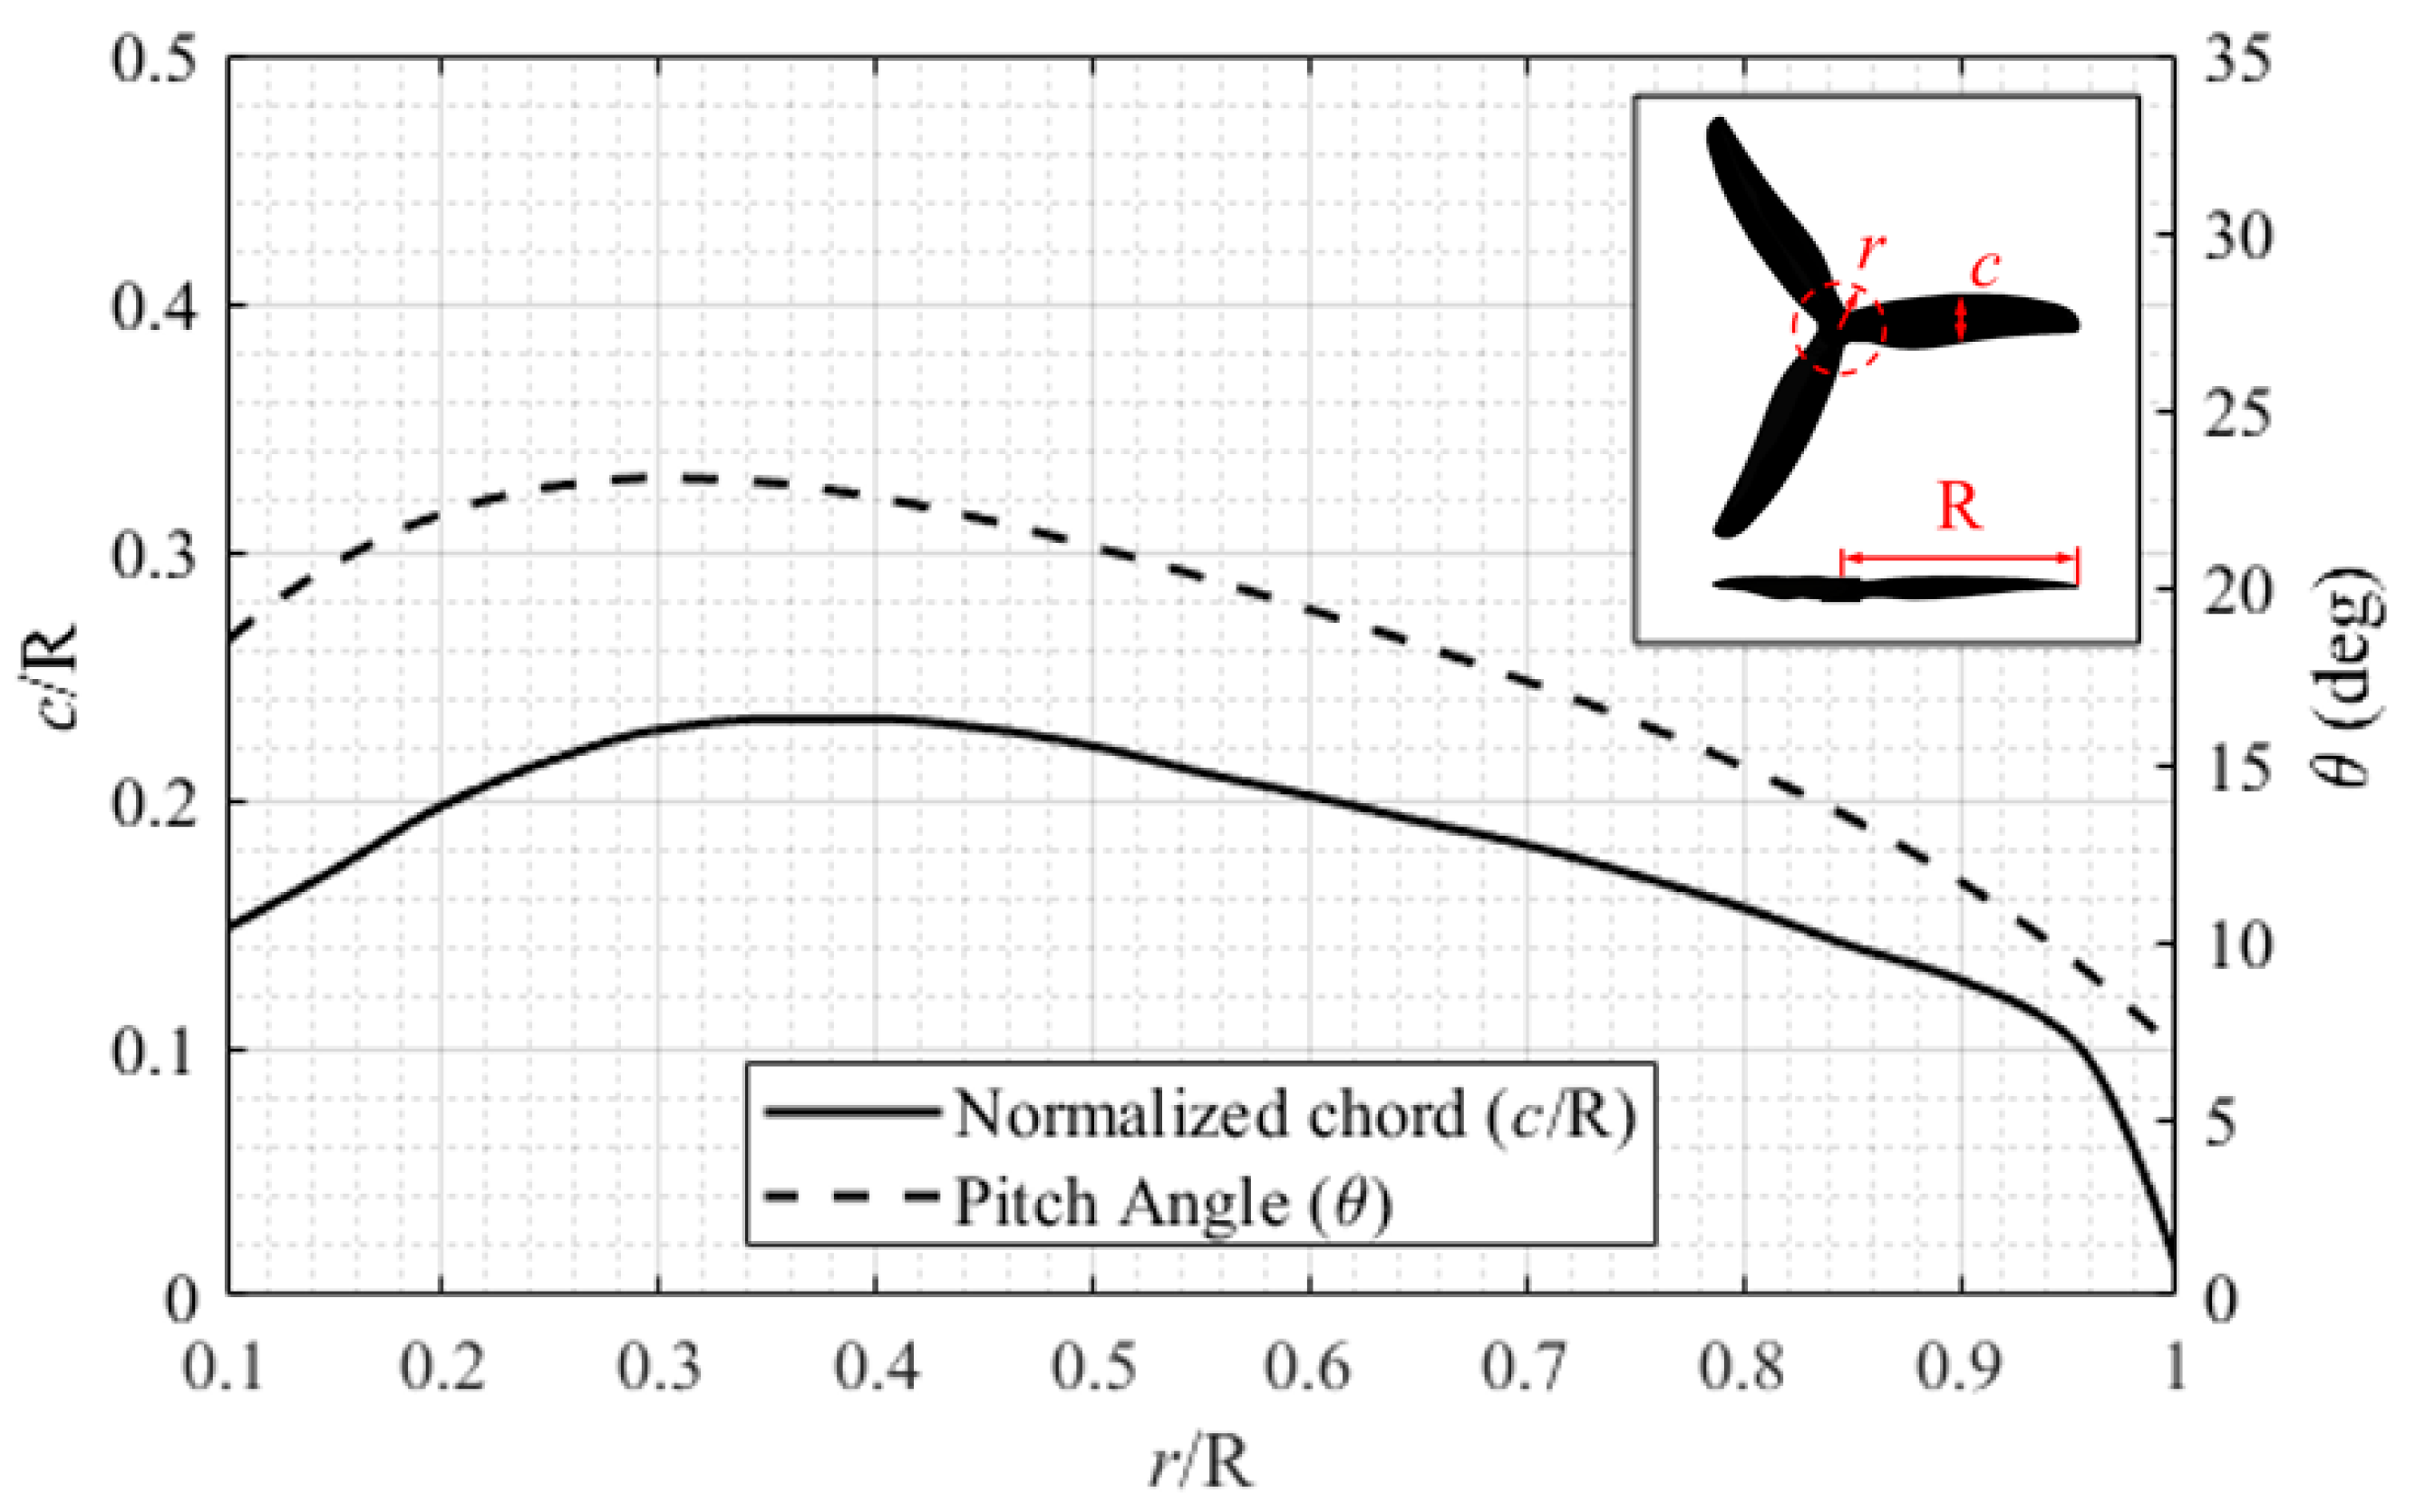
Figure 3.
Sketch of the computational domains: (a) single propeller setup, (b) quadcopter setup top view, (c) quadcopter setup side view.
Figure 3.
Sketch of the computational domains: (a) single propeller setup, (b) quadcopter setup top view, (c) quadcopter setup side view.
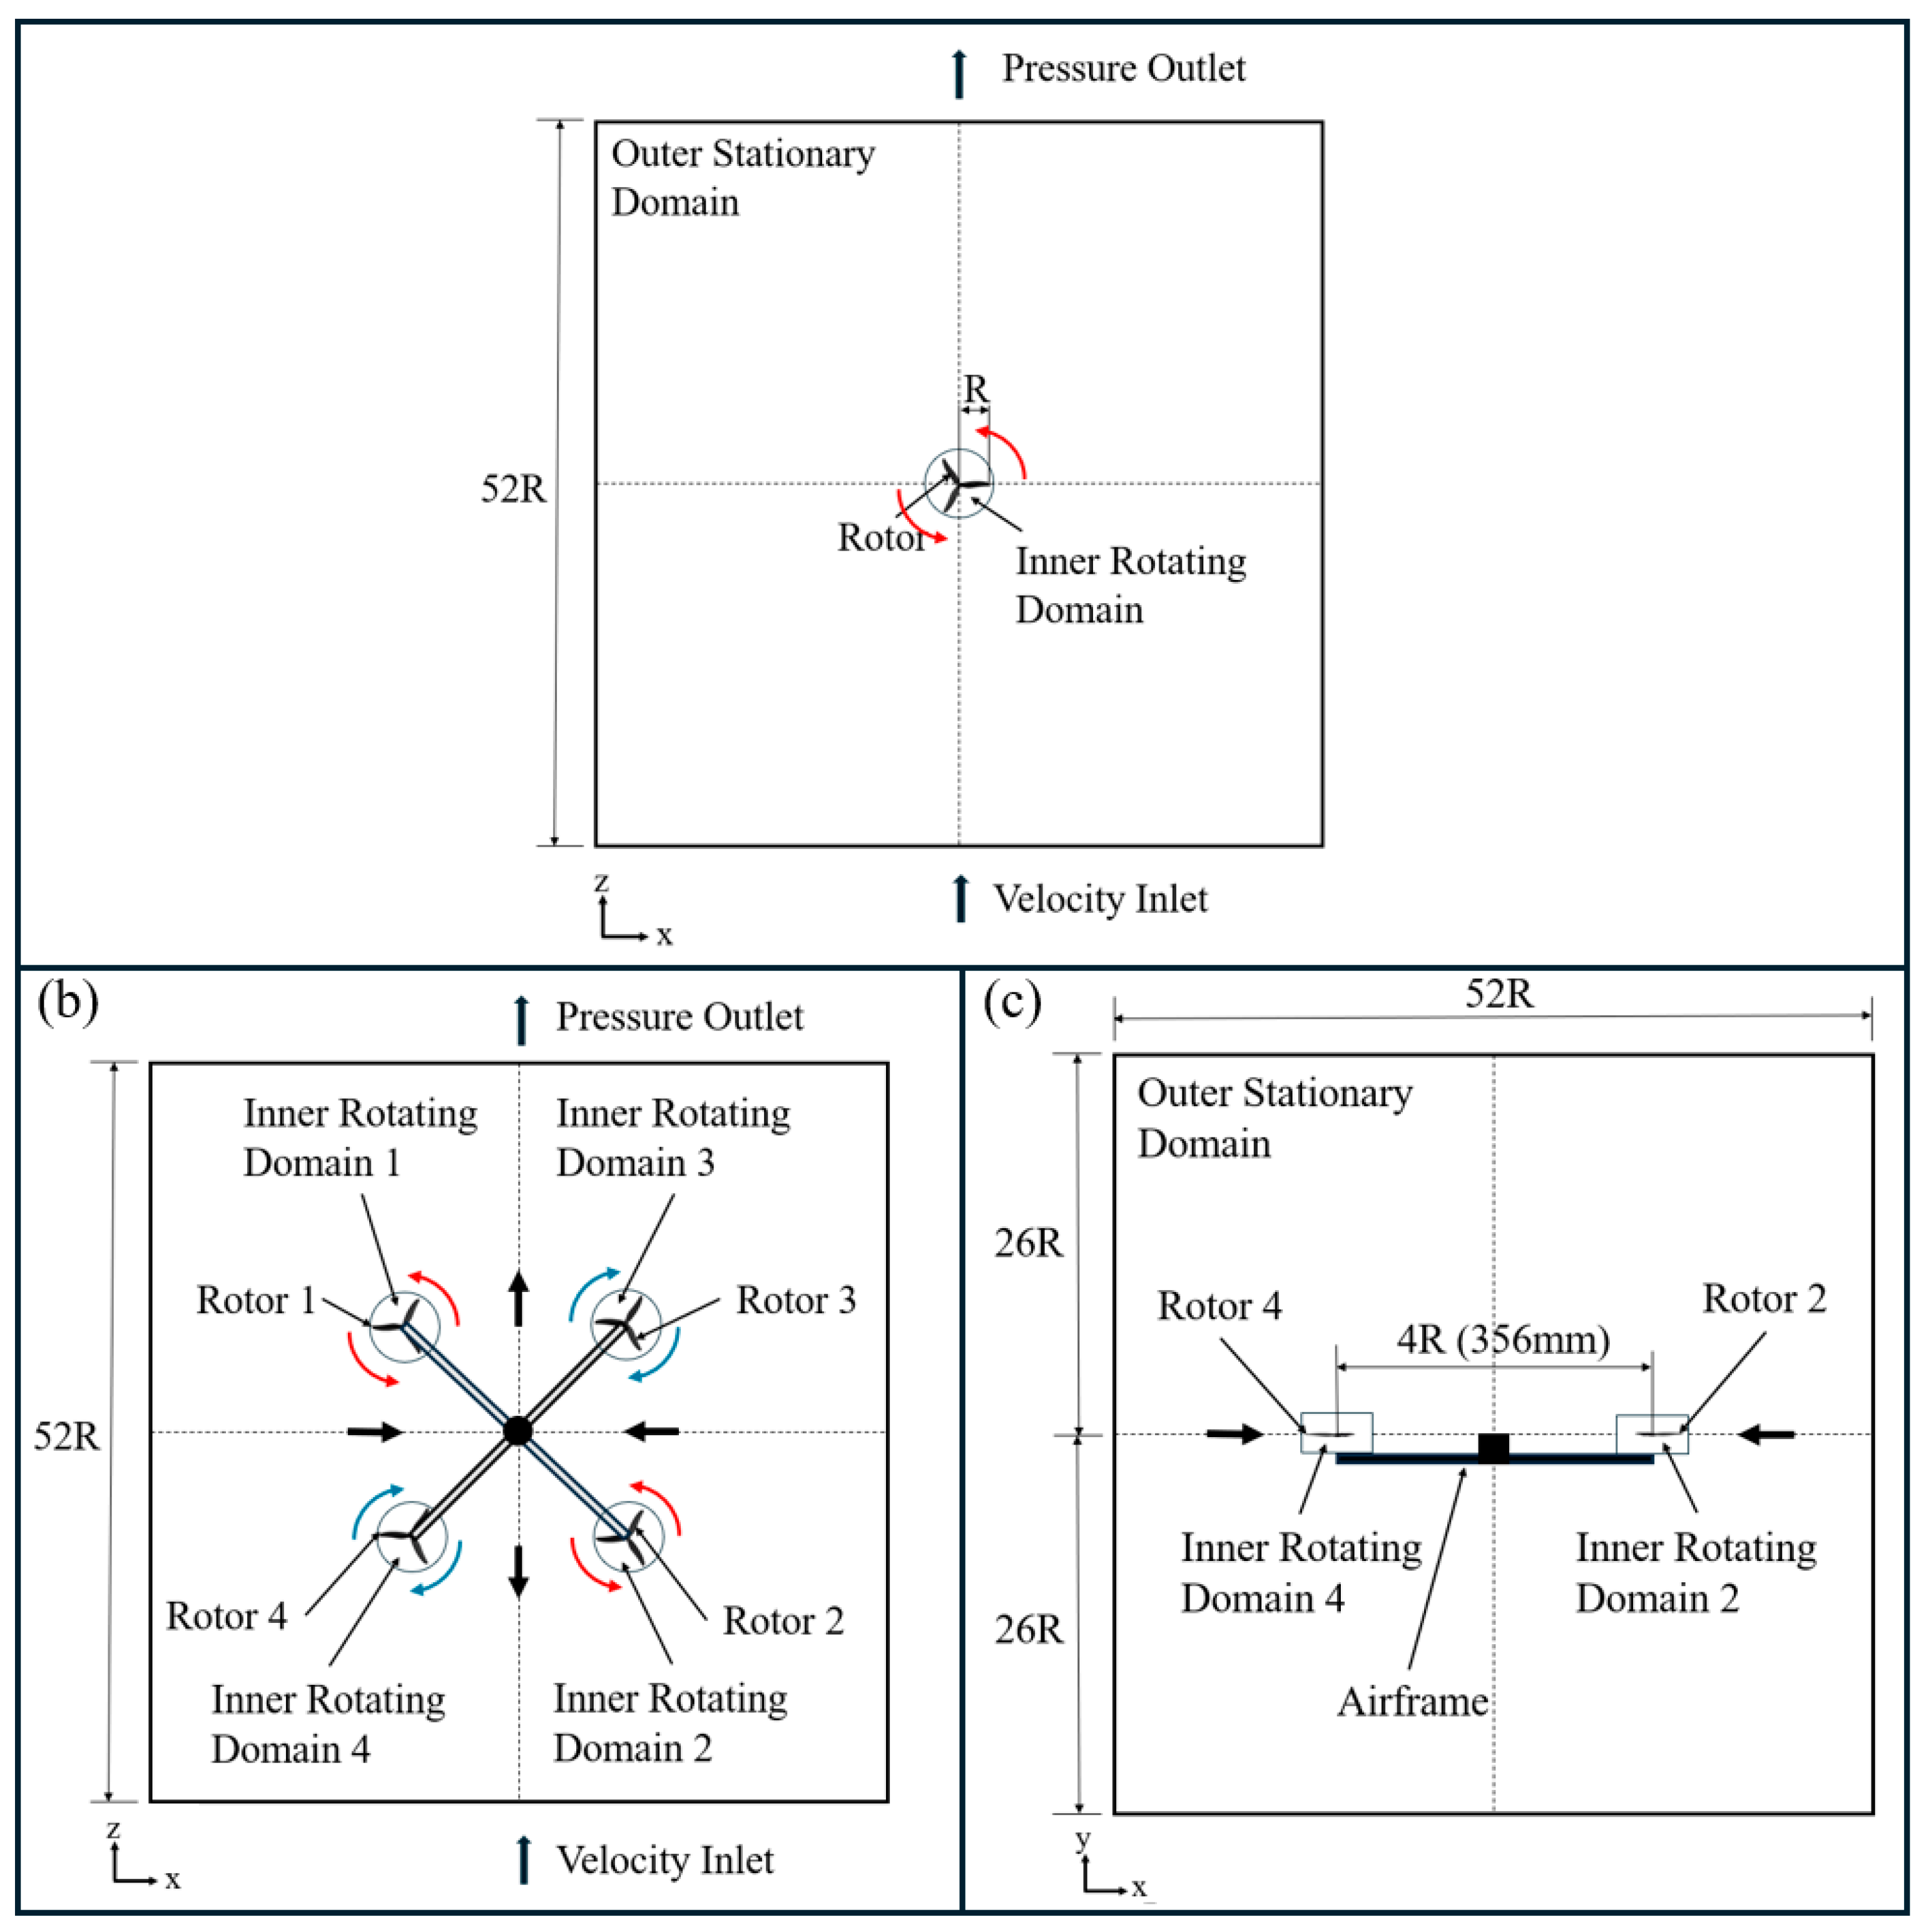
Figure 4.
(a) Mesh of the entire domain. (b) Sectional mesh view of the entire domain. (c) Sectional mesh view of the body of influence. (d) Sectional mesh view of a propeller.
Figure 4.
(a) Mesh of the entire domain. (b) Sectional mesh view of the entire domain. (c) Sectional mesh view of the body of influence. (d) Sectional mesh view of a propeller.
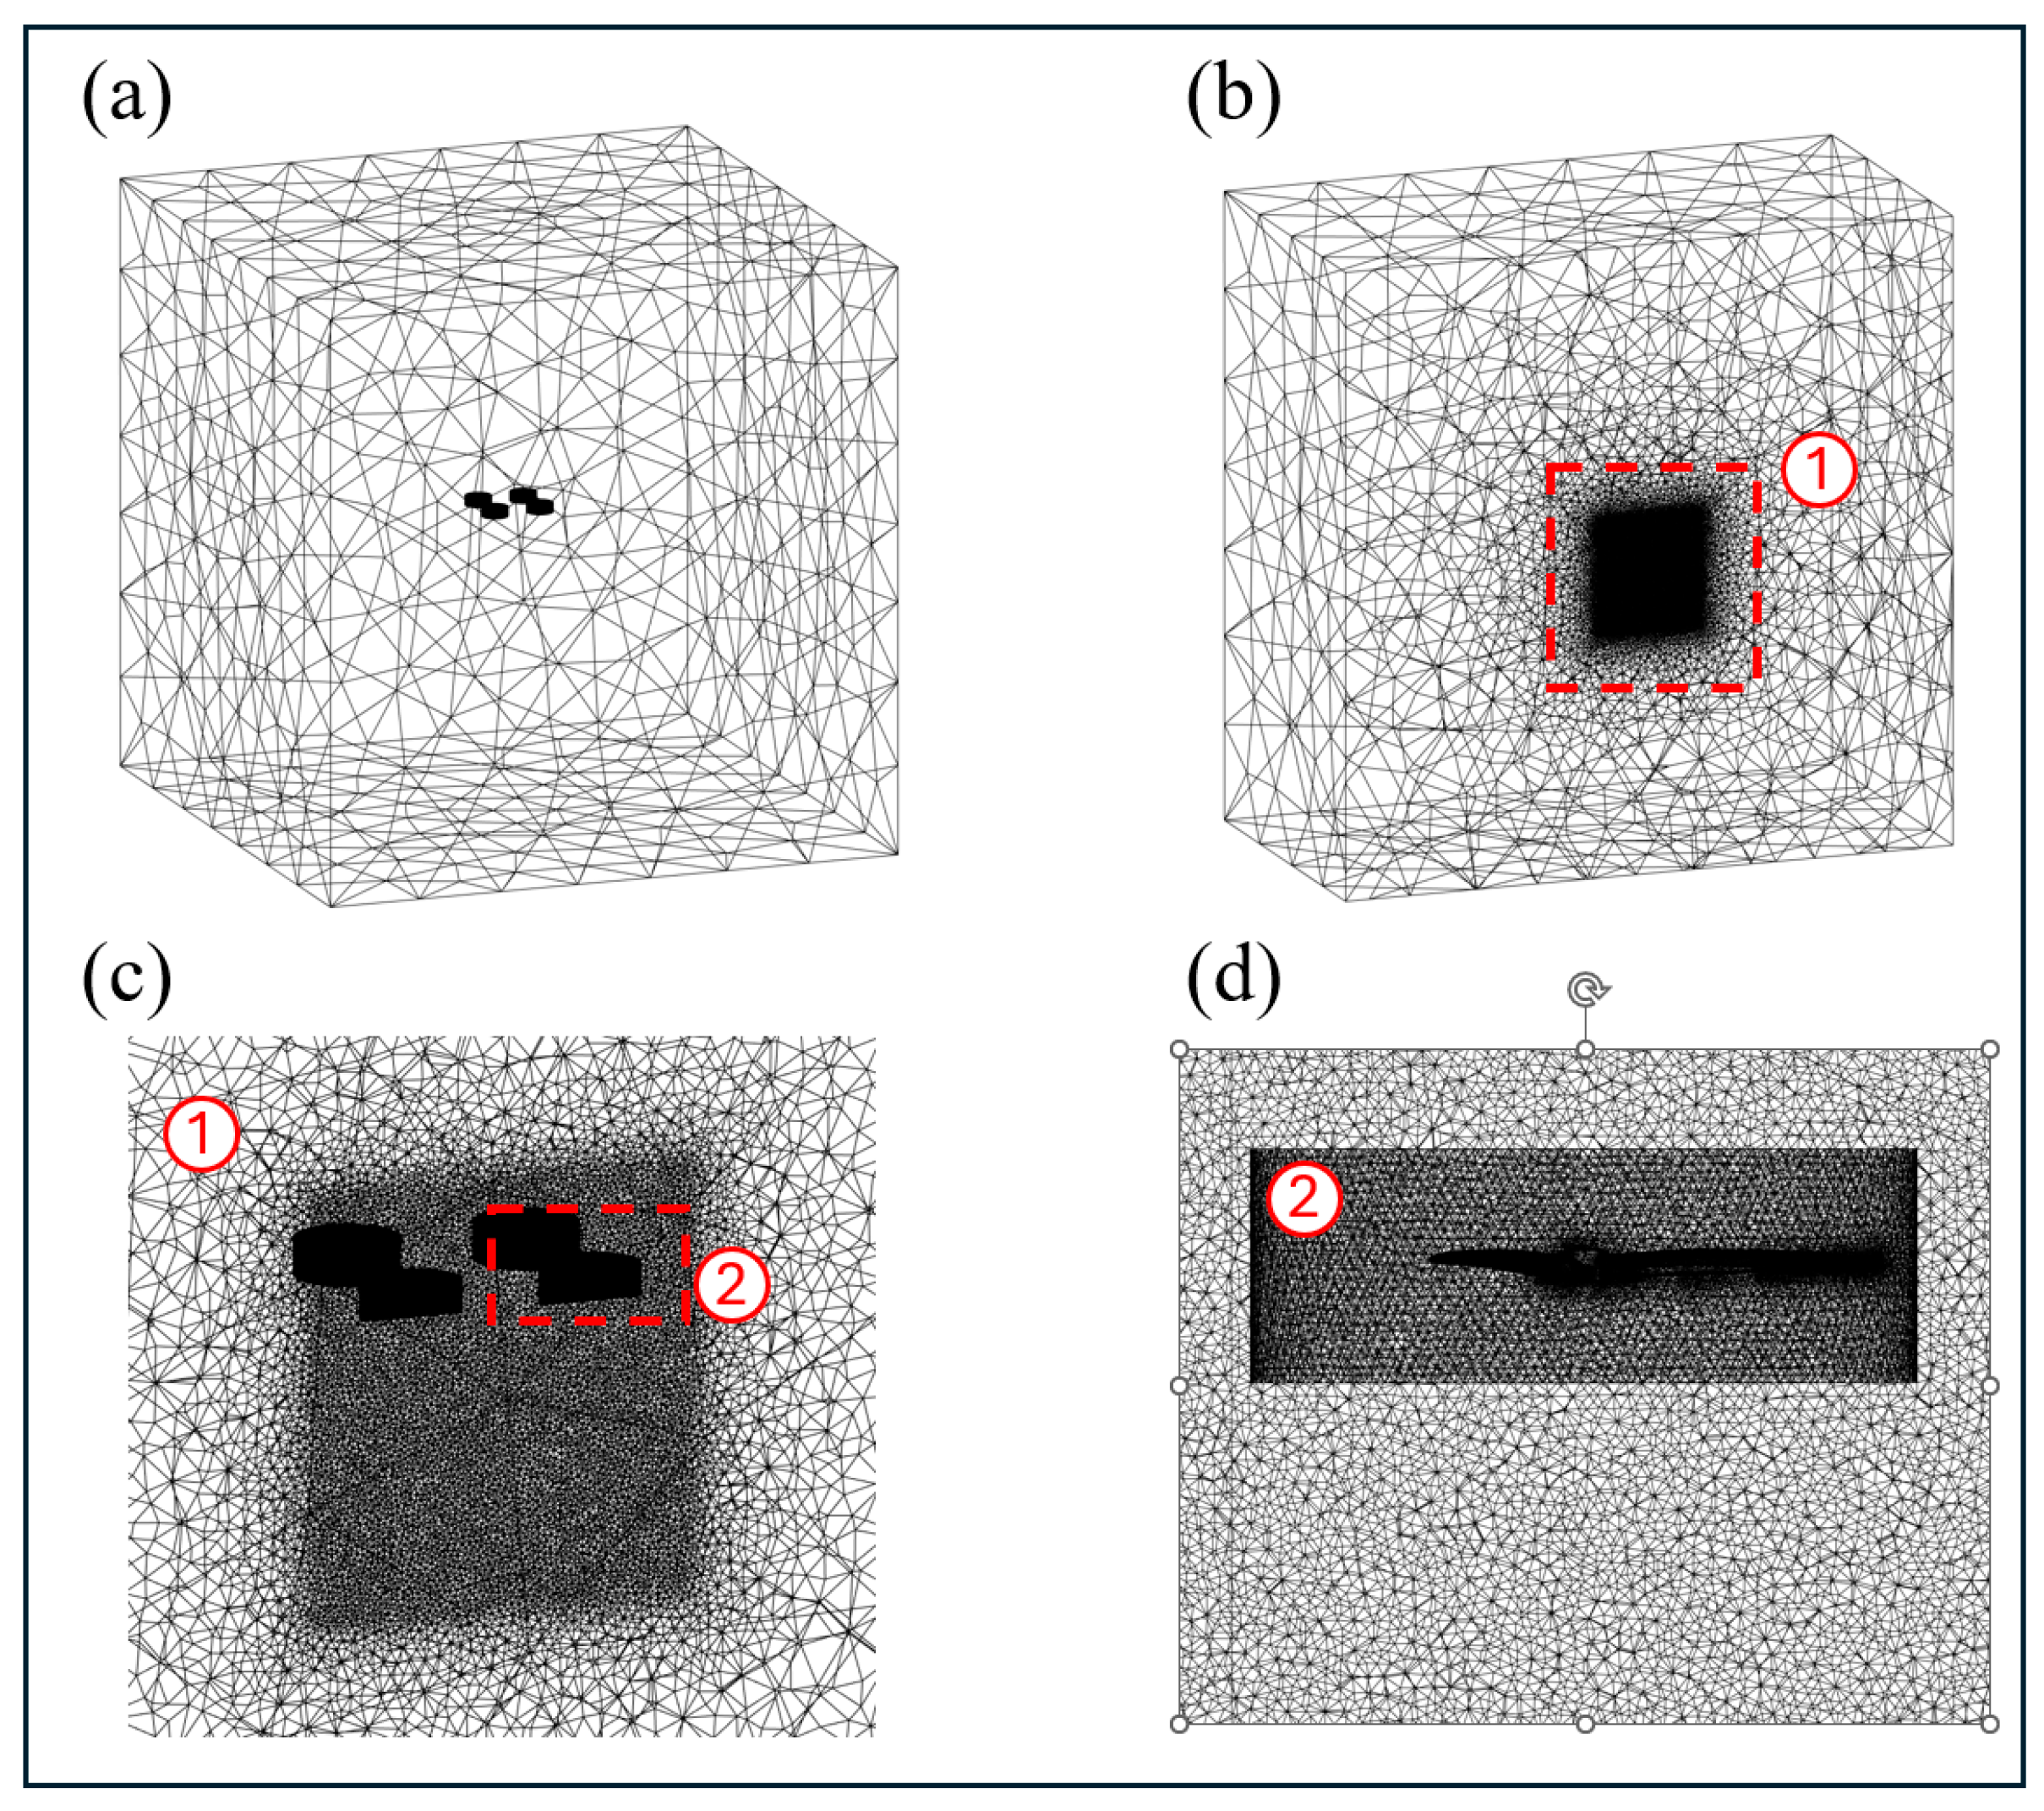
Figure 5.
(a) Thrust and (b) torque plotted against mesh size, measured by the number of nodes (in millions) for the single propeller setup.
Figure 5.
(a) Thrust and (b) torque plotted against mesh size, measured by the number of nodes (in millions) for the single propeller setup.
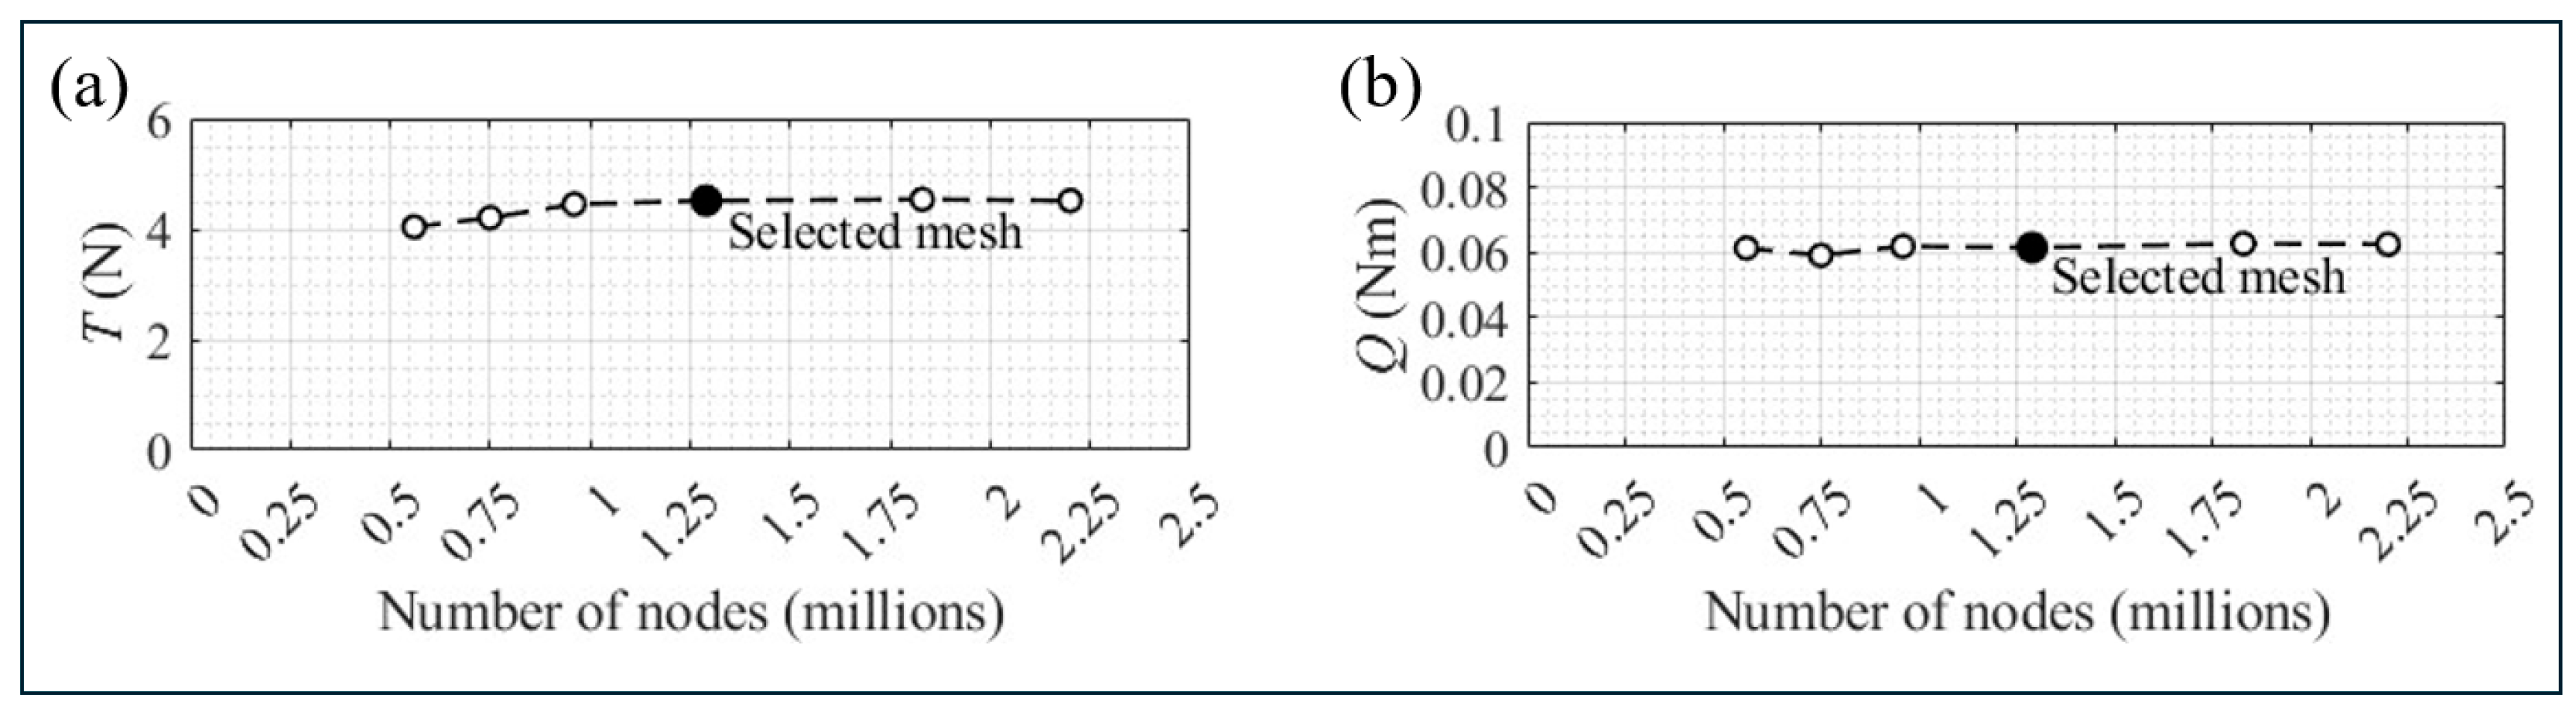
Figure 6.
Single propeller force balance mount setup: (a) schematic and (b) photo.
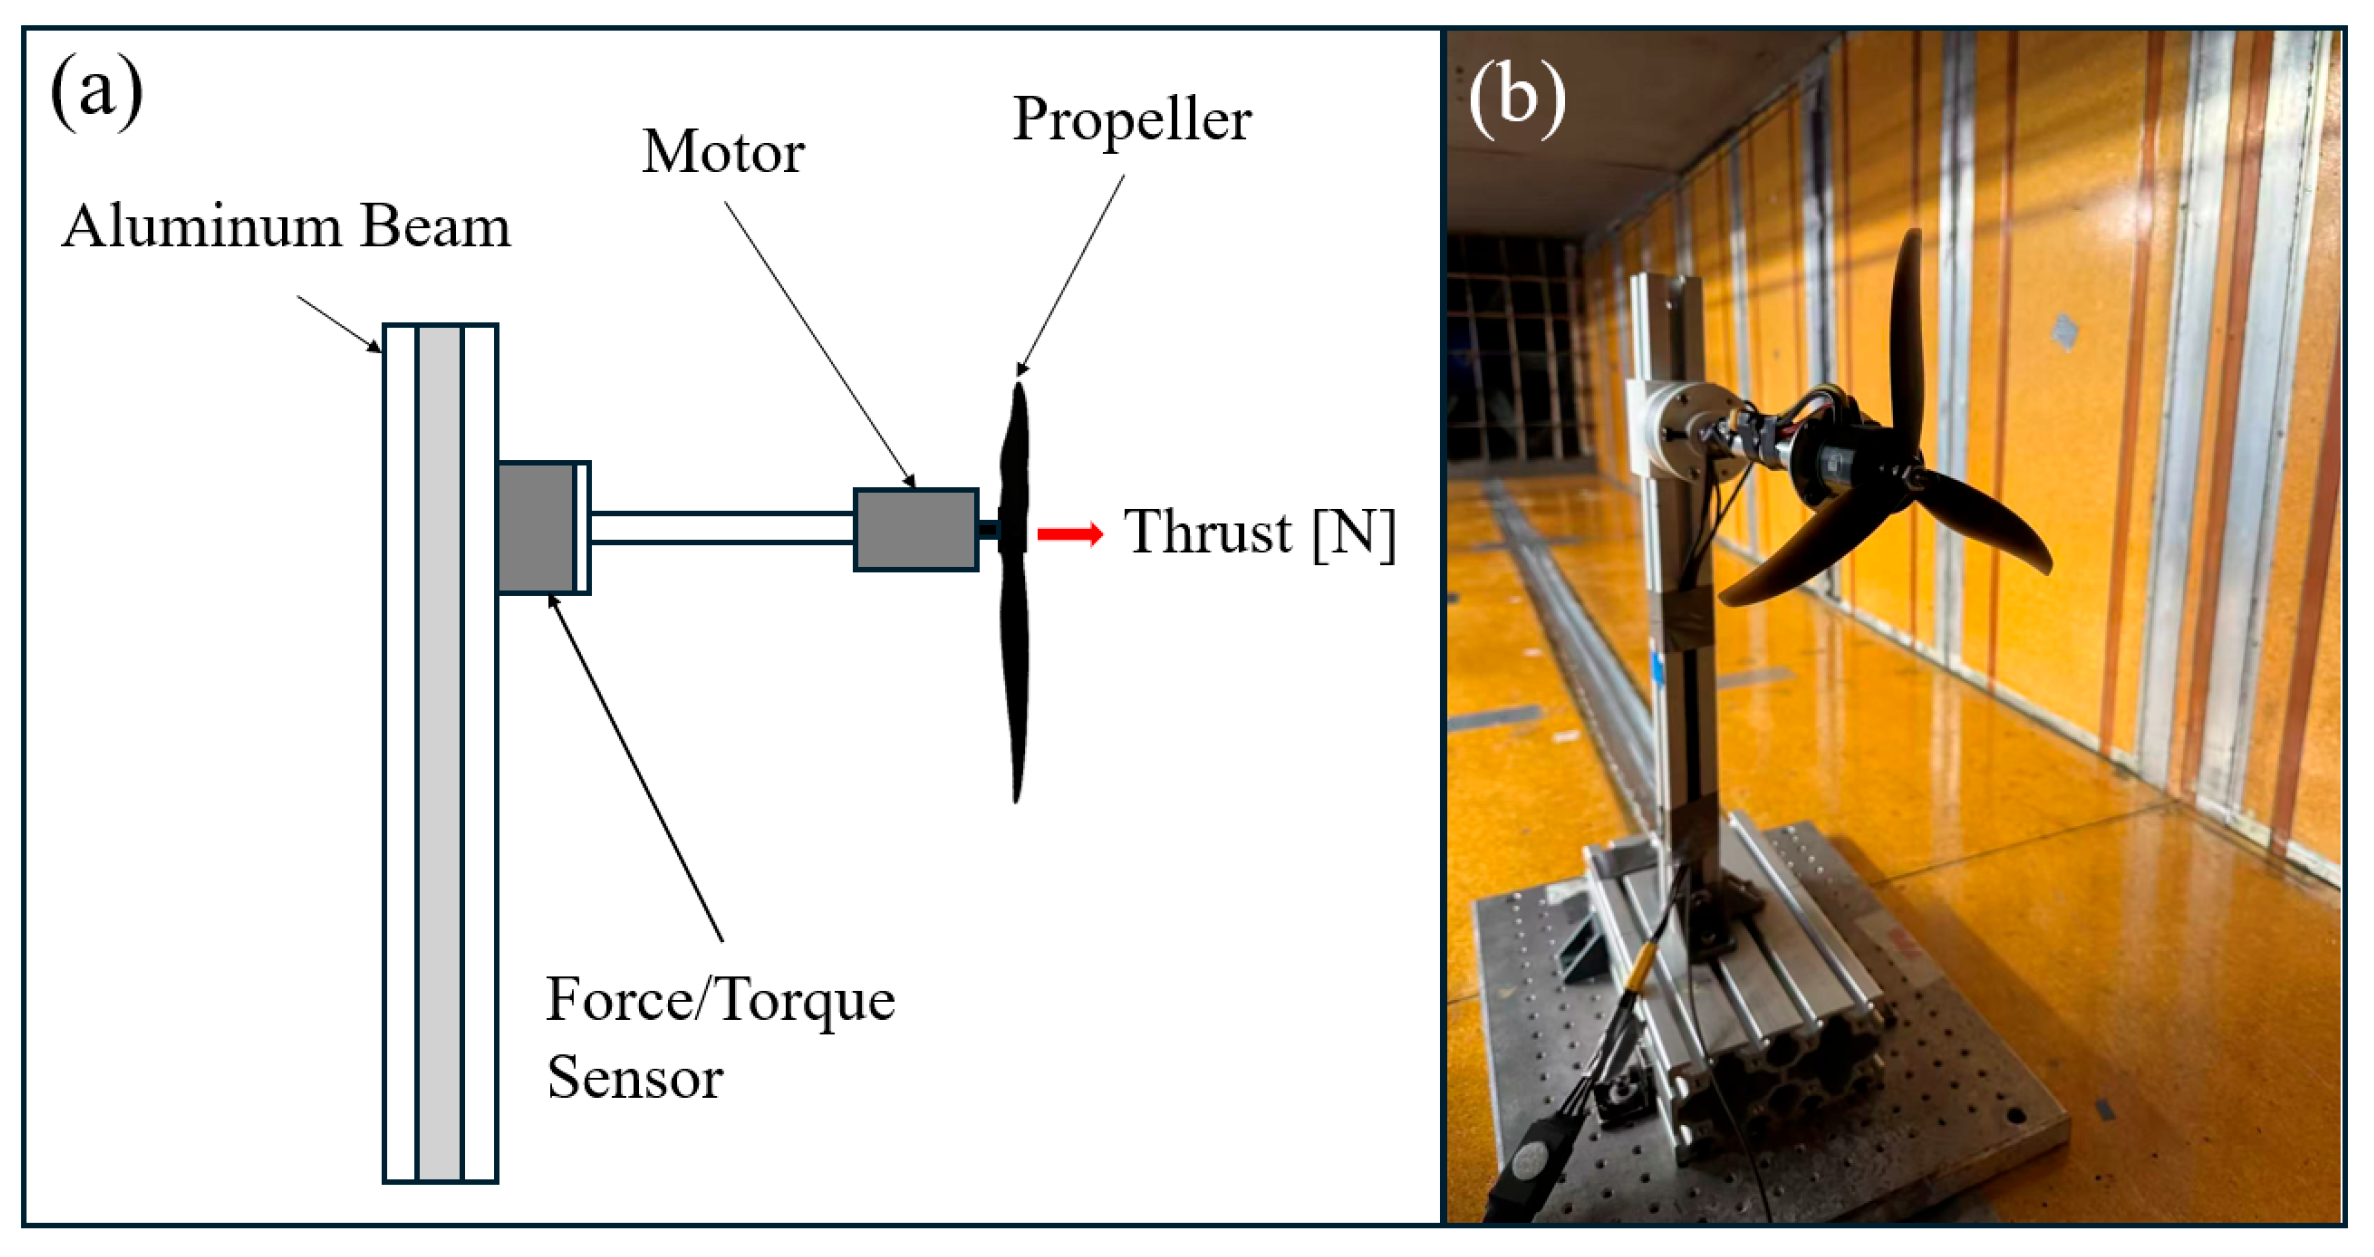
Figure 7.
Validation plots for the (a) thrust force and (b) aerodynamic torque of the single propeller.
Figure 7.
Validation plots for the (a) thrust force and (b) aerodynamic torque of the single propeller.
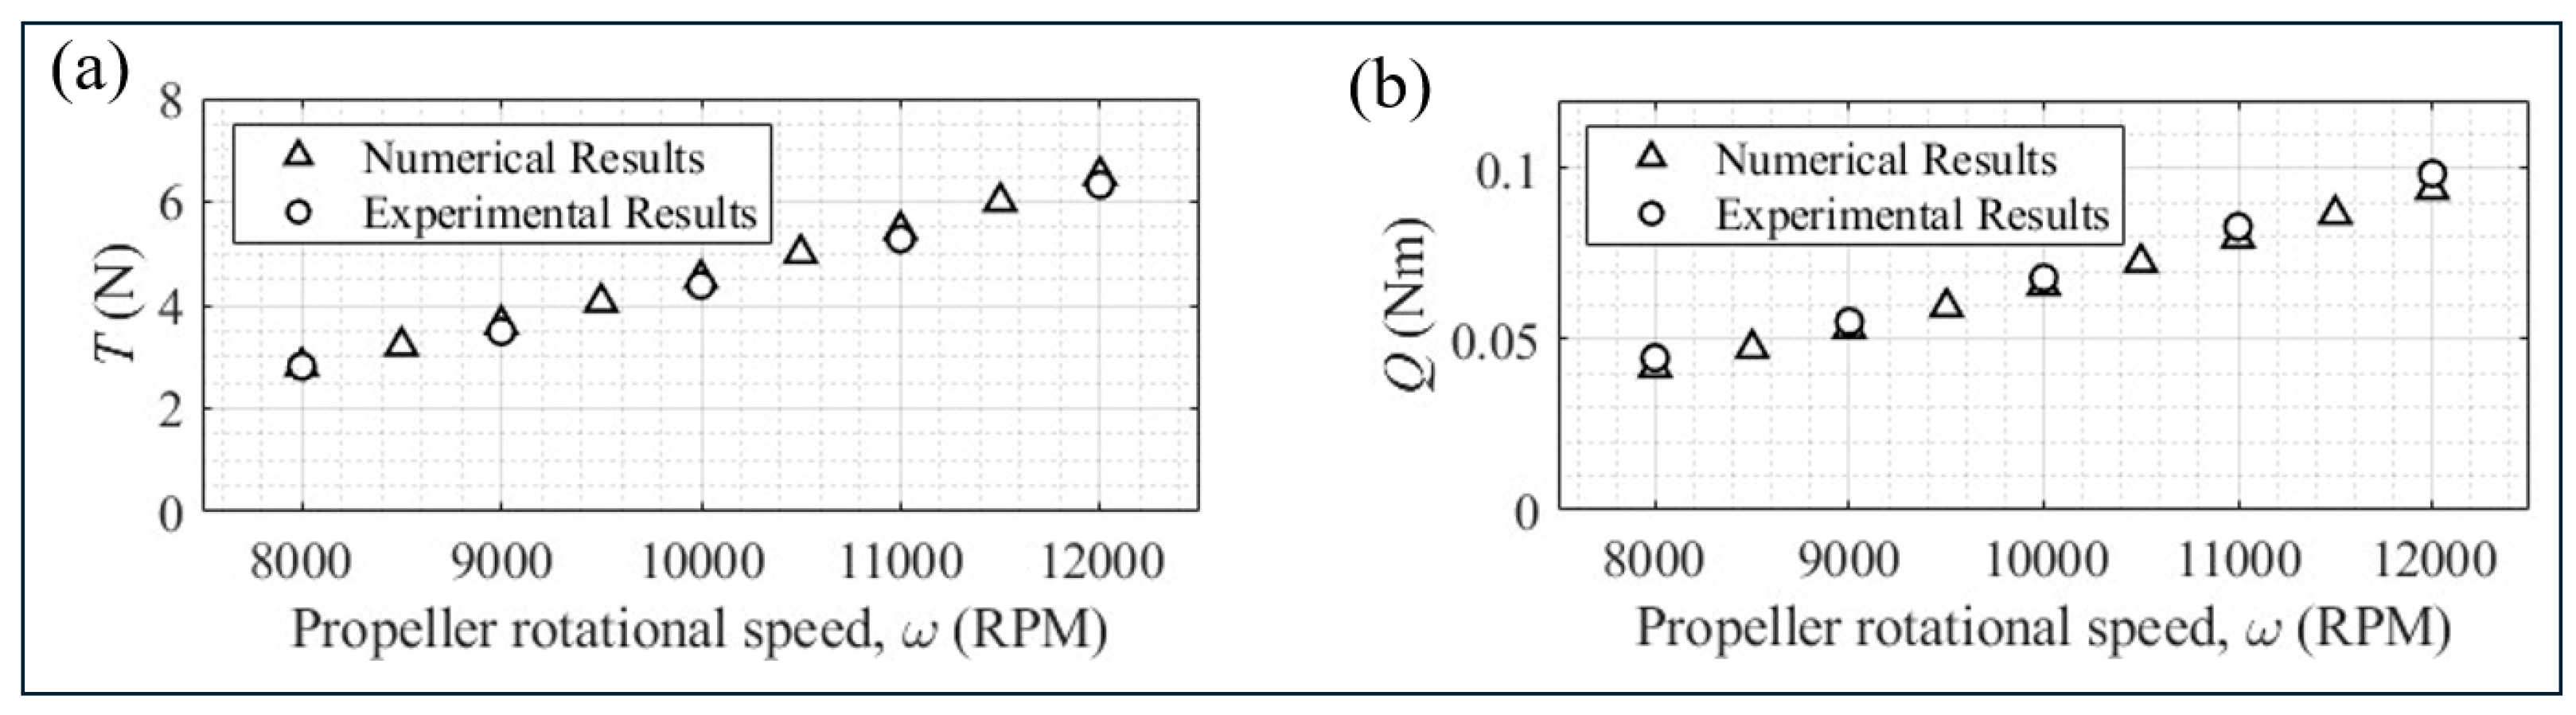
Figure 8.
Thrust coefficient , power coefficient , and figure of merit as a function of freestream velocity for (a)(c)(e) windward propellers 2 and 4, and (b)(d)(f) leeward propellers 1 and 3, at rotational speeds from 8,000 to .
Figure 8.
Thrust coefficient , power coefficient , and figure of merit as a function of freestream velocity for (a)(c)(e) windward propellers 2 and 4, and (b)(d)(f) leeward propellers 1 and 3, at rotational speeds from 8,000 to .
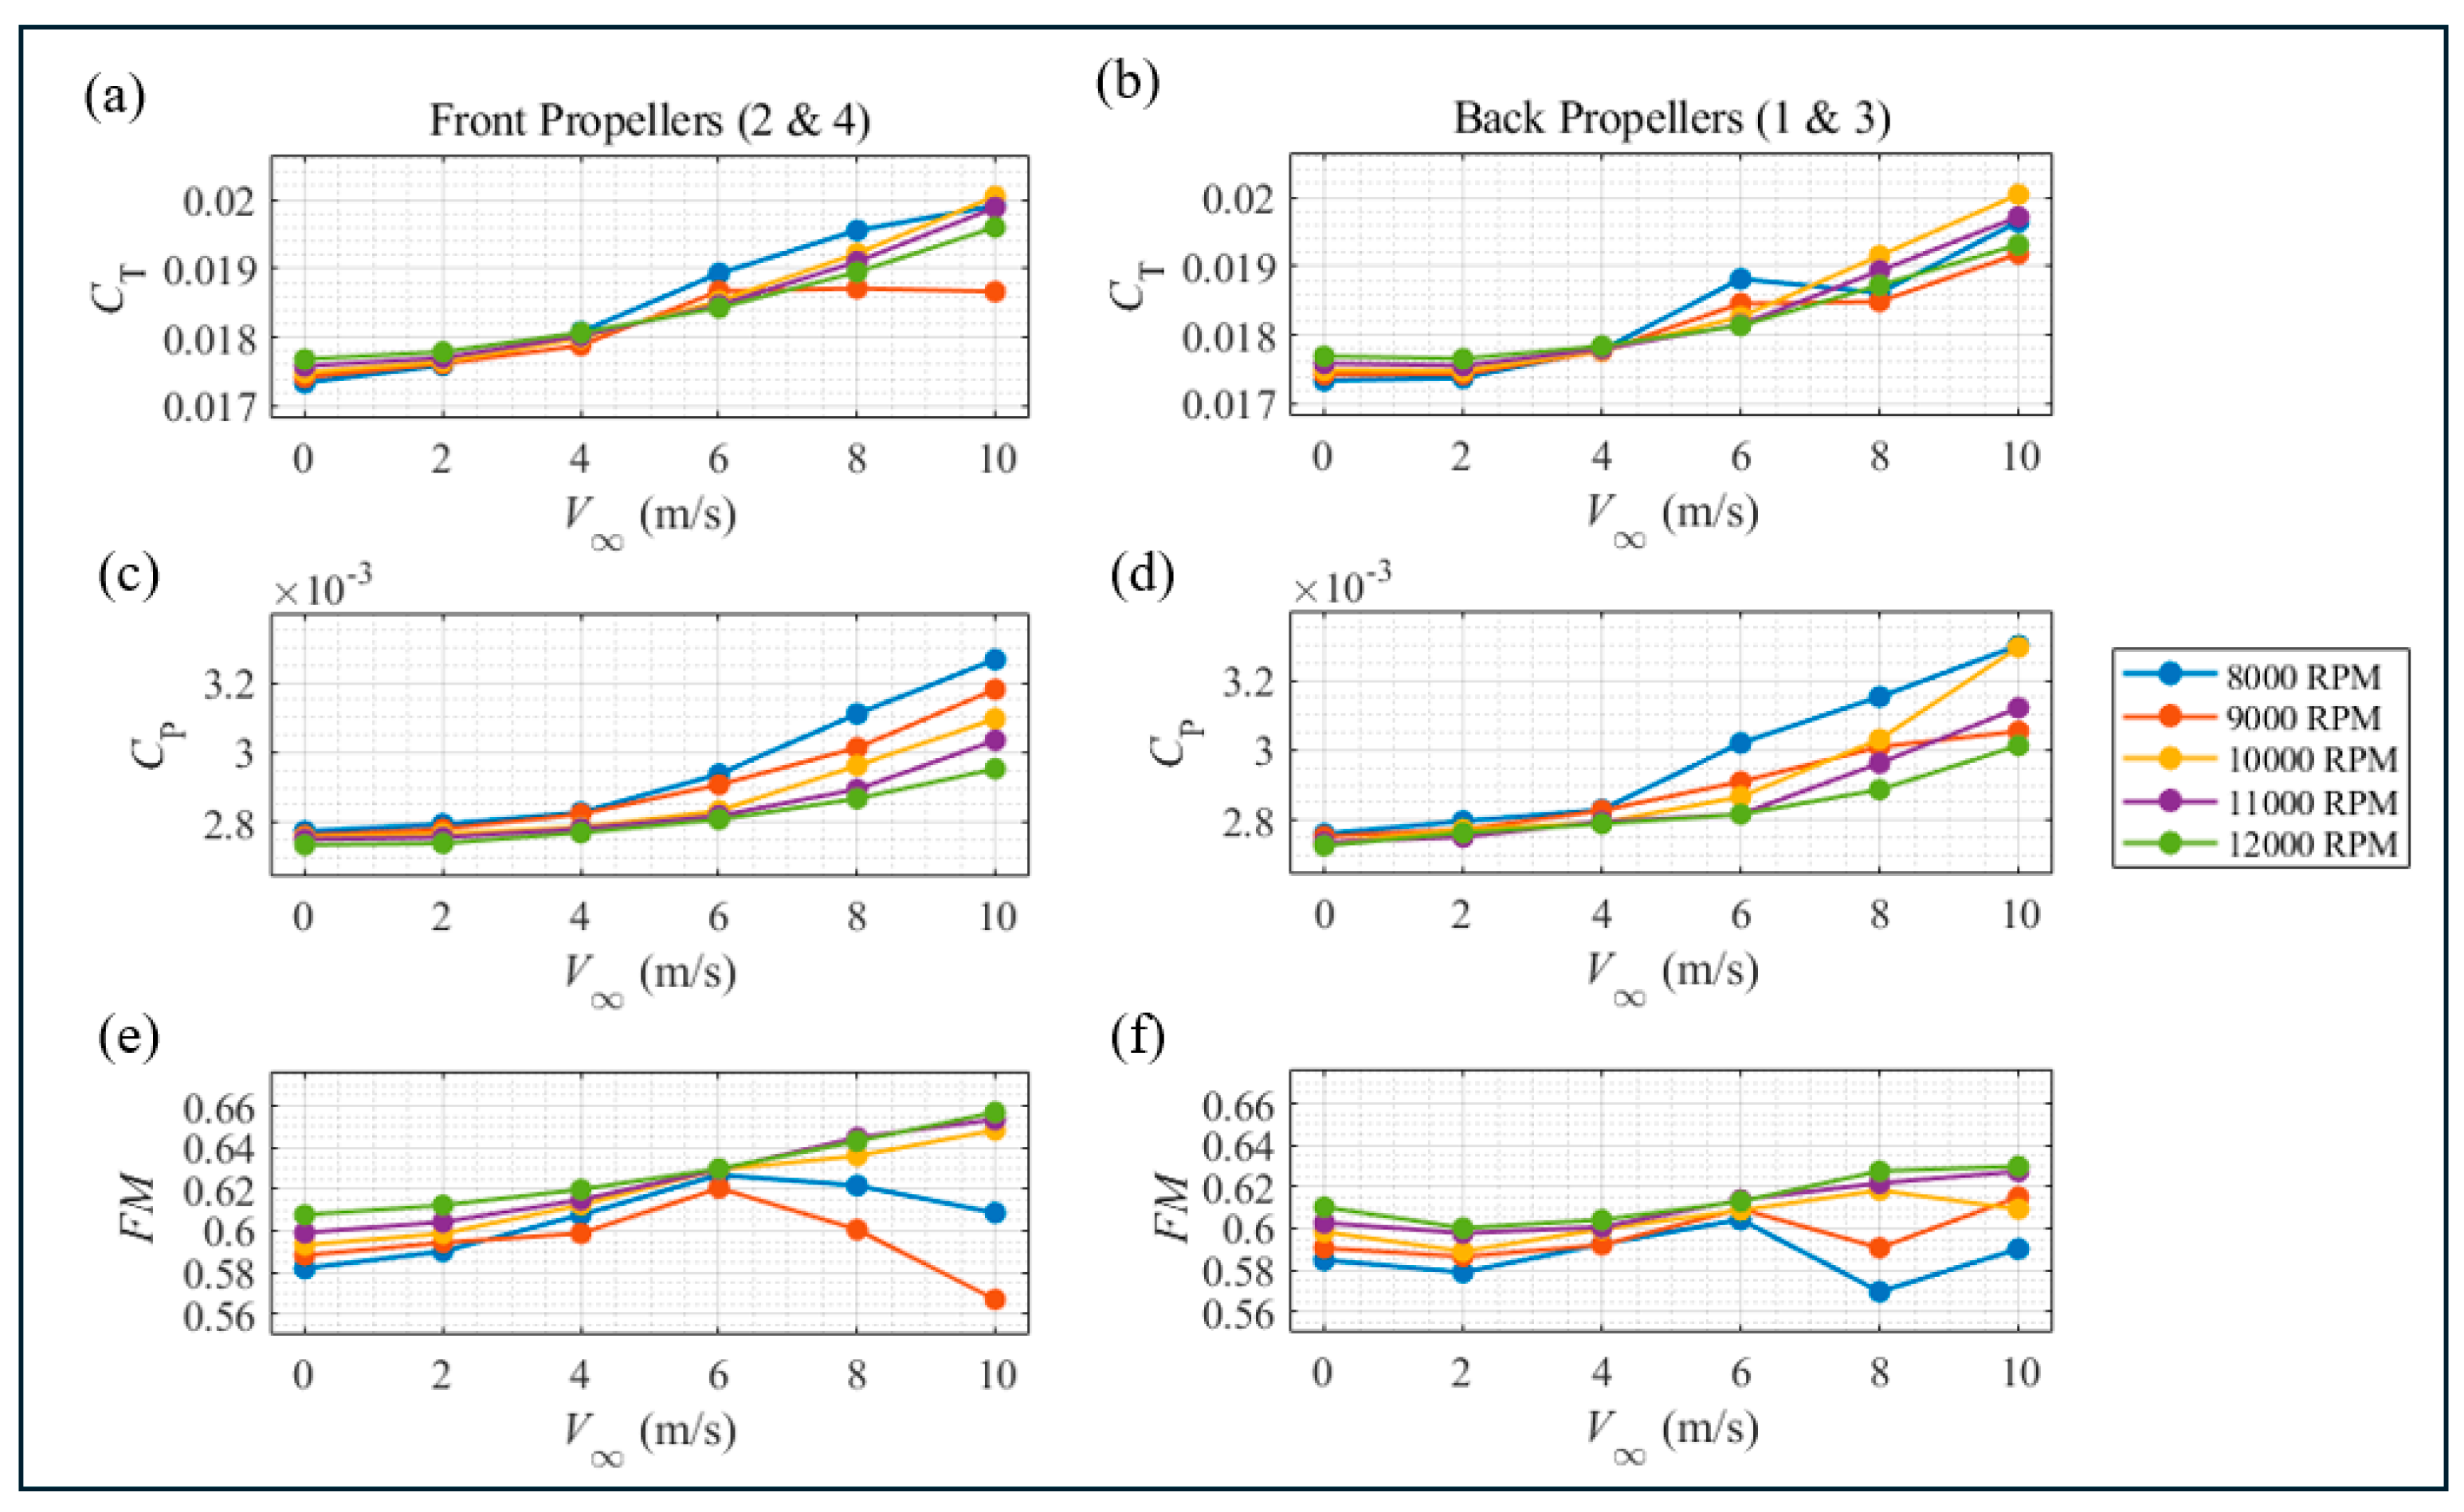
Figure 9.
Three-dimensional velocity streamlines colored by velocity magnitude for (a) = 6 m/s and (b) = 10 m/s at , illustrating the deflection of windward propeller wake toward the leeward inflow region.
Figure 9.
Three-dimensional velocity streamlines colored by velocity magnitude for (a) = 6 m/s and (b) = 10 m/s at , illustrating the deflection of windward propeller wake toward the leeward inflow region.
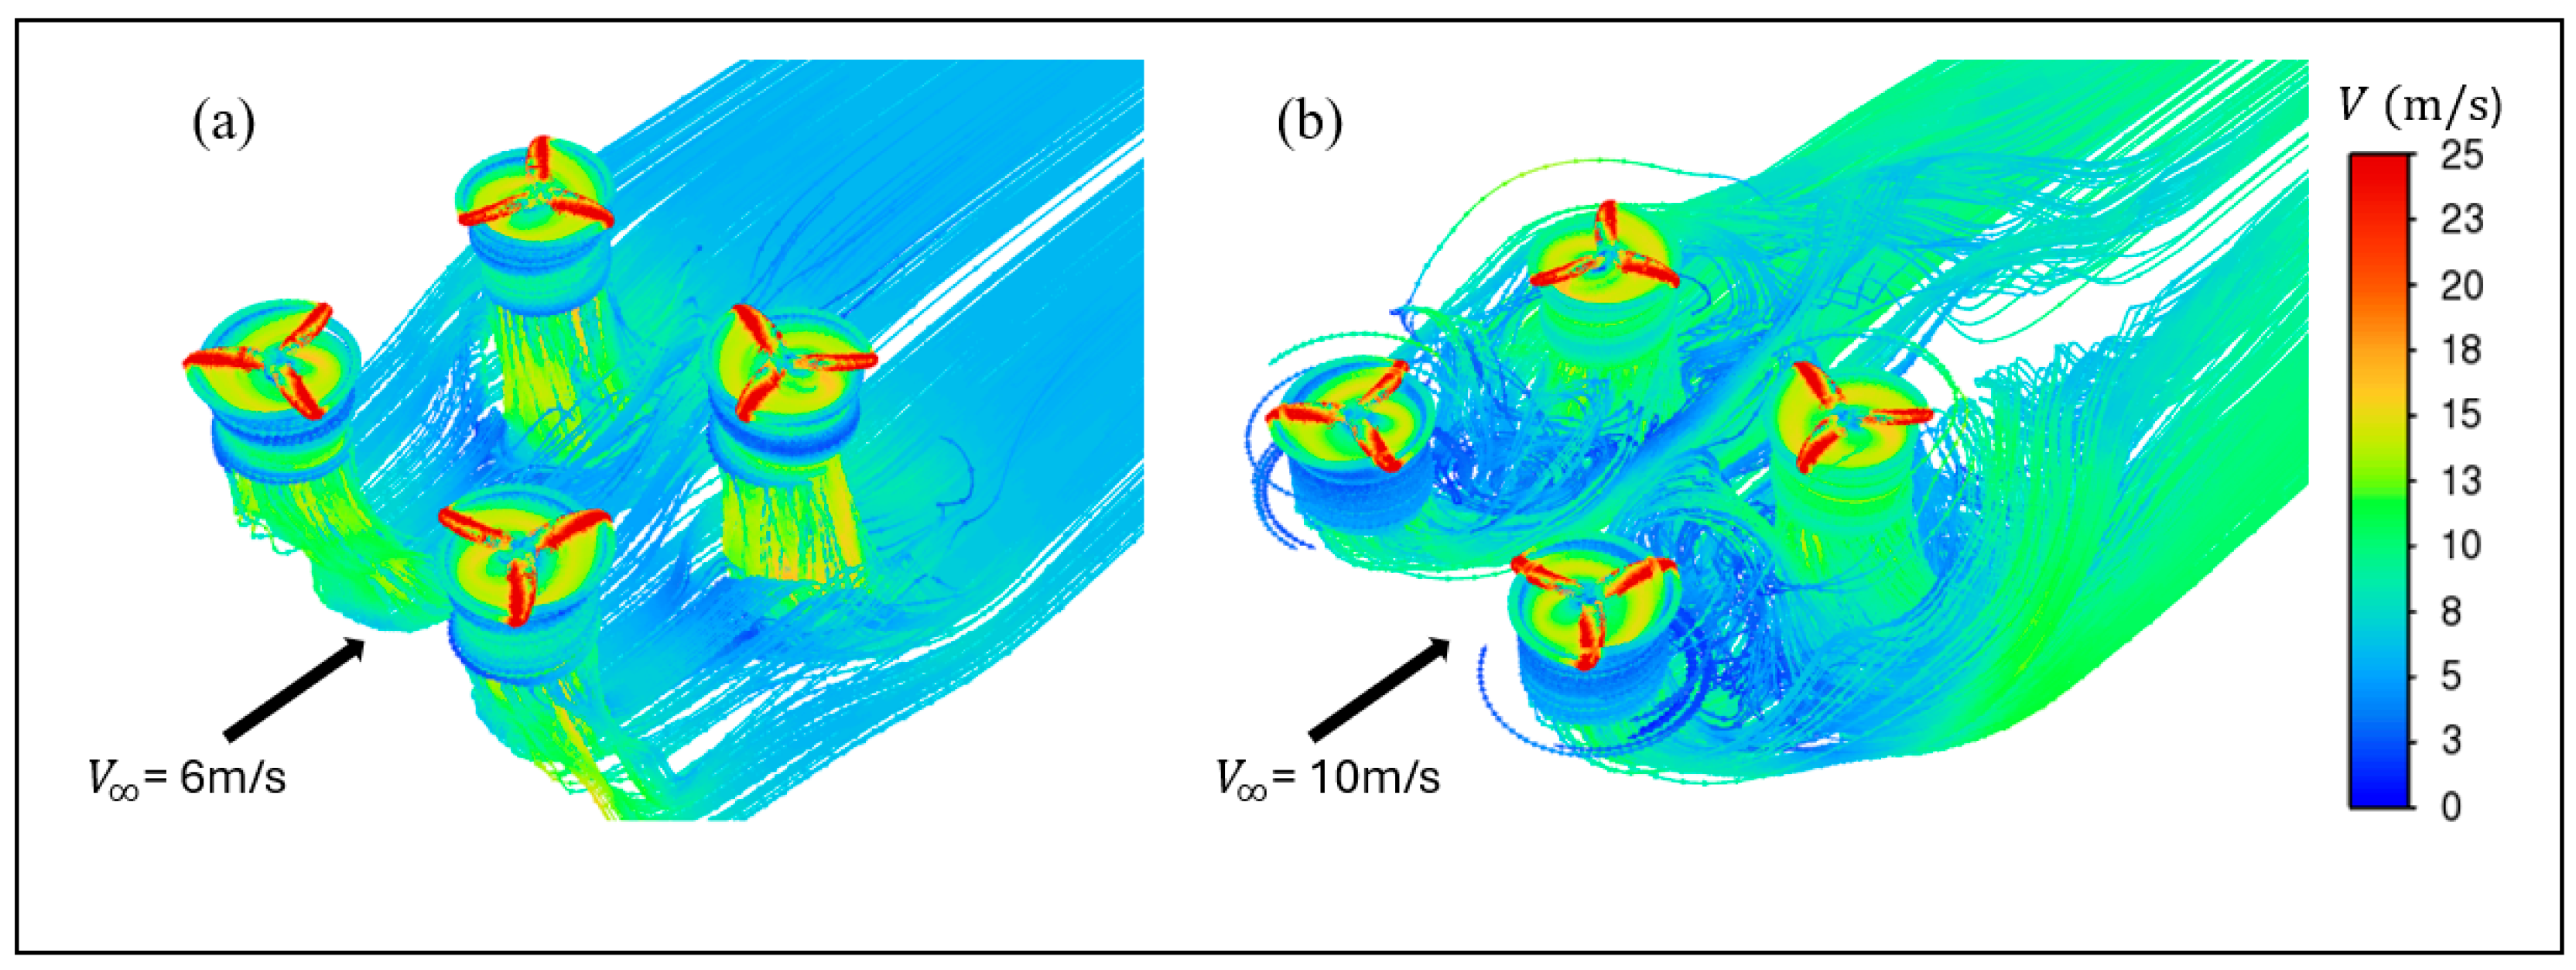
Figure 10.
(a) Vertical velocity component contours on cross-sectional planes at /D = -2, -1, 0, 1, and 2, with (b) corresponding streamwise velocity profiles sampled at 17 points per plane, for at .
Figure 10.
(a) Vertical velocity component contours on cross-sectional planes at /D = -2, -1, 0, 1, and 2, with (b) corresponding streamwise velocity profiles sampled at 17 points per plane, for at .
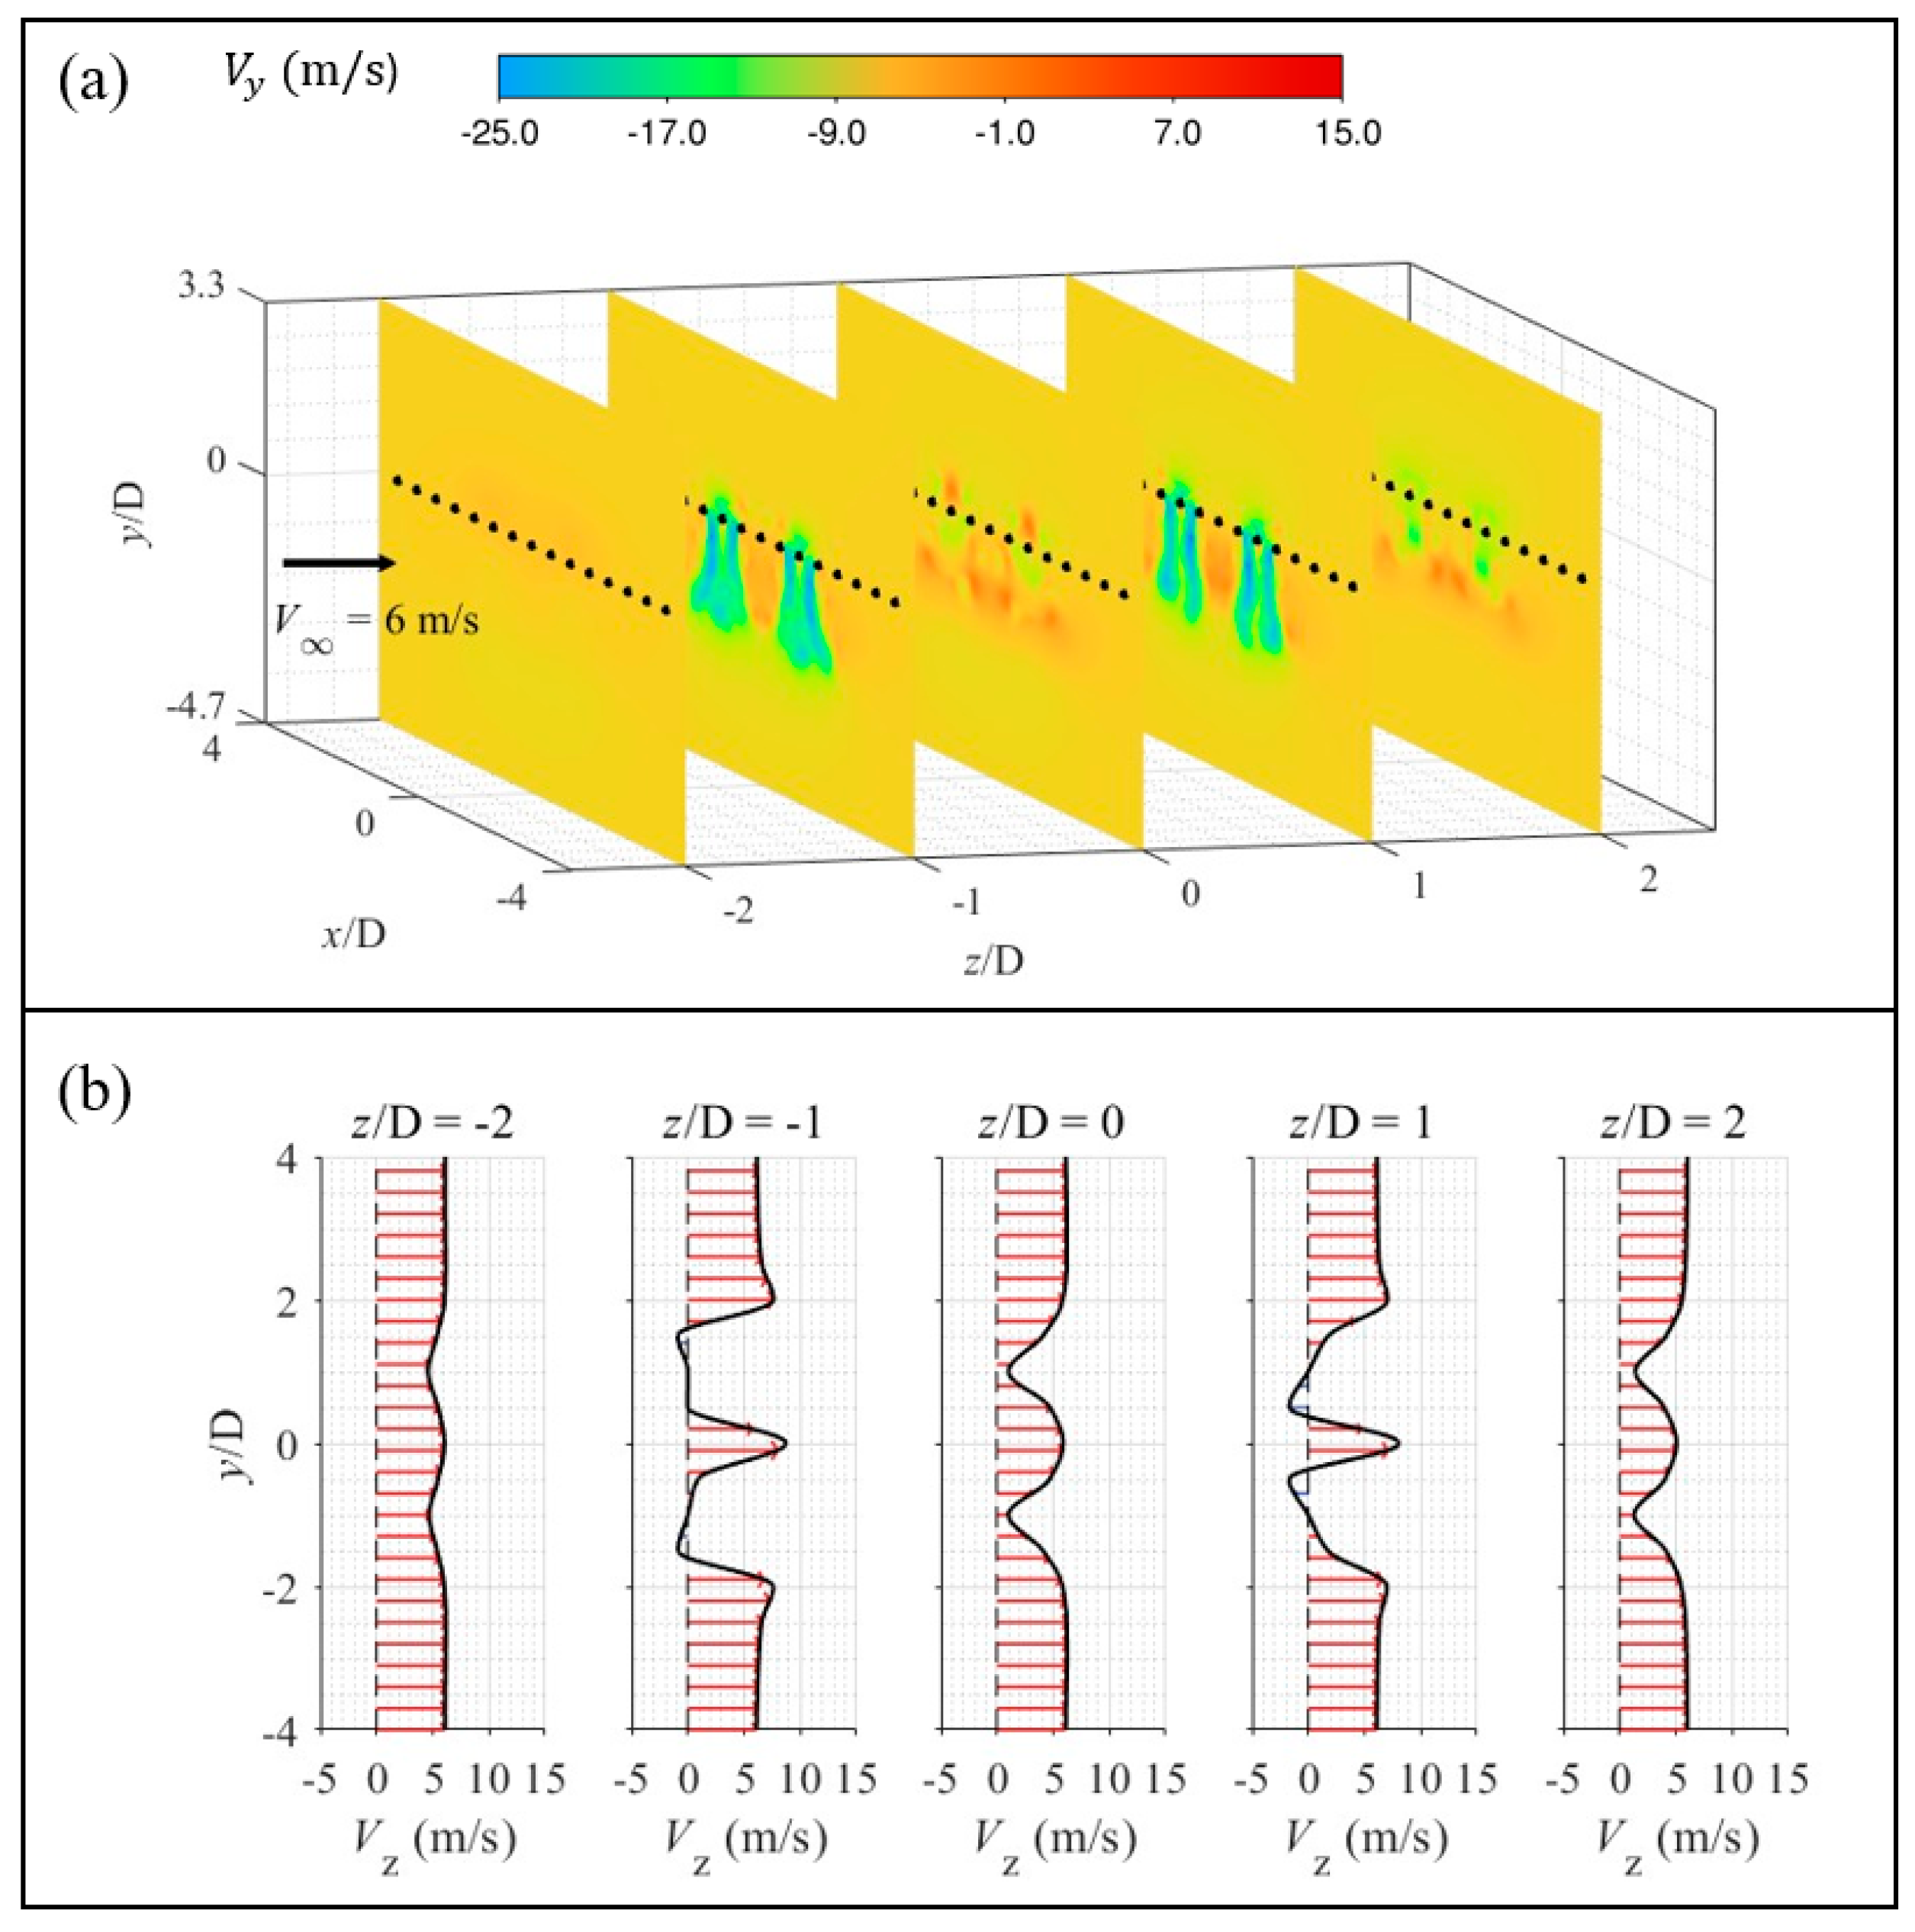
Figure 11.
(a) Vertical velocity component contours on cross-sectional planes at /D = -2, -1, 0, 1, and 2, with (b) corresponding streamwise velocity profiles sampled at 17 points per plane, for = 10 m/s at .
Figure 11.
(a) Vertical velocity component contours on cross-sectional planes at /D = -2, -1, 0, 1, and 2, with (b) corresponding streamwise velocity profiles sampled at 17 points per plane, for = 10 m/s at .
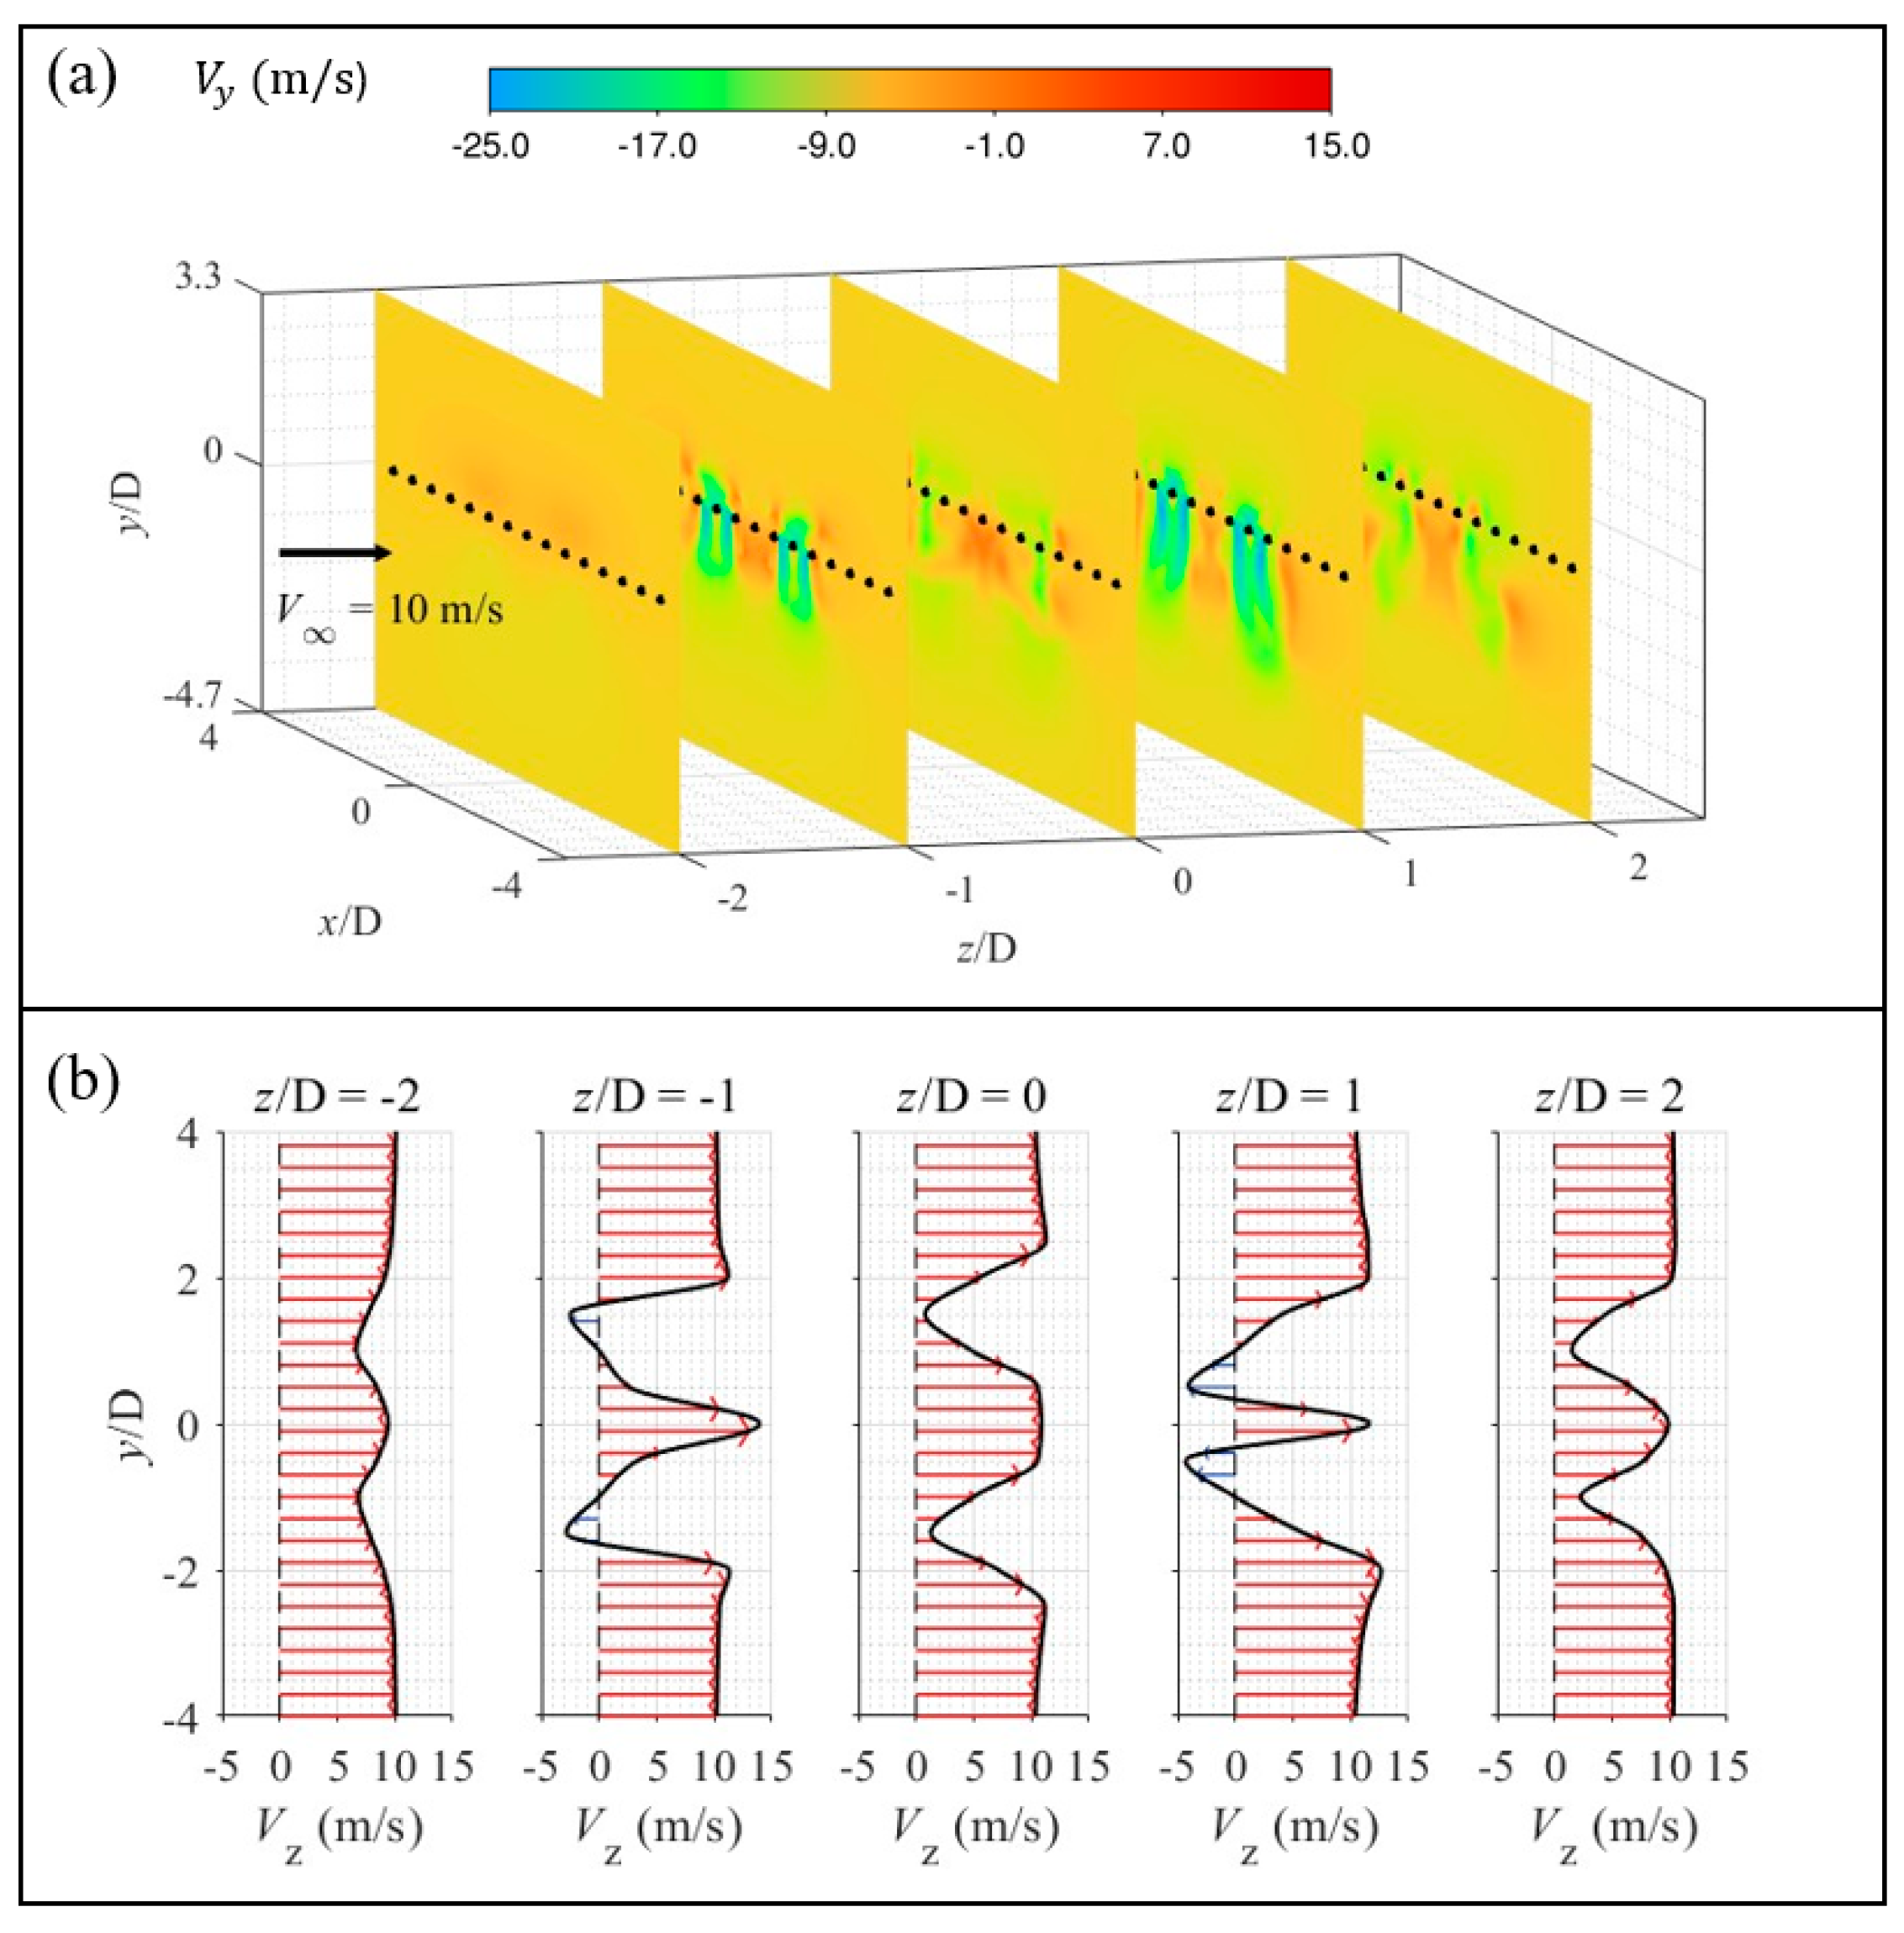
Figure 12.
Axial velocity component contours at the inflow plane for = 6, 8, and at 8,000, 9,000, and .
Figure 12.
Axial velocity component contours at the inflow plane for = 6, 8, and at 8,000, 9,000, and .
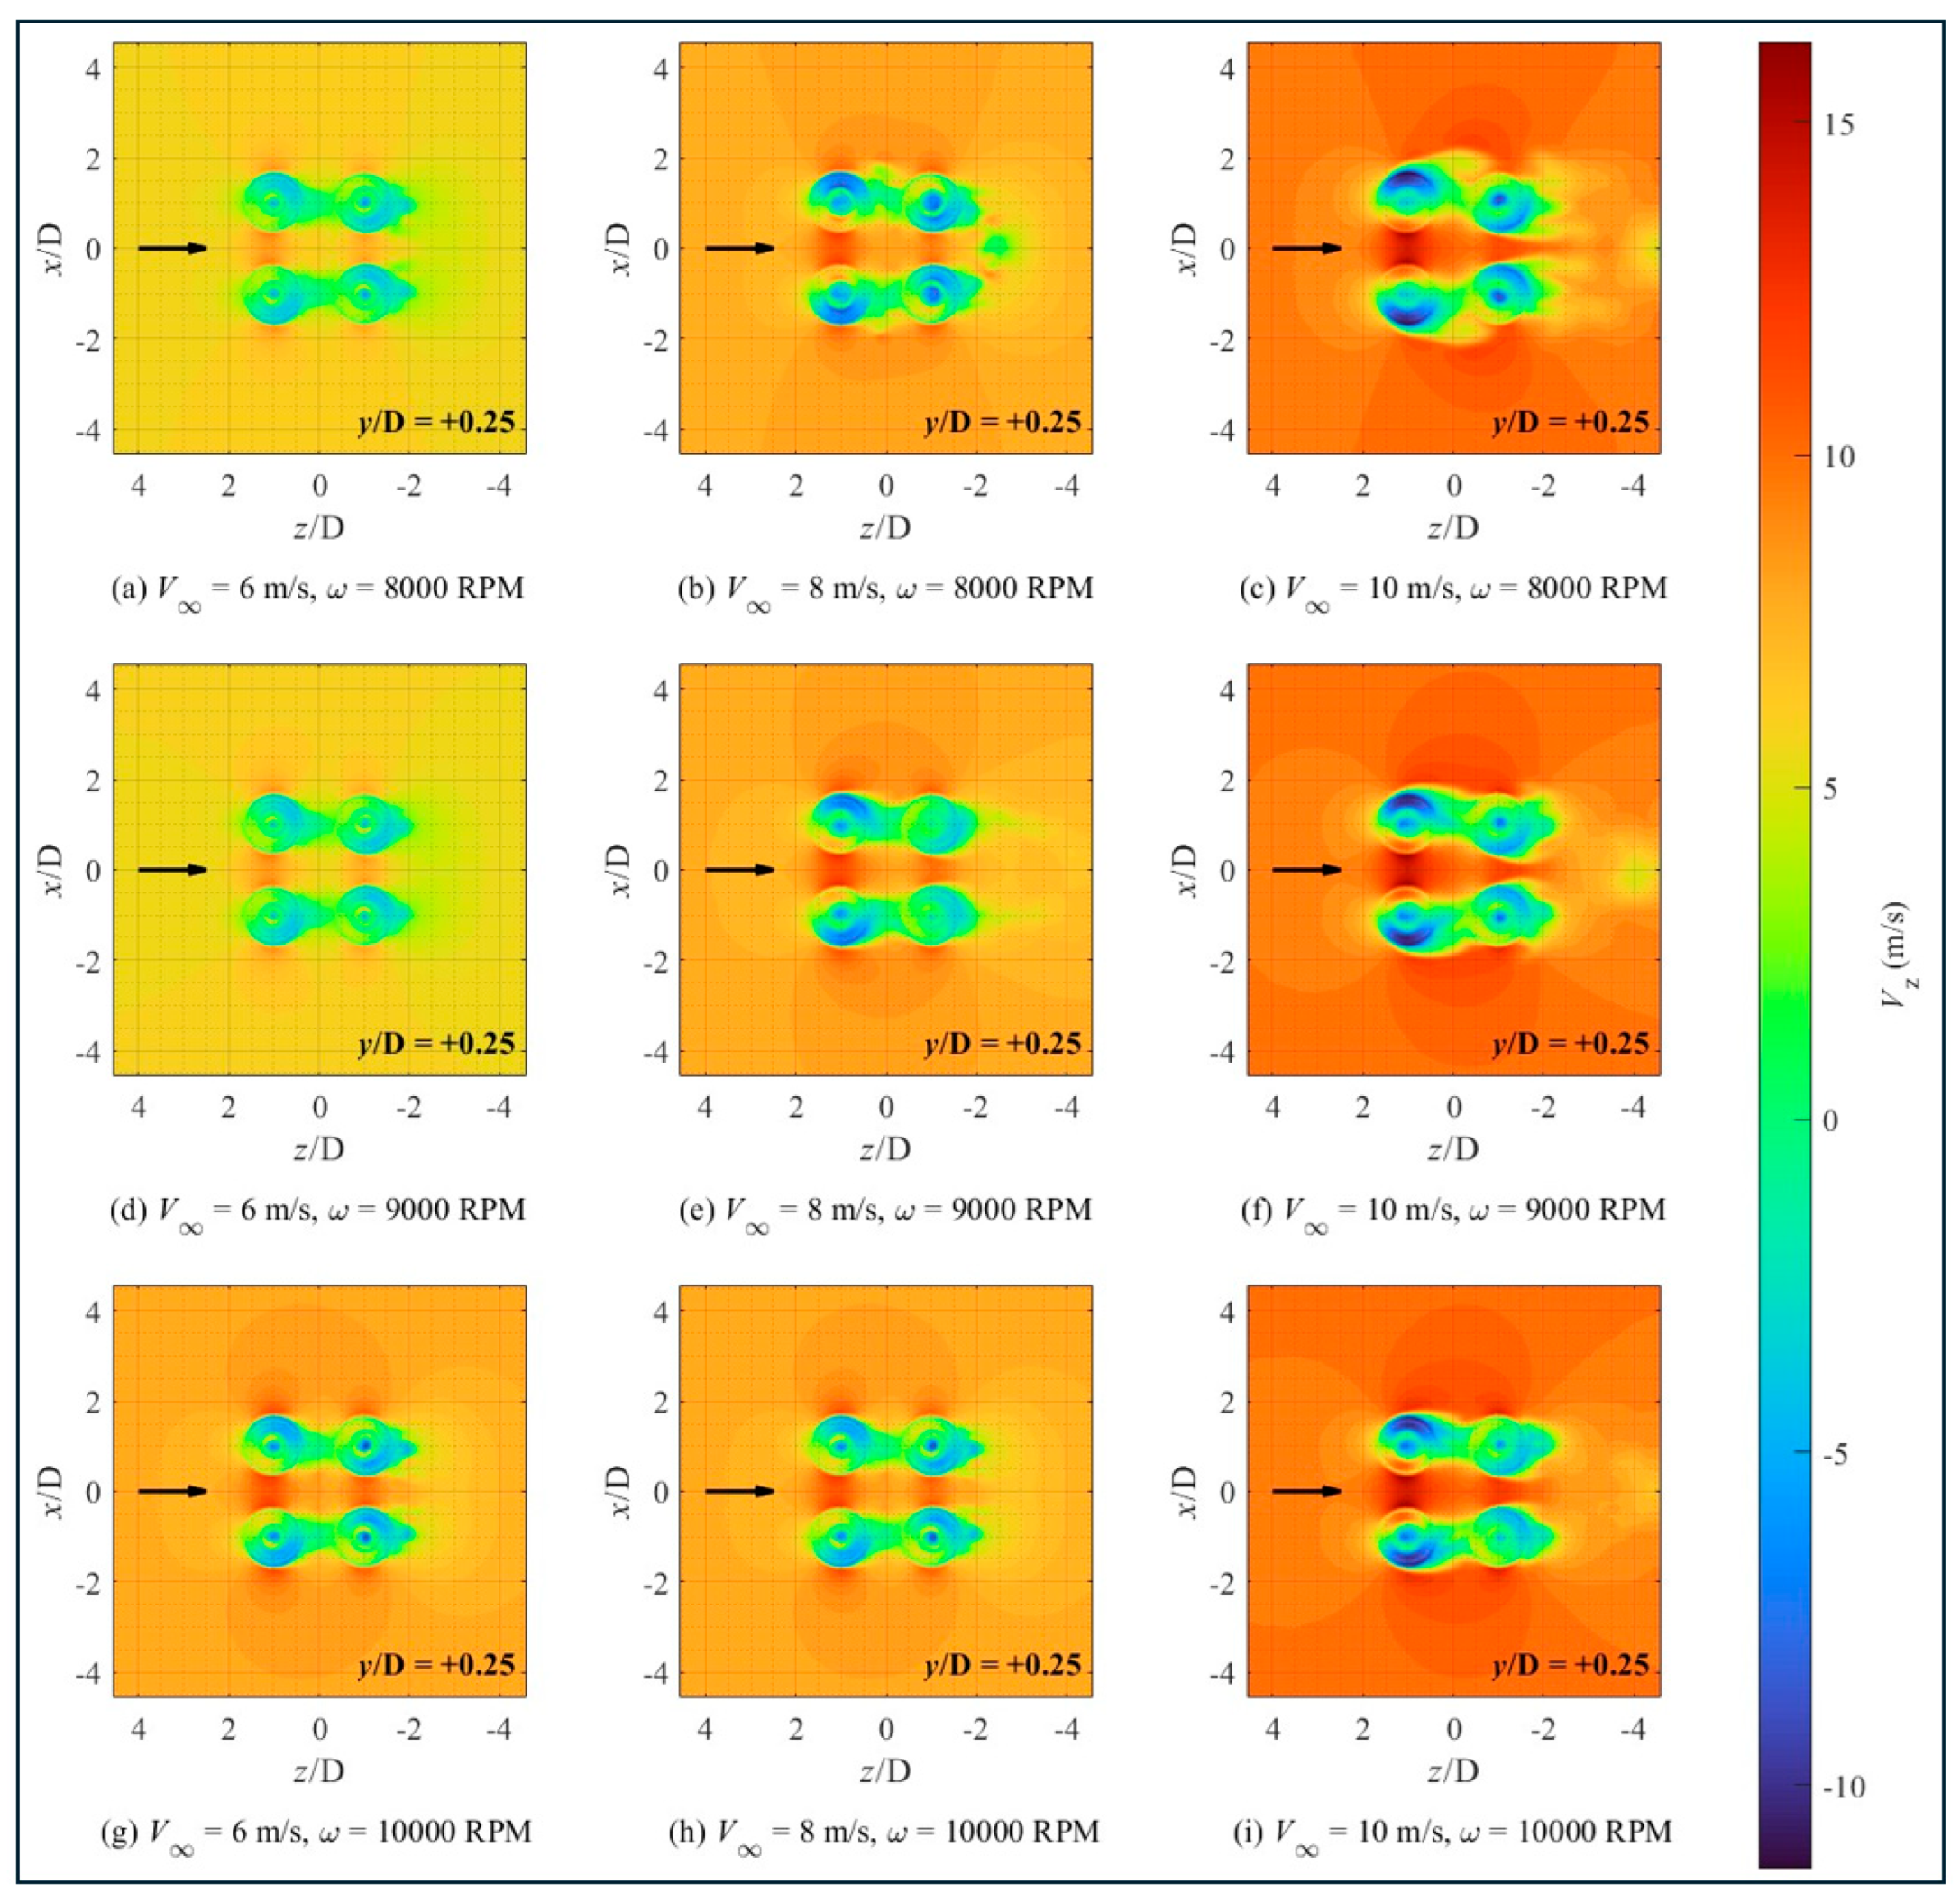
Figure 13.
Axial velocity component contours at the downwash plane for = 6, 8, and at 8,000, 9,000, and .
Figure 13.
Axial velocity component contours at the downwash plane for = 6, 8, and at 8,000, 9,000, and .
Disclaimer/Publisher’s Note: The statements, opinions and data contained in all publications are solely those of the individual author(s) and contributor(s) and not of MDPI and/or the editor(s). MDPI and/or the editor(s) disclaim responsibility for any injury to people or property resulting from any ideas, methods, instructions or products referred to in the content. |
© 2026 by the authors. Licensee MDPI, Basel, Switzerland. This article is an open access article distributed under the terms and conditions of the Creative Commons Attribution (CC BY) license.
Copyright: This open access article is published under a Creative Commons CC BY 4.0 license, which permit the free download, distribution, and reuse, provided that the author and preprint are cited in any reuse.


