

Submitted:
21 July 2026
Posted:
21 July 2026
You are already at the latest version
Abstract
Rapid growth in artificial intelligence, machine learning, and high-performance computing has substantially increased data centre rack power densities, resulting in higher heat generation and more demanding cooling requirements. As water remains widely used in many cooling systems, understanding the relationship between cooling technologies and water consumption is essential for improving cooling efficiency and sustainability. This paper presents a survey of reported water usage effectiveness (WUE) across 83 data centre entries, providing a combined dataset that links WUE with and cooling categories. The reported data shows that 23 of these data centres exceed 0.4 L/kWh, which is a sustainability target specified by the Climate Neutral Data Centre Pact for new data centres. Dry facilities employing closed-loop liquid cooling require essentially no water, while evaporative systems typically report water usage effectiveness values up to 2.5 L/kWh. WUE is determined by heat rejected through evaporative cooling towers, which is driven by heat removed from servers and transferred to the facility cooling system. One-dimensional heat transfer models are developed to provide heat transfer coefficients for different cooling mechanisms widely used for cooling servers within data centres, including air cooling, single-phase immersion cooling, direct liquid cooling, and two-phase immersion cooling. While air cooling with a low heat transfer coefficient is widely used in small-scale data centres, direct liquid and two-phase immersion cooling provide heat transfer coefficient with three orders of magnitude higher and are increasingly deployed in high-density facilities, offering a viable route to near-zero water consumption in both new and retrofitted installations. An analysis for indicative WUE based on cooling mechanisms.
Keywords:
data centre cooling
; water usage effectiveness (WUE)
; thermal management
; evaporative cooling
; convective heat transfer
; sustainable cooling
1. Introduction
In recent decades, global digitalisation has driven a rapid increase in demand for computing infrastructure. Data centres – a specialised facility that house and operate information technology (IT) infrastructure for delivering digital applications and services – form the backbone of this digital economy [1]. They broadly fall into two categories: enterprise or colocation facilities, which serve individual organisations or multiple tenants at moderate scale, and hyperscale facilities, operated by cloud and technology providers at massive scale, defined by IBM as housing at least 5,000 servers [2]. Alongside growth in total capacity, compute density (the power consumed per rack of servers) has increased substantially, driven by high-performance computing (HPC), machine learning (ML), and artificial intelligence (AI) workloads [3]. This is supported by the fact that the average rack power densities reportedly increased six-fold in a decade, from 2015 to 2024 [4].
This escalation in compute density directly increases thermal loads within server environments. Where heat cannot be removed at a sufficient rate, servers undergo thermal throttling, whereby processing power is deliberately reduced to prevent overheating [5]. Such performance degradation is undesirable, necessitating increasingly effective thermal management strategies. A data centre cooling architecture comprises two subsystems: the server-level cooling method, which transfers heat from IT equipment to a working fluid, and the heat rejection method, which transports that heat to the ambient environment. Historically, low-density facilities relied on air cooling with no water consumption. As power densities increased, evaporative heat rejection became widespread, exploiting the latent heat of evaporation of water to enhance rejection capacity – but inherently consuming water in the process [6].
Contemporary data centres employ a range of heat rejection topologies (or cooling topologies) that differ markedly in their water demand. Evaporative cooling systems, characterised by cooling towers and adiabatic coolers consume water continuously during operation [7]. Free cooling systems reject heat directly to naturally cool ambient air or water bodies, removing the need for mechanical refrigeration. Where such sources remain sufficiently cool year-round, heat rejection can be achieved without evaporative assistance as well [8]. Hybrid cooling systems combine free cooling with evaporative capacity, engaging the latter only when ambient conditions are insufficient for dry rejection, and therefore exhibit water consumption that varies with climate and season [9]. Closed-loop (or dry) cooling systems use dry coolers to remove heat without evaporative cooling. Liquid-based server cooling is typically employed to remove heat without water consumption [10]. The selection among these topologies is governed by a combination of thermal load, climate, water availability, and regulatory context to directly determine the water intensity of facility operation.
Over the past decade, higher rack densities have driven growing adoption of liquid-based server cooling. For example, water, with approximately 25 times the thermal conductivity and 3,500 times the volumetric heat capacity of air, enables significantly greater convective heat transfer coefficients. This reduces the temperature difference required to dissipate a given heat flux, allowing liquid-cooled systems to operate with elevated coolant temperatures while maintaining acceptable chip temperatures. This reopens the possibility of dry heat rejection, potentially eliminating evaporative water consumption, and positions the server-side heat transfer coefficient as a useful thermodynamic indicator of water efficiency.
Data centre energy efficiency is commonly benchmarked using Power Usage Effectiveness (PUE), introduced by The Green Grid (data centre efficiency standards body) as the ratio of total facility energy to IT equipment energy [11]. PUE captures only energy consumption and overlooks other environmental impacts, particularly water use. This has motivated the development of complementary metrics. To quantify water consumption, the industry has adopted Water Usage Effectiveness (WUE), also introduced by The Green Grid in 2011 as the ratio of annual site water consumption to annual IT equipment energy, expressed in litres per kilowatt-hour [12]. Lower WUE values indicate reduced water intensity, with an ideal value of zero corresponding to cooling systems requiring no evaporative water consumption. While WUE reporting has become increasingly common, it remains voluntary, and methodological transparency regarding how reported values are achieved is often limited. As a result, not only is a systematic review of WUE limited, but integrated analysis linking WUE with cooling topologies and data centre scale is also largely lacking.
Even where such variables are analysed together, the underlying thermal behaviour that govern differences between air- and liquid-based cooling systems are often not explicitly resolved. It is widely stated that air cooling is insufficient for managing increasing heat loads, while liquid cooling is more effective in reducing water use and improving thermal performance. However, the fundamental link between these observations and heat transfer coefficients remains underexplored.
To address the above knowledge gaps, this paper presents a structured review of contemporary data centre’s thermal management technologies and their reported WUE performance. The study constructs an integrated dataset of WUE, cooling mechanisms, and data centre scale, enabling investigation of possible relationships and trend behaviour among these variables. In parallel, simplified heat transfer models with analytical solutions are developed to predict heat flux from electronic chips and the working fluid, which will be used to establish to an order-of-magnitude estimate of WUE across different cooling mechanisms. By linking fundamental heat transfer principles with industry-reported water metrics, this work aims to provide a clearer physical basis for evaluating water-efficient cooling strategies.
2. Methodology
2.1. Literature Review Methodology
Source identification was conducted using web searches including Google Search, Google Scholar, ScienceDirect, Scopus, IEEE Xplore, and Web of Science. However, WUE is primarily an operational performance metric used in industry practice and is therefore commonly reported in corporate sustainability reporting and technical documentation. Therefore, the majority of reported WUE values originate from industry articles, news reports, sustainability disclosures, and technical white papers rather than peer-reviewed literature. Search terms included “WUE”, “water usage effectiveness”, “data centre cooling”, and “data centre water use”, along with related variations. Each source identified through this process was subsequently retrieved and reviewed to verify its relevance, accuracy, and suitability for inclusion. Sources were screened to determine whether they reported both a thermal management approach (cooling or heat rejection method) and an associated WUE value. Sources that specified the scale of the data centre (e.g. IT capacity in watts) were preferred. However, this was not used as a strict exclusion criterion.
Some sources did not report WUE values for individual facilities but instead reported fleet-average WUE values across multiple data centres. In the absence of more detailed facility-level data, these fleet-average values were included in this review. However, it is acknowledged that fleet-average values may obscure variation between individual facilities and should therefore be interpreted with this limitation in mind.
2.2. Modelling
a) General modelling framework
Typically, in a data centre, the thermal chain begins with electronic components within servers, which generate heat and serve as the primary heat source. This heat is transferred through the thermal interface material and heat sink to a working fluid with a lower temperature than the chip. As the working fluid absorbs heat, it transports the thermal energy away from the chips and transfers it to a secondary cooling loop. The secondary cooling fluid then carries the heat to an evaporative cooling tower (if employed), where a portion of the water evaporates to reject heat to the atmosphere. This evaporation represents the primary water consumption pathway in the cooling system and introduces the importance of WUE. The process is illustrated in the flow chart in Figure 1
WUE is determined by the amount of water consumed during the heat rejection process relative to the IT energy load. Consequently, the heat transfer capability between the electrical component and the working fluid is an important factor influencing the overall cooling performance and the amount of heat that must be rejected at the facility level, thereby affecting the WUE. WUE is defined as
Four representative server-level cooling mechanisms are considered in this analysis including: air cooling, direct liquid cooling and single-phase (1-PIC) and two-phase immersion cooling (2-PIC). Among these cooling mechanisms, the first three rely on convective heat transfer, with the heat transfer rate governed by the Reynolds number, thermophysical properties of the working fluid, and the geometrical design of the heat sink. Air cooling remains the most widely deployed server-level cooling method. Fans draw ambient or conditioned air across finned heatsinks mounted directly to processors, dissipating heat by forced convection. Microchannel cold plate direct liquid cooling (DLC) circulates a liquid coolant through a metal cold plate in direct contact with the processor surface. The cold plate contains an array of microchannels, which maximise the wetted surface area and promote high convective heat transfer. Heat is absorbed by the coolant and transported away from the processor. Single-phase immersion cooling is a liquid cooling method in which servers are fully submerged in a dielectric fluid that removes heat through sensible heating while remaining in the liquid state, whereas two-phase immersion cooling uses a dielectric fluid. As the fluid boils at the surface of heated components, it absorbs a large amount of heat through its latent heat of evaporation. The vapour rises, condenses on a cooled coil at the top of the tank, and returns as liquid. This mechanism yields substantially higher heat transfer coefficients than either air or single-phase liquid cooling.
b) Convective cooling
Forced convection
The following methodology is applied to convective cooling technologies, including air cooling, single-phase liquid cooling, and direct liquid cooling, unless noted otherwise. A schematic diagram of electronic cooling using a fin-based heat sink and a working fluid (either air or water is used in this study) is shown in Figure 2. HTC is a function of Reynolds number, fluid’s properties and geometrical designs. The model assumes steady one-dimensional, incompressible, single-phase flow. The convective heat transfer coefficient for single-phase flow was evaluated using appropriate Nusselt number correlations based on Reynolds number. Temperature dependent properties of the fluids are considered in this study.
For the air-cooled fin-based heat sink (), operating in the transitional-to-turbulent flow regime ( the Gnielinski correlation [13] was employed as shown below
where f is the friction factor corresponding to hydraulically smooth walls and incorporates a correction factor for thermally and hydrodynamically developing flow. ReD is Reynolds number using the hydraulic diameter and Pr is Prandtl number.
For typical fin-based heat sink, the length of the fins is not usually long enough for the flow to be fully developed, a correction factor to the above equation is used to account for developing flow [13]:
where is the channel length and Dh is hydraulic diameter which is the ratio between cross-sectional flow area and wetted perimeter. The hydraulic diameter was used to characterise the non-circular cross-sectional geometry for both an air-cooled heat sink and the liquid-cooled microchannel cold plate, with aspect ratio up to 8 used in the present study.
The same framework, Eqs (2) to (3), is used for single phase immersion cooling. However for direct liquid cooling, the flow is usually laminar, and so the Nusselt number was evaluated as a function of channel aspect ratio proposed in [14] (which is in the range between 3.61 to 6.45). This approach captures the geometric dependence of convective heat transfer in rectangular channels.
In both the laminar and turbulent cases, the average convective heat transfer coefficient was then evaluated from the definition of the Nusselt number:
where is the thermal conductivity of the working fluid.
Free convection
For the single-phase immersion cooling case operating under natural convection where the flow is buoyancy-driven: the heated surface warms the adjacent fluid, and the resulting density gradient sets up a convective boundary layer.
In this regime the heat transfer coefficient is a function of the Rayleigh number, the fluid properties, and the geometry of the heated element. The model retains the assumption of steady, single-phase heat transfer, and temperature-dependent fluid properties are considered.
The heat-dissipating elements are treated as isolated vertical cylinders, for which the buoyant boundary layer develops along the element height. The relevant length scale in both the Rayleigh and Nusselt numbers is therefore the vertical height L. The Rayleigh number is defined as:
where is gravitational acceleration, the coefficient of thermal expansion, and the surface and bulk-fluid temperatures respectively, the kinematic viscosity, and the Prandtl number.
The Nusselt number was evaluated using the Churchill–Chu correlation [15], which provides a single expression valid across the full laminar-to-turbulent range:
Similarly to before, the average convective heat transfer coefficient was then evaluated from the definition of the Nusselt number:
Unlike the forced-convection case, the heat transfer coefficient and the surface-to-fluid temperature difference are not independent: the buoyant driving force ) governs h through Eqs. (5) - (6), while the imposed heat flux requires that h and together satisfy the surface energy balance:
Because h itself depends on , Eqs. (5) - (8) were solved simultaneously. For a prescribed heat flux , the temperature difference was obtained by fixed-point iteration: an initial was assumed, h evaluated from Eqs. (5) - (7), an updated temperature computed from Eq. (8), and the process repeated until convergence.
c) Two-phaseimmersion cooling
A schematic diagram of electronic cooling using a two-phase immersion approach is shown in Figure 3 where nucleate boiling is expected to dominate the heat transfer process.
The local nucleate boiling heat flux is then evaluated in using the Rohsenow correlation for nucleate boiling [13]:
where is excess temperature, is the liquid dynamic viscosity, is the latent heat of vaporisation, is gravitational acceleration, and are the saturated liquid and vapor densities, is the surface tension, is the liquid specific heat and is the liquid Prandtl number. The thermophysical properties are all to be evaluated at the saturation temperature .
The parameters and are empirical constants that depend on the fluid-surface combination and surface condition. For nucleate boiling of water, the exponent is typically used [13], while is treated as a tuning parameter. For boiling between water and copper surfaces, as examined here, values of have been reported [13]. In the present work, was adopted for fitting purposes.
An effective nucleate boiling heat transfer coefficient is then obtained by relating the predicted heat flux to the imposed excess temperature:
The Rohsenow correlation does not explicitly account for mass flux effects, as it was originally developed for pool boiling. Its application here therefore assumes that nucleate boiling at the heated surface dominates heat transfer, with convective transport associated with bulk flow considered secondary. As such, it is applied as a first-order estimate of nucleate boiling heat transfer.
A summary is given in Table 1 which outlines the server-level cooling mechanisms considered in this work, their governing equations, and the corresponding facility-level heat rejection topologies. It is important to note that multiple heat exchangers exist throughout the heat dissipation loop in a data centre. However, this study focuses only on the heat transfer mechanisms directly between the server and the working fluid (referred to as the “cooling mechanism” in Table 1), compared to the “heat rejection topologies” that represent cooling at the scale of the entire data centre, where WUE is typically evaluated.
3. Results
3.1. Review Summary
a) General insights into data centre cooling
The choice of cooling topology is not only a technical decision but also an allocation of water, regulatory, and financial risk. Evaporative systems are vulnerable to climate-driven water scarcity. Rising temperatures increase cooling demand and water consumption, intensifying competition with municipal and agricultural users. Regulatory scrutiny is also increasing. For example, California’s Water Measurement Regulation requires eligible water users to measure withdrawals and report annual data [21]. Facilities with WUE above 1 L/kWh may face growing pressure to justify consumption or invest in upgrades, while low-water liquid-cooling systems align more closely with emerging sustainability objectives.
The financial implications are substantial. For a 10 MW facility, the difference in annual water costs between an evaporative system and a closed-loop liquid system can amount to hundreds of thousands of dollars under typical water tariffs. Published Australian charges of roughly $1-3/m3 support these estimates [22].
Despite these benefits, liquid cooling adoption remains constrained by retrofit costs, downtime, and operational complexity. Existing facilities often require coolant distribution units, leak-detection systems, and specialised maintenance expertise, making implementation challenging for enterprise and colocation operators. The sustainability advantage of liquid cooling also depends on context. Although liquid-cooled systems generally achieve lower PUE through reduced fan energy, additional pumping requirements and the embodied impacts of cooling infrastructure may offset some benefits, particularly in regions with carbon-intensive electricity grids. In contrast, regions with low-carbon electricity, such as Scandinavia, can achieve strong water and carbon performance simultaneously. Consequently, cooling technologies should be evaluated on a region-specific basis.
Hyperscale and HPC operators have adopted liquid cooling more readily due to higher thermal densities, providing a pathway for technology maturation and cost reduction. As systems become more standardised and modular, adoption barriers for smaller facilities are expected to decrease.
Climate and geography strongly influence cooling strategy. Cool climates can support extensive free cooling, enabling WUE values close to zero, although backup cooling is generally required during unusually warm periods. In warmer regions, free cooling is typically seasonal, requiring hybrid operation with evaporative systems and preventing annual WUE from reaching zero. Climate also affects the feasibility of dry cooling. Higher ambient temperatures reduce the temperature difference available for heat rejection, increasing the server-side heat transfer performance required for effective dry operation. This strengthens the case for advanced liquid-cooling technologies such as direct liquid cooling (DLC) and two-phase immersion cooling (2-PIC) in warm climates.
b) Thermal management pathway
An illustration for a multi-scale thermal management framework, from system-level heat rejection to detailed chip-level heat transfer for convective cooling is depicted in Figure 4
For a fin-based heat sink, air flow dissipates heat from servers and gets warmer. Warm air from the server rack flows into units such as a Computer Room Air Conditioner (CRAC), Computer Room Air Handler (CRAH), or Air Handling Unit (AHU), where it is cooled down. The cooled air is sent back to the servers, while the heat is carried away and released outside the building by evaporative tower. The direct heat dissipation between air flow and the servers is calculated in the following section.
For single-phase immersion cooling technology, liquid is used to remove heat from servers. Dielectric fluid flows through parts attached to the server, taking away heat. The warm liquid then goes to a coolant-to-water heat exchanger, where the heat is passed into water. The heat is finally carried away and released outside the building, keeping the servers cool and working properly.
For direct liquid cooling technology, heat is removed directly from the server using liquid. A small plate with microchannels channels is attached to the hot parts. Cool liquid flows through these channels, absorbing heat. The warmed liquid then moves to a heat exchanger, where the heat is passed to water and carried away outside the building.
Figure 5 illustrates the two-phase immersion cooling (2-PIC) process. In this system, the servers are placed in dielectric liquid that can boil safely. As the servers heat up, the liquid around them turns into vapor carrying heat away. The vapor then moves to a cooling surface, turns back into liquid and returns to the tank, repeating the cycle to keep the servers cool.
3.2. Water Usage Effectiveness (WUE)
Table 2 summarises 83 data centre entries included in this study and the corresponding references, including websites and published articles, used for data collection. It should be noted that some entries correspond to data centre fleets comprising multiple facilities. The same data centre names are referenced in Figure 6 and Figure 7.
The dataset, including the WUE and the cooling topologies, is presented in Figure 6 for data centres with WUE up to 0.4 L/kWh and Figure 7 for data centres with WUE above 0.4 L/kWh. The WUE of 0.4 L/kWh (i.e. 0.4 litres of water consumed per kilowatt-hour of IT energy) indicates a sustainability target specified by the Climate Neutral Data Centre Pact for new data centres in water-stressed regions using potable water. The “Zero consumption group” mentioned in Figure 6 comprises DCs 1-23 listed in Table 2, with WUE approximately zero.
It is worth noting that the data presented in Figure 6 and Figure 7 are subject to several limitations. Although the definition of WUE has been formally established by the Green Grid, minor differences in interpretation (such as system boundaries or the inclusion of auxiliary water uses) may still occur between organisations. Some WUE values represent averages across multiple data centres or entire facility fleets, which can obscure differences between individual sites as previously discussed. Also, WUE values are typically reported as annual averages, meaning seasonal fluctuations in water consumption are not reported. This is particularly relevant for water resource planning at a regional or utility level, as peak water demand may occur during warmer periods when evaporative cooling systems operate more intensively. WUE represents a relative efficiency metric rather than a measure of absolute water consumption. A large hyperscale data centre with a low WUE may still consume considerably more total water than a smaller facility with a higher WUE, due to differences in IT load. So WUE indicates the water consumed per unit of computing energy, and total water consumption is determined by both WUE and the IT load.
3.3. Categorising Cooling Topology
To further analyse the WUE database developed in this study, four categories of data centres were identified from the results presented in Figure 5 and Figure 6, each exhibiting distinct ranges of WUE. The results shown in Figure 7 were analysed from 10 evaporative DCs, 40 hybrid DCs, 12 free-cooling DCs, and 20 dry DCs. Although, the figures are very small compared to the number of operational DCs, they serve as adequate indicators of general performance for each mechanism.
Figure 8.
WUE as a function of cooling topology where Hybrid systems combine free cooling with evaporative capacity and Dry or Closed-loop can be used interchangeably. Data markers show average WUE.
Figure 8.
WUE as a function of cooling topology where Hybrid systems combine free cooling with evaporative capacity and Dry or Closed-loop can be used interchangeably. Data markers show average WUE.
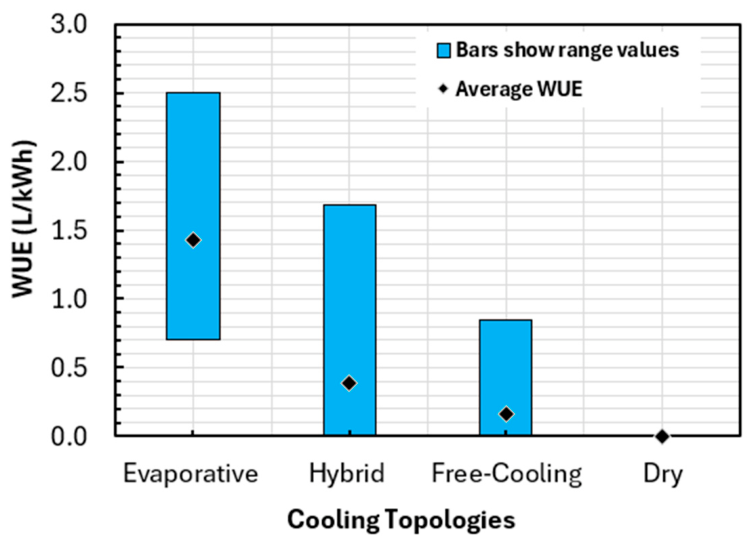
Based on the cooling technology characterisation in the literature review, WUE ranges from 0.7-2.5 L/kWh for evaporative systems, 0.01-2.25L/kWh for hybrid systems, 0-0.85 L/kWh for free cooling, and 0-0.009 L/kWh for dry systems. Dry systems consistently achieve the lowest water consumption, with many facilities reporting WUE ≈ 0, while evaporative systems exhibit the highest and most variable values.
3.3. Modelling Results
a) Heat transfer coefficients
The HTC values obtained using Eqs. (2) - (10) for the four cooling mechanisms described earlier, namely air cooling, single-phase immersion cooling (1-PIC), direct liquid cooling (DLC), and two-phase immersion cooling (2-PIC), are presented in Figure 9.
For air cooling, the heat transfer coefficient (HTC) was estimated over a Reynolds number range of approximately 10 to 100 W/m2K, which is representative of airflow conditions encountered in fin-based CPU heat sinks with various fin geometries and channel configurations. The lower bound corresponds to natural convection conditions, whereas the upper bound represents advanced heat sink designs, such as cross-cut sinusoidal wavy plate-fin heat sinks [16]. The HTC was determined using the same modelling framework described previously.
The same framework was used to estimate the HTC for the single-phase immersion cooling (1-PIC) mechanism, with a dielectric liquid serving as the working fluid instead of air. In this study, Novec 7100 was selected due to its widespread use in dielectric immersion cooling applications, and its thermophysical properties were obtained from Cheng et al. [17] and Rokonuzzaman et al [18]. The HTC was found to range from 80 to 4,000 W/m2K, corresponding to the lowest and highest flow rates considered, respectively. These two values represent theoretical extremes where in practice, HTC values are expected to lie well within this range.
For direct liquid cooling, heat is dissipated through a microchannel cold plate mounted directly onto the electronic chip, which acts as the heat source. In this configuration, HTC predicted by the model depends primarily on the Reynolds number and the microchannel geometry. Nusselt numbers ranging from 3.61 to 6.45 were used for channels with different cross-sectional geometries and aspect ratios varying from 1 to 8 [14]. A minimum hydraulic diameter of 0.1 mm was selected based on the experimental study of a microchannel cold plate reported in [19], while the flow was restricted to the laminar regime (Re < ~ 2000). Under these conditions, the predicted HTC ranged from approximately 4,000 to 38,000 W/m2K.
Two-phase immersion cooling (2-PIC) relies on nucleate boiling at a heated copper surface, where heat is removed primarily through liquid vaporisation and the associated latent heat transfer. The heat transfer process in this regime is highly complex and governed by multiple interacting phenomena, including bubble nucleation, growth, departure, and l replenishment. In the absence of a more widely accepted predictive model for this mechanism, the Rohsenow correlation was adopted as discussed earlier. This model relates the heat transfer coefficient (HTC) to the wall superheat, defined as the temperature difference between the heated surface and the saturation temperature of the working fluid. Using excess temperatures ranging from 5 to 15 K, the predicted HTC was found to vary from approximately 10,000 to 70,000 W/m2K , respectively where experimental data was found from [20] between approximately 42,000 to 67,000 W/m2K for water saturated temperature at 100 oC.
b) Heat dissipation flux and normalised WUE
The average heat transfer coefficients obtained from Figure 8 were used to estimate heat dissipation from the heat sink as a function of excess temperature, defined as the temperature difference between the chip surface and the working fluid used in Eq. (9). For convective cooling methods, including air cooling, 1-PIC, and DLC, the working fluid temperature is typically the ambient temperature, which varies seasonally. Therefore, excess temperatures ranging from 5 to 70 °C were considered in Figure 10, while values up to 30 °C were used for the 2-PIC case. For a fixed working fluid temperature, a higher excess temperature results in higher heat dissipation from the chip. This, in turn, requires higher heat rejection capacity and water usage effectiveness (WUE) to maintain adequate cooling performance. Consequently, cooling performance generally improves during winter, when lower ambient temperatures (means lower working fluid temperatures) increase the excess temperature, and decreases during summer. It should be noted that, although the heat generated by the electrical component equals the heat dissipated to the working fluid under steady-state convective cooling, the heat sink typically has a much larger surface area than the chip. As a result, the heat flux at the heat sink surface is lower than the chip heat generation flux, especially for fin-based heat sinks. Therefore, the heat flux values presented in Figure 10 should be regarded as a lower reference when compared with chip-level heat fluxes. Despite being an order-of-magnitude analysis, Figure 10 provides useful guidance for selecting appropriate cooling technologies. For example, air cooling may be suitable for heat fluxes below 10 kW/m², single-phase immersion cooling for heat fluxes below 100 kW/m2, while DLC is preferable for heat fluxes exceeding 100 kW/m2 and 2-PIC for heat fluxes above 1000 kW/m2.
Assuming a thermal load of 1 MW, corresponding approximately to 1430 NVIDIAH100SXM electronic chips, the total chip surface area is approximately 1.164 m2 with ~ 814 mm2 each chip. Although the effective heat transfer area provided by a heat sink is typically larger than the chip surface area, the chip area is used here as a reference owing to the absence of a detailed heat sink design. It is further assumed that all heat rejection is achieved through evaporative cooling, with no secondary cooling loop. Under this assumption, the heat transferred directly from the chips to the working fluid is rejected through evaporation. As a result, the calculated water consumption may be regarded as an upper-bound estimate of the water consumption
The water usage per each MW thermal load was obtained from the following heat balance:
where is indicative heat dissipation flux obtained from Eq. (9) for 2-PIC, while for convective heat transfer it is calculated as:
with being the indicative heat transfer coefficient, obtained from the average values presented in Figure 9 for the three convective cooling mechanisms; is the indicative total die area of all 1430 electronic components assumed in this study, and in this study. is latent heat of evaporation for water which is 2,260 kJ/kg and is water density which is 998 kg/m3.
Figure 11 presents the estimated water usage by evaporation shown in Eq. (11) under the above assumptions for different cooling mechanisms. Results are shown for convective cooling with excess temperatures 10, 30, and 60°C, and 10 and 20 oC for 2-PIC.
The water consumption is expressed as an indicative or normalised WUE, estimated per megawatt of thermal load. While the analysis is intended as an order-of-magnitude assessment, it provides useful guidance on the expected range of WUE values for various cooling technologies. For example, for DLC operating with an excess temperature of approximately 20 °C, the corresponding normalised WUE is approximately 0.4 L/kWh. This value can be used as a first-order estimate of water consumption for data centres with similar thermal management configurations.
4. Conclusions
This study first provides a brief overview of data-centre cooling technologies, highlighting that cooling topology strongly influences water consumption, cost, operational risk, and sustainability outcomes. The review further demonstrates that liquid-cooling technologies can substantially reduce WUE, particularly when combined with dry heat rejection, while climate remains a key factor affecting cooling mechanism selection, dry-cooling potential, and achievable WUE.
The literature review shows that WUE is highly dependent on cooling topology, including evaporative, hybrid, free-cooling and dry cooling. Reported WUE values vary significantly, with a few configurations reaching up to 2.5 L/kWh, while 23 of the 83 data entries exceed 0.4 L/kWh, which is a sustainability target specified by the Climate Neutral Data Centre Pact for new data centres
An order-of-magnitude one-dimensional heat-transfer analysis was conducted for four cooling mechanisms: air cooling, single-phase immersion cooling (1-PIC), direct liquid cooling (DLC), and two-phase immersion cooling (2-PIC). The results indicate that 2-PIC can provide heat transfer coefficients (HTCs) approximately three orders of magnitude higher than those of air cooling. For high-density facilities with substantial heat fluxes from electronic components to the working fluid, cooling technologies with high HTCs are therefore essential for reducing water consumption and enabling dry heat rejection. The estimated HTCs were subsequently used to determine the heat dissipation flux achievable over a range of excess temperatures. The results provide useful guidance for cooling mechanism selection across applications spanning heat fluxes from a few to several thousand kW/m².
A further order-of-magnitude analysis was performed to estimate the water consumption associated with each megawatt of thermal load, under evaporative heat rejection assumption. The resulting values provide an upper-bound reference for WUE on a megawatt thermal-load basis. The analysis suggests that low-density facilities employing air cooling may exhibit negligible WUE even during summer conditions. In contrast, high-density facilities using DLC or 2-PIC may consume more than 0.4 litre per kWh for each MW thermal load. These values can serve as first-order estimates of water consumption for data centres operating under similar thermal-management configurations.
References
- Susnjara, S.; Smalley, I. What is a data center? IBM. Available online: https://www.ibm.com/think/topics/data-centers (accessed on 27 February 2026).
- Powell, P.; Smalley, I. What is a hyperscale data center? IBM. Available online: https://www.ibm.com/think/topics/hyperscale-data-center (accessed on 13 Mar 2026).
- SuperMicro. What is Liquid Cooling? Available online: https://www.supermicro.com/en/glossary/liquid-cooling (accessed on 27 February 2026).
- Lee, A.; McCormack, D. Data centres: Powering the growth of AI and cloud computing. Macquarie Assest Management. Available online: https://www.macquarie.com/assets/macq/mam/insights/2025/data-centers-powering-the-growth-of-ai-and-cloud-computing/data-centres-powering-the-growth-of-ai-and-cloud-computing.pdf (accessed on 27 February 2026).
- Brooks, D.; Martonosi, M. Dynamic thermal management for high-performance microprocessors. In Proceedings of the 7th International Symposium on High-Performance Computer Architecture (HPCA-7), Monterrey, Mexico, 2001; IEEE; pp. 171–182. [Google Scholar] [CrossRef]
- Jose, L. Data center Cooling Infrastructure. WordPress. Available online: https://dc.mynetworkinsights.com/data-center-cooling-infrastructure/ (accessed on 27 February 2026).
- Chu, J.; Huang, X. Research status and development trends of evaporative cooling air-conditioning technology in data centers. Energy Built Environ. 2023, vol. 4(no. 1), 86–110. [Google Scholar] [CrossRef]
- Zhang, H.; Shao, S.; Xu, H.; Zou, H.; Tian, C. Free cooling of data centers: A review. Renew. Sustain. Energy Rev. 2014, vol. 35, 171–182. [Google Scholar] [CrossRef]
- Sickinger, D.; Geet, O. V.; Belmont, S.; Carter, T.; Martinez, D. Thermosyphon Cooler Hybrid System for Water Savings in an Energy-Efficient HPC Data Center," National Renewable Energy Laboratory, 2018. Available online: https://docs.nlr.gov/docs/fy18osti/72196.pdf (accessed on 14 November 2025).
- Ebrahimi, Khosrow; Jones, G. F.; Fleischer, A. S. A review of data center cooling technology, operating conditions and the corresponding low-grade waste heat recovery opportunities. Renew. Sustain. Energy Rev. 2014, vol. 31, 622–6388. [Google Scholar] [CrossRef]
- The Green Grid, "PUE™: A COMPREHENSIVE EXAMINATION OF THE METRIC. Accessed. 2012. (accessed on 13 Mar 2026).
- The Green Grid, "WATER USAGE EFFECTIVENESS (WUE™): A GREEN GRID DATA CENTER SUSTAINABILITY METRIC. Accessed. 2011. (accessed on 17 Nov 2025).
- Bergman, T. L.; Lavine, A. S. Fundamentals of Heat and Mass Transfer Eighth Edition; Wiley, 2017. [Google Scholar]
- Cengel, Y. A. Heat transfer A practical Approach Second Edition; McGraw-Hill, 2002. [Google Scholar]
- Churchill, S. W. C.; Humbert, H. S. Correlating equations for laminar and turbulent free convection from a vertical plate. Int. J. Heat Mass Transf. 1975, vol. 18, 1323–2329. [Google Scholar] [CrossRef]
- Nilpueng, K.; Ahn, H. S.; Jerng, D.-W.; Wongwises, S. Heat transfer and flow characteristics of sinusoidal wavy plate fin heat sink with and without crosscut flow control. Int. J. Heat Mass Transf. 2019, vol. 137, 565–572. [Google Scholar] [CrossRef]
- Cheng, C.-C.; Chang, P.-C.; Li, H.-C.; Hsu, F.-I. Design of a single-phase immersion cooling system through experimental and numerical analysis. Int. J. Heat Mass Transf. 2020, vol. 160, Art no. 120203. [Google Scholar] [CrossRef]
- Rokonuzzaman, S. M.; Erdem, K.; Şahin, B.; Özdemir, M. R. Experimental study of a single-phase immersion cooling system with natural and forced convection. Int. J. Therm. Sci. vol. 214, 2025. [CrossRef]
- Tuckerman, D. B.; Pease, R. F. W. High-Performance Heat Sinking for VLSI. IEEE Electron Device Lett. 1981, vol. EDL-2(no. 5), 126–129. [Google Scholar] [CrossRef]
- Yang, L.; Hong, F.; Cheng, P. Pool boiling enhancement through a guidance structure mounted above heating surface. Int. J. Heat Mass Transf. 2019, vol. 139, 751–763. [Google Scholar] [CrossRef]
- The California Water Boards. Water Measurement Regulation. Available online: https://www.waterboards.ca.gov/waterrights/water_issues/programs/diversion_use/water_measurement.html (accessed on 20 March 2026).
- Muray River Council. 2025-2026 Rates and Charges. Available online: https://www.murrayriver.nsw.gov.au/files/assets/public/v/1/documents/ipampr-docs-and-budgets/2025-2026/2025-26-rates-and-charges-explainer-for-website.pdf (accessed on 28 May 2026).
- LiquidStack, "Two-Phase Liquid Immersion Cooling 2022 Case Study," November 14 2025 2022. Available online: https://liquidstack.com/content/uploads/2022/05/2022-Case-Study.pdf.
- Solomon, S. Sustainable by design: Next-generation datacenters consume zero water for cooling. Microsoft. Available online: https://www.microsoft.com/en-us/microsoft-cloud/blog/2024/12/09/sustainable-by-design-next-generation-datacenters-consume-zero-water-for-cooling/ (accessed on 14 November 2025).
- QTS. "Pioneering Water Efficiency and Sustainability in Data Center Operations. Available online: https://qtsdatacenters.com/resources/pioneering-water-efficiency-and-sustainability-in-data-center-operations/ (accessed on 14 November 2025).
- Ixora. Unlock Cost Savings and Sustainability with iXora's Advanced Immersion Cooling Solution. Available online: https://www.ixora.eu/ixora-immersion-cooling-roi-analysis/ (accessed on 14 November 2025).
- Black; Veatch. Commissioning for World’s First Zero-Water Consumption Data Center. Available online: https://www.bv.com/projects/commissioning-for-worlds-first-zero-water-consumption-data-center (accessed on 14 November 2025).
- Construction, D.P.R. Facebook Travels Abroad. Available online: https://www.dpr.com/media/blog/facebook-data-center-goes-online (accessed on 14 November 2025).
- Reuters. "Google Uses Sea Water to Cool Finland Data Center. Available online: https://www.reuters.com/article/business/environment/google-uses-sea-water-to-cool-finland-data-center-idUS2576036493/ (accessed on 14 November 2025).
- CyrusOne, "2020 SUSTAINABILITY REPORT. Accessed. 2021. (accessed on 26 Nov 2025).
- Data Center Map. "Ardent Boden. Available online: https://www.datacentermap.com/sweden/boden/hydro66/ (accessed on 26 Nov 2025).
- Robertsén, F. Sustainability in HPC, a look at LUMI. Available online: https://www.bnl.gov/modsim/events/2024/files/talks/fredrik-robertsen.pdf (accessed on 7 June 2026).
- Vantage Data Centers. Phoenix (AZ1) Data Center Campus. Available online: https://vantage-dc.com/data-center-locations/north-america/phoenix-arizona/ (accessed on 10 Dec 2025).
- Vantage Data Centers. Ashburn (VA1) Data Center Campus. Available online: https://vantage-dc.com/data-center-locations/north-america/ashburn-i-virginia/ (accessed on 10 Dec 2025).
- Vantage Data Centers. Johannesburg I (JNB1) Data Center Campus. Available online: https://vantage-dc.com/data-center-locations/emea/johannesburg-i-south-africa/ (accessed on 10 Dec 2025).
- Centers, V. D. Cyberjaya (KUL1) Data Center Campus. Available online: https://vantage-dc.com/data-center-locations/apac/cyberjaya-i-malaysia/ (accessed on 10 Dec 2025).
- Vantage Data Centers. "Melbourne (MEL1) Data Center Campus. Available online: https://vantage-dc.com/data-center-locations/apac/melbourne-australia/ (accessed on 10 Dec 2025).
- Novva Data Centers. Water-Free Data Center Cooling. Available online: https://www.novva.com/data-center-services/water-free-cooling/ (accessed on 10 Dec 2025).
- Amberside Advisors. "Collaboration with innovative Lefdal Mine Data Centers in Norway." AJM Website Design. Available online: https://www.amberside.uk/projects/amberside-advisors'-collaboration-with-innovative-lefdal-mine-datacenter-in-norway (accessed on 10 Dec 2025).
- Bitfury, "BITFURY LAUNCHES 40MW ENERGY EFFICIENT IMMERSION COOLING DATA CENTER. Bitfury. Accessed. 2015. (accessed on 18 Dec 2025).
- Scaleway. Impact Report 2025. Available online: https://www-uploads.scaleway.com/Impact_Report2025_22ee3a8232.pdf (accessed on 7 June 2026).
- Chindata Group. Chindata and Vertiv Release ‘X-Cooling’, World’s First Zero-WUE Waterless Cooling Technology. Available online: https://www.prnewswire.com/news-releases/chindata-and-vertiv-release-x-cooling-worlds-first-zero-wue-waterless-cooling-technology-301600035.html (accessed on 28 May 2026).
- GIGABYTE. Japanese Telco Leader KDDI Invents Immersion Cooling Small Data Center with GIGABYTE. Available online: https://www.gigabyte.com/Article/japanese-telco-leader-kddi-invents-immersion-cooling-small-data-center-with-gigabyte (accessed on 28 May 2026).
- Microsoft. Microsoft to expand cloud region in Johor Bahru, empowering Southeast Asia’s AI Transformation. Available online: https://news.microsoft.com/source/asia/features/microsoft-to-expand-cloud-region-in-johor-bahru-empowering-southeast-asias-ai-transformation/ (accessed on 28 May 2026).
- Prime Data Centers. 2025 Sustainability Report. Available online: https://primedatacenters.com/wp-content/uploads/2025/08/Prime-Data-Centers_2025-Sustainability-Report_FINAL-optimised.pdf (accessed on 7 June 2026).
- HPCwire. "Allied Control Announces DataTank 1.4MW Container Datacenter." TCI Media Publication. Available online: https://www.hpcwire.com/off-the-wire/allied-control-announces-datatank-1-4mw-container-datacenter/ (accessed on 14 November 2025).
- AWS. AWS Cloud. Available online: https://sustainability.aboutamazon.com/products-services/aws-cloud (accessed on 26 Nov 2025).
- King, C. How is AWS Making Data Centres More Sustainable? Sustainablity Magazine. Available online: https://sustainabilitymag.com/articles/aws-unveils-next-gen-data-centres-for-ai-computing-demands (accessed on 26 Nov 2025).
- About Amazon Team. Local community buildings in Ireland to be heated by Amazon data centre." Amazon.com. Available online: https://www.aboutamazon.eu/news/amazon-web-services/local-community-buildings-in-ireland-to-be-heated-by-amazon-data-centre (accessed on 26 Nov 2025).
- Microsoft. Modern datacenter cooling. Available online: https://datacenters.microsoft.com/wp-content/uploads/2023/05/Azure_Modern-Datacenter-Cooling_Infographic.pdf (accessed on 5 June 2026).
- Microsoft. Microsoft Datacenters. Available online: https://datacenters.microsoft.com/sustainability/efficiency/ (accessed on 10 Dec 2025).
- Microsoft. Ireland Microsoft commitments. Available online: https://datacenters.microsoft.com/globe/pdfs/sustainability/factsheets/Ireland%20(North%20Europe).pdf (accessed on 7 June 2026).
- OVHcloud. 2023 NON FINANCIALPERFORMANCE STATEMENT. Available online: https://corporate.ovhcloud.com/sites/default/files/2023-12/dpef_en_ovhcloud.pdf.
- Eco Voice. OVHcloud launches next-generation of AI-powered cooling that balances performance and environmental responsibility in its data centres. Available online: https://www.ecovoice.com.au/ovhcloud-launches-next-generation-of-ai-powered-cooling-that-balances-performance-and-environmental-responsibility-in-its-data-centres/ (accessed on 18 Dec 2025).
- Microsoft. Microsoft datacenters in Netherlands. Available online: https://local.microsoft.com/wp-content/uploads/2025/10/Microsoft-datacenters-in-Netherlands.pdf (accessed on 7 June 2026).
- Water Services Assoication of Australia, "DATA CENTRES AND WATER IN AUSTRALIA. Accessed. 2025. (accessed on 18 Dec 2025).
- Swinhoe, D. ServerDomes to use LiquidCool’s immersion cooling technology." Data Centre Dynamics. Available online: https://www.datacenterdynamics.com/en/news/serverdomes-to-use-liquidcools-immersion-cooling-technology/ (accessed on 10 Dec 2025).
- ServerDome. ServerDomes Energy and Water Savings Report. Available online: https://serverdomes.com/resources/energy-and-water-savings-report/ (accessed on 10 Dec 2025).
- atNorth. Sustainability Report 2024. Available online: https://www.atnorth.com/wp-content/uploads/2025/04/Sustainability-Report-2024-web.pdf (accessed on 7 June 2026).
- Alibaba Group. Alibaba Cloud launches new energy-efficient Qiandao Lake Data Center. Available online: https://www.alibabacloud.com/en/press-room/alicloud-launches-new-energy-efficient-qiandao-lake-data-center (accessed on 14 November 2025).
- LuxConnect. LuxConnect’s commitment to water efficiency: A leading example in the Data Center industry. Available online: https://www.luxconnect.lu/water-efficiency-datacenter-industry/ (accessed on 18 Dec 2025).
- LuxConnect. SUSTAINABILITY – IT'S TIME TO BE GREEN." LuxConnect. Available online: https://www.luxconnect.lu/sustainability/ (accessed on 18 Dec 2025).
- Facebook Sustainability. Enhancing Water Efficiency Through Advanced Cooling Technology. Available online: https://sustainability.fb.com/wp-content/uploads/2020/12/FB_Enhancing-Water-Efficiency-Through-Advanced-Cooling-Technology.pdf (accessed on 7 June 2026).
- Law, M. Microsoft Unveils Zero-Water Cooling for AI Data Centres. DataCentre Magazine. Available online: https://datacentremagazine.com/articles/microsoft-unveils-zero-water-cooling-for-ai-data-centres (accessed on 10 Dec 2025).
- OVHcloud. OVHcloud opens new data centre in Sydney, powered by latest water cooling technology to sustainably meet increasing demands for high compute cloud solutions. Available online: https://corporate.ovhcloud.com/en/newsroom/new-datacentre-sydney/ (accessed on 10 Dec 2025).
- Mountain, Green. Green Mountain Sustainability Report 2024. Available online: https://greenmountain.no/wp-content/uploads/Green-Mountain-Sustainability-report-2024.pdf (accessed on 14 November 2025).
- Huawei Digital Power. Building a Low-Carbon Smart Future | Global Smart Green Data Center Summit 2023 Kicks Off. Available online: https://digitalpower.huawei.com/en/news/data-center-facility/658 (accessed on 28 May 2026).
- AirTrunk. AIRTRUNK ENTERS MALAYSIA WITH NEW 150+MW HYPERSCALE DATA CENTRE IN JOHOR BAHRU. Available online: https://airtrunk.com/airtrunk-enters-malaysia-with-new-150mw-hyperscale-data-centre-in-johor-bahru/ (accessed on 18 Dec 2025).
- AirTrunk. SUSTAINABILITY REPORT FY25. Available online: https://airtrunk.com/wp-content/uploads/2025/10/AT_Sustainability-Report-2025-Final.pdf (accessed on 7 June 2026).
- EcoDataCenter. "EcoDataCenter 2023 Sustainability Report ". Available online: https://ecodatacenter.tech/hubfs/EcoDataCenter_sustainability_report_2023_20240506_LQ.pdf (accessed on 7 June 2026).
- Equinx. Equinix 2024 Sustainability Data Summary." 2025 Equinix Inc. Available online: https://www.equinix.com/content/dam/eqxcorp/en_us/documents/resources/data-sheets/ds_sustainability_data_en.pdf (accessed on 26 Nov 2025).
- Equinx. Cooling. Available online: https://docs.equinix.com/colocation/about/colo-cooling-intro/ (accessed on 26 Nov 2025).
- Better Buildings Better Plants. "IRON MOUNTAIN DATA CENTERS: GEOTHERMAL COOLING SYSTEM." Better Buildings, U.S. Department of Energy. Available online: https://betterbuildingssolutioncenter.energy.gov/showcase-projects/iron-mountain-data-centers-geothermal-cooling-system (accessed on 18 Dec 2025).
- Iron Mountain Data Centers. Iron Mountain Data Centers Sustainability Performance Overview 2024. Available online: https://s204.q4cdn.com/148941814/files/doc_downloads/2024-IMDC-Sustainability-Performance-Overview-FINAL.pdf (accessed on 7 June 2026).
- switch. AI FACTORIES. Available online: https://www.switch.com/ai-factories/ (accessed on 18 Dec 2025).
- switch. ESG 2024 Report. Available online: https://switchdotcom.s3-sites.data.switch.com/media/reports/esg/Switch-ESG-Report-2024.pdf (accessed on 7 June 2026).
- Sharma, P.; Pegus, P.; Irwin, D.; Shenoy, P.; Goodhue, J.; Culbert, J. Design and Operational Analysis of a Green Data Center," IEEE Computer Society. 2017. Available online: https://homes.luddy.indiana.edu/prateeks/papers/mghpcc-mag.pdf (accessed on 14 Nov 2025).
- Digital Realty. High-Density Colocation. Available online: https://www.digitalrealty.com/platform-digital/colocation/high-density-colocation (accessed on 14 November 2025).
- Zhang, M. How Data Centers Impact the Environment." Dgtl Infra. Available online: https://dgtlinfra.com/how-data-centers-impact-the-environment/ (accessed on 13 March 2026).
- NEXTDC, "POWER PLAY Inside The Data Centres Fuelling Our Digital Economy.". Available online: https://www.nextdc.com/hubfs/160617_NEXTDC_Innovation_Final.pdf (accessed on 18 Dec 2025).
- NEXTDC. FY25 Environmental, Social and Governance Report. Available online: https://nextdc.com/hubfs/ASX%20Announcements/FY25%20Environmental,%20Social%20and%20Governance%20Report.pdf (accessed on 7 June 2026).
Figure 1.
Simplified thermal and water consumption pathway in the cooling system: HTC was estimated for process (1) and water consumption was estimated for process (3).
Figure 1.
Simplified thermal and water consumption pathway in the cooling system: HTC was estimated for process (1) and water consumption was estimated for process (3).
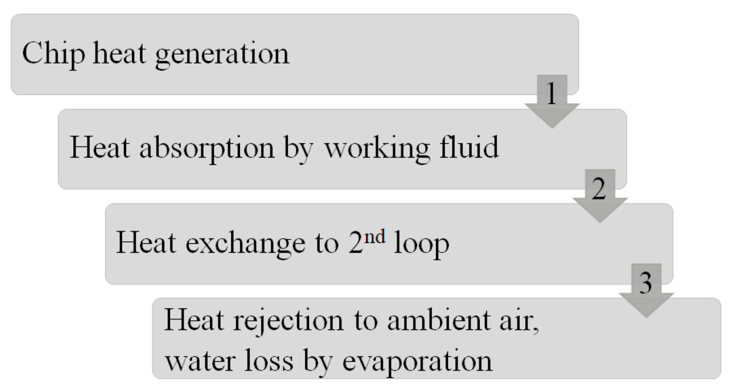
Figure 2.
Schematic diagram of electronic cooling using a heat sink and a working fluid.
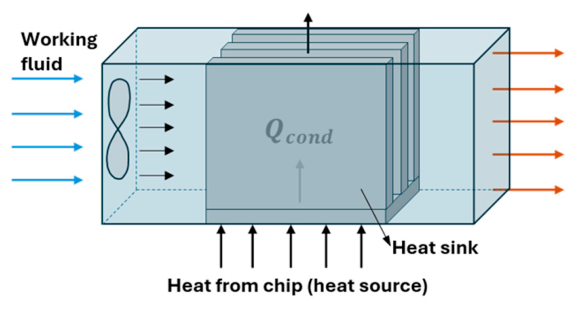
Figure 3.
Schematic diagram of electronic cooling using two-phase immersion approach.
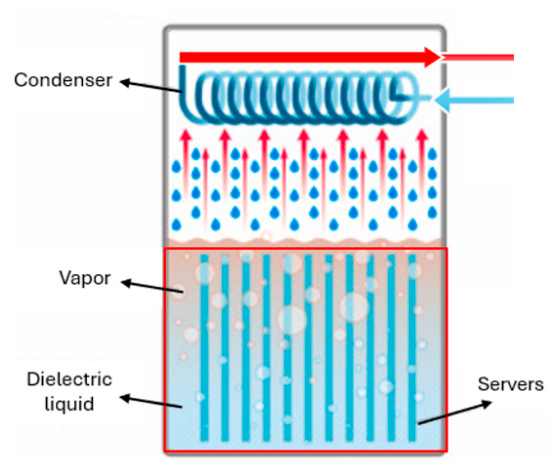
Figure 4.
Schematic diagram for multi-scale thermal management in data centres using convective cooling mechanisms: (a) Facility-level heat rejection pathway from server to evaporative cooling tower; (b) detailed chip-level heat transfer pathway within the server.
Figure 4.
Schematic diagram for multi-scale thermal management in data centres using convective cooling mechanisms: (a) Facility-level heat rejection pathway from server to evaporative cooling tower; (b) detailed chip-level heat transfer pathway within the server.
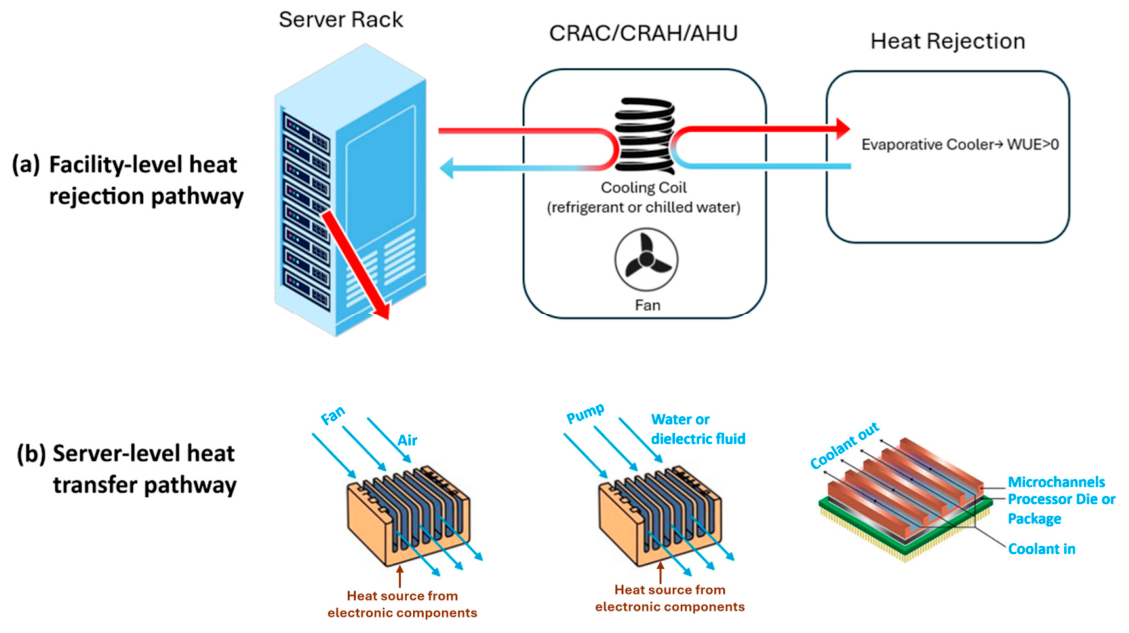
Figure 5.
Schematic diagram for two-phase immersion cooling technology in a data centre.
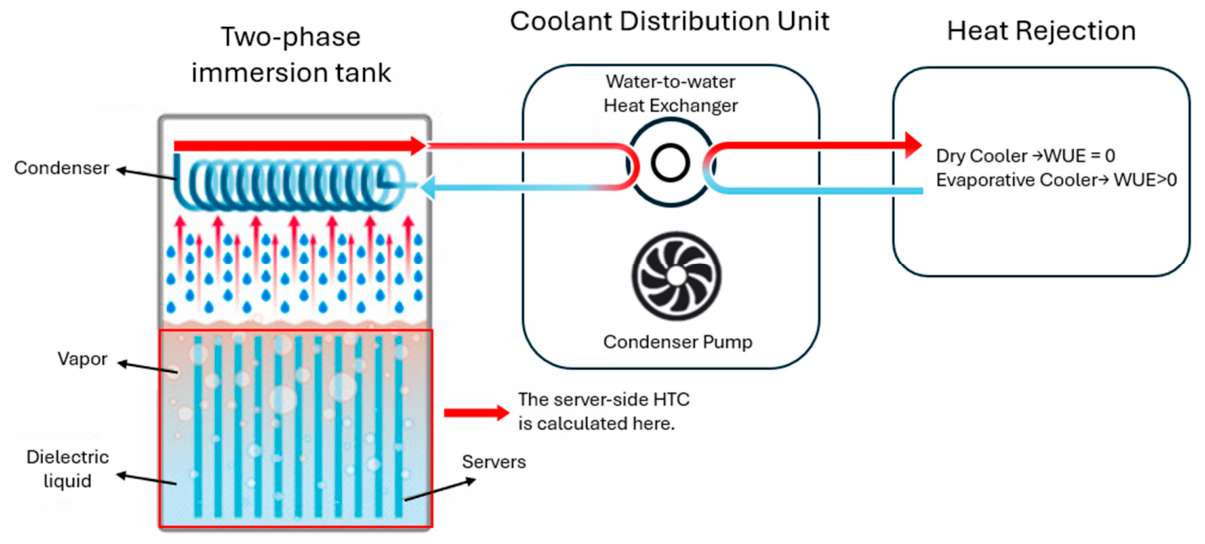
Figure 6.
Data centres with WUE up to 0.4 L/kWh. Data labels show cooling topology. The WUE data sources for the data centres shown on the Y-axis are listed in Table 2, where the “Zero Consumption Group” comprises DCs 1-23.
Figure 6.
Data centres with WUE up to 0.4 L/kWh. Data labels show cooling topology. The WUE data sources for the data centres shown on the Y-axis are listed in Table 2, where the “Zero Consumption Group” comprises DCs 1-23.
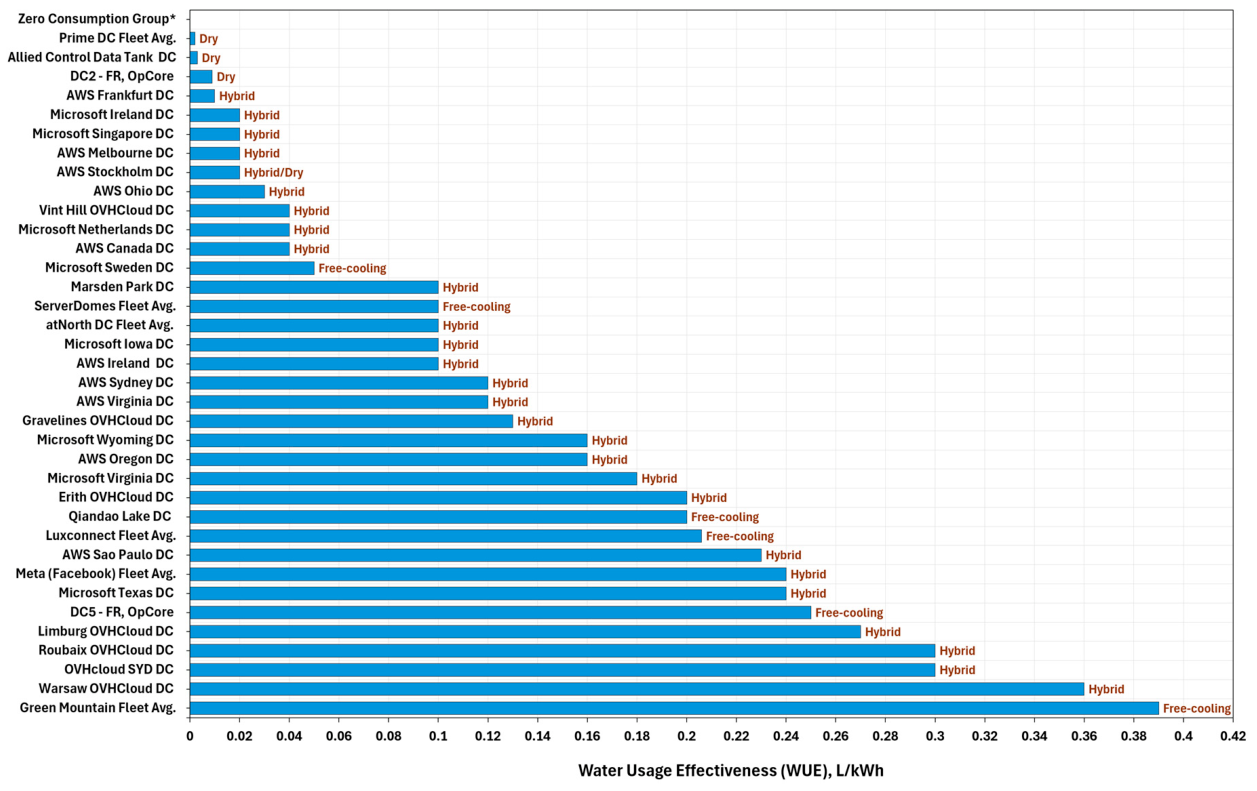
Figure 7.
Data centres with WUE up to 0.4 L/kWh. Data labels show cooling topology. The WUE data sources for the data centres shown on the Y-axis are listed in Table 2.
Figure 7.
Data centres with WUE up to 0.4 L/kWh. Data labels show cooling topology. The WUE data sources for the data centres shown on the Y-axis are listed in Table 2.
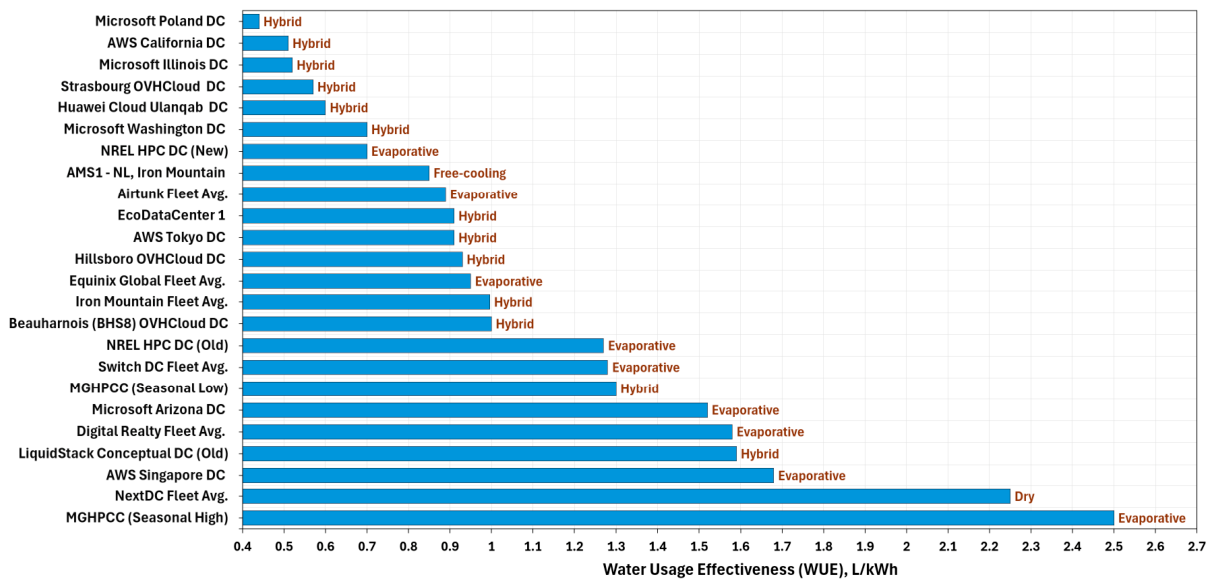
Figure 9.
Comparison of heat transfer coefficient (HTC) ranges for four cooling mechanisms. Bars show predicted HTC ranges, and markers show validation values with corresponding experimental studies from [16,17,18,19,20].
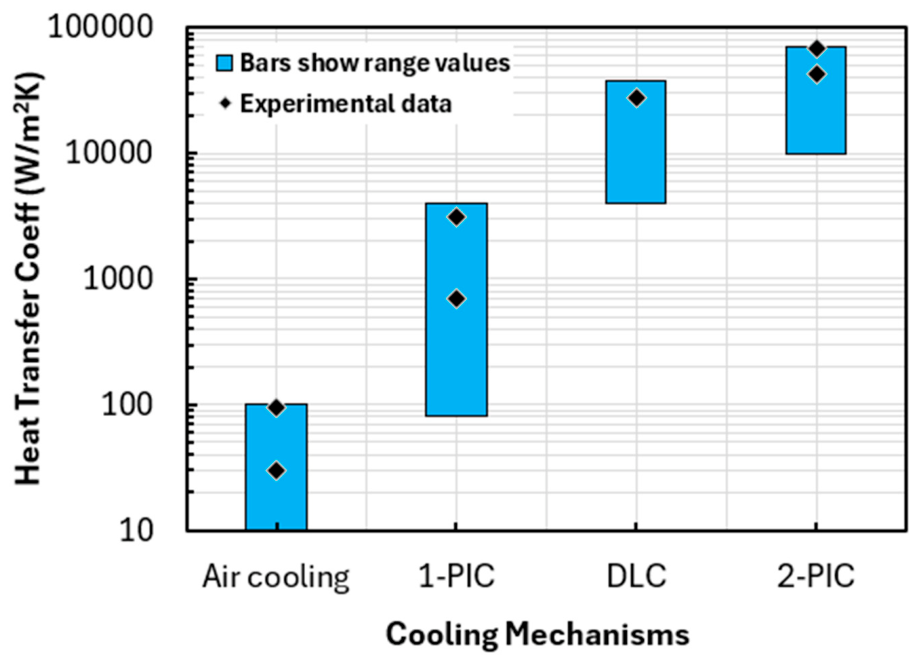
Figure 10.
Heat dissipation from heat sink to working fluid for different excess temperatures.
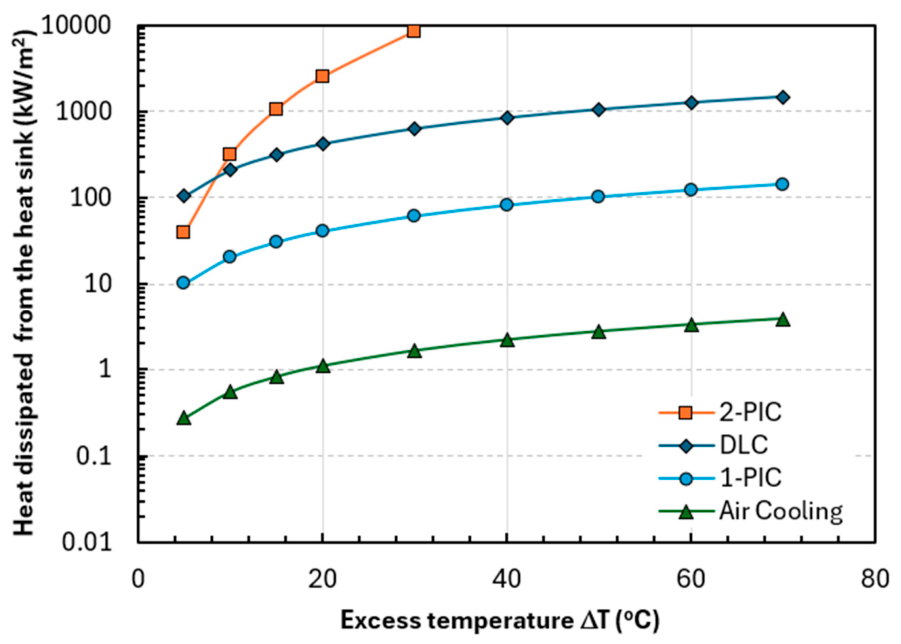
Figure 11.
Normalised WUE per MW of thermal load for different cooling mechanisms and excess temperatures. The values represent an upper-bound indicative WUE, assuming all rejected heat is removed through direct evaporation with no secondary cooling loop.
Figure 11.
Normalised WUE per MW of thermal load for different cooling mechanisms and excess temperatures. The values represent an upper-bound indicative WUE, assuming all rejected heat is removed through direct evaporation with no secondary cooling loop.
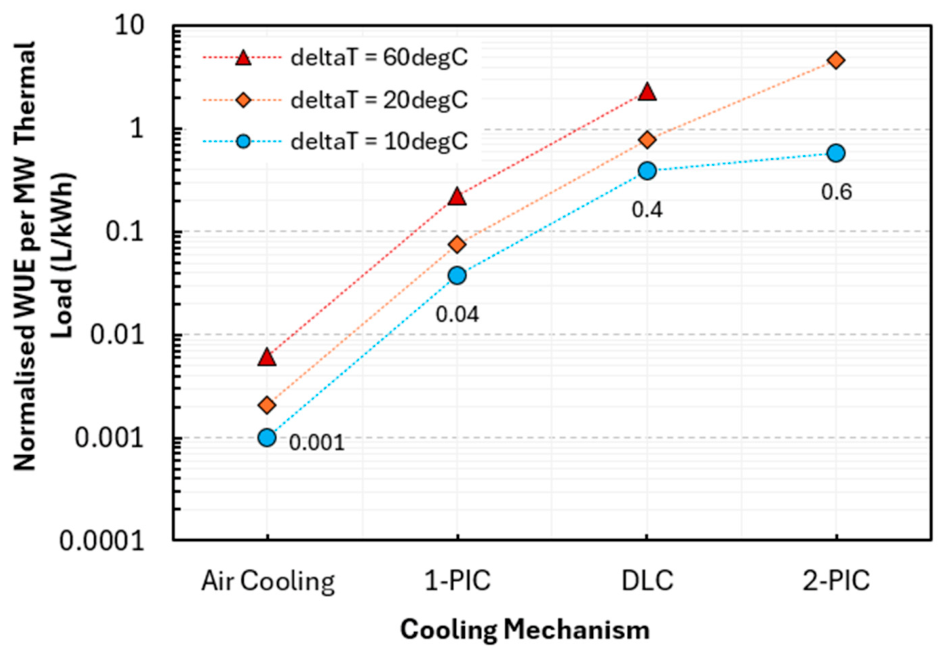

Table 1.
Server-level cooling mechanism and its relevance in the heat rejection topology.
| Category | Cooling mechanism | Governing equations | Validation source | Compatible cooling topologies |
| Convective cooling | Air cooling | Eqs (2) - (4) | Full 3D CFD simulation [16] | Evaporative; Hybrid; Free cooling (climate-dependent) |
| 1-PIC | Eqs (2) - (8) | Forced convection Framework inherited from air-cooling validations; qualitative trend support from [17] and natural convection experimental data [18] | Hybrid; Free cooling (Liquid) Dry |
|
| DLC | Eqs (2) - (4) | Experimental data [19] | Hybrid; Free cooling (liquid); Dry |
|
| Two-phase cooling | 2-PIC | Eq. (9) - (10) | Experimental data [20] | Hybrid; Dry |
Table 2.
Data centre entries included in this study, their reported WUE values, and the corresponding references.
Table 2.
Data centre entries included in this study, their reported WUE values, and the corresponding references.
| # | Data Centre (DC) | WUE | Reference |
| 1 | LiquidStack Conceptual DC (new) | ~0 | [23] |
| 2 | Microsoft Next-DCs | ~0 | [24] |
| 3 | Various QTS DCs | ~0 | [25] |
| 4 | Ixora’s HRM-4 system DCs | ~0 | [26] |
| 5 | Nautilus Data Tech. commercial floating DC | ~0 | [27] |
| 6 | Facebook Luleå DC | ~0 | [28] |
| 7 | Google DC in Hamina, Finland | ~0 | [29] |
| 8 | Various New CyrusOne DCs | ~0 | [30] |
| 9 | Hydro66 DC | ~0 | [31] |
| 10 | LUMI DC | ~0 | [32] |
| 11 | Phoenix (AZ1) DC Campus | ~0 | [33] |
| 12 | Ashburn (VA1) DC Campus | ~0 | [34] |
| 13 | Johannesburg I (JNB1) DC Campus | ~0 | [35] |
| 14 | Cyberjaya (KUL1) DC Campus | ~0 | [36] |
| 15 | Melbourne (MEL1) DC Campus | ~0 | [37] |
| 16 | Novva Utah DC | ~0 | [38] |
| 17 | Lefdal Mine DC | ~0 | [39] |
| 18 | BitFury Mega DC | ~0 | [40] |
| 19 | DC4 - FR, OpCore | ~0 | [41] |
| 20 | DC3 - FR, OpCore | ~0 | [41] |
| 21 | Chindata “X-Cooling” Hyperscale Campus | ~0 | [42] |
| 22 | KDDI small DC (Yokohama) | ~0 | [43] |
| 23 | Microsoft Johor Bahru SEA3 (under construction) | ~0 | [44] |
| 24 | Prime DC Fleet Average | 0.002 | [45] |
| 25 | Allied Control DataTank DC | 0.003 | [46] |
| 26 | DC2 - FR, OpCore | 0.009 | [41] |
| 27 | AWS Frankfurt DC | 0.01 | [47,48,49] |
| 28 | Microsoft Ireland DC | 0.02 | [50,51,52] |
| 29 | Microsoft Singapore DC | 0.02 | [50,51] |
| 30 | AWS Melbourne DC | 0.02 | [47,48,49] |
| 31 | AWS Stockholm DC | 0.02 | [47,48,49] |
| 32 | AWS Ohio DC | 0.03 | [47,48,49] |
| 33 | Vint Hill OVHCloud DC | 0.04 | [53,54] |
| 34 | Microsoft Netherlands DC | 0.04 | [50,51,55] |
| 35 | AWS Canada DC | 0.04 | [47,48,49] |
| 36 | Microsoft Sweden DC | 0.05 | [50,51] |
| 37 | Marsden Park DC | 0.1 | [56] |
| 38 | ServerDomes Fleet Average | 0.1 | [57,58] |
| 39 | atNorth Fleet Average | 0.1 | [59] |
| 40 | Microsoft Iowa DC | 0.1 | [50,51] |
| 41 | AWS Ireland DC | 0.1 | [47,48,49] |
| 42 | AWS Sydney DC | 0.12 | [47,48,49] |
| 43 | AWS Virginia DC | 0.12 | [47,48,49] |
| 44 | Gravelines OVHCloud DC | 0.13 | [53,54] |
| 45 | Microsoft Wyoming DC | 0.16 | [50,51] |
| 46 | AWS Oregon DC | 0.16 | [47,48,49] |
| 47 | Microsoft Virginia DC | 0.18 | [50,51] |
| 48 | Erith OVHCloud DC | 0.2 | [53,54] |
| 49 | Qiandao Lake DC | 0.2 | [60] |
| 50 | Luxconnect Fleet Average | 0.206 | [61,62] |
| 51 | AWS Sao Paulo DC | 0.23 | [47,48,49] |
| 52 | Meta (Facebook) Fleet Average | 0.24 | [63] |
| 53 | Microsoft Texas DC | 0.24 | [50,51,64] |
| 54 | DC5 - FR, OpCore | 0.25 | [41] |
| 55 | Limburg OVHCloud DC | 0.27 | [53,54] |
| 56 | Roubaix OVHCloud DC | 0.3 | [53,54] |
| 57 | OVHcloud SYD DC | 0.3 | [65] |
| 58 | Warsaw OVHCloud DC | 0.36 | [53,54] |
| 59 | Green Mountain Fleet Average | 0.39 | [66] |
| 60 | Microsoft Poland DC | 0.44 | [50,51] |
| 61 | AWS California DC | 0.51 | [47,48,49] |
| 62 | Microsoft Illinois DC | 0.52 | [50,51] |
| 63 | Strasbourg OVHCloud DC | 0.57 | [53,54] |
| 64 | Huawei Cloud Ulanqab DC | 0.6 | [67] |
| 65 | Microsoft Washington DC | 0.7 | [50,51] |
| 66 | NREL HPC DC (new) | 0.7 | [9] |
| 67 | AMS1 - NL, Iron Mountain | 0.85 | [41] |
| 68 | Airtunk Fleet Average | 0.89 | [68,69] |
| 69 | EcoDataCenter 1 | 0.91 | [70] |
| 70 | AWS Tokyo DC | 0.91 | [47,48,49] |
| 71 | Hillsboro OVHCloud DC | 0.93 | [53,54] |
| 72 | Equinix Global Fleet Average | 0.95 | [71,72] |
| 73 | Iron Mountain Fleet Average | 0.996 | [73,74] |
| 74 | Beauharnois (BHS8 only) OVHCloud DC | 1 | [53,54] |
| 75 | NREL HPC DC (old) | 1.27 | [9] |
| 76 | Switch DC Fleet Average | 1.28 | [75,76] |
| 77 | MGHPCC DC (Seasonal Low) | 1.3 | [77] |
| 78 | Microsoft Arizona DC | 1.52 | [50,51] |
| 79 | Digital Realty Fleet Average | 1.58 | [78,79] |
| 80 | LiquidStack Conceptual DC (old) | 1.59 | [23] |
| 81 | AWS Asia-Pacific (Singapore) DC | 1.68 | [47,48,49] |
| 82 | NextDC Fleet Average | 2.25 | [80,81] |
| 83 | MGHPCC DC (Seasonal High) | 2.5 | [77] |
Disclaimer/Publisher’s Note: The statements, opinions and data contained in all publications are solely those of the individual author(s) and contributor(s) and not of MDPI and/or the editor(s). MDPI and/or the editor(s) disclaim responsibility for any injury to people or property resulting from any ideas, methods, instructions or products referred to in the content. |
© 2026 by the authors. Licensee MDPI, Basel, Switzerland. This article is an open access article distributed under the terms and conditions of the Creative Commons Attribution (CC BY) license (http://creativecommons.org/licenses/by/4.0/).
Copyright: This open access article is published under a Creative Commons CC BY 4.0 license, which permit the free download, distribution, and reuse, provided that the author and preprint are cited in any reuse.


