

Submitted:
18 July 2026
Posted:
21 July 2026
You are already at the latest version
Abstract
Dendrobium officinale flowers are valuable herbal materials with reported antioxidant and anti-inflammatory activities, but the microbial succession and metabolite transformation patterns during liquid fermentation remain insufficiently characterized. In this study, a mixed-culture fermentation system was established for D. officinale flowers, and the fermentation conditions were first optimized using DPPH free radical scavenging activity as the response index. Response surface methodology predicted a high-response condition of 32.8 °C, initial pH 3.93, and 6.16% sucrose, with a predicted DPPH scavenging rate of 0.858. Based on this condition, a 60-day dynamic fermentation experiment was conducted, and samples collected from JS10 to JS60 were analyzed by 16S rRNA sequencing, ITS sequencing, and untargeted LC-MS/MS metabolomics. Microbial community analysis showed a clear succession pattern during fermentation. The bacterial community was mainly composed of Lactiplantibacillus, Limosilactobacillus, and Lactobacillus, while the fungal community was dominated by Saccharomyces, with Papiliotrema showing a stage-dependent fluctuation and peaking at JS40. Metabolomics analysis identified 150 structurally annotated differential metabolites, and multivariate analysis indicated time-dependent changes in the metabolite profile. KEGG enrichment analysis highlighted pathways related to flavonoid biosynthesis, phenylpropanoid biosynthesis, flavone and flavonol biosynthesis, nucleotide metabolism, and ABC transporters. During prolonged fermentation, DPPH scavenging activity gradually decreased, whereas total amino acid content increased and total polysaccharides fluctuated. Several glycosides, nucleosides, phenylpropanoid/flavonoid-related metabolites, amino acids, and peptide-related compounds showed marked temporal changes. Spearman correlation analysis further suggested potential associations between dominant microbial taxa and key metabolite groups. Overall, this study shows that liquid fermentation of D. officinale flowers involves coordinated microbial succession and metabolite remodeling. These findings provide a multi-omics basis for understanding fermentation-associated biotransformation in Dendrobium flower materials.
Keywords:
Dendrobium officinale flowers
; liquid fermentation
; response surface methodology
; microbiome
; metabolomics
; biotransformation
1. Introduction
Dendrobium officinale Kimura et Migo is a species of the Orchidaceae family and is one of the traditional medicinal and edible resources in China. Modern studies have shown that D. officinale contains polysaccharides, flavonoids, phenolic acids, alkaloids, amino acids, and other secondary metabolites, and exhibits multiple biological activities, including antioxidant, immunomodulatory, gastrointestinal-protective, antidiabetic, and anti-aging effects [1,2]. Among these components, polysaccharides are regarded as one of the most representative active constituents of D. officinale, whereas flavonoids and phenylpropanoid compounds are also closely associated with its antioxidant capacity and quality differences [2,3]. In recent years, transcriptomic and metabolomic studies have further shown that D. officinale flowers display marked metabolic differences at different developmental stages, with differential metabolites mainly involved in phenylpropanoid biosynthesis, flavonoid metabolism, lipid metabolism, and plant hormone signaling pathways [4]. These findings indicate that D. officinale flowers are not only an important part of the comprehensive utilization of Dendrobium resources, but also have potential as functional food ingredients.
Compared with Dendrobium stems, the functional value of D. officinale flowers has received attention relatively late; nevertheless, accumulating evidence indicates that they are rich in amino acids, polyphenols, flavonoids, phenolic acids, and other bioactive substances [5,6]. Sensomic and metabolomic studies of Dendrobium flower tea have further shown that the aroma, taste, metabolic profile, and antioxidant activity of Dendrobium flowers are influenced by processing methods, and that their key aroma compounds have value for food processing and industrial application [7,8]. Aqueous extracts of D. officinale flowers have been reported to exert anti-cyclooxygenase, anti-glycation, antioxidant, and anti-skin-aging effects [5]. Bioactive fractions from D. officinale flowers can also alleviate H2O2-induced oxidative damage and inflammatory responses by regulating PI3K/Akt/Nrf2-related signaling pathways [6]. In addition, anthocyanins from D. officinale flowers can extend the lifespan of Caenorhabditis elegans, and acylated anthocyanins from D. officinale also exhibit antioxidant and hypoglycemic-related activities [9,10]. Animal experiments have shown that D. officinale flower extracts can alleviate alcohol-induced liver injury through anti-steatosis, antioxidant, and anti-inflammatory pathways [11], and may improve abnormalities associated with alcoholic fatty liver disease by regulating the gut microbiota and short-chain fatty acids [12]. Therefore, the functional basis of D. officinale flowers should not be interpreted solely in terms of single constituents or single in vitro antioxidant indices, but should be analyzed in relation to their complex metabolic composition and potential microecological regulatory effects.
Fermentation is a bioprocessing strategy widely used to improve the quality and functional properties of plant-based foods. During fermentation, microorganisms can alter the chemical composition of raw materials through acid production, enzyme secretion, sugar metabolism, proteolysis, and phenolic transformation, thereby reshaping the phenolic profiles and bioactivities of plant-based foods [13,14]. Metabolomics has been widely applied to evaluate quality attributes, functional components, and changes in metabolic networks in fermented foods [15]. For Dendrobium materials, metabolomic studies have shown that flavonoids, phenolic acids, alkaloids, and other secondary metabolites are closely associated with antioxidant activity [16]. Untargeted metabolomics has been used to compare metabolic differences between jiaosu fermented from Dendrobium flowers and stems, revealing clear differences in multiple potential antioxidant and anti-inflammatory components [17]. Other studies have shown that synergistic fermentation by lactic acid bacteria, yeasts, and enzymes can alter the metabolite composition and antioxidant activity of D. officinale fermentation broth [18]; fermentation of D. officinale juice with Saccharomycopsis fibuligera and Lactobacillus paracasei as starter cultures also significantly changes the composition of organic acids, amino acids, and flavonoids [19]. In Dendrobium rice wine, co-fermentation with Saccharomyces cerevisiae and non-Saccharomyces yeasts can also increase the content of active metabolites and induce significant changes in phenolics, flavonoids, terpenoids, alkaloids, and phenylpropanoids [20]. Addition of D. officinale can further affect yeast metabolism, antioxidant activity, and flavor formation during beer yeast fermentation [21]. These studies provide a basis for developing fermented Dendrobium products, but most have focused on endpoint metabolic differences or product-quality comparisons, whereas continuous microbial succession and metabolite remodeling during fermentation remain insufficiently characterized.
Mixed-culture fermentation systems usually resemble real food fermentation environments more closely than single-strain systems. Microorganisms can influence community structure and final product characteristics through nutritional competition, mutualistic interactions, acid-mediated inhibition, metabolite exchange, and signal regulation [22]. In liquid-phase food fermentation, lactic acid bacteria often form microbial consortia with yeasts or other microorganisms, and these interactions affect substrate utilization, metabolite release, and fermentation stability [23]. In plant matrices, lactic acid bacteria can adapt to plant environments and transform multiple classes of plant secondary metabolites [14]. Lactic acid bacteria represented by Lactiplantibacillus plantarum possess esterase, decarboxylase, reductase, and glycoside-related activities, and can participate in the biotransformation of phenolic acids, flavonoid glycosides, and aromatic metabolites [24,25]. Meanwhile, proteolytic systems in fermenting microorganisms can further convert plant proteins or polypeptides into short peptides and amino acids, and bioactive peptides produced during fermentation are often associated with antioxidant, anti-inflammatory, antihypertensive, and immunomodulatory functions [26]. Thus, liquid fermentation of D. officinale flowers may involve both flavonoid/phenylpropanoid metabolic remodeling and the release of nitrogen-containing metabolites, a process that requires time-series multi-omics analysis.
Against this background, this study used D. officinale flowers as the fermentation substrate and established a liquid mixed-culture fermentation system involving lactic acid bacteria and yeast. First, DPPH radical scavenging activity was used as the response index, and fermentation temperature, initial pH, and sucrose addition were optimized through single-factor experiments and response surface methodology. Subsequently, a 60-day dynamic fermentation experiment was conducted under optimized conditions, and samples were collected at different fermentation stages. By integrating 16S rRNA sequencing, ITS sequencing, and untargeted LC-MS/MS metabolomics, this study systematically analyzed temporal changes in bacterial communities, fungal communities, and metabolite profiles during D. officinale flower fermentation. KEGG pathway enrichment and Spearman correlation analyses were further combined to explore potential associations between dominant microbial taxa and key metabolites. This study aimed to clarify the microbial-community-driven biotransformation patterns during liquid fermentation of D. officinale flowers and to provide a multi-omics basis for process optimization, quality evaluation, and functional development of fermented D. officinale flower products.
2. Materials and Methods
2.1. Materials, Strains, and Media
2.1.1. Raw Material Pretreatment
The D. officinale flowers used in this study were collected from Huoshan, Anhui Province, China. The raw materials were washed with deionized water and then dried under ventilation at 45 °C to constant weight, followed by pulverization using a high-speed grinder. The resulting D. officinale flower powder was not sieved and was sealed and stored at 4 °C in the dark until use.
2.1.2. Strain Resources
A mixed-culture fermentation system was constructed using lactic acid bacteria and yeast strains preserved in the laboratory, including Lactobacillus bulgaricus, Streptococcus thermophilus, Bifidobacterium, and Saccharomyces cerevisiae. Before the experiment, each strain was separately activated and seed-cultured; yeast was inoculated into YPD liquid medium, whereas lactic acid bacteria were inoculated into MRS liquid medium. After 20 h of cultivation, the seed cultures of the four strains were mixed at a volume ratio of 1:1:1:1 to prepare the mixed starter culture for subsequent liquid fermentation of D. officinale flowers.
2.2. Experimental Methods and Evaluation Indicators
2.2.1. Fermentation Procedure
The total volume of the D. officinale flower fermentation system was 100 mL, with D. officinale flower powder added at 5% (w/v). The flower powder was not sterilized by autoclaving; except for the flower powder, fermentation bottles, sterile water, and all utensils in contact with the fermentation broth were sterilized at 121 °C for 15 min or prepared as sterile consumables. After preparation of the fermentation system, the mixed starter culture was inoculated at 1% (v/v), and the initial pH was adjusted using citric acid and trisodium citrate.
Unless otherwise stated, fermentation was performed in screw-cap sealed fermentation bottles at the designated temperature. For the single-factor experiments and response surface optimization experiments, the fermentation period was 7 d. During the first 3 d, the fermentation broth was stirred three times daily for 1 min each time, and thereafter the bottles were vented once daily. At the end of fermentation, samples were centrifuged at 8000 r/min for 20 min at room temperature, and the supernatant was collected and stored at °C for subsequent measurements.
2.2.2. Determination of Antioxidant Activity and Physicochemical Indices
The DPPH radical scavenging rate, total amino acid content, and total polysaccharide content of the fermentation supernatant were measured using commercial assay kits according to the manufacturers’ instructions. Absorbance for the DPPH radical scavenging rate was measured at 517 nm, total amino acid content at 570 nm, and total polysaccharide content at 490 nm.
2.2.3. Single-Factor Experiments
Single-factor experiments were designed to investigate the effects of carbon source type, carbon source addition, fermentation temperature, and initial pH on the DPPH free radical scavenging activity of the fermented product. The basic fermentation conditions were set as follows: carbon source addition of 6%, temperature of 33 °C, and initial pH of 4.4. When one factor was varied, the remaining factors were kept at the basic condition levels [43,44]. The specific experimental design was as follows:
For carbon source type, five carbon sources were tested: sucrose, glucose, fructose, maltose, and lactose. After the optimal carbon source was determined, its addition level was further optimized at five concentrations: 2%, 4%, 6%, 8%, and 10%. Fermentation temperature was tested at 27, 30, 33, 36, and 39 °C. Initial pH was tested at 3.4, 3.9, 4.4, 4.9, and 5.4.
2.2.4. Response Surface Methodology (RSM) Optimization
Based on the results of the single-factor experiments, a three-factor, three-level Box–Behnken design (BBD) was used to optimize the fermentation conditions, with DPPH radical scavenging rate as the response variable. The three independent variables were fermentation temperature (A, 30–36 °C), initial pH (B, 3.4–5.4), and carbon source addition (C, 4%–8%). The BBD consisted of 17 experimental runs, including five center-point replicates [43,44]. The experimental design and results are shown in Table 1. The data were fitted by a quadratic regression model, and the adequacy of the model was evaluated by analysis of variance (ANOVA) (Table 2) [44].
2.2.5. Dynamic Fermentation Experiment and Sampling
Based on the optimized conditions, a 60-day dynamic fermentation experiment was conducted at 33 °C with initial pH 3.9 and 6.2% sucrose addition. Fermentation bottles were prepared as described above, and samples were collected at six time points (JS10, JS20, JS30, JS40, JS50, and JS60, representing 10, 20, 30, 40, 50, and 60 d of fermentation, respectively). At each time point, the fermentation broth was thoroughly mixed, and samples were taken for microbial community analysis (stored at °C) and metabolomics analysis. The sampling logic ensured that each time point captured a sufficient period for microbial community changes and metabolite accumulation.
2.3. Microbial Community Analysis
2.3.1. DNA Extraction, PCR Amplification, and Sequencing
Total genomic DNA was extracted from fermented samples using the E.Z.N.A. Soil DNA Kit (Omega Bio-Tek, Norcross, GA, USA) according to the manufacturer’s instructions. The V3–V4 hypervariable region of the bacterial 16S rRNA gene was amplified using primers 338F (5′-ACTCCTACGGGAGGCAGCAG-3′) and 806R (5′-GGACTACHVGGGTWTCTAAT-3′). The ITS1 region of the fungal rRNA gene was amplified using primers ITS1F (5′-CTTGGTCATTTAGAGGAAGTAA-3′) and ITS2R (5′-GCTGCGTTCTTCATCGATGC-3′). PCR products were purified, quantified, and sequenced on the Illumina NovaSeq 6000 platform (Majorbio Bio-Pharm Technology Co., Ltd., Shanghai, China).
2.3.2. Bioinformatics Processing
Raw sequencing reads were demultiplexed, quality-filtered using fastp [27], and merged using FLASH [28]. Operational taxonomic units (OTUs) were clustered at 97% sequence identity using UPARSE [29]. Taxonomic annotation was performed against the Silva 16S rRNA database (v138) and the UNITE ITS database (v8.0) using the RDP classifier (confidence threshold 0.7) [30,31].
2.3.3. Functional Prediction
Phylogenetic Investigation of Communities by Reconstruction of Unobserved States (PICRUSt2) was used to predict the functional potential of the bacterial communities based on 16S rRNA sequencing data.
2.4. Untargeted Metabolomics Analysis
2.4.1. Sample Preparation and LC-MS/MS Analysis
Fermentation supernatant samples (200 L) were mixed with 800 L of methanol/acetonitrile (1:1, v/v), vortexed, and centrifuged at 14,000 × g for 15 min at 4 °C. The supernatant was dried under nitrogen and reconstituted in 100 L of acetonitrile/water (1:1, v/v) for LC-MS/MS analysis [17,32]. Quality control (QC) samples were prepared by pooling equal aliquots of all samples.
LC-MS/MS analysis was performed on a Thermo Scientific Vanquish UHPLC system coupled with a Q Exactive HF-X mass spectrometer. Separation was achieved on a Waters ACQUITY UPLC HSS T3 column (100 mm × 2.1 mm, 1.8 m) at 40 °C with a flow rate of 0.3 mL/min. The mobile phase consisted of (A) 0.1% formic acid in water and (B) 0.1% formic acid in acetonitrile. The gradient program was as follows: 0–2 min, 5% B; 2–4 min, 5%–30% B; 4–8 min, 30%–50% B; 8–10 min, 50%–80% B; 10–12 min, 80% B; 12–12.5 min, 80%–5% B; 12.5–15 min, 5% B. The injection volume was 2 L.
Mass spectrometry was operated in both positive and negative ion modes with a scan range of 70–1050. The spray voltage was set to 3.5 kV (positive) and 2.8 kV (negative), capillary temperature 320 °C, and auxiliary gas temperature 350 °C.
2.4.2. Data Processing and Statistical Analysis
Raw MS data were processed using Progenesis QI software (Waters Corporation) for peak detection, alignment, and normalization. Metabolite identification was performed by matching MS/MS spectra against the HMDB, METLIN, and an in-house database. For differential metabolite screening, principal component analysis (PCA) and partial least squares discriminant analysis (PLS-DA) were first used to evaluate overall metabolic differences. Based on the orthogonal PLS-DA (OPLS-DA) model, differential metabolites were screened with the criteria of , VIP , and . KEGG pathway enrichment analysis was performed using the KEGG database.
Spearman correlation analysis was used to evaluate associations between microbial genera and metabolite levels. Procrustes analysis was used to assess the concordance between microbial community structure and metabolite profiles. All statistical analyses were performed using R software (v4.2.0).
3. Results
3.1. Optimization of Fermentation Conditions
3.1.1. Single-Factor Experimental Results
The effects of carbon source type, carbon source addition, fermentation temperature, and initial pH on the DPPH radical scavenging activity of fermented D. officinale flowers are shown in Figure 1. Among the five carbon sources tested (Figure 1A), sucrose resulted in the highest DPPH scavenging activity, and was therefore selected as the optimal carbon source. The effect of sucrose addition (Figure 1B) showed a clear peak at 6%, with further increases in sucrose concentration not leading to higher DPPH scavenging activity. The effect of fermentation temperature (Figure 1C) showed that DPPH scavenging activity peaked at 33 °C and decreased at higher temperatures. The effect of initial pH (Figure 1D) showed that weakly acidic conditions (pH 4.4) yielded the highest DPPH radical scavenging activity. These results provided the basis for the subsequent response surface optimization.
3.1.2. Response Surface Optimization Results
Based on the single-factor results, a three-factor, three-level Box–Behnken design was implemented with fermentation temperature (A), initial pH (B), and sucrose addition (C) as independent variables. The experimental design, measured DPPH scavenging rates, and predicted values are presented in Table 1. Regression analysis of the experimental data yielded the following quadratic polynomial equation:
where Y is the DPPH radical scavenging rate, and A, B, and C are the coded values of temperature, pH, and sucrose addition, respectively.
The ANOVA results (Table 2) show that the model was highly significant (), with a non-significant lack of fit (), indicating good model fit. The coefficient of determination () and the adjusted () indicated that the model explained 96.60% of the variability in the response. The adequate precision value (15.30) was well above 4, confirming adequate signal-to-noise ratio. Among the linear terms, initial pH (B) was the most significant factor (), whereas temperature (A) and carbon source addition (C) were not significant as linear terms. However, the interaction terms AC () and BC () were both significant, indicating interactive effects between these variables. The quadratic terms () and () were also highly significant, suggesting curvilinear relationships.
The model diagnostic plots (Figure 2A) showed that the predicted values were in good agreement with the actual values. The response surface and contour plots (Figure 2B–G) visualized the pairwise interaction effects among the three variables. The plots revealed a clear high-response region concentrated around intermediate temperature (approximately 33 °C), mildly acidic pH (approximately 3.9–4.4), and intermediate sucrose addition (approximately 6%).
Taken together, the three sets of response surface plots showed that the high-value region of DPPH radical scavenging activity was mainly concentrated around intermediate temperature, mildly acidic pH, and intermediate carbon source addition. Excessively high or low factor levels were unfavorable for further improvement of the response value. Initial pH was the main factor affecting the response, carbon source addition showed a clear quadratic effect and a strong interaction with pH, and although the linear term of fermentation temperature was not significant, its quadratic term and interaction with carbon source addition were significant, indicating that temperature still had process-regulatory significance.
3.1.3. Prediction Results of the Response Surface Model
According to the numerical optimization results of the quadratic regression model, the favorable fermentation conditions predicted within the response surface design range were as follows: fermentation temperature of 32.8 °C, initial pH of 3.93, and sucrose addition of 6.16%, corresponding to a predicted DPPH radical scavenging rate of 85.8%. This predicted optimum was located near the center region of the Box–Behnken design and was consistent with the high DPPH scavenging trend observed under 6% sucrose, 33 °C, and weakly acidic pH conditions in the single-factor experiments, indicating good process rationality of the model prediction.
It should be noted that the predicted value from the response surface model represents the fitted average response trend rather than a single experimental measurement. Therefore, although the highest measured value among the center-point replicates was 86.20%, this value was obtained from a single replicate. The model-predicted optimum of 85.8% was consistent with the overall high-response region of the center-point replicates, indicating that the favorable conditions for the fermentation system were concentrated around intermediate temperature, weakly acidic pH, and approximately 6% sucrose addition. Considering the model prediction and practical feasibility, the subsequent 60-day dynamic fermentation experiment used 33 °C, initial pH 3.9, and 6.2% sucrose as the actual operating conditions.
3.2. Microbial Analysis
Based on 16S rRNA and ITS amplicon sequencing results, this section compares the temporal succession characteristics of bacterial and fungal communities from two perspectives: PCoA analysis and genus-level relative abundance. The sampling logic and time points for fermented samples followed those described in Section 2.5.1.
3.2.1. Bacterial Community Succession Analysis
PCoA analysis (Figure 3A) showed that samples from different fermentation times were largely separated from one another, indicating that bacterial community composition changed markedly among samples as fermentation progressed.
The bacterial community composition is shown in Figure 3C. Figure 3C indicates that Dendrobium fermentation involved a clear bacterial succession process, with Lactiplantibacillus, Limosilactobacillus, and Lactobacillus as the dominant taxa. Limosilactobacillus, Lactiplantibacillus, Lactobacillus, Pediococcus, Fusobacterium, and Marinobacterium were the main bacterial genera during fermentation.
In the early fermentation stage (JS10), Lactiplantibacillus and Limosilactobacillus were dominant, with relative abundances of 56.65% and 35.95%, respectively. Throughout fermentation, Limosilactobacillus showed only minor fluctuations and remained relatively stable. The relative abundance of Lactiplantibacillus showed a decreasing trend, with a slight rebound at JS60.
In the middle fermentation stage (JS30), the relative abundance of Pediococcus reached its peak (5.91%) and then declined rapidly at subsequent time points.
In the late fermentation stage (JS50), Lactobacillus became one of the dominant genera, with a relative abundance of 36.72%. Lactobacillus proliferated continuously from JS10 to JS50, with its relative abundance peaking at JS50 and decreasing slightly at JS60 (27.10% at JS60). The increase in Lactobacillus and the decrease in Lactiplantibacillus showed temporal consistency during fermentation: Lactobacillus abundance gradually increased from JS10 to JS50, whereas Lactiplantibacillus decreased during the same interval.
3.2.2. Fungal Community Succession Analysis
PCoA analysis (Figure 3B) showed separation among samples from different fermentation stages. As fermentation progressed, fungal community composition changed continuously along the PC1 axis.
The fungal community composition is shown in Figure 3D. Saccharomyces was the genus with the highest relative abundance during Dendrobium fermentation. Its relative abundances at different stages were 96.83% at JS10, 95.32% at JS30, and 89.63% at JS50. Its abundance decreased slightly at JS40 and then increased rapidly at JS50.
In addition, the relative abundance of Papiliotrema gradually increased from 0.48% at JS10 to 16.65% at JS40, where it reached its peak. It then decreased slightly during JS50–JS60 (6.11% at JS60).
Aspergillus showed relatively low abundance and was mainly observed at JS10 (2.22%), JS20 (2.92%), and JS60 (0.76%), with a peak at JS20.
3.3. Metabolite Analysis of Fermented Dendrobium Officinale Flowers
Samples were systematically collected at preset time points during fermentation. This study included 40 samples, including QC samples, for LC-MS/MS analysis. LC-MS/MS detected 9436 and 6356 metabolites in positive- and negative-ion modes, respectively. To evaluate the overall metabolic process during fermentation, PCA and PLS-DA were used to visualize changes in the clustering pattern of JS10–JS60. As shown in Figure 4A, the PCA model showed a clear distribution trajectory for samples from different fermentation times in principal component space; adjacent time points clustered together, whereas distant time points showed clear separation. Samples showed a continuous progression along the first principal component axis (Figure 4), which was highly consistent with fermentation time, indicating that the systematic evolution of the metabolic profile was strongly time-dependent. The between-group separation trend was clearer in the PLS-DA model (Figure 4B). In the combined positive- and negative-ion table, the model , , and values were 0.806, 0.993, and 0.954, respectively, and the model passed 200 permutation tests (), indicating good explanatory and predictive ability. ANOSIM analysis (, ) also confirmed extremely significant metabolic differences among groups.
This study combined univariate and multivariate statistical analyses to screen differential metabolites. PCA and PLS-DA were first used to determine overall between-group differences. Based on the OPLS-DA model, differential metabolites were screened by combining univariate analysis with the criteria , VIP , and . A total of 549 ion peaks were screened in positive-ion mode and 302 ion peaks in negative-ion mode, yielding 851 ion peaks in total.
After comparison with HMDB, METLIN, and the in-house database, 150 metabolites with clear structural annotations were identified (Table A1). Hierarchical clustering analysis was performed on these differential metabolites, and the results are shown in Figure 5. The horizontal axis represents fermentation time-point samples, the vertical axis represents differential metabolites, and the color gradient from blue to red indicates increasing relative metabolite abundance. The results showed that metabolite expression changed significantly as fermentation progressed, displaying a gradual time-dependent pattern. After clustering of samples (Figure 5B), samples from different periods formed distinct clusters, further indicating stage-specific metabolic remodeling during fermentation.
To further validate and interpret the remodeling process revealed by metabolomic analysis, KEGG pathway enrichment analysis was performed (Figure 5C). KEGG enrichment analysis showed significant enrichment of phenylpropanoid-flavonoid metabolism-related pathways, including Flavonoid biosynthesis, Phenylpropanoid biosynthesis, and Flavone and flavonol biosynthesis (Figure 5). In addition, Nucleotide metabolism and ABC transporters were also significantly enriched ().
Based on the differential metabolite clustering heatmap and KEGG enrichment results, most key intermediates and flavonoid glycosides in the phenylpropanoid-flavonoid biosynthetic network showed an overall decrease in relative abundance with increasing fermentation time. For example, Figure 5A showed that the relative abundance of 4-Hydroxyphenylpyruvic Acid, a key precursor in the tyrosine metabolism pathway, generally decreased. In addition, 5-Caffeoylshikimic Acid, an intermediate in phenylpropanoid biosynthesis, and 6″-Malonylgenistin in isoflavonoid biosynthesis continuously decreased throughout fermentation. Alongside these decreases, no clear increase was observed in the relative abundance of highly active aglycones such as Irigenin.
Some phenylpropanoid-flavonoid metabolites showed stage-specific increases in relative abundance. In the comparison between JS60 and JS50, the phenylpropanoid-related compound Salidroside showed a slight rebound, whereas Kaempferol-3-O-Rhamnoside-7-O-Rhamnoside was generally upregulated throughout fermentation.
Further observation of differential metabolites from a temporal perspective revealed a group of metabolites with significantly high abundance at JS10 that were sharply downregulated at JS20. These metabolites included nucleosides such as Deoxyadenosine and 3-Deoxyguanosine, iridoid glycosides and glycosidic compounds such as Gardenoside, Geranyl Primeveroside, and Benzyl O-[Arabinofuranosyl-(1→6)-Glucoside], and the chlorophyll degradation product Pyropheophytin B. These compounds were abundant in the early fermentation stage and were then rapidly consumed.
The relative abundance of 4-Hydroxyphenylpyruvic Acid, a key node metabolite in the tyrosine metabolism pathway, gradually decreased during fermentation. A more notable change was the significant accumulation of multiple dipeptides and tripeptides, such as Ser-Met-Ser and Asp-Phe-Ile, in the late fermentation stage, consistent with the increasing trend in total amino acid content in the fermented product (Figure 6B).
3.4. Integrated Analysis
3.4.1. Overall Microbe–Metabolite Associations
The previous metabolite analysis showed the overall trend of metabolite changes, whereas microbial analysis revealed community change patterns dominated by Lactiplantibacillus, Limosilactobacillus, Lactobacillus, Saccharomyces, and Papiliotrema. In the integrated microbe-metabolite analysis module, Procrustes analysis was first performed to explore the relationship between microbial community structure and metabolite changes during fermentation. The results showed that metabolite changes and microbial succession were highly consistent along the time dimension during fermentation (Figure 7A,B).
Spearman correlation analysis was used to generate a genus-level bacterial correlation heatmap (Figure 7C). Figure 7C shows the joint variation pattern between bacterial genera and metabolites at the genus level, revealing clear positive or negative correlations between different genera and multiple classes of metabolites. Based on HMDB classification, the differential metabolites were divided into five categories: flavonoids and phenylpropanoids, amino acids and peptides, nucleotides and nucleosides, glycoconjugates, and carbohydrates. These metabolite categories showed relatively clustered association patterns in the correlation heatmap, suggesting that different metabolic modules may be influenced by different dominant microbial taxa.
Among nucleotide and nucleoside metabolites, Lactobacillus, Roseateles, Acinetobacter, Bradyrhizobium, and other genera were significantly positively correlated with metabolites such as 5-Benzylacyclouridine, Diplosporin, and Penciclovir (), and negatively correlated with metabolites such as 8-Oxo-Dgmp, 8-Nitroguanine, and Thymidine (). Lactiplantibacillus and Streptococcus showed patterns opposite to those of the Lactobacillus group. Limosilactobacillus and Pediococcus complemented the patterns of the Lactobacillus and Lactiplantibacillus groups: correlations between the Lactobacillus or Lactiplantibacillus groups and Deoxyadenosine/Deoxyguanosine were low and non-significant, whereas Limosilactobacillus and Pediococcus showed significant negative correlations with these two metabolites ().
For glycoconjugates, Lactobacillus showed an expression pattern completely opposite to that of Lactiplantibacillus/Streptococcus. Lactobacillus was negatively correlated with most glycosides, whereas Lactiplantibacillus/Streptococcus showed positive correlations. Pediococcus again played a complementary role and showed significant correlations with specific metabolites such as Gardenoside ().
In carbohydrate analysis, a similar pattern of functional differentiation among microbial taxa was observed. The Lactobacillus group showed negative correlations with most metabolites, Lactiplantibacillus and Streptococcus showed similar patterns with positive correlations with most metabolites, and Pediococcus again displayed a unique complementary role at specific metabolic nodes.
The fungal community showed functional differentiation similar to that of the bacterial community. Saccharomyces and Aspergillus showed similar correlation directions for some metabolites, but patterns opposite to those of Papiliotrema.
Previous studies have shown that D. officinale flowers are rich in flavonoids, phenylpropanoids, and other components with notable antioxidant and bioactive properties, which constitute the main material basis of their nutritional quality and functional value [5,6,17]. Therefore, the subsequent analyses in this study focused on dynamic changes in flavonoid-phenylpropanoid metabolites and amino acid-peptide compounds during fermentation and their association mechanisms with the microbial community. The remaining metabolic modules mainly constitute the substrate-product framework of the overall metabolic network and provide background support for elucidating the fermentation mechanisms of core functional compounds.
3.4.2. Flavonoid/Phenylpropanoid Metabolite–Microbe Associations
Based on KEGG pathways and HMDB subclass classification, 11 flavonoid-related (Flavonoids, ) and cinnamic-acid-derivative (Cinnamic acids and derivatives, ) metabolites were selected for association analysis with 25 bacterial genera. Figure 8A shows that Lactiplantibacillus was significantly positively correlated with multiple metabolites, including Spiraeoside and Toringin (). Figure 8E shows that the relative abundances of Spiraeoside, Toringin, 6-Hydroxyluteolin, and Sinapine gradually decreased during fermentation. Because the relative expression levels of these metabolites decreased with prolonged fermentation, they were positively correlated with Lactiplantibacillus, whose abundance also gradually decreased during fermentation. Lactobacillus showed the opposite pattern to Lactiplantibacillus and was strongly negatively correlated with these substances.
The chord diagram (Figure 8C) further showed complex correlation patterns between microorganisms and metabolites. Lactobacillus was negatively correlated with all 14 flavonoid and phenylpropanoid metabolites, whereas Lactiplantibacillus was positively correlated with 13 of these metabolites.
Figure 8B shows that Saccharomyces was significantly positively correlated with multiple metabolites, such as Salidroside, Benzyl O-[Arabinofuranosyl-(1→6)-Glucoside], and Chitobiose (). Figure 8D shows that Papiliotrema displayed a correlation pattern opposite to that of Saccharomyces, and the abundance changes of Papiliotrema and Saccharomyces showed opposite temporal patterns during fermentation (Figure 3D). Aspergillus showed a pattern almost identical to that of Saccharomyces, but its abundance was clearly lower.
3.4.3. Amino Acid/Peptide Metabolite–Microbe Associations
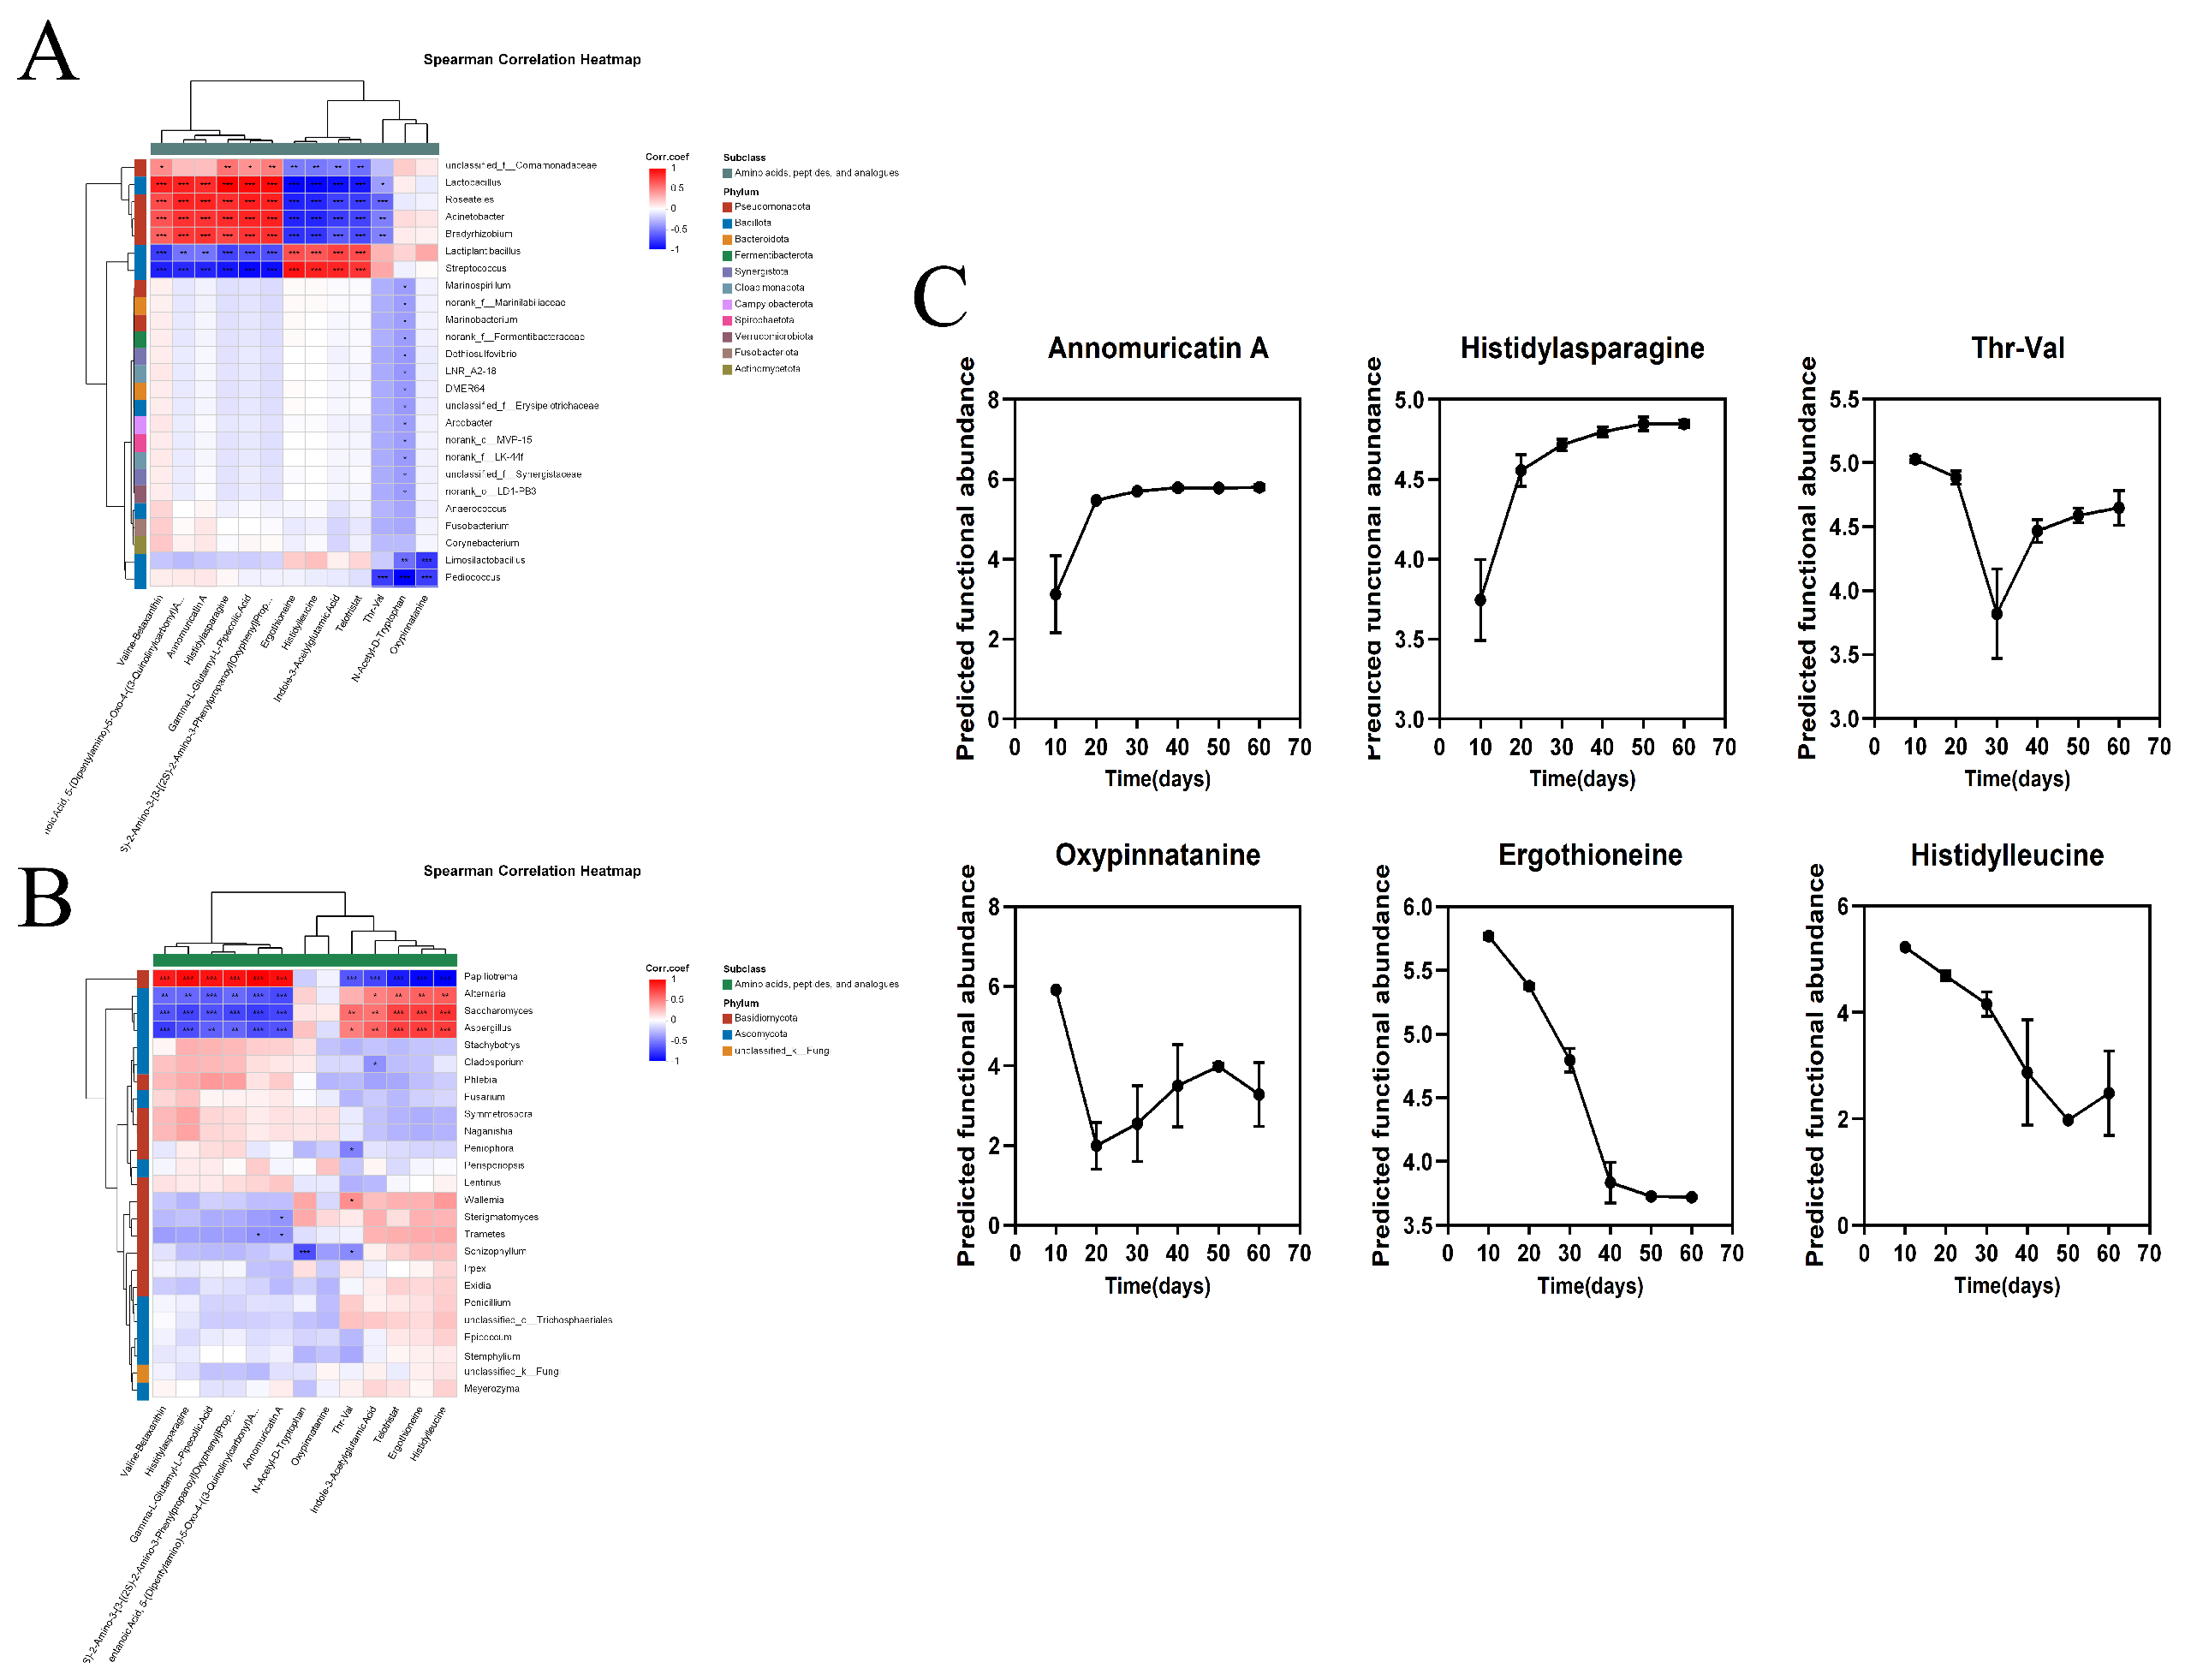
The Spearman correlation heatmap (Figure 8A) showed that changes in amino acid and peptide metabolites during fermentation were associated with microbial succession in diverse ways. Figure 8C shows that amino acid and peptide metabolites could generally be divided into three change patterns: an accumulation pattern with rapid increases in the early and middle fermentation stages represented by the cyclic peptide Annomuricatin A, a decrease followed by rebound ("U-shaped") fluctuation represented by Thr-Val, and continuous consumption represented by Ergothioneine.
A series of bioactive peptides and derivatives increased rapidly during the early and middle fermentation stages and remained at relatively high levels in the late stage, including the cyclic peptide Annomuricatin A, the dipeptide Histidylasparagine, the gamma-glutamyl peptide Gamma-L-Glutamyl-L-Pipecolic Acid, and the amino acid derivative Valine-Betaxanthin. Heatmap analysis (Figure 8A) showed that Lactobacillus was significantly positively correlated with all of these metabolites (). Papiliotrema showed a dynamic pattern of initial increase followed by decrease during fermentation, with its relative abundance peaking at JS40 (Figure 3D), and it showed significant correlations with some amino acid and peptide metabolites (Figure 8B).
Thr-Val, N-Acetyl-D-Tryptophan, and Oxypinnatanine showed U-shaped or stage-specific fluctuation trends characterized by an initial decrease followed by recovery to varying degrees, with troughs mainly occurring during JS20–JS30. From JS40 to JS60, the abundance of these modified amino acids and dipeptides began to recover to varying degrees. Heatmap analysis (Figure 8A,B) showed positive correlations of different strengths between Lactiplantibacillus or Saccharomyces and these metabolites.
The native component Ergothioneine and Indole-3-Acetylglutamic Acid showed a continuous decreasing trend during fermentation. However, the dipeptide Histidylleucine showed a clear rebound at 60 d after an early-stage decline.
Figure 9.
Microbial associations with amino acid- and peptide-related metabolites during fermentation. (A) Spearman correlation heatmap between dominant bacterial genera and amino acid- or peptide-related metabolites. (B) Spearman correlation heatmap between dominant fungal genera and amino acid- or peptide-related metabolites. (C) Temporal changes in representative amino acid- and peptide-related metabolites.
Figure 9.
Microbial associations with amino acid- and peptide-related metabolites during fermentation. (A) Spearman correlation heatmap between dominant bacterial genera and amino acid- or peptide-related metabolites. (B) Spearman correlation heatmap between dominant fungal genera and amino acid- or peptide-related metabolites. (C) Temporal changes in representative amino acid- and peptide-related metabolites.
3.4.4. PICRUSt2-Based Functional Prediction Analysis of Flavonoid/Phenylpropanoid Metabolite–Microbe Associations
To further investigate potential relationships between microorganisms and metabolites during fermentation, PICRUSt2 functional prediction was performed based on 16S rRNA sequencing data. Two key enzyme categories, flavonoid glycoside hydrolases and flavonoid oxidases, were selected to supplement the phenomena observed in Section 3.5.2.
The dynamic changes in predicted functional abundance of the two enzyme categories over fermentation time are shown in Figure 10A. The predicted abundance of flavonoid glycoside hydrolases remained high throughout fermentation. It showed a transient decrease at JS20, then increased and reached a local peak at JS40, followed by a downward trend. The predicted abundance of flavonoid oxidases showed almost the same trend as flavonoid glycoside hydrolases, except that flavonoid oxidases showed another increase at JS60.
The genus-level functional prediction heatmap (Figure 10B) shows the Z-score-normalized abundance of predicted functions related to two flavonoid-metabolism enzyme groups among dominant genera, based on PICRUSt2. Lactobacillus and Lactiplantibacillus showed high functional intensity for flavonoid glycoside hydrolases (0.902 and 1.000, respectively).
Limosilactobacillus and Pediococcus showed high functional intensity for flavonoid glycoside hydrolases (1.154), exceeding that of Lactobacillus.
3.4.5. Pathway Analysis of Phenylpropanoid-Flavonoid Metabolites
To describe pathway changes in phenylpropanoid-flavonoid metabolites during fermentation, this study integrated three core metabolic pathways: Phenylpropanoid biosynthesis (map00940), Flavonoid biosynthesis (map00941), and Degradation of flavonoids (map00946).
In the Phenylpropanoid biosynthesis pathway (Figure S1), some phenylpropanoid derivatives, such as 5-Caffeoylshikimic Acid and Chlorogenic Acid, gradually decreased in relative abundance during fermentation (Figure 11A). Sinapic Acid, Sinapyl Alcohol, Coumaryl Acetate, and other metabolites showed clear increases in the middle and late fermentation stages (Figure 11A). Intermediate-node metabolites such as Caffeic Acid and 5-Hydroxyferulic Acid showed slight fluctuations over time (Figure 11A).
In the Degradation of flavonoids pathway (Figure S2), Phloroglucinol appeared in two branches. One branch was introduced from "Flavone and flavonol biosynthesis", proceeded through the conversion of flavonol glycosides such as Isoquercitrin, and ultimately pointed to Phloroglucinol. The other branch was introduced from "Flavonoid biosynthesis", in which Eriodictyol was converted to 3,4-DHPP and Phloroglucinol. Figure 11B shows that Isoquercitrin, Isoquercetin, and Isoquercitin, corresponding to Isoquercitrin in the pathway map, generally showed decreases or weakening trends to varying degrees in the late fermentation stage, whereas Eriodictyol, 3,4-DHPP, and Phloroglucinol showed increases or recovery trends to varying degrees.
In the Flavonoid biosynthesis pathway map (Figure S3), different classes of flavonoid metabolites showed clear divergence in their change trends. Flavonols or glycosylated flavonoids, such as Myricetin, Phlorizin, and Vitexin derivatives, continuously decreased during fermentation (Figure 11C). By contrast, flavanone/flavanol compounds such as Sakuranetin and Eriodictyol generally showed increasing trends.
Overall, in the phenylpropanoid-flavonoid metabolic network, multiple phenylpropanoid and flavonoid compounds with complex structures decreased over fermentation time, whereas some small-molecule phenolic acids, alcohols, flavanones, and flavanols accumulated over time (Figure 11).
Using the screening criteria and VIP , 1378 metabolites were identified. By adopting this more relaxed screening threshold, a more comprehensive set of related metabolites was mapped to the KEGG metabolic network. Because the flavonoid and phenylpropanoid metabolic networks are structurally complex, the relaxed screening criteria helped avoid omission of some metabolites that were not classified as differential but were involved in the pathways, thereby presenting the metabolic structure more completely.
The heatmap shows temporal changes in selected metabolites mapped to phenylpropanoid biosynthesis, flavonoid degradation, and flavonoid biosynthesis pathways. Color intensity indicates relative metabolite abundance.
4. Discussion
Fermentation is generally a complex process involving multiple factors, including microbial transformation and chemical reactions [22,23], and its underlying mechanisms can be difficult to resolve; therefore, multi-omics evidence is needed for mechanistic interpretation. D. officinale flowers are rich in flavonoids and other bioactive compounds and exhibit favorable antioxidant properties [5,6,16,17]. Accordingly, this study investigated metabolic remodeling characteristics and potential microbial driving mechanisms based on dynamic changes in flavonoid, phenylpropanoid, and related metabolites during D. officinale flower fermentation. Using LC-MS/MS combined with multivariate statistical analyses, including PCA, PLS-DA, and OPLS-DA, this study identified differential metabolites generated during Dendrobium fermentation and revealed close relationships between changes in these metabolites and microbial community succession.
KEGG enrichment analysis (Figure 5C) showed significant enrichment of pathways such as Nucleotide metabolism and ABC transporters, suggesting that nucleotide-metabolism-related processes may change during fermentation [33]; meanwhile, transmembrane transport-related functions may also participate in substrate uptake and metabolite exchange within the fermentation system. Pathways related to phenylpropanoid-flavonoid metabolism were significantly enriched. Consistent with the changes in phenylpropanoid and flavonoid compounds shown in Figure 5A,B, the relative abundance of these substances generally decreased as fermentation progressed. The change in DPPH antioxidant activity shown in Figure 6A also supports the judgment that the phenylpropanoid-flavonoid biosynthetic network was generally downregulated. Although this phenomenon is often regarded as quality loss, deep metabolic profiling suggests that it may in fact reflect a refining process from "high-abundance, complex structures" toward "highly bioactive structures".
Pathway analysis in Figure 11 showed that complex flavonoid glycosides such as Isoquercitrin and Phlorizin continuously decreased in abundance, whereas some downstream small-molecule phenolic acids and aglycones, such as luteolin and Sakuranetin, showed increases or stage-specific fluctuations, suggesting that fermentation may promote remodeling of the phenylpropanoid-flavonoid metabolic network. This trend was consistent with the generally high predicted abundance of flavonoid glycoside hydrolases during fermentation (Figure 10A). In food fermentation, lactic acid bacteria can transform phenolic acids, polyphenols, and flavonoid glycosides through glycosidases, esterases, decarboxylases, reductases, and related pathways [13,25]. Compared with their glycosylated forms, flavonoid aglycones generally have higher lipophilicity and more favorable transmembrane transport properties, and can be absorbed and utilized without further hydrolysis; therefore, they may be superior to the corresponding glycosides in terms of intestinal absorption, cellular uptake, and antioxidant activity [34,35,36]. Thus, although in vitro chemical antioxidant indices such as DPPH may decline because of reduced total flavonoid levels, deglycosylation and de-esterification can promote the conversion of phenolic compounds into more absorbable free forms, potentially enhancing their physiological regulatory effects in vivo.
In contrast to flavonoid metabolites, the nitrogen-containing metabolite pool showed a marked "remodeling gain" in the late fermentation stage. The conversion of proteins into small molecules is a core indicator for evaluating nutritional upgrading during fermentation [26].
First, stage-specific enrichment of functional peptides and their derivatives formed the basis of the product’s "postbiotic" potential. The cyclic peptide Annomuricatin A, the dipeptide Histidylasparagine, and gamma-glutamyl peptides increased rapidly in the early and middle stages and remained at high levels in the late stage, indicating that the fermentation system may have gradually shifted from the native plant protein pool toward a metabolic profile richer in small peptides. In addition, cyclic peptides usually possess greater enzymatic stability than linear peptides because of their unique closed structures, providing a structural basis for their potential anti-inflammatory and immunomodulatory activities [37,38].
Second, the "U-shaped fluctuation" mechanism described in Section 3.5.3 suggests a possible dynamic balance between metabolic assimilation and re-release. Compounds represented by Thr-Val and N-Acetyl-D-Tryptophan showed a trajectory of initial decrease followed by increase, implying a metabolic transition within the fermentation system. The abundance troughs of these metabolites during the early fermentation stage (JS20–JS30) coincided temporally with the growth peak of Pediococcus. This suggests that microorganisms may strongly assimilate native free amino acids and simple dipeptides in the early fermentation stage [39,40]. At this time, microorganisms may convert part of the nitrogen source into their own biomass, forming an early-stage "metabolic cost" of fermentation.
In addition, during the early and middle fermentation stages, Ergothioneine and the dipeptide Histidylleucine showed stage-specific continuous decreases. As a potent endogenous antioxidant, the continuous decline in Ergothioneine may be related to its participation in resisting oxidative stress (ROS) generated by intense microbial metabolism during fermentation [41,42]. Consumption of Ergothioneine may help maintain redox homeostasis in the fermentation microenvironment and partly explain the decrease in the in vitro chemical antioxidant indices observed during this period.
The microbial correlation results in this study provide a microbial-side explanation for metabolite remodeling. Among bacteria, Lactobacillus and Lactiplantibacillus showed substantially different association patterns with key metabolic modules. Lactobacillus was positively correlated with multiple amino acid and peptide metabolites and showed a gradually increasing abundance trend over fermentation time, suggesting a potentially more active role in proteolysis and peptide metabolism. Consistent with this, the substrate utilization strategies of Lactobacillus may have greater advantages under oligotrophic and late-stage acidic conditions [45,46]. Lactiplantibacillus, which was abundant in the early stage, showed significantly positive correlations with multiple flavonoid glycoside and phenylpropanoid metabolites. Its overall decreasing trend over time was consistent with the consumption pattern of these metabolites, suggesting that Lactiplantibacillus may play a primary role in the early-stage conversion of plant secondary metabolites [24,25,45]. This functional divergence likely reflects niche differentiation within the bacterial community.
Among fungi, Saccharomyces was widely and positively correlated with multiple metabolites, reflecting its central metabolic role as the dominant fungus in this fermentation system. Notably, Papiliotrema showed a correlation pattern strikingly opposite to that of Saccharomyces, and these two genera displayed opposite abundance trends during fermentation. This may suggest a competitive or complementary interaction between these two fungal populations, which could influence metabolic output in a stage-dependent manner.
Pediococcus showed a unique pattern of functional complementarity in the integrated correlation analysis. This genus displayed significant correlations with specific metabolites that were not strongly associated with other dominant genera, and its abundance dynamics (peaking at JS30) filled the "mid-fermentation gap" in the succession timeline. In food fermentation systems, Pediococcus species are known to produce bacteriocins, exopolysaccharides, and various hydrolytic enzymes that may affect the metabolic environment [51,52]. This mid-succession peak of Pediococcus may thus serve as a transitional functional module, facilitating the handover from early-stage Lactiplantibacillus-driven metabolism to late-stage Lactobacillus-driven proteolysis.
From the perspective of process management, the pH reduction during fermentation was a key factor affecting fermentation progression. In this study, the initial pH (3.9) was already relatively low, which may have selectively favored acid-tolerant strains. Changes in pH, along with nutrient depletion and metabolite accumulation, are typical drivers of community succession in mixed-culture fermentation [53,54,55]. The PICRUSt2 functional prediction results further provided enzyme-level supporting evidence for the above analysis, revealing high predicted abundances of flavonoid glycoside hydrolases and flavonoid oxidases during fermentation, especially in Lactobacillus and Lactiplantibacillus. However, the limitations of PICRUSt2 should be acknowledged: as a predictive tool based on 16S rRNA data, its results do not directly reflect actual enzyme activity levels and should be interpreted as hypotheses requiring further experimental validation [56].
Overall, this study demonstrates that the liquid fermentation of D. officinale flowers involves a dynamic process of bacterial succession, fungal community remodeling, and metabolite network reconstruction, rather than a simple superposition of microbial growth and chemical reactions. The coordinated changes among these dimensions provide a multi-omics basis for understanding fermentation-associated biotransformation in Dendrobium flower materials. These findings not only provide a theoretical framework for the efficient biotransformation of D. officinale flower resources, but also lay a scientific foundation for developing highly active and readily absorbable functional fermented Dendrobium products.
5. Conclusions
In this study, a liquid mixed-culture fermentation system was established for D. officinale flowers, integrating response surface optimization, microbiome analysis, and untargeted metabolomics to elucidate biotransformation patterns during 60 days of fermentation. Fermentation conditions were systematically optimized using DPPH radical scavenging activity as the response index. Under optimized conditions, temporal multi-omics analysis revealed clear bacterial and fungal succession, with Lactiplantibacillus, Limosilactobacillus, Lactobacillus, Saccharomyces, and Papiliotrema as the dominant microbial taxa. Metabolomic analysis revealed time-dependent metabolic remodeling centered on phenylpropanoid-flavonoid and amino acid-peptide pathways. From a functional perspective, fermentation induced a metabolic shift from high-abundance complex glycosides toward more bioavailable aglycones and small phenolic derivatives, while simultaneously driving the accumulation of small peptides and amino acid derivatives with potential postbiotic activities. Spearman correlation and Procrustes analyses further demonstrated coordinated changes between microbial community structure and metabolite profiles. These findings present an integrated multi-omics picture of the biotransformation processes during D. officinale flower fermentation and provide a scientific basis for quality-oriented processing and functional product development of fermented Dendrobium products.
Supplementary Materials
The following supporting information can be downloaded at the website of this paper posted on Preprints.org.
Author Contributions
Conceptualization, X.M.; methodology, X.M.; software, X.M. and H.B.; validation, A.X.; formal analysis, A.X.; investigation, X.M. and A.X.; data curation, H.B. and A.X.; writing—original draft preparation, X.M. and H.B.; writing—review and editing, W.X. and Z.M.; visualization, H.B.; supervision, Z.M.; project administration, Z.M.; funding acquisition, W.X. and Z.M. All authors have read and agreed to the published version of the manuscript.
Funding
This research was funded by the Anhui Provincial Science and Technology Major Project (No. 202103b06020019), the Anhui Provincial Natural Science Foundation (No. 2308085MC112), and the Anhui Provincial Key Research and Development Program (No. 2023n06020049).
Institutional Review Board Statement
Not applicable.
Informed Consent Statement
Not applicable.
Data Availability Statement
The data presented in this study are available in the article and the Supplementary Materials.
Acknowledgments
This work was supported by the Anhui Provincial Science and Technology Major Project (No. 202103b06020019), the Anhui Provincial Natural Science Foundation (No. 2308085MC112), and the Anhui Provincial Key Research and Development Program (No. 2023n06020049). The authors also acknowledge the technical support provided by the laboratory of the School of Food and Biological Engineering, Hefei University of Technology.
Conflicts of Interest
The authors declare no conflicts of interest.
Abbreviations
The following abbreviations are used in this manuscript:
| BBD | Box–Behnken design |
| DPPH | 2,2-Diphenyl-1-picrylhydrazyl |
| FC | Fold change |
| FGH | Flavonoid glycoside hydrolase |
| FO | Flavonoid oxidase |
| ITS | Internal transcribed spacer |
| KEGG | Kyoto Encyclopedia of Genes and Genomes |
| LC-MS/MS | Liquid chromatography–tandem mass spectrometry |
| OPLS-DA | Orthogonal partial least squares discriminant analysis |
| OTU | Operational taxonomic unit |
| PCA | Principal component analysis |
| PCoA | Principal coordinate analysis |
| PICRUSt2 | Phylogenetic Investigation of Communities by Reconstruction of Unobserved States 2 |
| PLS-DA | Partial least squares discriminant analysis |
| QC | Quality control |
| RSM | Response surface methodology |
| VIP | Variable importance in projection |
References
- Chen, W.; Lu, J.; Zhang, J.; Wu, J.; Yu, L.; Qin, L.; Zhu, B. Traditional Uses, Phytochemistry, Pharmacology, and Quality Control of Dendrobium officinale Kimura et. Migo. Front. Pharmacol. 2021, 12, 726528. [Google Scholar] [CrossRef] [PubMed]
- He, Y.; Li, L.; Chang, H.; Cai, B.; Gao, H.; Chen, G.; Hou, W.; Jappar, Z.; Yan, Y. Research Progress on Extraction, Purification, Structure and Biological Activity of Dendrobium officinale Polysaccharides. Front. Nutr. 2022, 9, 965073. [Google Scholar] [CrossRef] [PubMed]
- Yuan, Y.; Zuo, J.; Zhang, H.; Zu, M.; Yu, M.; Liu, S. Transcriptome and Metabolome Profiling Unveil the Accumulation of Flavonoids in Dendrobium officinale. Genomics 2022, 114, 110324. [Google Scholar] [CrossRef] [PubMed]
- Ren, X.; Huang, Y.; Zhang, L.; Lu, Q.; Wang, X.; Ying, W.; Ruan, S. Integrated Analysis of Transcriptomics and Metabolomics of Dendrobium officinale Flowers at Different Developmental Stages. Sci. Rep. 2025, 15, 10766. [Google Scholar] [CrossRef] [PubMed]
- Zhou, H.; Zhou, L.; Li, B.; Yue, R. Anti-cyclooxygenase, Anti-glycation, and Anti-skin Aging Effect of Dendrobium officinale Flowers’ Aqueous Extract and Its Phytochemical Validation in Aging. Front. Immunol. 2023, 14, 1095848. [Google Scholar] [CrossRef] [PubMed]
- Zhu, P.; Wang, X.; Liu, X.; Shen, X.; Li, A.; Zheng, X.; Sheng, J.; Yuan, W. Characterization of the Composition of Bioactive Fractions from Dendrobium officinale Flowers That Protect against H2O2-Induced Oxidative Damage through the PI3K/AKT/Nrf2 Pathway. Foods 2024, 13, 3116. [Google Scholar] [CrossRef] [PubMed]
- Yang, Y.-H.; Zhou, H.-W.; Du, Z.-Z. Effect of Drying Methods on Aroma, Taste and Antioxidant Activity of Dendrobium officinale Flower Tea: A Sensomic and Metabolomic Study. Food Res. Int. 2024, 187, 114455. [Google Scholar] [CrossRef] [PubMed]
- Yang, Y.-H.; Zhao, J.; Du, Z.-Z. Unravelling the Key Aroma Compounds in the Characteristic Fragrance of Dendrobium officinale Flowers for Potential Industrial Application. Phytochemistry 2022, 200, 113223. [Google Scholar] [CrossRef] [PubMed]
- Li, S.; Wang, J.; Zhang, L.; Zheng, Y.; Ma, G.; Sun, X.; Yuan, J. Preparation of Dendrobium officinale Flower Anthocyanin and Extended Lifespan in Caenorhabditis elegans. Molecules 2022, 27, 8608. [Google Scholar] [CrossRef] [PubMed]
- Zhu, Z.; Song, X.; Huang, Y.; Jiang, Y.; Yao, J.; Li, Z.; Huang, Z.; Dai, F. Acylated Anthocyanins from Dendrobium officinale Kimura & Migo: Structural Characteristics, Antioxidant and Hypoglycemic Activities. Food Chem. 2024, 455, 139952. [Google Scholar] [CrossRef] [PubMed]
- Wu, Y.-L.; Huang, S.-H.; He, C.-M.; Qiu, B.; Liu, J.-J.; Li, J.; Lin, Y.; Yu, S.-L.; Wang, H.-F.; Zhang, G.-F. Dendrobium officinale Flower Extraction Mitigates Alcohol-Induced Liver Injury in Mice: Role of Antisteatosis, Antioxidative, and Anti-Inflammatory. Evid.-Based Complement. Altern. Med. 2020, 2020, 1421853. [Google Scholar] [CrossRef] [PubMed]
- Zhang, J.; Fan, J.; Luo, H.; Liang, Z.; Guan, Y.; Lei, X.; Bo, N.; Zhao, M. Alleviation of Alcoholic Fatty Liver by Dendrobium officinale Flower Extracts due to Regulation of Gut Microbiota and Short-Chain Fatty Acids in Mice Exposed to Chronic Alcohol. Foods 2023, 12, 1428. [Google Scholar] [CrossRef] [PubMed]
- Leonard, W.; Zhang, P.; Ying, D.; Adhikari, B.; Fang, Z. Fermentation Transforms the Phenolic Profiles and Bioactivities of Plant-Based Foods. Biotechnol. Adv. 2021, 49, 107763. [Google Scholar] [CrossRef] [PubMed]
- Filannino, P.; Di Cagno, R.; Gobbetti, M. Metabolic and Functional Paths of Lactic Acid Bacteria in Plant Foods: Get out of the Labyrinth. Curr. Opin. Biotechnol. 2018, 49, 64–72. [Google Scholar] [CrossRef] [PubMed]
- Gao, Y.; Hou, L.; Gao, J.; Li, D.; Tian, Z.; Fan, B.; Wang, F.; Li, S. Metabolomics Approaches for the Comprehensive Evaluation of Fermented Foods: A Review. Foods 2021, 10, 2294. [Google Scholar] [CrossRef] [PubMed]
- Luo, Z.; Liu, L.; Nie, Q.; Huang, M.; Luo, C.; Sun, Y.; Ma, Y.; Yu, J.; Du, F. HPLC-Based Metabolomics of Dendrobium officinale Revealing Its Antioxidant Ability. Front. Plant Sci. 2023, 14, 1060242. [Google Scholar] [CrossRef] [PubMed]
- Jiang, L.; Li, X.; Wang, S.; Pan, D.; Wu, X.; Guo, F.; Mu, D.; Jia, F.; Zhang, M. Analysis of Metabolic Differences between Jiaosu Fermented from Dendrobium Flowers and Stems Based on Untargeted Metabolomics. Heliyon 2024, 10, e27061. [Google Scholar] [CrossRef] [PubMed]
- Wu, J.; He, T.; Wang, Z.; Mao, J.; Sha, R. The Dynamic Analysis of Non-Targeted Metabolomics and Antioxidant Activity of Dendrobium officinale Kimura et Migo by the Synergistic Fermentation of Bacteria and Enzymes. LWT-Food Sci. Technol. 2024, 203, 116354. [Google Scholar] [CrossRef]
- Liu, W.; Luo, X.; Qiu, S.; Huang, W.; Su, Y.; Li, L. Determining the Changes in Metabolites of Dendrobium officinale Juice Fermented with Starter Cultures Containing Saccharomycopsis fibuligera FBKL2.8DCJS1 and Lactobacillus paracasei FBKL1.3028 through Untargeted Metabolomics. BMC Microbiol. 2023, 23, 67. [Google Scholar] [CrossRef] [PubMed]
- Yao, L.; Shi, X.; Chen, H.; Zhang, L.; Cen, L.; Li, L.; Lv, Y.; Qiu, S.; Zeng, X.; Wei, C. Major Active Metabolite Characteristics of Dendrobium officinale Rice Wine Fermented by Saccharomyces cerevisiae and Wickerhamomyces anomalus Cofermentation. Foods 2023, 12, 2370. [Google Scholar] [CrossRef] [PubMed]
- Chen, X.; Li, L.; Yang, H.; Zhou, H. Effects of the Addition of Dendrobium officinale on Beer Yeast Fermentation. Fermentation 2022, 8, 595. [Google Scholar] [CrossRef]
- Smid, E.J.; Lacroix, C. Microbe-Microbe Interactions in Mixed Culture Food Fermentations. Curr. Opin. Biotechnol. 2013, 24, 148–154. [Google Scholar] [CrossRef] [PubMed]
- Garcia, C.; Rendueles, M.; Diaz, M. Liquid-Phase Food Fermentations with Microbial Consortia Involving Lactic Acid Bacteria: A Review. Food Res. Int. 2019, 119, 207–220. [Google Scholar] [CrossRef] [PubMed]
- Munoz, R.; de las Rivas, B.; Rodriguez, H.; Esteban-Torres, M.; Reveron, I.; Santamaria, L.; Landete, J.M.; Plaza-Vinuesa, L.; Sanchez-Arroyo, A.; Jimenez, N.; Curiel, J.A. Food Phenolics and Lactiplantibacillus plantarum. Int. J. Food Microbiol. 2024, 412, 110555. [Google Scholar] [CrossRef] [PubMed]
- Gaur, G.; Gänzle, M.G. Conversion of (Poly)Phenolic Compounds in Food Fermentations by Lactic Acid Bacteria: Novel Insights into Metabolic Pathways and Functional Metabolites. Curr. Res. Food Sci. 2023, 6, 100448. [Google Scholar] [CrossRef] [PubMed]
- Peres Fabbri, L.; Cavallero, A.; Vidotto, F.; Gabriele, M. Bioactive Peptides from Fermented Foods: Production Approaches, Sources, and Potential Health Benefits. Foods 2024, 13, 3369. [Google Scholar] [CrossRef] [PubMed]
- Chen, S.; Zhou, Y.; Chen, Y.; Gu, J. fastp: An Ultra-Fast All-in-One FASTQ Preprocessor. Bioinformatics 2018, 34, i884–i890. [Google Scholar] [CrossRef] [PubMed]
- Magoc, T.; Salzberg, S.L. FLASH: Fast Length Adjustment of Short Reads to Improve Genome Assemblies. Bioinformatics 2011, 27, 2957–2963. [Google Scholar] [CrossRef] [PubMed]
- Edgar, R.C. UPARSE: Highly Accurate OTU Sequences from Microbial Amplicon Reads. Nat. Methods 2013, 10, 996–998. [Google Scholar] [CrossRef] [PubMed]
- Stackebrandt, E.; Goebel, B.M. Taxonomic Note: A Place for DNA-DNA Reassociation and 16S rRNA Sequence Analysis in the Present Species Definition in Bacteriology. Int. J. Syst. Bacteriol. 1994, 44, 846–849. [Google Scholar] [CrossRef]
- Wang, Q.; Garrity, G.M.; Tiedje, J.M.; Cole, J.R. Naive Bayesian Classifier for Rapid Assignment of rRNA Sequences into the New Bacterial Taxonomy. Appl. Environ. Microbiol. 2007, 73, 5261–5267. [Google Scholar] [CrossRef] [PubMed]
- Park, M.K.; Kim, Y.-S. Mass Spectrometry Based Metabolomics Approach on the Elucidation of Volatile Metabolites Formation in Fermented Foods: A Mini Review. Food Sci. Biotechnol. 2021, 30, 881–890. [Google Scholar] [CrossRef] [PubMed]
- Jiang, L.; et al. Analysis of Differential Metabolites in Liuyang Douchi at Different Fermentation Stages Based on Untargeted Metabolomics Approach. Food Chem. X 2025, 25, 102097. [Google Scholar] [CrossRef] [PubMed]
- Differences in in vivo Absorption of Flavone Glycosides, Flavone Aglycones and Terpene Lactones under Different Dosage Forms and Physiological Conditions. J. Ethnopharmacol. 2023, 306, 116159. [CrossRef] [PubMed]
- Kawabata, K.; Yoshioka, Y.; Terao, J. Role of Intestinal Microbiota in the Bioavailability and Physiological Functions of Dietary Polyphenols. Molecules 2019, 24. [Google Scholar] [CrossRef] [PubMed]
- Hu, L.; Luo, Y.; Yang, J.; Cheng, C. Botanical Flavonoids: Efficacy, Absorption, Metabolism and Advanced Pharmaceutical Technology for Improving Bioavailability. Molecules 2025, 30. [Google Scholar] [CrossRef] [PubMed]
- Cyclic Peptides: A Powerful Instrument for Advancing Biomedical Nanotechnologies and Drug Development. J. Pharm. Biomed. Anal. 2025, 252, 116488. [CrossRef] [PubMed]
- Buchanan, D.; Mori, S.; Chadli, A.; Panda, S.S. Natural Cyclic Peptides: Synthetic Strategies and Biomedical Applications. Biomedicines 2025, 13, 240. [Google Scholar] [CrossRef] [PubMed]
- Christofi, S.; et al. Effect of Yeast Assimilable Nitrogen Content on Fermentation Kinetics, Wine Chemical Composition and Sensory Character in the Production of Assyrtiko Wines. Appl. Sci. 2022, 12. [Google Scholar] [CrossRef]
- Sawant, S.S.; Park, H.-Y.; Sim, E.-Y.; Kim, H.-S.; Choi, H.-S. Microbial Fermentation in Food: Impact on Functional Properties and Nutritional Enhancement—A Review of Recent Developments. Fermentation 2025, 11. [Google Scholar] [CrossRef]
- Borodina, I.; et al. The Biology of Ergothioneine, an Antioxidant Nutraceutical. Nutr. Res. Rev. 2020, 33, 190–217. [Google Scholar] [CrossRef] [PubMed]
- Ergothioneine Yield of Rhodotorula Species Positively Correlated with Hydrogen Peroxide Tolerance. Food Biosci. 2023, 53, 102745. [CrossRef]
- Kim, J.; Choi, K.-B.; Park, J.H.; Kim, K.H. Metabolite Profile Changes and Increased Antioxidative and Antiinflammatory Activities of Mixed Vegetables after Fermentation by Lactobacillus plantarum. PLoS ONE 2019, 14, e0217180. [Google Scholar] [CrossRef] [PubMed]
- Cheng, S.; Zheng, Y.; Li, H.; Jiang, Y.; Zhang, Y. Metabolic Engineering of Blueberry Juice by Lactiplantibacillus plantarum JM065: Fermentation Optimization. Food Chem. 2025, 496, 146669. [Google Scholar] [CrossRef] [PubMed]
- Paventi, G.; Di Martino, C.; Coppola, F.; Iorizzo, M. β-Glucosidase Activity of Lactiplantibacillus plantarum: A Key Player in Food Fermentation and Human Health. Foods 2025, 14, 1451. [Google Scholar] [CrossRef] [PubMed]
- Use of Lactobacillus mucosae DPC 6426, an Exopolysaccharide-Producing Strain, Positively Influences the Techno-Functional Properties of Yoghurt. Int. Dairy J. 2015, 40, 33–38. [CrossRef]
- Yadav, M.K.; et al. Methods for Detection, Extraction, Purification, and Characterization of Exopolysaccharides of Lactic Acid Bacteria—A Systematic Review. Foods 2024, 13, 3687. [Google Scholar] [CrossRef] [PubMed]
- Huang, C.; Cheng, L. Unlocking Casein Bioactivity: Lactic Acid Bacteria and Molecular Strategies for Peptide Release. Int. J. Mol. Sci. 2025, 26. [Google Scholar] [CrossRef] [PubMed]
- Ren, Y.; Li, L. The Influence of Protease Hydrolysis of Lactic Acid Bacteria on the Fermentation-Induced Soybean Protein Gel: Protein Molecule, Peptides and Amino Acids. Food Res. Int. 2022, 156, 111284. [Google Scholar] [CrossRef] [PubMed]
- Unveiling Biotransformation of Free Flavonoids into Phenolic Acids and Chromones alongside Dynamic Migration of Bound Phenolics in Lactobacillus-Fermented Lychee Pulp. Food Chem. 2024, 457, 140115. [CrossRef] [PubMed]
- Meng, C.; et al. Pediococcus pentosaceus JS35 Improved Flavor, Metabolic Profile of Fermentation Supernatant of Mulberry Leaf Powder and Increased Its Antioxidant Capacity. Front. Nutr. 2025, 12. [Google Scholar] [CrossRef] [PubMed]
- Xu, X.; Bi, S.; Lao, F.; Chen, F.; Liao, X.; Wu, J. Comprehensive Investigation on Volatile and Non-Volatile Metabolites in Broccoli Juices Fermented by Animal- and Plant-Derived Pediococcus pentosaceus. Food Chem. 2021, 341, 128118. [Google Scholar] [CrossRef] [PubMed]
- Effects of Mixed Fermentation of Different Lactic Acid Bacteria and Yeast on Phytic Acid Degradation and Flavor Compounds in Sourdough. LWT 2023, 174, 114438. [CrossRef]
- Enhanced Fermentative Lactic Acid Production from Source-Sorted Organic Household Waste: Focusing on Low-pH Microbial Adaptation and Bio-Augmentation Strategy. Sci. Total Environ. 2022, 808, 152129. [CrossRef] [PubMed]
- Lv, X.; et al. Analysis of Acid-Tolerance Mechanism Based on Membrane Microdomains in Saccharomyces cerevisiae. Microb. Cell Fact. 2023, 22, 180. [Google Scholar] [CrossRef] [PubMed]
- Antifungal Activity of Lactiplantibacillus plantarum Isolated from Fruit and Vegetables and Detection of Novel Antifungal VOCs from Fungal-LAB Co-Cultures. Food Biosci. 2024, 58, 103824. [CrossRef]
Figure 1.
Effects of single factors on DPPH free radical scavenging rate. The effects of different single factors on the DPPH radical scavenging activity of fermented Dendrobium officinale flowers were evaluated, including (A) carbon source type, (B) carbon addition, (C) fermentation temperature, and (D) initial pH. Data are presented as mean ± SD from three independent replicates. Different lowercase letters above the bars indicate significant differences among treatments within the same panel according to one-way ANOVA followed by Tukey’s multiple comparison test ().
Figure 1.
Effects of single factors on DPPH free radical scavenging rate. The effects of different single factors on the DPPH radical scavenging activity of fermented Dendrobium officinale flowers were evaluated, including (A) carbon source type, (B) carbon addition, (C) fermentation temperature, and (D) initial pH. Data are presented as mean ± SD from three independent replicates. Different lowercase letters above the bars indicate significant differences among treatments within the same panel according to one-way ANOVA followed by Tukey’s multiple comparison test ().
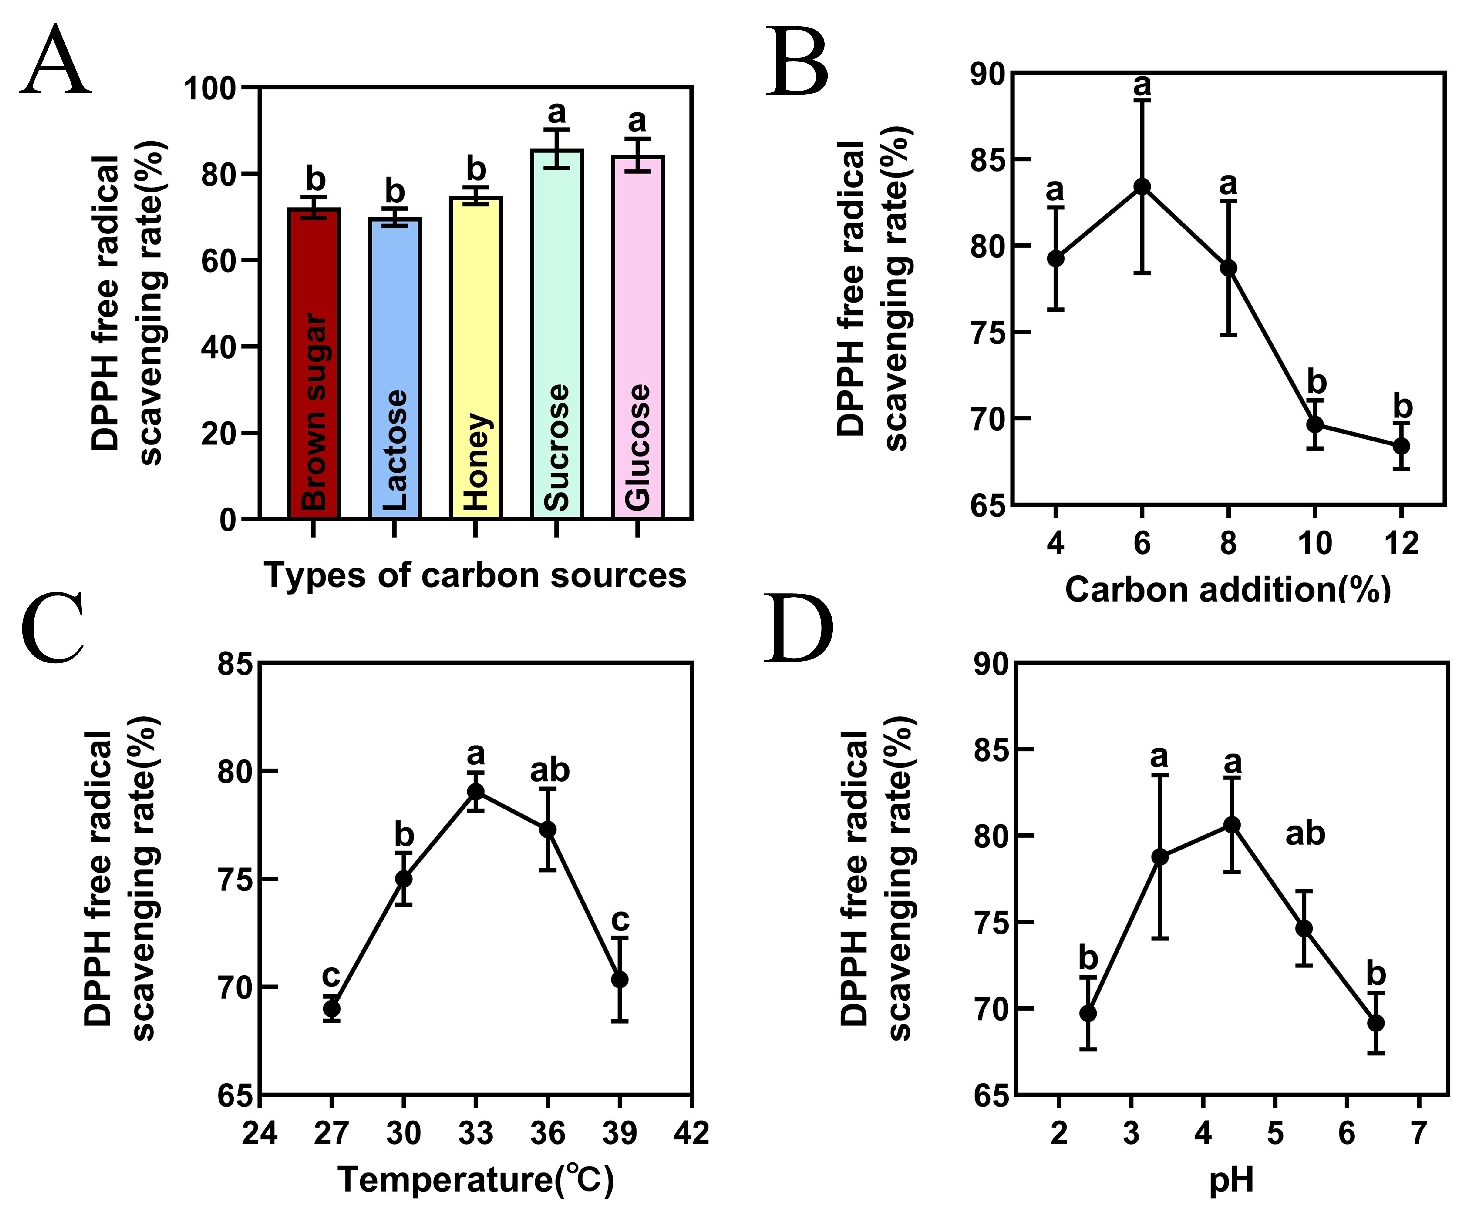
Figure 2.
Model diagnostic and response surface plots for DPPH free radical scavenging rate. (A) Predicted versus actual values; (B,C) interaction between temperature and pH at C = 6%; (D,E) interaction between temperature and carbon source addition at B = 4.4; (F,G) interaction between pH and carbon source addition at A = 33 °C.
Figure 2.
Model diagnostic and response surface plots for DPPH free radical scavenging rate. (A) Predicted versus actual values; (B,C) interaction between temperature and pH at C = 6%; (D,E) interaction between temperature and carbon source addition at B = 4.4; (F,G) interaction between pH and carbon source addition at A = 33 °C.
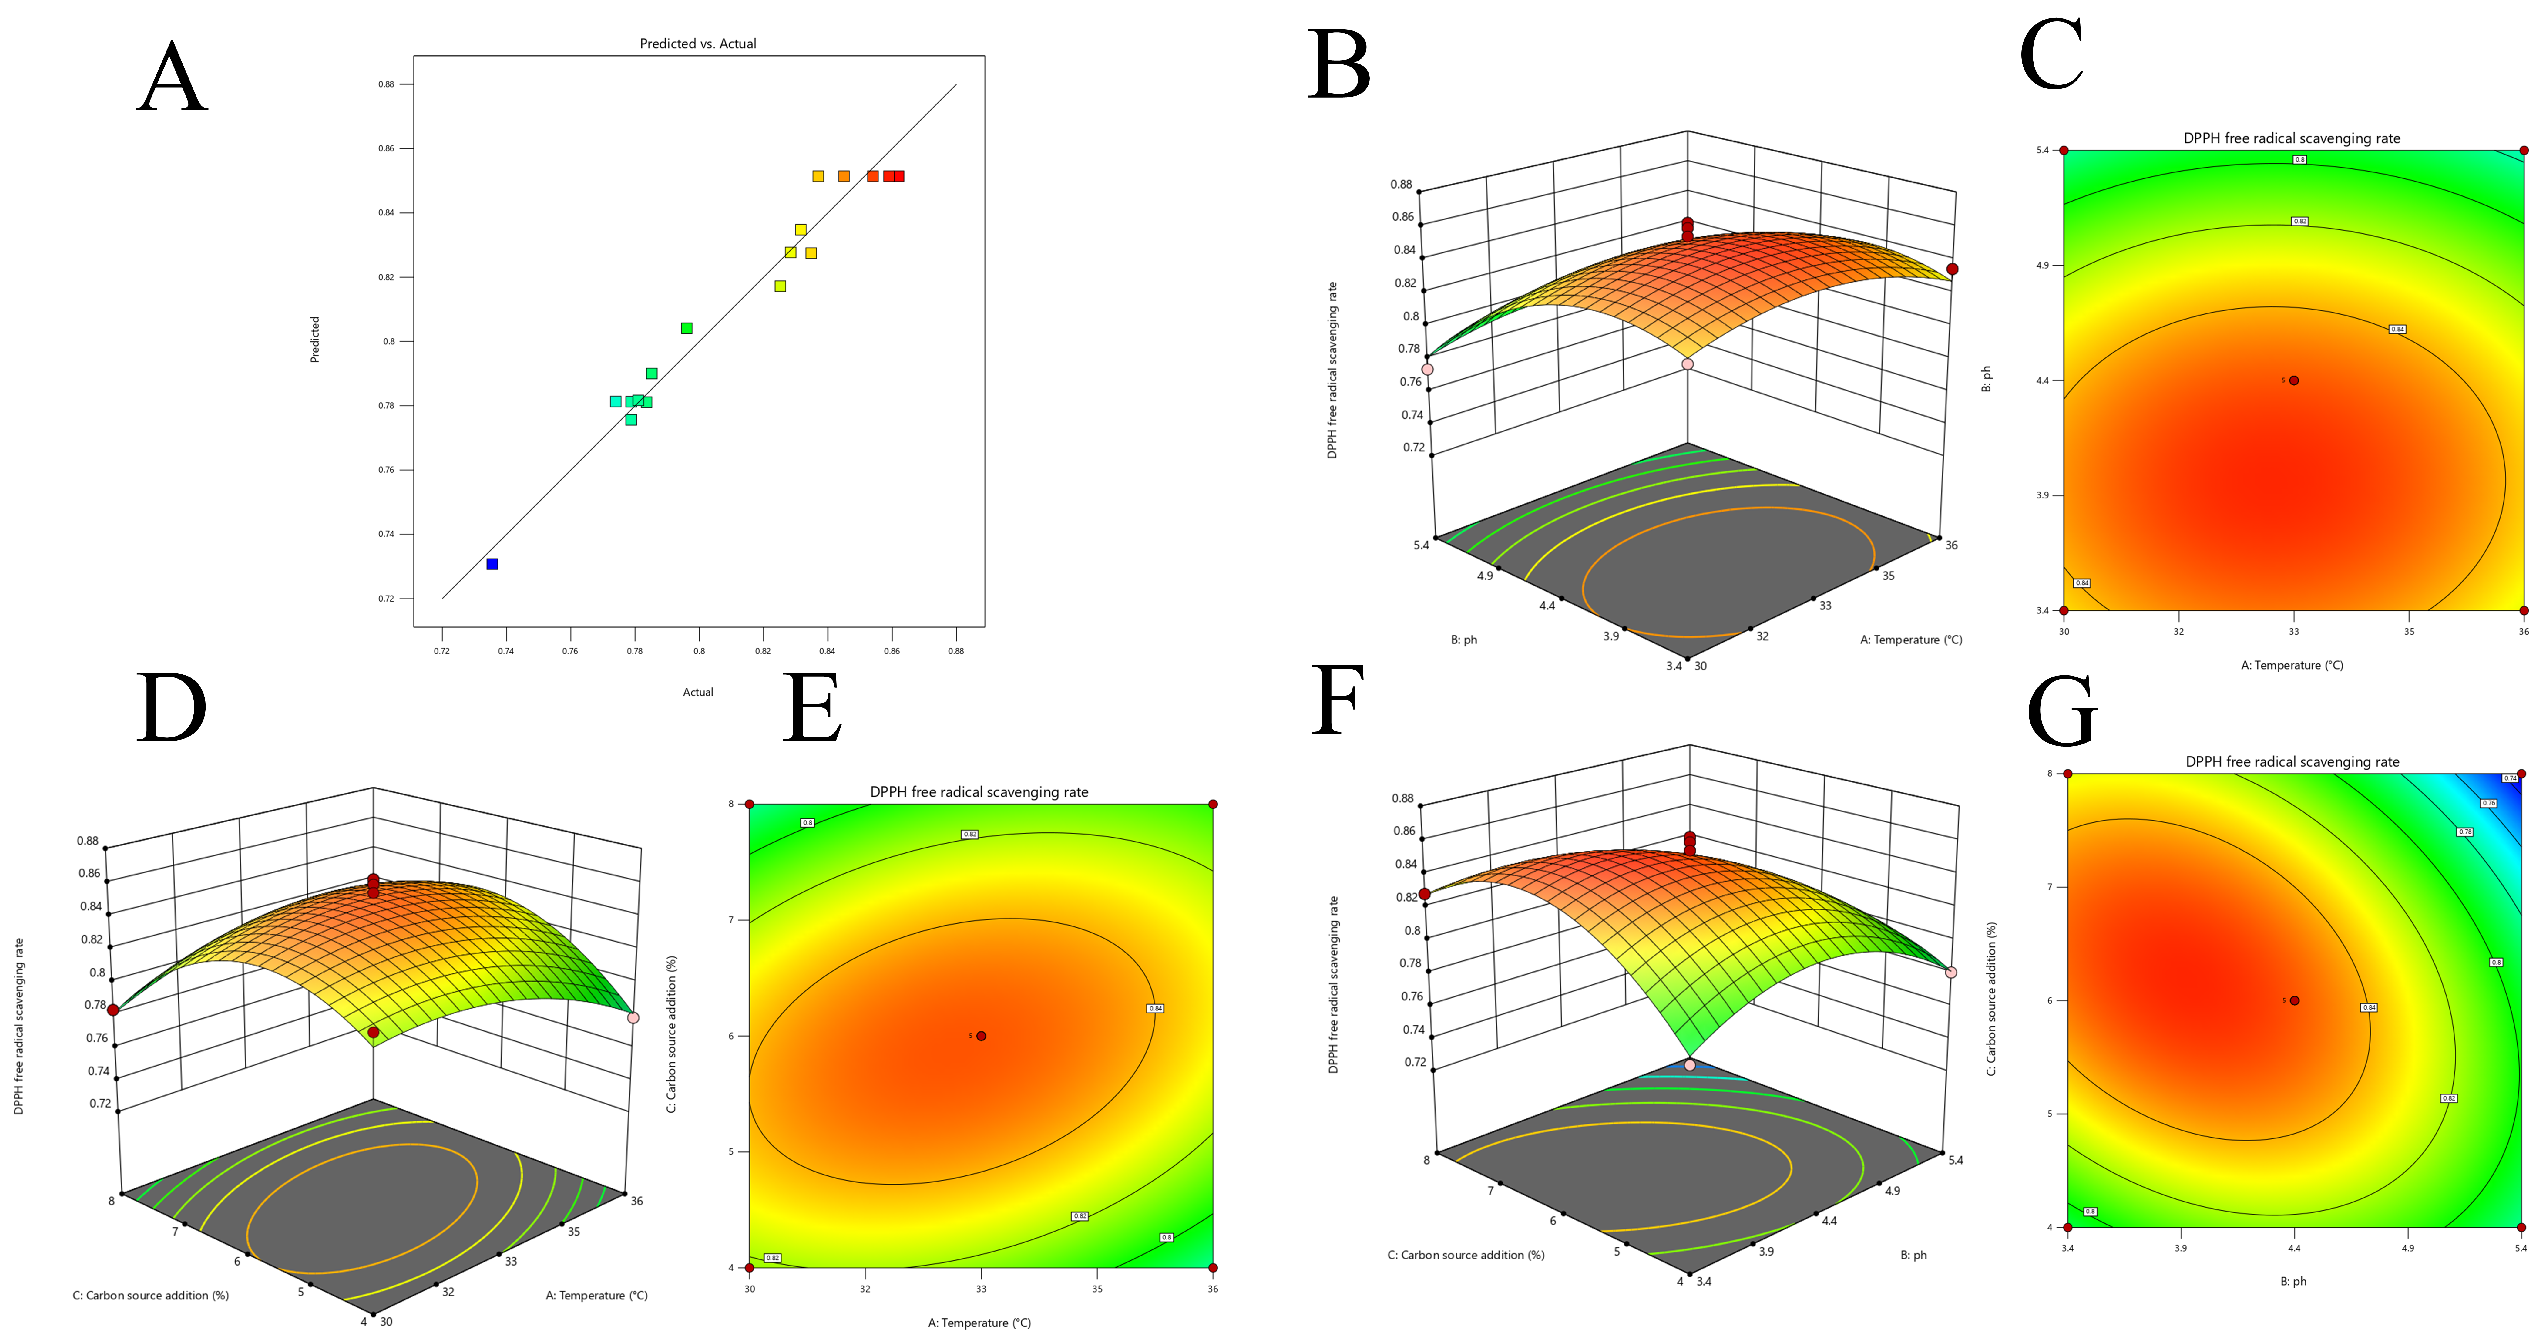
Figure 3.
Succession of bacterial and fungal communities during Dendrobium officinale flower fermentation. (A) PCoA of bacterial communities. (B) PCoA of fungal communities. (C) Genus-level bacterial community composition. (D) Genus-level fungal community composition. Samples are labeled according to fermentation time points from JS10 to JS60.
Figure 3.
Succession of bacterial and fungal communities during Dendrobium officinale flower fermentation. (A) PCoA of bacterial communities. (B) PCoA of fungal communities. (C) Genus-level bacterial community composition. (D) Genus-level fungal community composition. Samples are labeled according to fermentation time points from JS10 to JS60.
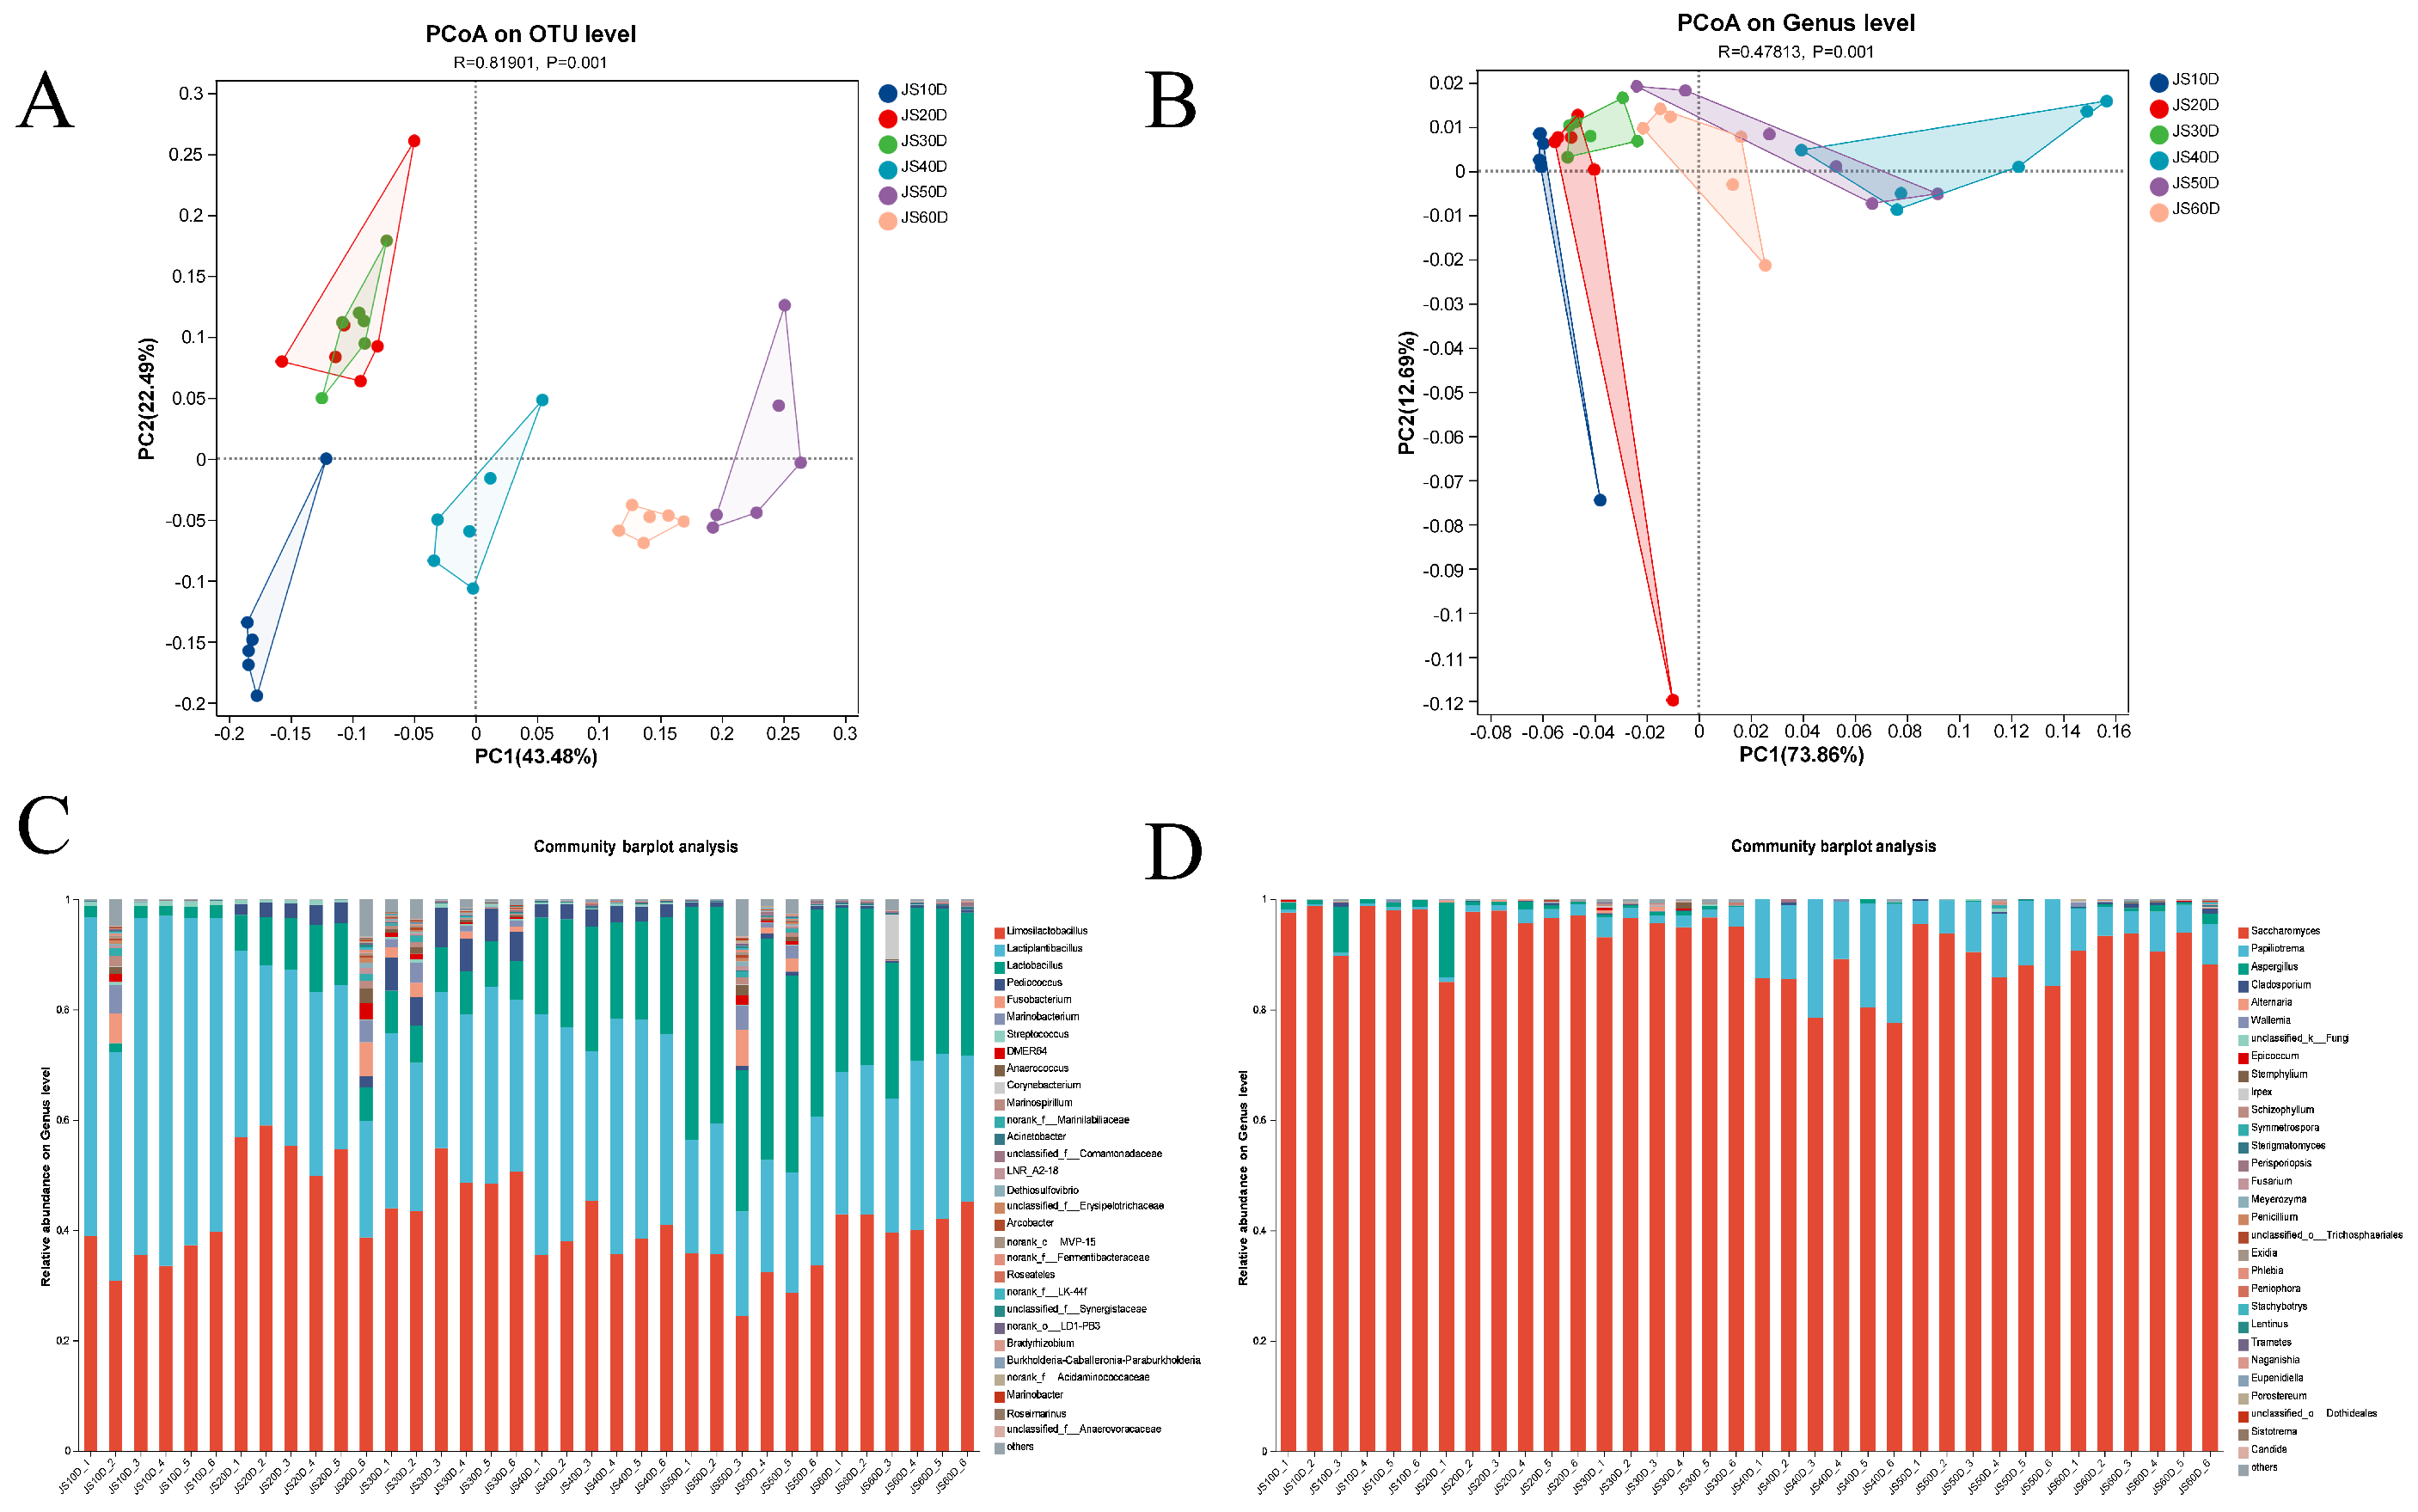
Figure 4.
Multivariate metabolomic analysis of fermented Dendrobium officinale flowers based on the combined ion-mode dataset. (A) PCA score plot. (B) PLS-DA score plot. The plots show time-dependent changes in metabolite profiles during fermentation.
Figure 4.
Multivariate metabolomic analysis of fermented Dendrobium officinale flowers based on the combined ion-mode dataset. (A) PCA score plot. (B) PLS-DA score plot. The plots show time-dependent changes in metabolite profiles during fermentation.
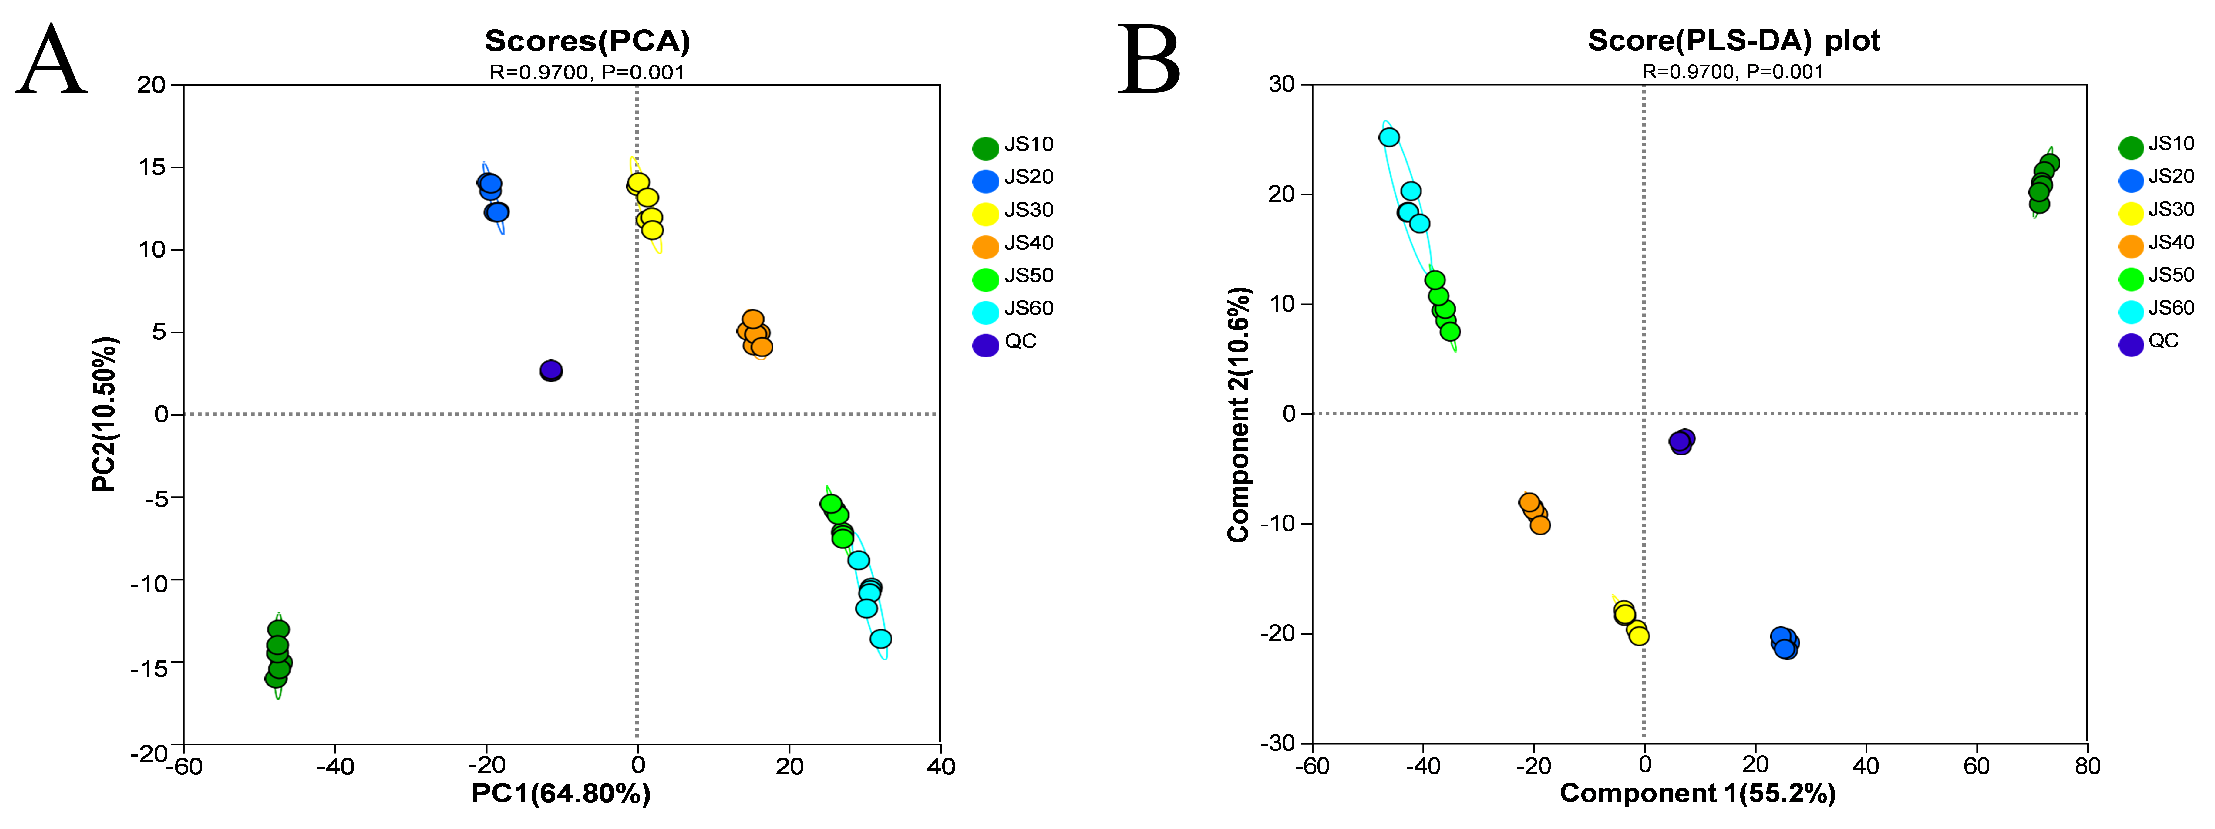
Figure 5.
Differential metabolites and KEGG pathway enrichment during fermentation. (A) Hierarchical clustering heatmap of differential metabolites. (B) Clustering of fermentation time points based on differential metabolite profiles. (C) KEGG enrichment analysis of differential metabolites.
Figure 5.
Differential metabolites and KEGG pathway enrichment during fermentation. (A) Hierarchical clustering heatmap of differential metabolites. (B) Clustering of fermentation time points based on differential metabolite profiles. (C) KEGG enrichment analysis of differential metabolites.
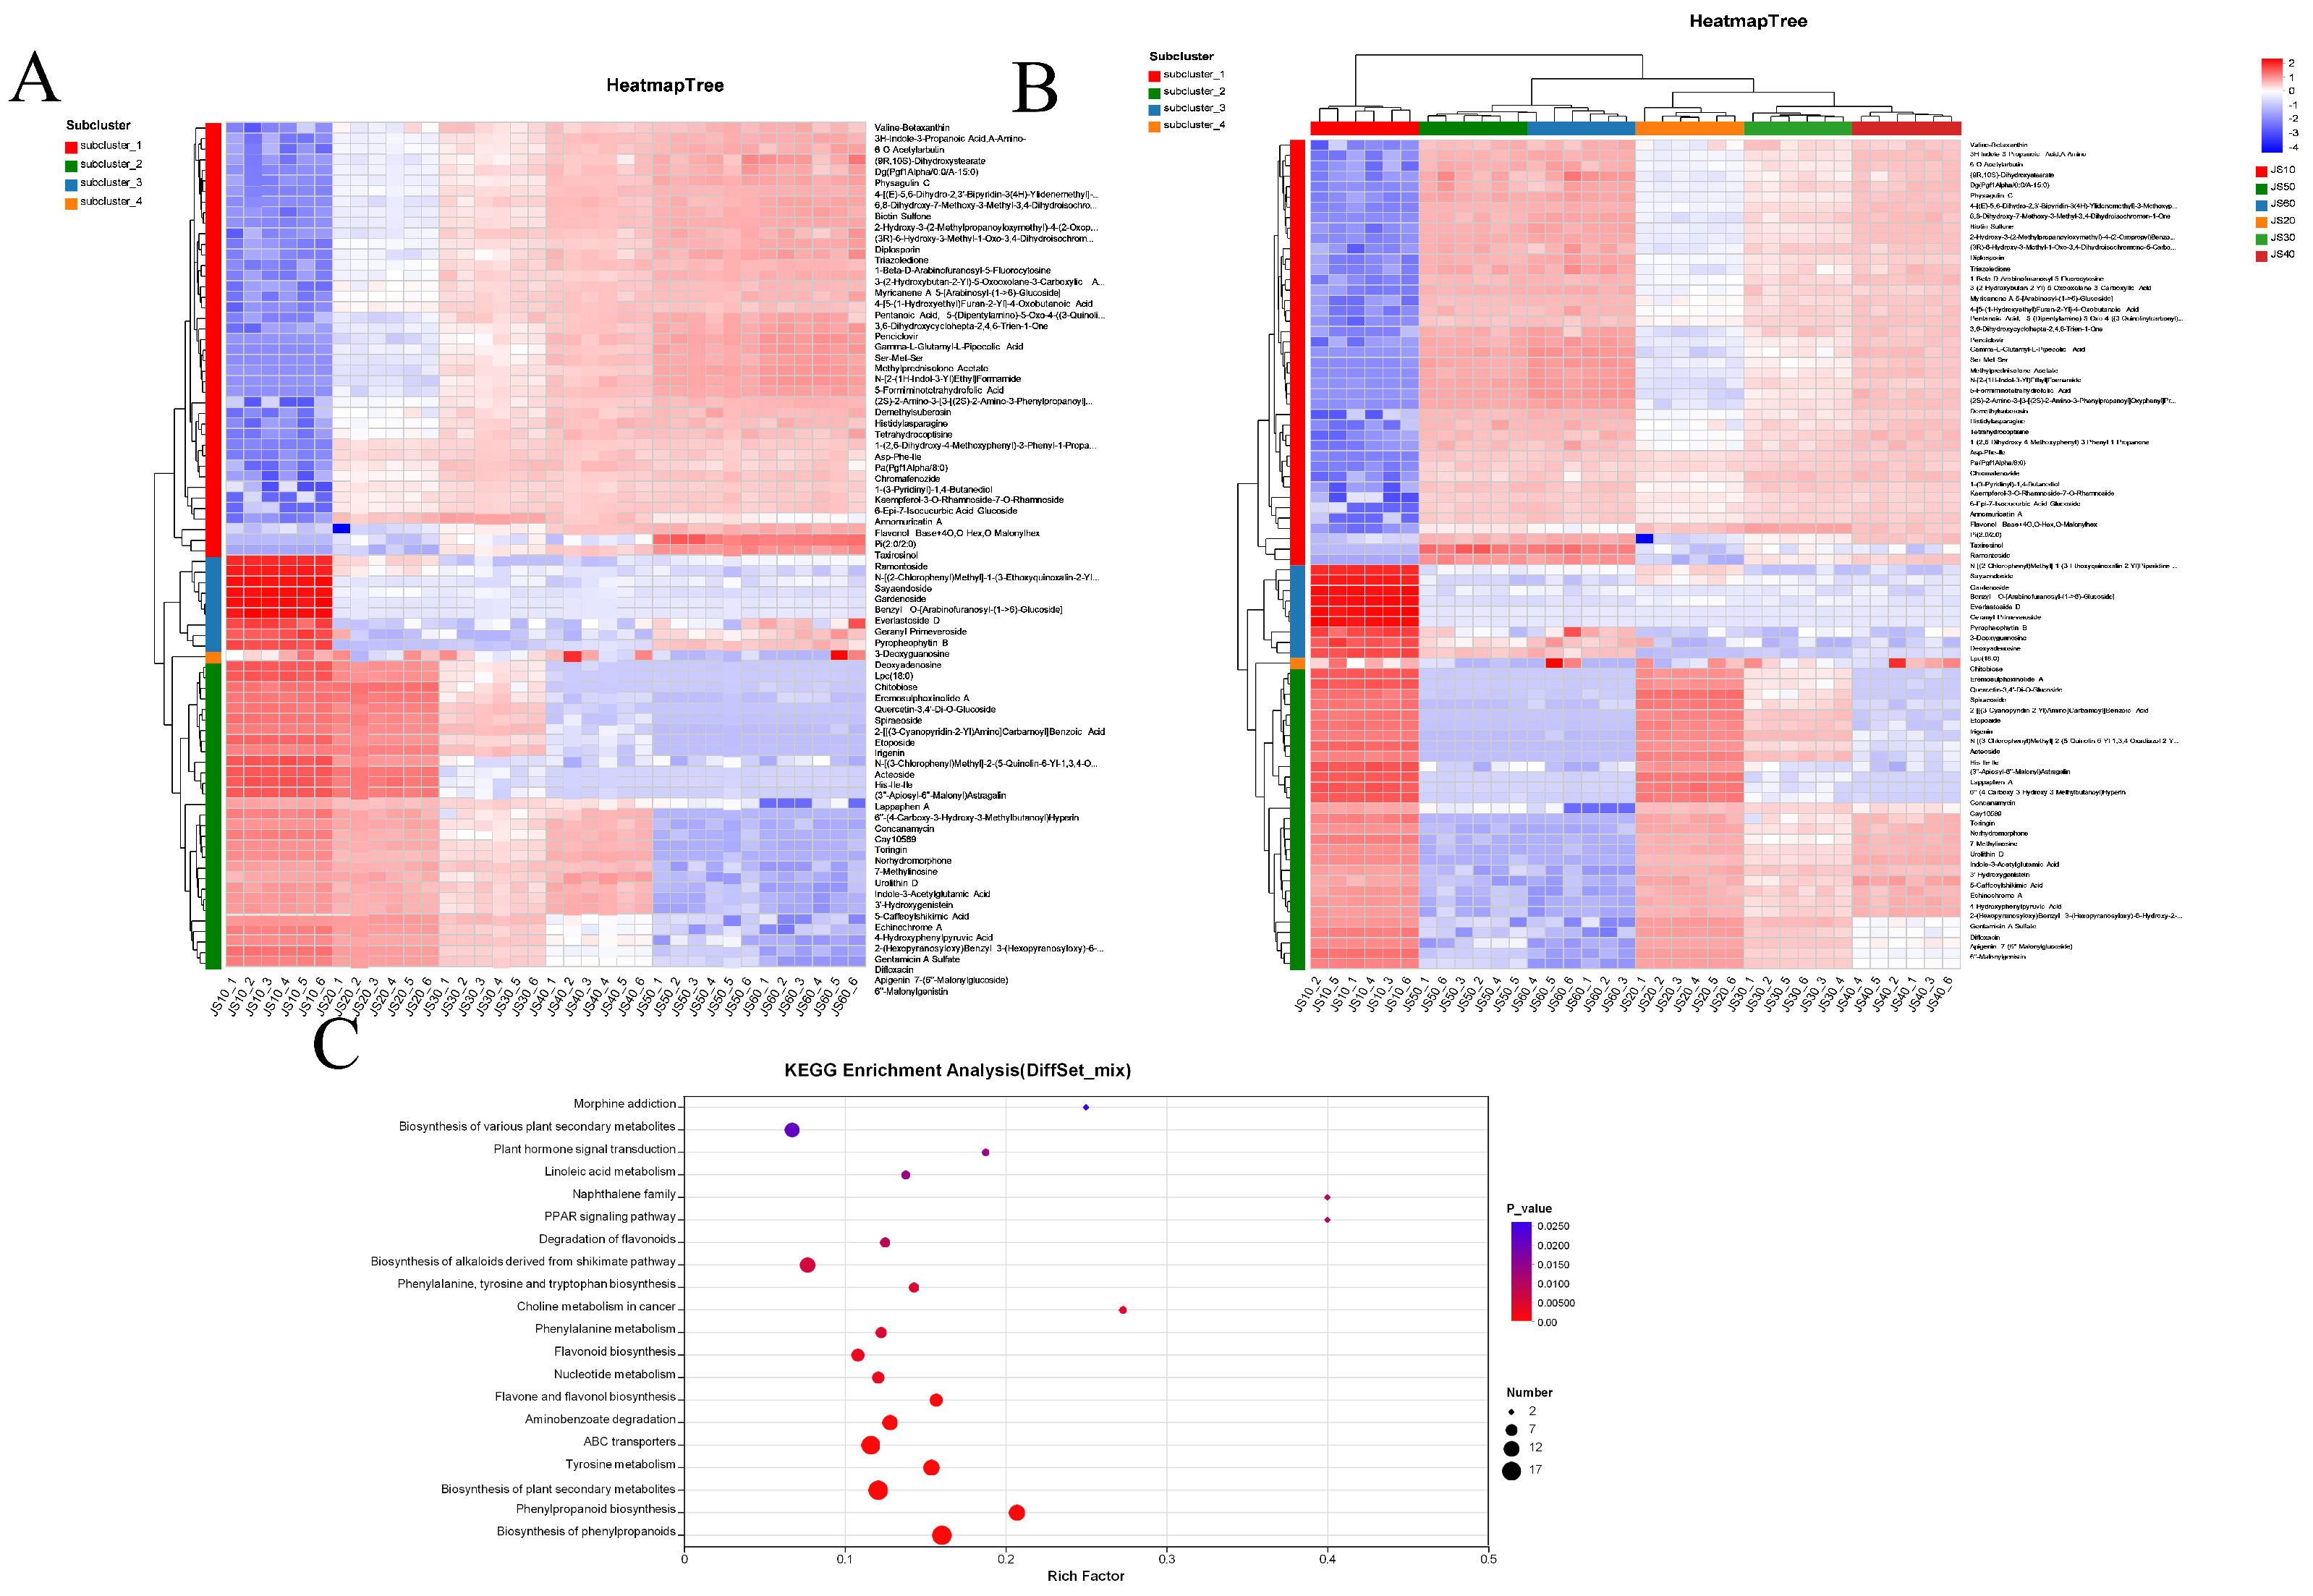
Figure 6.
Dynamic changes in bioactive components during Dendrobium officinale flower fermentation. (A) DPPH radical scavenging activity. (B) Total amino acid content. (C) Total polysaccharide content.
Figure 6.
Dynamic changes in bioactive components during Dendrobium officinale flower fermentation. (A) DPPH radical scavenging activity. (B) Total amino acid content. (C) Total polysaccharide content.
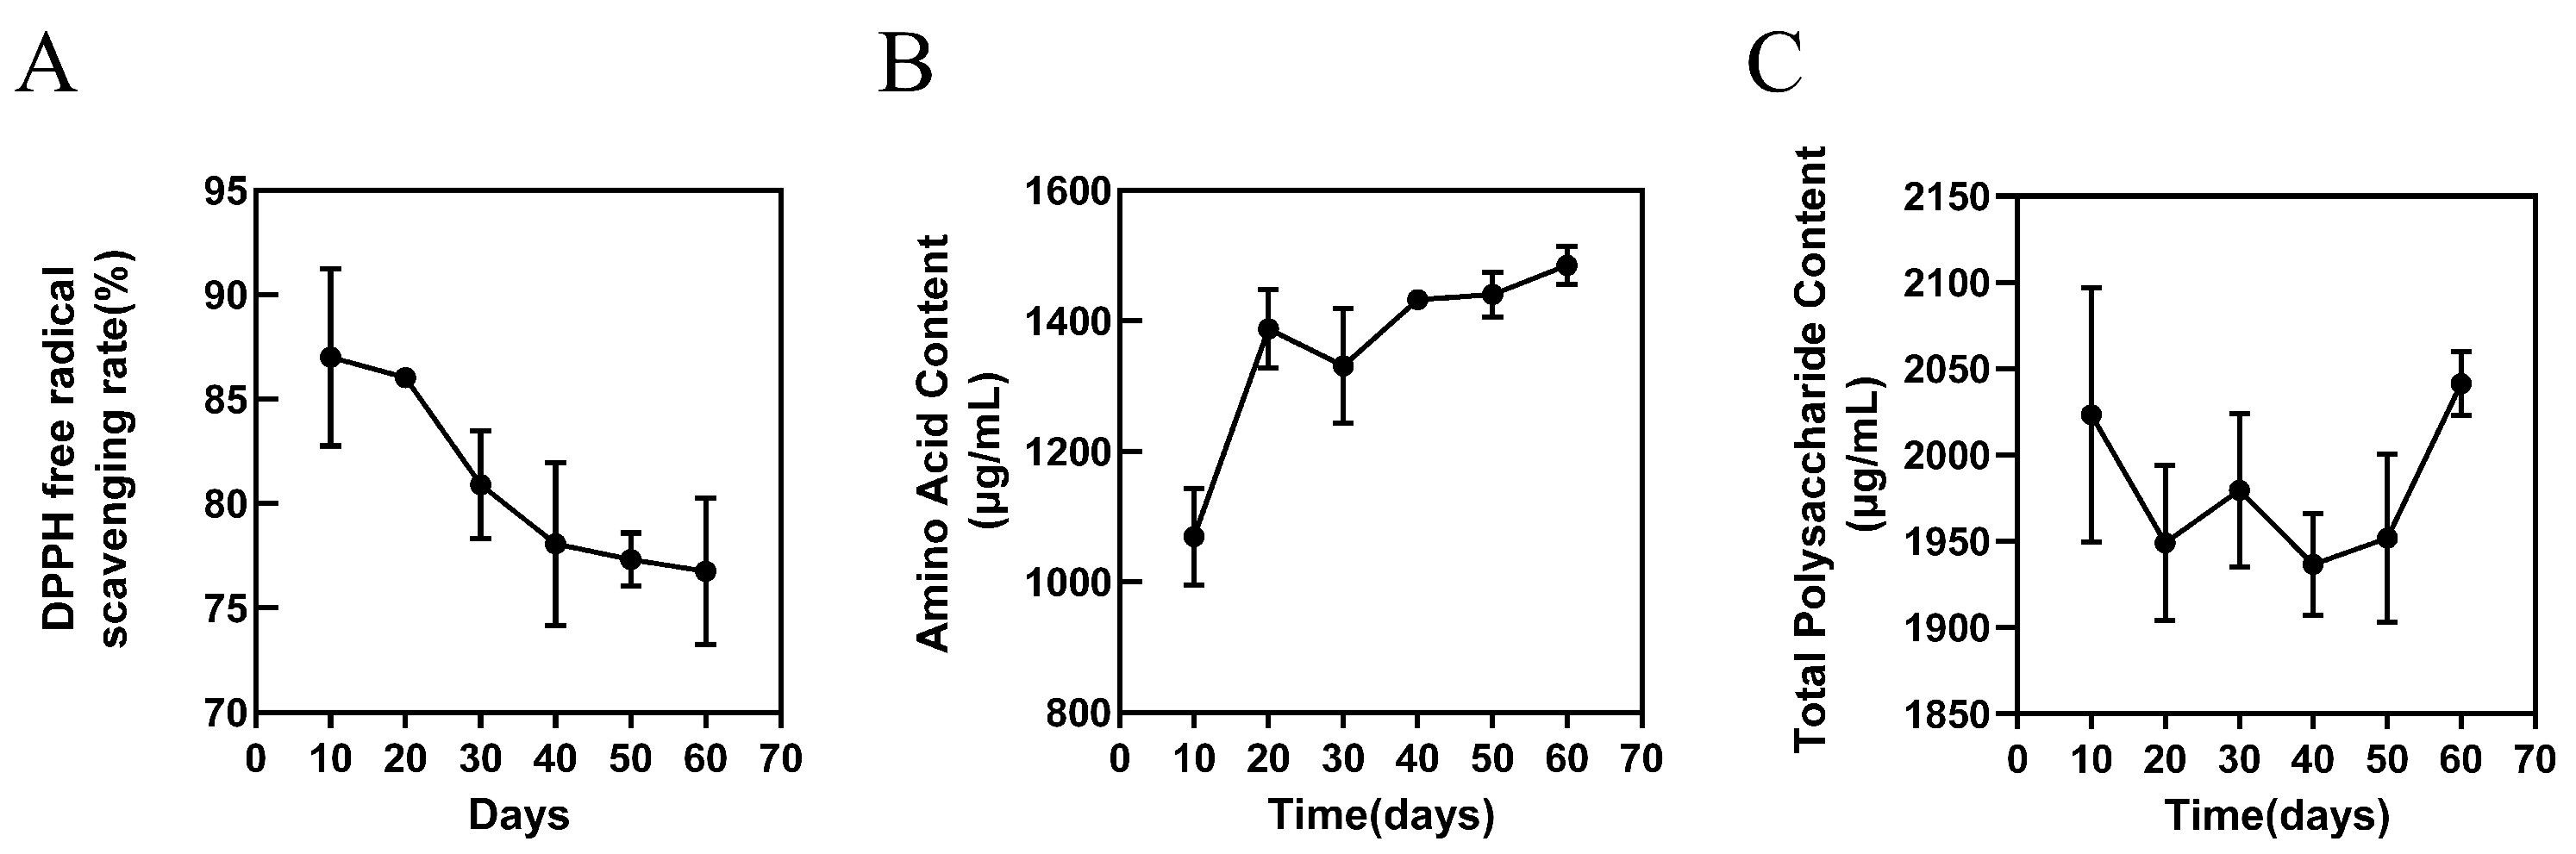
Figure 7.
Integrated analysis of microbiome and metabolome profiles during fermentation. (A) Procrustes analysis between bacterial community profiles and metabolomic profiles. (B) Procrustes analysis between fungal community profiles and metabolomic profiles. (C) Spearman correlation heatmap between dominant bacterial genera and differential metabolites. (D) Spearman correlation heatmap between dominant fungal genera and differential metabolites. Red and blue colors indicate positive and negative correlations, respectively. *, ; **, ; ***, .
Figure 7.
Integrated analysis of microbiome and metabolome profiles during fermentation. (A) Procrustes analysis between bacterial community profiles and metabolomic profiles. (B) Procrustes analysis between fungal community profiles and metabolomic profiles. (C) Spearman correlation heatmap between dominant bacterial genera and differential metabolites. (D) Spearman correlation heatmap between dominant fungal genera and differential metabolites. Red and blue colors indicate positive and negative correlations, respectively. *, ; **, ; ***, .
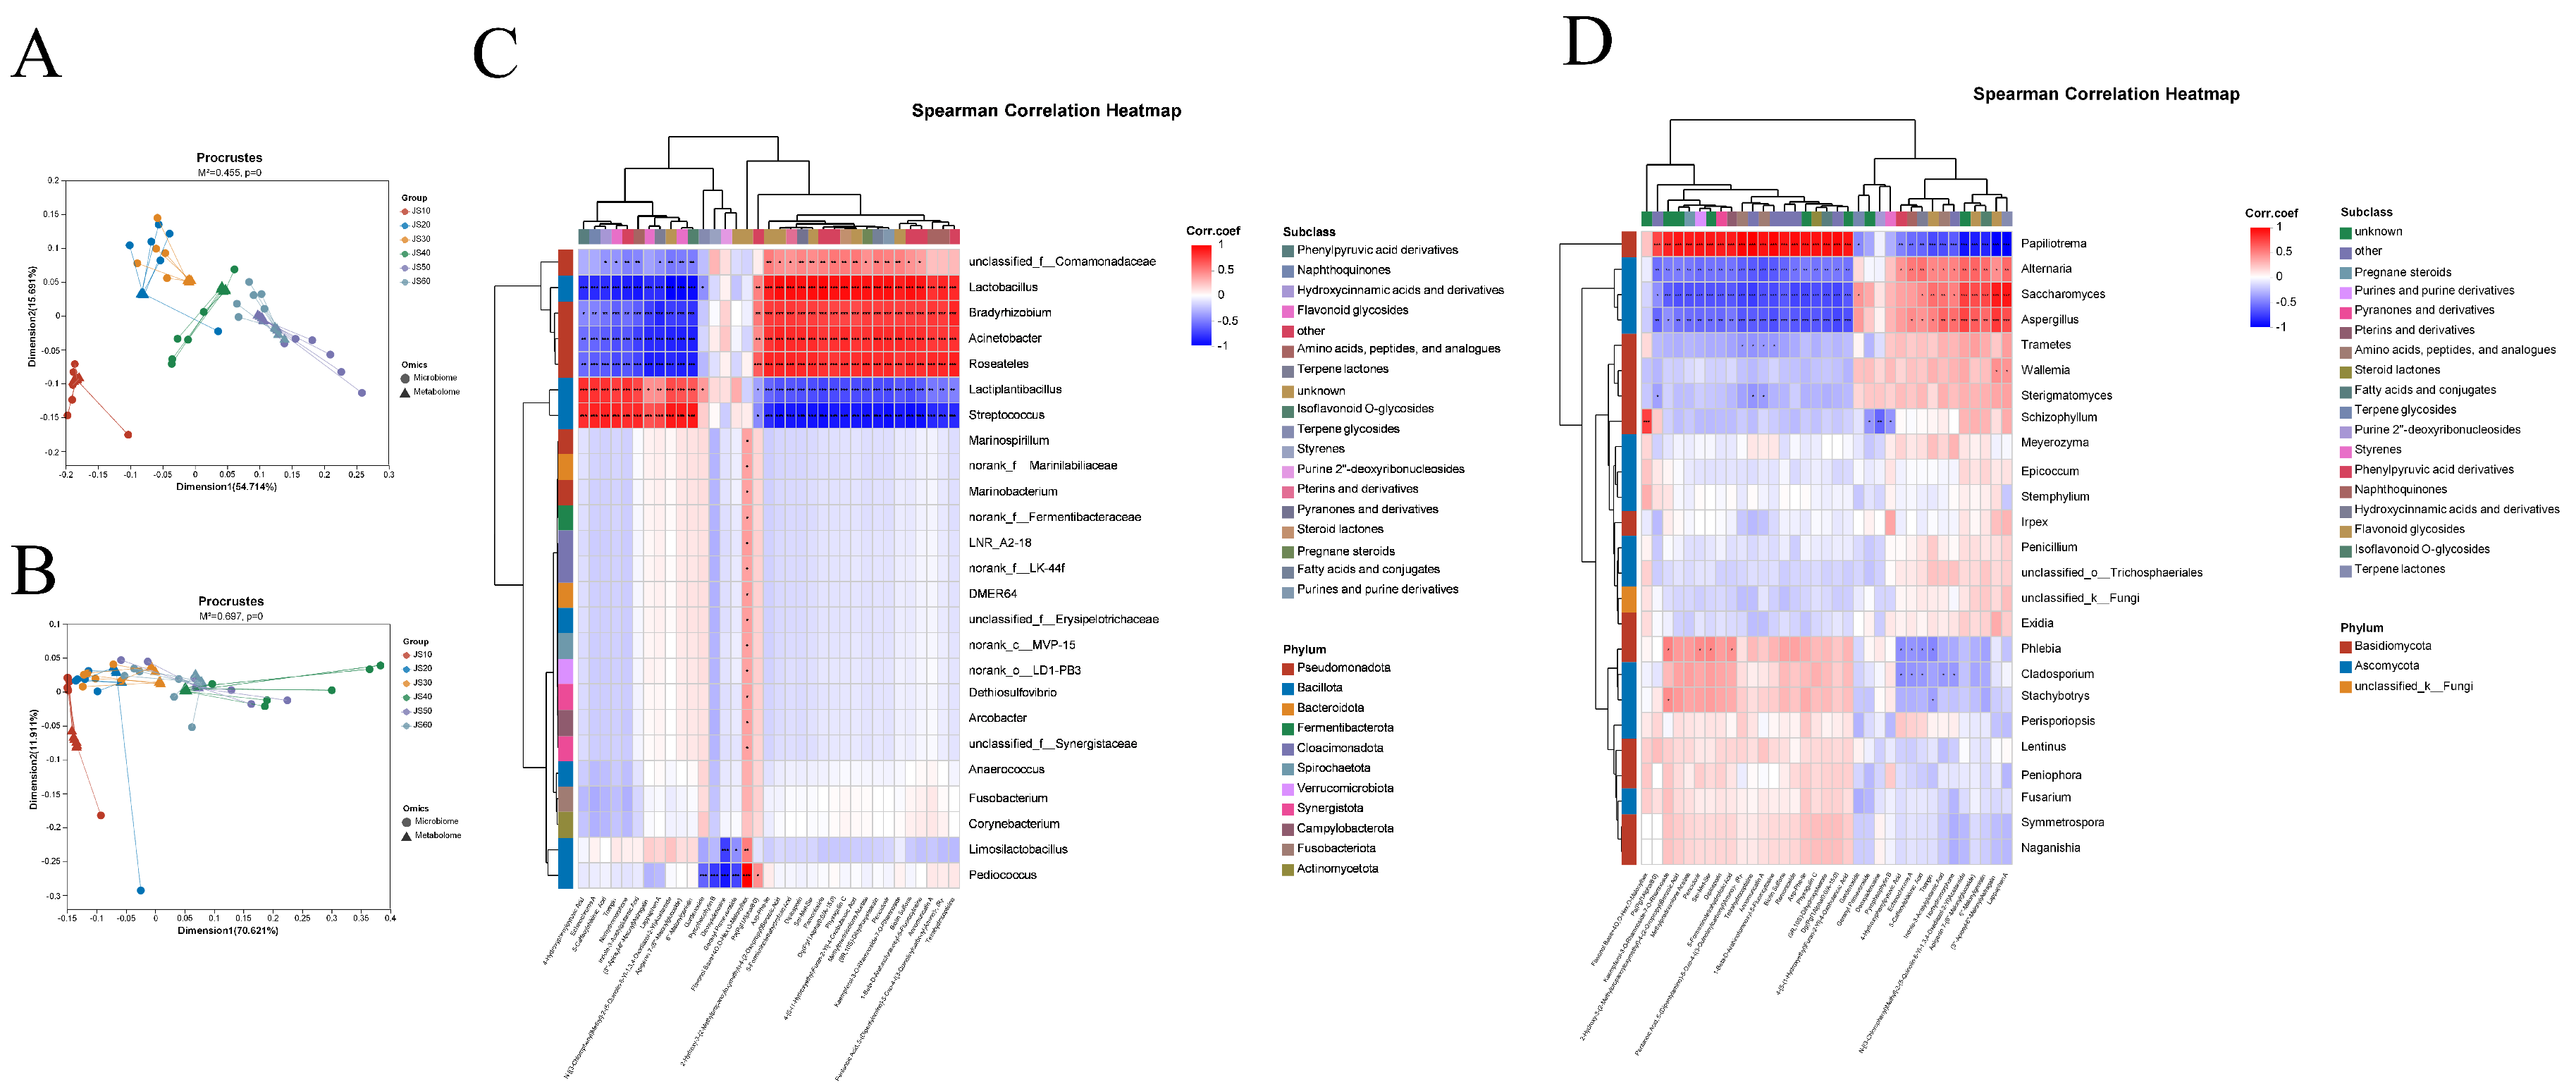
Figure 8.
Microbial associations with flavonoid- and phenylpropanoid-related metabolites during fermentation. (A) Spearman correlation heatmap between dominant bacterial genera and flavonoid- or phenylpropanoid-related metabolites. (B) Spearman correlation heatmap between dominant fungal genera and flavonoid- or phenylpropanoid-related metabolites. (C) Chord diagram showing significant associations between bacterial genera and flavonoid- or phenylpropanoid-related metabolites. (D) Chord diagram showing significant associations between fungal genera and flavonoid- or phenylpropanoid-related metabolites. (E) Temporal changes in representative flavonoid- and phenylpropanoid-related metabolites.
Figure 8.
Microbial associations with flavonoid- and phenylpropanoid-related metabolites during fermentation. (A) Spearman correlation heatmap between dominant bacterial genera and flavonoid- or phenylpropanoid-related metabolites. (B) Spearman correlation heatmap between dominant fungal genera and flavonoid- or phenylpropanoid-related metabolites. (C) Chord diagram showing significant associations between bacterial genera and flavonoid- or phenylpropanoid-related metabolites. (D) Chord diagram showing significant associations between fungal genera and flavonoid- or phenylpropanoid-related metabolites. (E) Temporal changes in representative flavonoid- and phenylpropanoid-related metabolites.
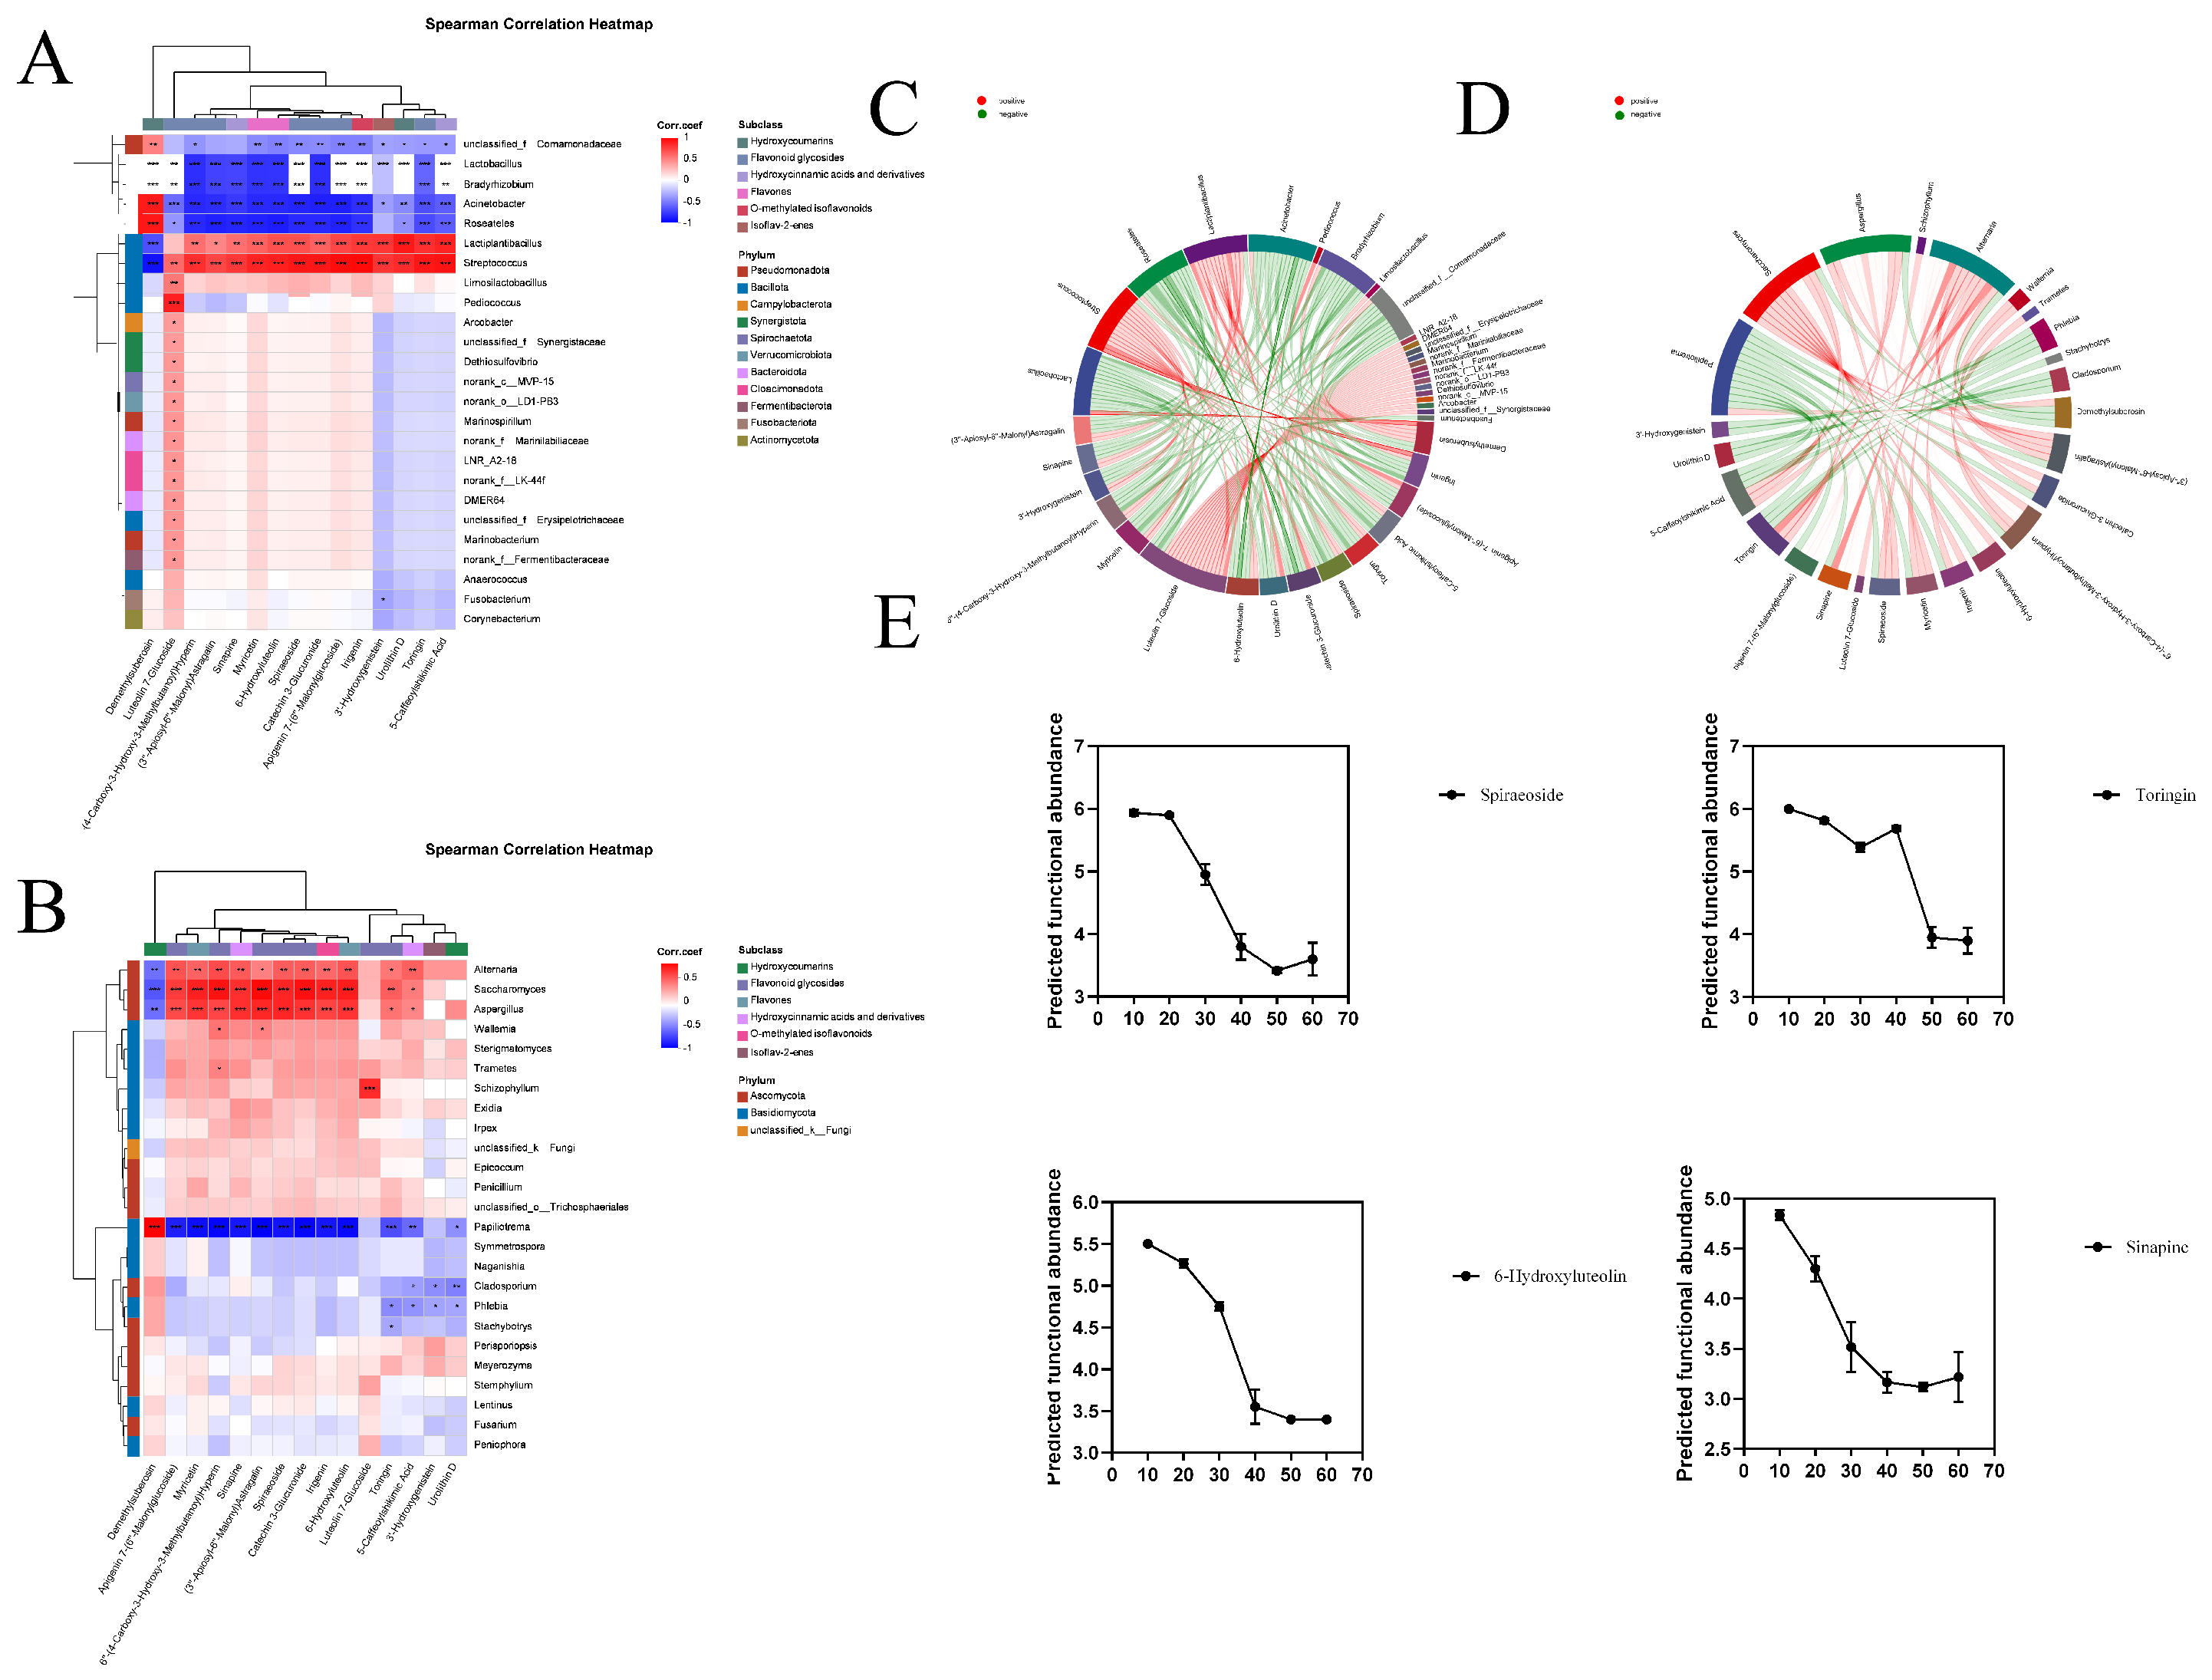
Figure 10.
Predicted functional potential of flavonoid-metabolizing enzymes during fermentation. (A) Predicted abundances of flavonoid glycoside hydrolase (FGH) and flavonoid oxidase (FO) throughout the fermentation process. (B) Functional intensity heatmap of the top associated microbial genera for the selected flavonoid-metabolizing enzyme groups.
Figure 10.
Predicted functional potential of flavonoid-metabolizing enzymes during fermentation. (A) Predicted abundances of flavonoid glycoside hydrolase (FGH) and flavonoid oxidase (FO) throughout the fermentation process. (B) Functional intensity heatmap of the top associated microbial genera for the selected flavonoid-metabolizing enzyme groups.
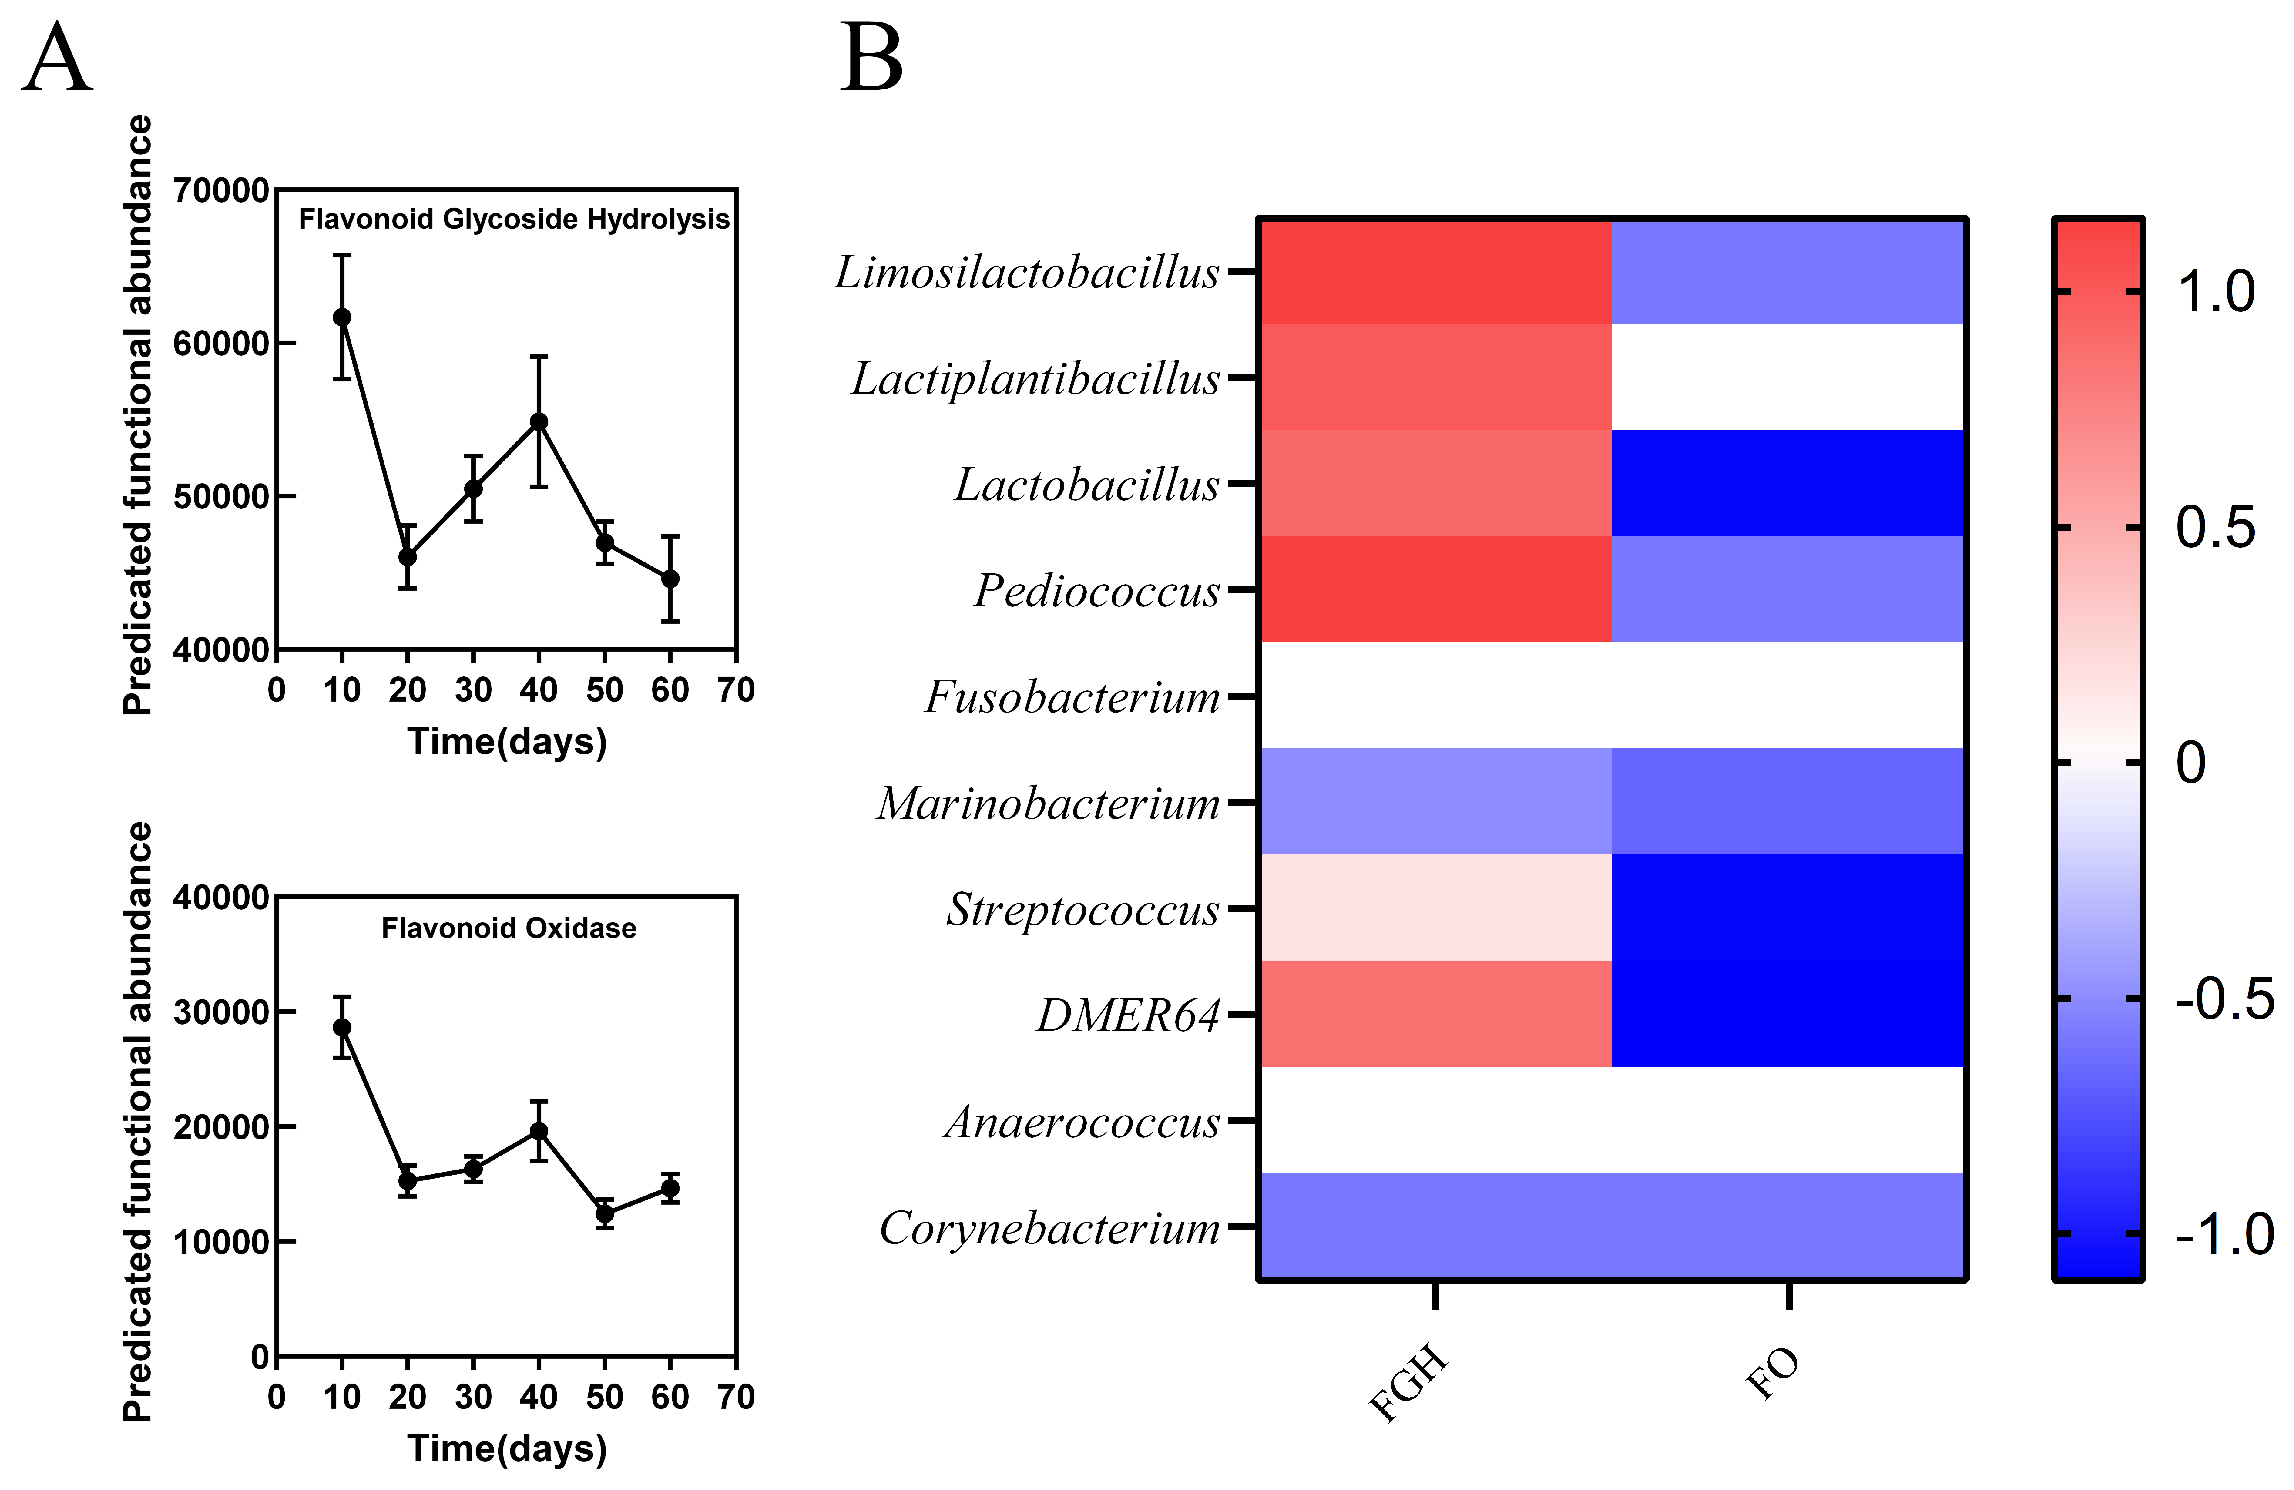
Figure 11.
Representative metabolite changes involved in phenylpropanoid and flavonoid metabolism during fermentation.
Figure 11.
Representative metabolite changes involved in phenylpropanoid and flavonoid metabolism during fermentation.
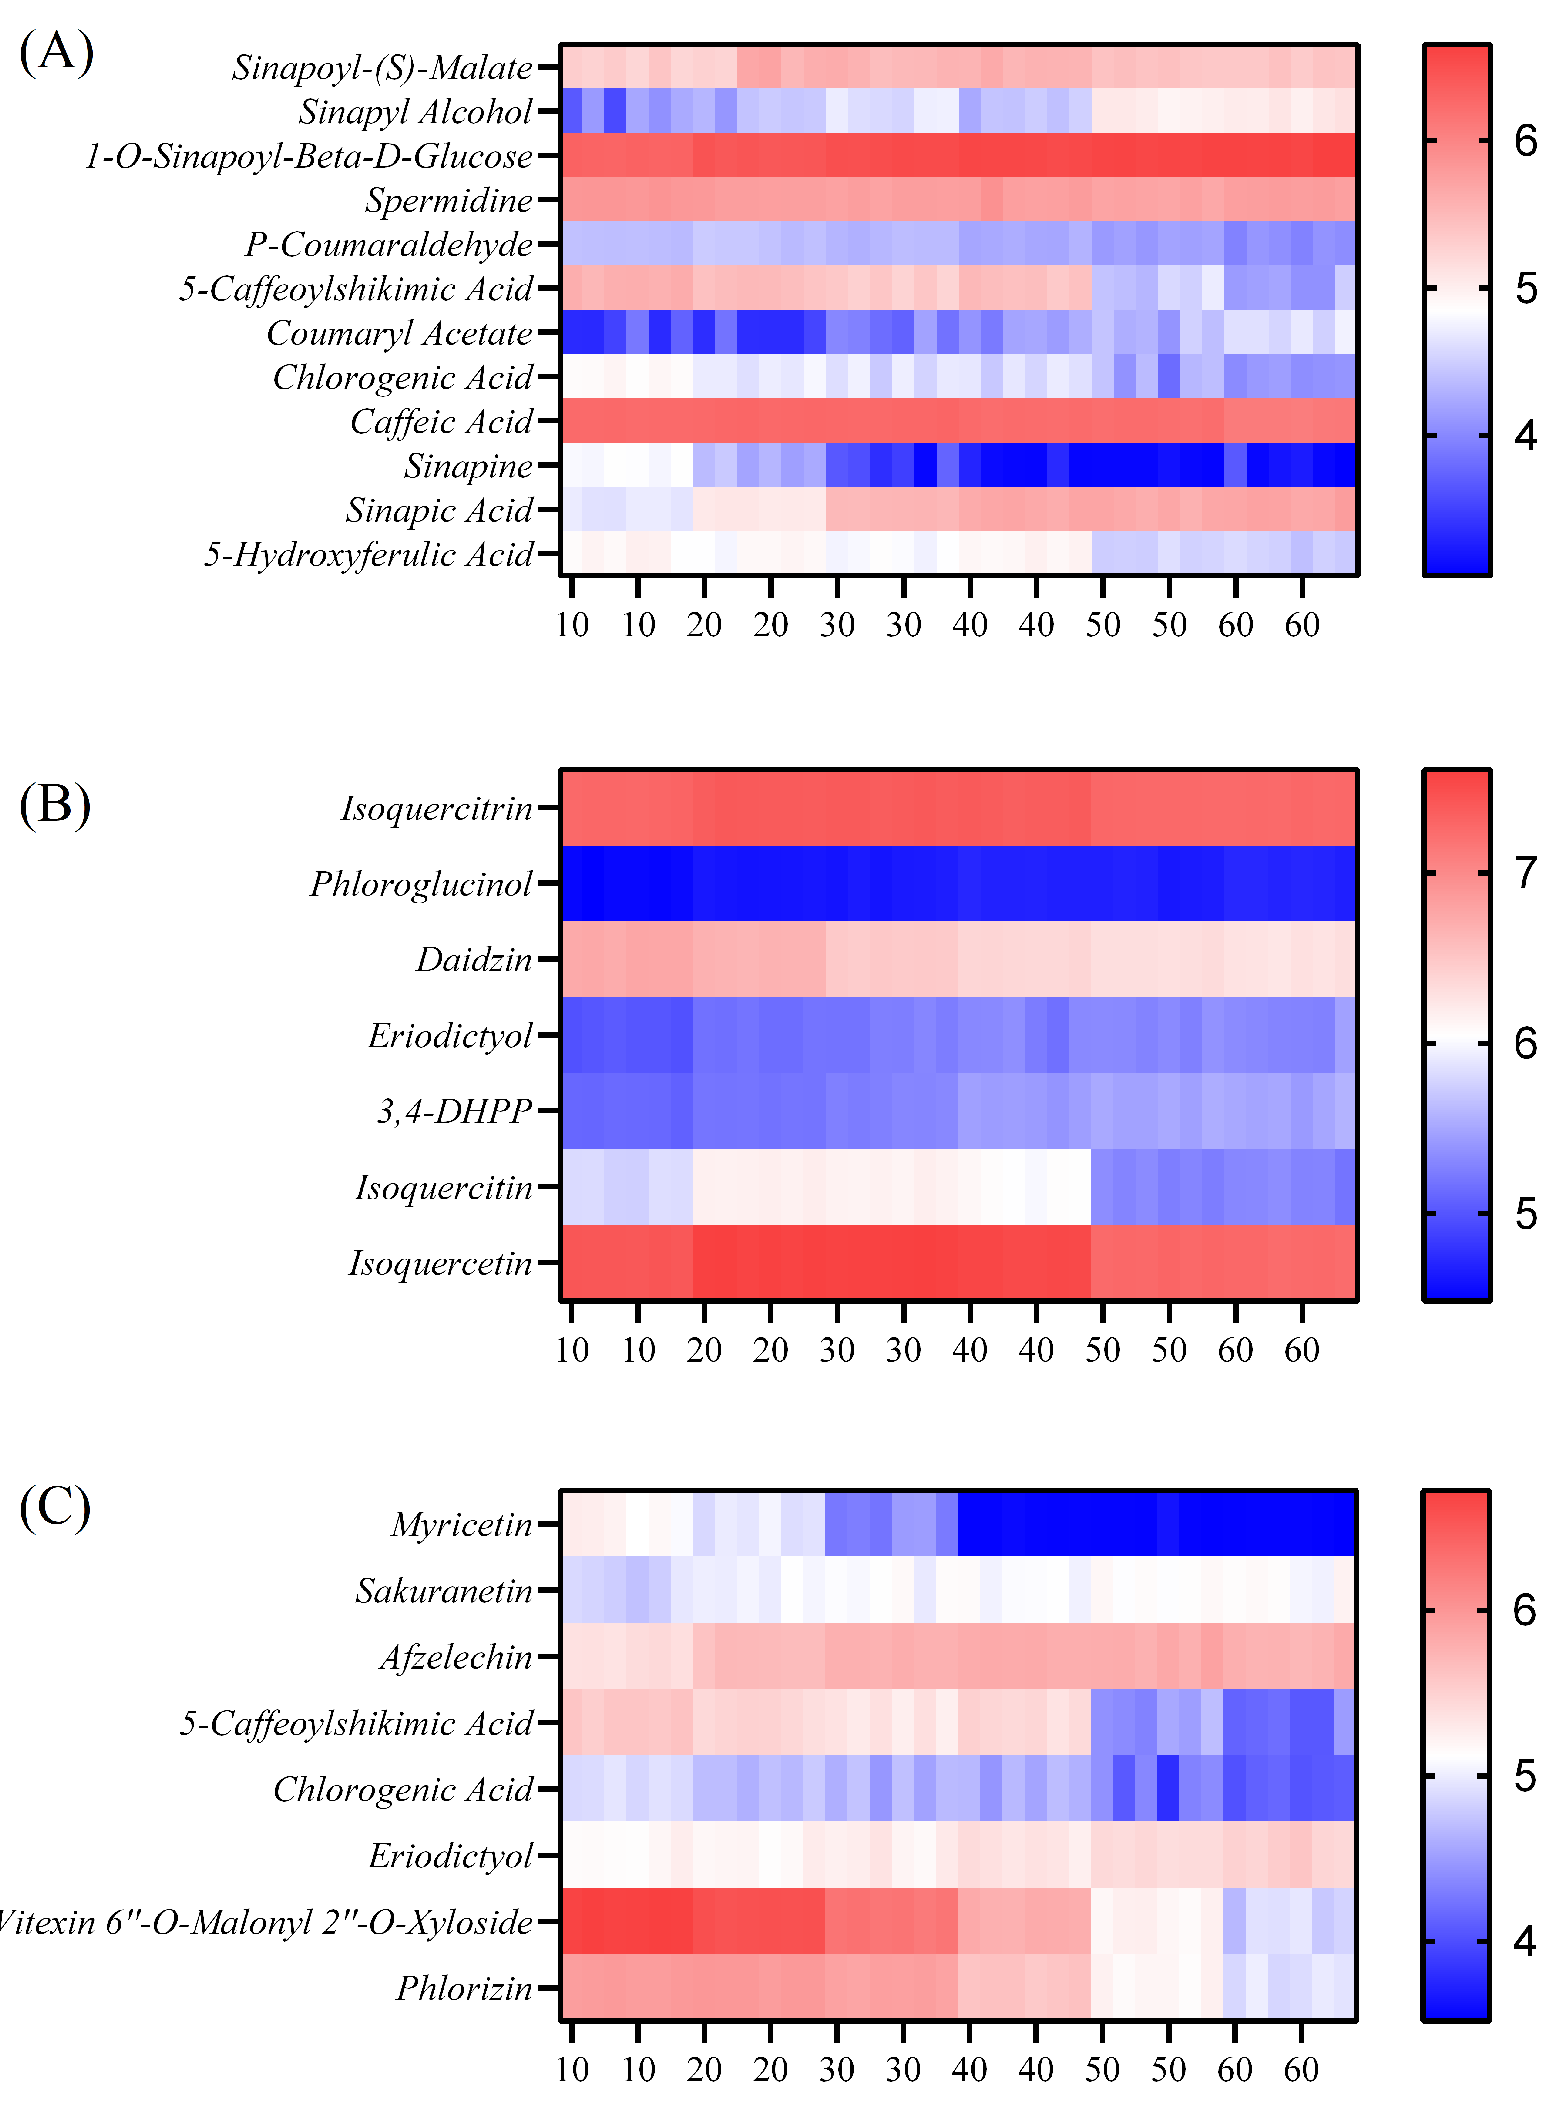

Table 1.
Results of the Box–Behnken response surface experiment.
| Std | A: Temperature (°C) | B: pH | C: Carbon source addition (%) | DPPH radical scavenging rate |
|---|---|---|---|---|
| 1 | 30 | 3.4 | 6 | 83.16 |
| 2 | 36 | 3.4 | 6 | 83.48 |
| 3 | 30 | 5.4 | 6 | 77.40 |
| 4 | 36 | 5.4 | 6 | 77.88 |
| 5 | 30 | 4.4 | 4 | 82.52 |
| 6 | 36 | 4.4 | 4 | 77.88 |
| 7 | 30 | 4.4 | 8 | 78.36 |
| 8 | 36 | 4.4 | 8 | 79.61 |
| 9 | 33 | 3.4 | 4 | 78.52 |
| 10 | 33 | 5.4 | 4 | 78.10 |
| 11 | 33 | 3.4 | 8 | 82.84 |
| 12 | 33 | 5.4 | 8 | 73.56 |
| 13 | 33 | 4.4 | 6 | 86.20 |
| 14 | 33 | 4.4 | 6 | 85.90 |
| 15 | 33 | 4.4 | 6 | 84.50 |
| 16 | 33 | 4.4 | 6 | 85.40 |
| 17 | 33 | 4.4 | 6 | 83.70 |
Table 2.
Analysis of variance and model fitting statistics for the quadratic regression model.
| Source | Sum of squares | df | Mean square | F-value | p-value |
|---|---|---|---|---|---|
| Model | 0.0210 | 9 | 0.0023 | 22.07 | 0.0002 |
| A (Temperature) | 0.0001 | 1 | 0.0001 | 0.7930 | 0.4028 |
| B (pH) | 0.0055 | 1 | 0.0055 | 52.43 | 0.0002 |
| C (Carbon source) | 0.0001 | 1 | 0.0001 | 0.8302 | 0.3925 |
| 6.400 | 1 | 6.400 | 0.0061 | 0.9402 | |
| 0.0009 | 1 | 0.0009 | 8.20 | 0.0242 | |
| 0.0020 | 1 | 0.0020 | 18.56 | 0.0035 | |
| 0.0012 | 1 | 0.0012 | 10.99 | 0.0129 | |
| 0.0038 | 1 | 0.0038 | 35.81 | 0.0006 | |
| 0.0064 | 1 | 0.0064 | 60.14 | 0.0001 | |
| Residual | 0.0007 | 7 | 0.0001 | ||
| Lack of Fit | 0.0003 | 3 | 0.0001 | 0.9876 | 0.4832 |
| Pure Error | 0.0004 | 4 | 0.0001 | ||
| Cor Total | 0.0217 | 16 | |||
| Statistic | Value | Statistic | Value | ||
| Std. Dev. | 0.0103 | 0.9660 | |||
| Mean | 0.8112 | Adjusted | 0.9222 | ||
| C.V.% | 1.27 | Predicted | 0.7377 | ||
| PRESS | 0.0057 | Adeq Precision | 15.2967 |
Note: * ; ** ; *** .
Disclaimer/Publisher’s Note: The statements, opinions and data contained in all publications are solely those of the individual author(s) and contributor(s) and not of MDPI and/or the editor(s). MDPI and/or the editor(s) disclaim responsibility for any injury to people or property resulting from any ideas, methods, instructions or products referred to in the content. |
© 2026 by the authors. Licensee MDPI, Basel, Switzerland. This article is an open access article distributed under the terms and conditions of the Creative Commons Attribution (CC BY) license (http://creativecommons.org/licenses/by/4.0/).
Copyright: This open access article is published under a Creative Commons CC BY 4.0 license, which permit the free download, distribution, and reuse, provided that the author and preprint are cited in any reuse.


