
Submitted:
21 July 2026
Posted:
21 July 2026
You are already at the latest version
Abstract
We examined whether the spectrum differs before and after the spatial addition of low-frequency sound to indoor background noise in a quiet, real room. Because the possible carriers for such an addition are unlimited, three stationary noises with known spectral shapes (white, pink, and brown) were used as test signals. Background noise and a 40-Hz tone were reproduced simultaneously in the same space, and recordings with and without the addition were compared with the microphone fixed in place. In the low band, the spectrum, low-band ACI, and autocorrelation showed predictable changes that scaled with the amount added. These followed almost trivially from linear superposition and normalization and did not depend on the added frequency. A spectral difference appeared at 40 Hz and its harmonics (80 and 120 Hz). A high-band difference (1–8 kHz) was also observed; it exceeded the high-band variability of recordings without addition and did not arise from numerical linear addition to the same waveform. The difference was reproduced in a different room using different equipment and independent recordings (white and pink) and varied according to the carrier (Table 1). This study reports these differences as experimental observations and does not address their generation mechanisms.
Keywords:
indoor acoustics
; background noise
; low-frequency sound
; soundscape indices
; autocorrelation
; spectral difference
1. Introduction
Indoor spaces always contain background noise that cannot readily be attributed to a specific source, such as heating, ventilation, and air conditioning (HVAC) equipment, human activity, and external ambient noise. Low-frequency sound is ubiquitous indoors, and HVAC equipment, in particular, often radiates low-frequency sound with a dominant component near 40 Hz. In room acoustics, low-frequency sound has mainly been studied as a target for suppression because room eigenmodes and standing waves produce booming and spatial unevenness in sound pressure [1,2,3,4,5]. Low-frequency sounds have been examined from the perspective of their effects on the human body [6].
Separately, we observed a phenomenon in which adding sub-audible low-frequency sound in a space changed the acoustic characteristics of the coexisting sound. In an earlier study on music [7], we reported that mixing a 40-Hz sine wave into music emphasized different frequency bands depending on the spectral shape of the music being mixed. The present study aims to describe this phenomenon using clear reference signals. A better understanding of how low-frequency sound interacts with coexisting indoor sound fields may contribute to the future design and control of indoor acoustic environments, including applications involving intentional low-frequency sound exposure.
As the sound to which the addition is made, whether music or speech, can be of unlimited variety, the effect cannot be exhaustively traced to arbitrary sounds. Therefore, we use three stationary noises whose power-spectral shapes are known and clearly defined (white, pink, and brown) and characterize, under controlled conditions, how the change in acoustic characteristics caused by the addition of low-frequency sound depends on the spectral shape of the background sound to which it is added. We used 40 Hz because HVAC and similar equipment frequently have components in this band, and it is therefore realistic. We do not claim any special property of a particular frequency. As shown below, the change observed in the low band did not depend on the added frequency.
This study is limited to describing the measured observation of whether a spectral difference arises before and after addition; it does not address the interpretation of the cause or mechanism or perceptual or evaluative judgments. For linear addition (numerically adding a 40-Hz component to the same waveform), it is evident that no difference arises in the high band; however, the present study compares the before/after states reproduced and recorded separately in space. Whether a difference arises is not self-evident and is a matter to be confirmed through measurements.
2. Materials and Methods
2.1. Generation of Background Noise and Low-Frequency Sound
As probes for the background noise, three stationary colored noises were used: white noise (flat power spectral density), pink noise (approximately −3 dB/oct), and brown noise (approximately −6 dB/oct). All were generated in Audacity (version 3.3.3), and for brown noise, the content below 20 Hz was not used. As low-frequency sound to be added, a 40-Hz sine wave was generated in Audacity.
2.2. Experimental Environment and Recording
The experiment was conducted in a living room with no special acoustic treatment (floor area about 10 tatami mats, ≈16 m2; a nearly square plan; ceiling height 2.4 m; gypsum-board walls and flooring; with ordinary furniture). The air conditioner was switched off to create a quiet environment with no stationary background sounds.
The background noise was played from the built-in loudspeaker of a MacBook Pro 14-inch (2021), and a 40-Hz sine wave was played from an active subwoofer (FOSTEX PM-SUBmini2); both were reproduced simultaneously in the same space and recorded as mixed within the space (the signals were not added numerically). The sound source was fixed at the center of the room, and the recording positions were as follows: the room center, near a wall (approximately 30 cm), and a corner (approximately 33 cm). For each condition, recordings without the addition and with the 40-Hz addition were made; for both, the microphone was not moved, and the same background noise was played.
Recordings were performed with a TASCAM DR-07X (44.1 kHz, 16-bit, stereo) fixed approximately 1.3 m above the floor, acquiring approximately 200 s of continuous recording per condition. The playback level of 40 Hz was identical across all conditions; the measured values (using the iPhone app Low Frequency Detector) were an equivalent continuous level (Leq) of 51.0 dB, with a low-frequency level of 40.4 dB, and a spectral peak at 40.0 Hz.
2.3. Experimental Design and Preprocessing
For three background noises × three measurement positions, two conditions—with and without 40-Hz addition—were recorded. To avoid the playback onset transient at the start of each recording (up to approximately 16 s depending on the carrier type), the first 20 s and last 10 s were excluded, and the 10 s immediately after the start, middle, and end of the stationary segment were extracted as pseudo-repetitions. These were segment repetitions from a single stationary recording and not repetitions of independent recordings. Subsequently, the two stereo channels were averaged.
2.4. Analysis
The acoustic characteristics before and after addition were compared using spectra, soundscape indices (NDSI and ACI), and autocorrelation, examining both the dependence on the amount added and the dependence on the added frequency (negative control). All the analyses were performed using Python (scipy.signal).
Spectrum. The difference in the power spectral densities before and after the addition (Welch method, window length of 8192 points, Hann window, and 50% overlap) was computed. The mean difference per octave band was used to evaluate which bands changed, and to what extent.
Soundscape indices. Soundscape indices have been used in acoustic ecology to evaluate biodiversity and landscapes [8]. To allow a comparison with the applied study under review [9], the same definitions were used. The NDSI [10] is based on the energy ratio between the anthropophony band (1–2 kHz) and the biophony band (2–8 kHz). The ACI [11] was computed from a short-time Fourier transform (window length of 1024 points) as the sum of absolute differences in intensity between adjacent time frames, normalized by total energy. Because its response changes with band limiting [12,13], it was computed for the full band, the low band (0–200 Hz), and the high band (1–8 kHz).
Reference for the high-band difference. As a reference for evaluating the high-band (1–8 kHz) differences, the standard deviation of the high-band spectral differences between segments within the same recording when nothing was added was computed. Two references were used: (i) the without-addition (noise-only) recording, and (ii) the room background alone (neither noise nor 40 Hz). Both are the differences between separate segments within the same recording.
The high-band difference of the signal obtained by numerically (linearly) adding 40 Hz to the same noise-only recording, relative to the original signal, was also computed. The presence or absence of a high-band difference was judged by the magnitude of the difference at each frequency and not by the octave-band average. This quantity is the before/after difference at each frequency normalized by the standard error determined from the inter-repetition variability under the same conditions; a value exceeding 1 indicates that the difference exceeds the inter-repetition variability (floor). This ratio was computed for each third-octave band. The per-frequency magnitude was used rather than the octave average because the average does not reflect the magnitude of the difference at each frequency within the band and can underrepresent high-band differences (Section 3.1).
Negative control. To determine whether the change in low-band ACI depended on the added frequency, stationary sine waves of equal amplitude at 40, 63, and 90 Hz were numerically superimposed on the background noise-only recording, and the low-band ACI was compared.
Autocorrelation and dependence on the amount added. The autocorrelation function of each segment was computed; the strength of oscillation (standard deviation) over time lags of 0.05–0.5 s was taken as the structure strength, and the dominant frequency was obtained [7]. The amount of the added low-frequency component (0–200 Hz) was varied numerically, and its dependence on the structure strength was examined.
2.5. Reproduction Experiment (Different Room, Different Equipment, Independent Takes)
To confirm that the high-band difference does not depend on segment repetition within a single recording or on particular equipment or room, additional recordings were made in a different room with different equipment. The room was a living room with a small floor area and poor low-frequency harmonic components. The background noise was played from a JBL 305P MkII, and the 40-Hz sine wave was played from an active subwoofer (Yamaha NS-SW050) (different from the MacBook built-in loudspeaker and the FOSTEX PM-SUBmini2 of Section 2.2). The recorder was the same TASCAM DR-07X as in Section 2.2. For each carrier—white, pink, and brown—recordings without addition and with 40-Hz addition were made independently multiple times (three takes each). These were repetitions of independent recordings, not segmented repetitions from a single recording. The compared conditions were recorded at matched high-band (1–8 kHz) levels. The 40-Hz playback level in this room, measured with the same iPhone app (Low Frequency Detector), was an equivalent continuous level (Leq) of 58.9 dB, with a low-frequency level of 35.0 dB, and a spectral peak at 40.0 Hz. The analysis was identical to that in Section 2.4; the before/after difference at each frequency was normalized by the standard error determined from the take-to-take variability under the same condition (dispersion-based), and the ratio to the floor (take-to-take variability = 1) was evaluated per one-third-octave band.
3. Results
3.1. Spectral Change Due to Addition
With the addition of 40 Hz, the spectrum clearly changed in the low band (Figure 1 and Table 1). The difference peaked at 40 Hz and increased at integer multiples (80 and 120 Hz). Because a pure 40-Hz sine wave contains no harmonics, these integer-multiple components are harmonic distortions due to the nonlinearity of the reproduction system or of the room/air and are not components of the added signal itself (see Section 4).
A difference before and after addition was also observed in the high band (1–8 kHz) (std. approximately 1.8–3.6 dB). This difference exceeded the high-band variability between segments within the same recording when nothing was added—std. approximately 0.9–1.2 dB for without-addition (noise-only) and approximately 0.6–0.9 dB for room background alone—and did not arise from numerical linear addition to the same waveform. This study reports this difference as an experimental observation. To the best of our knowledge, no previous studies have reported a difference of this kind. However, the generation mechanism was not addressed in this study.
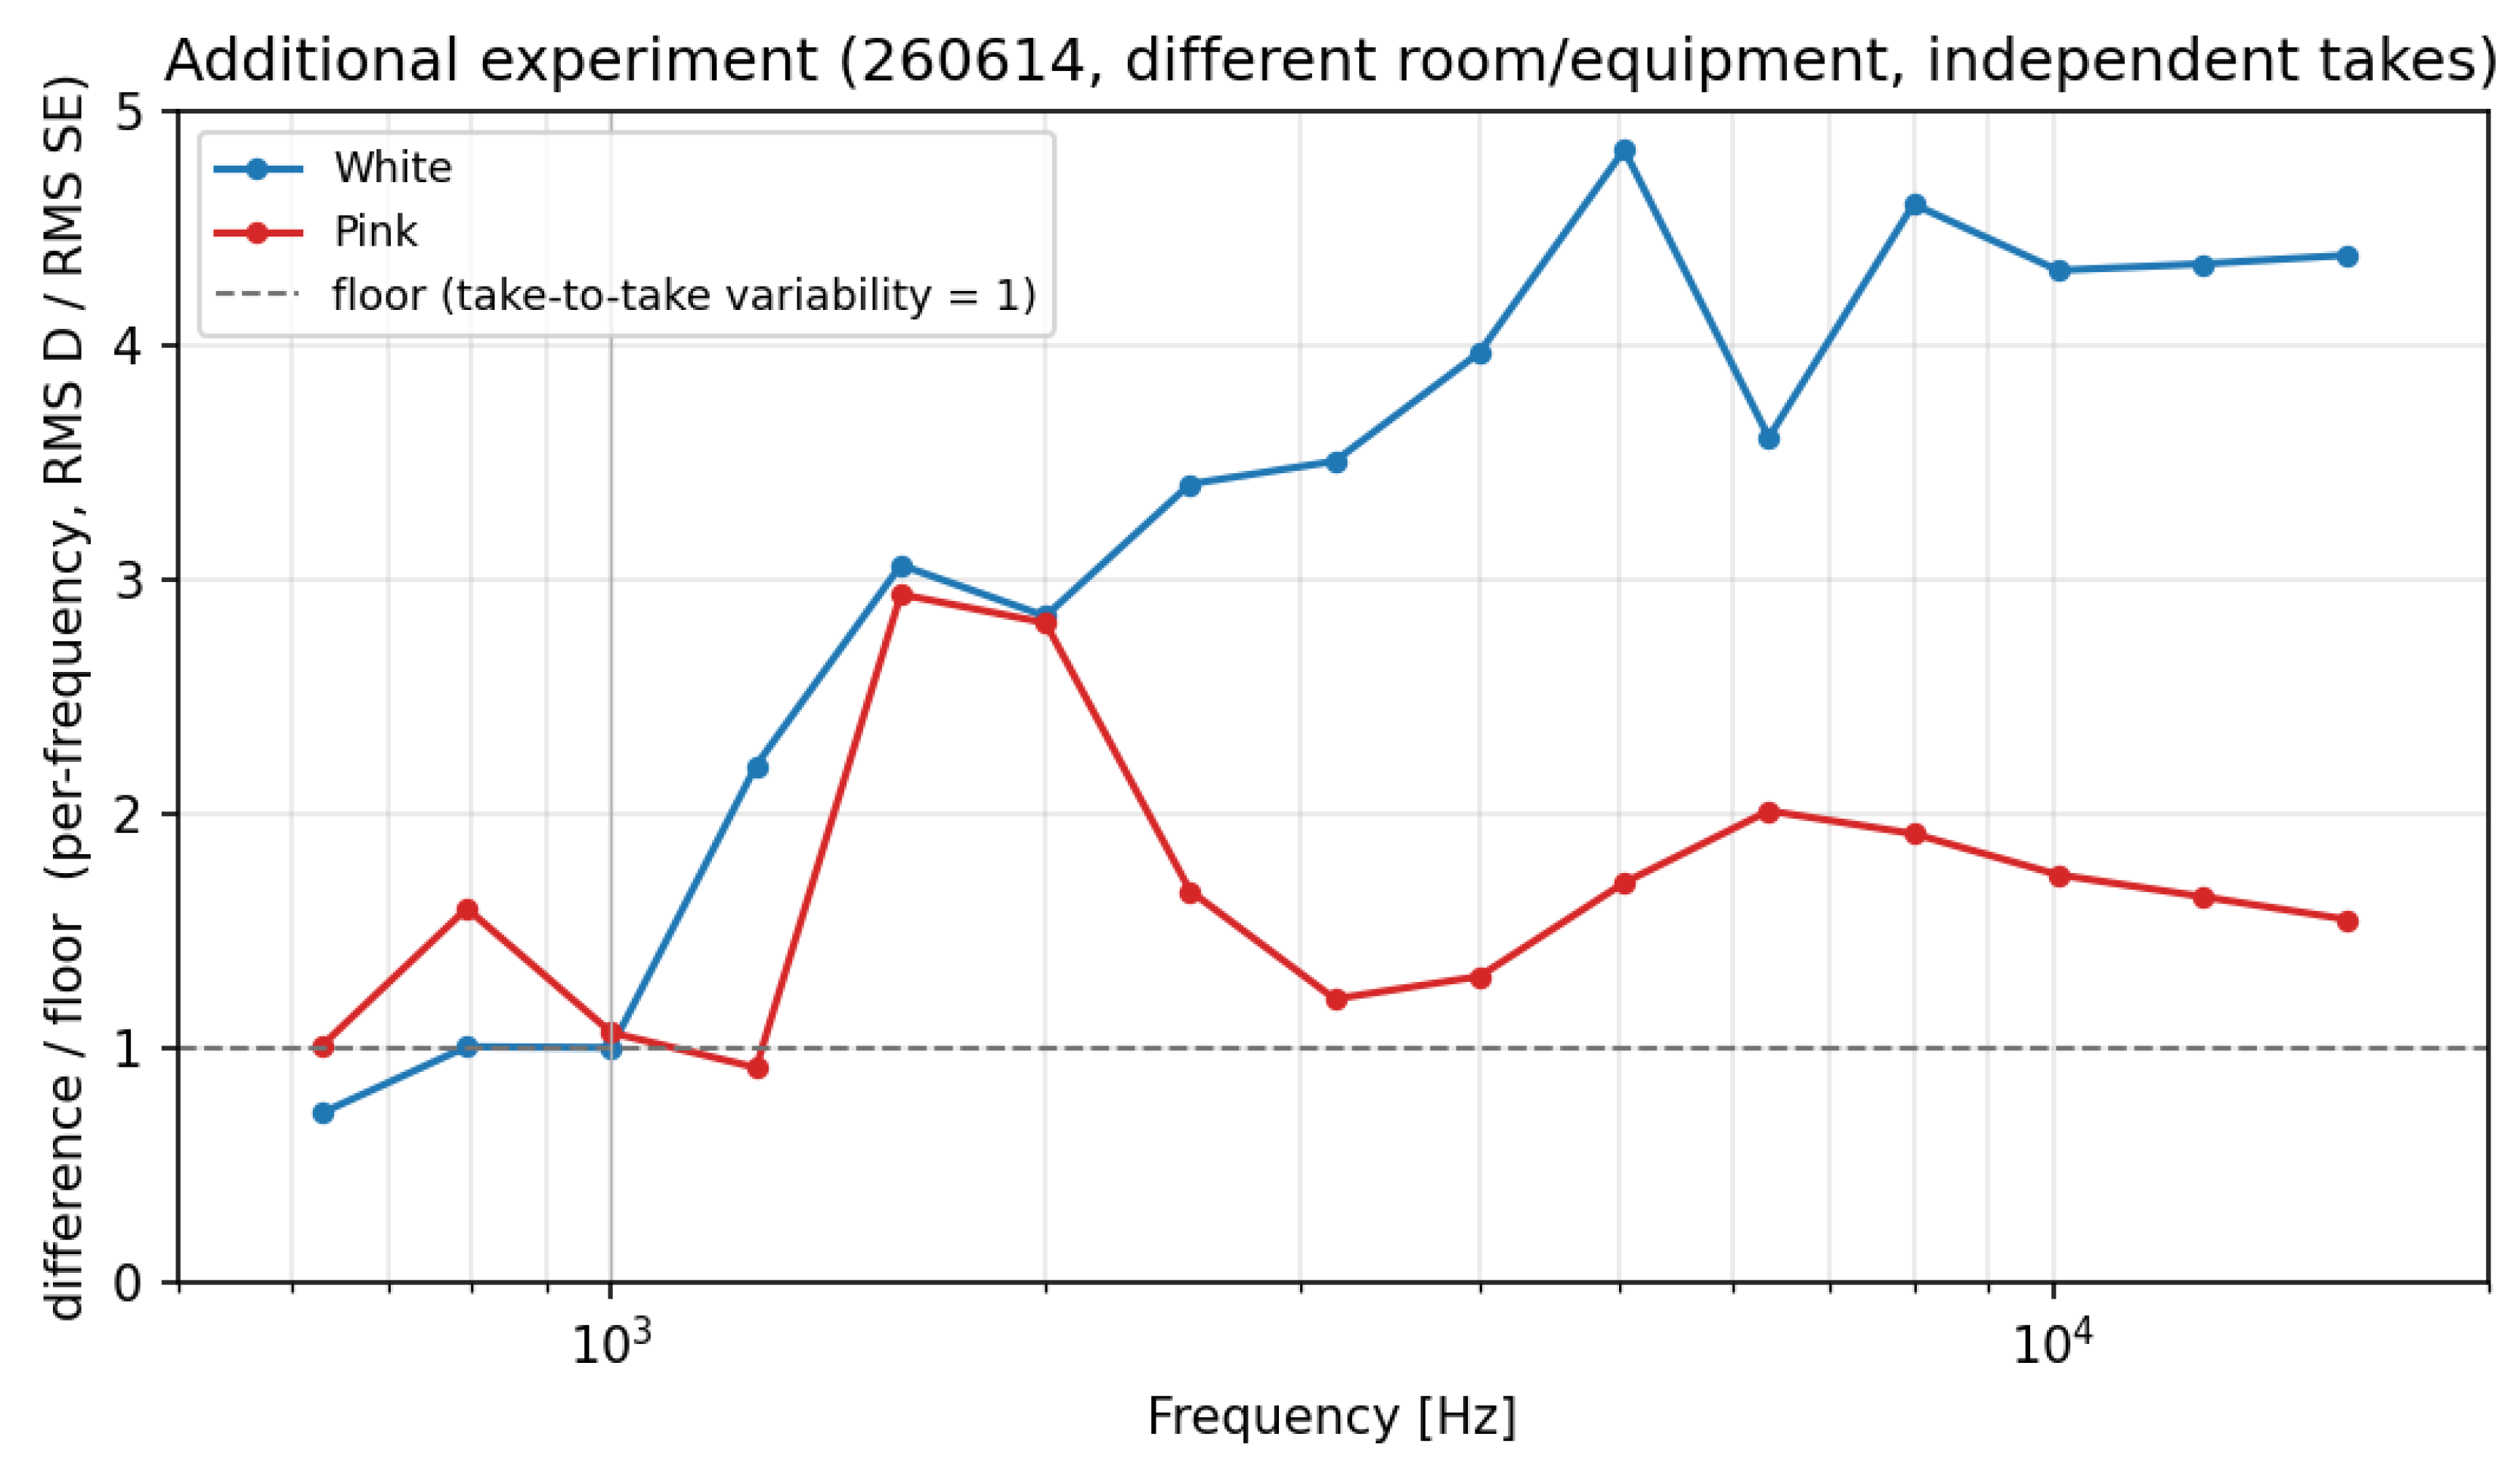
The high-band difference was evaluated for each frequency. Expressed as the quantity in which the difference at each frequency is normalized by the standard error determined from the inter-repetition variability (segment repetition within a single recording) (the normalization reference of Section 2.4), for white, pink, and brown, the value exceeds the floor (inter-repetition variability = 1) over 1–8 kHz, and the ratio increases toward higher frequencies. The octave-band mean differences shown in Table 1 are averaged over the differences at each frequency within the band and do not reflect the per-frequency magnitude (dispersion) of the difference; therefore, they underrepresent the high-band difference, especially for white. Therefore, the presence or absence of a high-band difference was determined by this normalized dispersion rather than by the octave average (the mean values in Table 1 are listed as a descriptive indication of the overall band-level trend due to addition).
3.2. Change in Soundscape Indices
The low-band ACI (0–200 Hz) decreased in all conditions (Table 2). The NDSI also changed, but the change was small and varied with position. In particular, the NDSI for brown had large inter-repetition variability and was not at a level that allowed a conclusion to be drawn about the direction of change.
3.3. Negative Control: The Low-Band Change Is Not Specific to the Added Frequency
Superimposing a stationary sine wave at 40, 63, or 90 Hz lowered the low-band ACI to a comparable degree (Table 3). The amount of decrease depended on the added amplitude and did not systematically depend on the frequency. Because the low-band ACI normalizes the sum of temporal differences by total energy, adding a stationary component increases the total energy without increasing the temporal variation; thus, the index decreases as a consequence of its definition. Therefore, the decrease in low-band ACI is not specific to a particular frequency but is the behavior of the index that accompanies the addition of a stationary component in general.
For brown, the low-band ACI after addition increased almost monotonically with the added frequency (4.69→5.34→5.48 for 40, 63, 90 Hz; i.e., the decrease was largest at 40 Hz), showing an apparent frequency dependence. However, for white and pink, it was not monotonic, and no consistent relationship between the amount of decrease and added frequency was observed.
3.4. Change in Autocorrelation Structure
With the addition of 40 Hz, a structure corresponding to the 40-Hz period (time lag of 25 ms) appeared in the autocorrelation, and the dominant frequency after addition was 40.0 Hz in all conditions (Table 4, Figure 2). For white noise, which was nearly structureless before addition, the structure was particularly pronounced after addition. The variability between conditions decreased with addition (before: approximately 0.003–0.15; after: approximately 0.23–0.61). However, part of this decrease reflects a ceiling: the structure strength of the normalized autocorrelation has a theoretical upper bound (approximately 0.707 for a pure tone), which is approached by conditions with a large amount of the added low-frequency component (see Section 3.5). The period of the added low-frequency component appearing in the autocorrelation is, in part, a natural consequence of the signal, and this study does not claim that it is an effect specific to 40 Hz.
3.5. Dependence on the Amount Added
When the amount of the added low-frequency component was varied numerically, the structure strength of the autocorrelation increased monotonically with the amount added and eventually saturated (Figure 3). This relationship agrees well with the saturation curve derived analytically from the zero-lag normalized autocorrelation of a linearly superimposed signal (solid line in Figure 3). In other words, the relationship between the amount added and the magnitude of the change was predicted almost trivially based on linear superposition and normalization.
3.6. Spectrum of the Reproduced Background Noise (Limitation)
Because background noise was reproduced with a built-in loudspeaker, the spectrum measured at the microphone position did not match the nominal slope at generation (Figure 4). The low-frequency reproduction capability of the built-in loudspeaker was limited; in particular, the 40 Hz brown band reached only approximately +15 dB (measured) against a nominal of approximately +28 dB (relative to 1 kHz). Therefore, the differences in carrier type cannot be interpreted as differences in the nominal spectral shape.
3.7. Reproduction Experiment (Different Room, Different Equipment, Independent Takes)
This high-band difference was also reproduced in additional recordings (Section 2.5) that used multiple independently recorded takes rather than segment repetition within a single recording in a different room with different equipment. The per-frequency normalized dispersion exceeded the floor over 1–8 kHz for white and pink and increased toward higher frequencies. Brown, which has the fewest high-band components, did not exceed the floor. However, because the room is small and poor in low-frequency harmonic components, this is consistent with a carrier having the smallest high-band difference falling below the detection limit. This reproduction shows that the difference does not depend on segment repetition within a single recording (it is based on the repetition of independent recordings) and that the difference does not vanish even when the equipment and room are changed. Because the subwoofer, background noise loudspeaker, and room were all changed, the reproduction implied that the difference was difficult to explain by factors specific to a particular unit or room (Section 4).
Figure 5.
Frequency dependence of the high-band difference in the additional experiment (different room, different equipment, independent takes) (white and pink). The vertical axis is the before/after difference at each frequency normalized by take-to-take variability (ratio to floor); the horizontal axis is frequency. The dashed line (= 1) is the floor. Both carriers exceed the floor over 1–8 kHz and grow toward higher frequencies. Overall, the high-band difference is larger for white than for pink.
Figure 5.
Frequency dependence of the high-band difference in the additional experiment (different room, different equipment, independent takes) (white and pink). The vertical axis is the before/after difference at each frequency normalized by take-to-take variability (ratio to floor); the horizontal axis is frequency. The dashed line (= 1) is the floor. Both carriers exceed the floor over 1–8 kHz and grow toward higher frequencies. Overall, the high-band difference is larger for white than for pink.
4. Discussion
In this study, three stationary noises of known spectral shapes were used as test signals to determine whether a spectral difference arose before and after the spatial addition of low-frequency sound (40 Hz) to indoor background noise.
Low-band change. The changes in the spectrum, low-band ACI, and autocorrelation were monotonic and predictable with the amount added (Figure 3) and did not depend on the added frequency (Table 3, negative control). These followed almost trivially from linear superposition and normalization, and this study does not claim that they are novel physical phenomena.
The decrease in the low-band ACI and the appearance of a period in the autocorrelation are, in part, natural consequences of adding a stationary low-frequency component. The 80- and 120-Hz components appearing in the difference spectrum are integer multiples of 40 Hz and are components not contained in a pure sine wave; therefore, they are considered harmonics originating from the nonlinearity of the reproduction system or of the room/air. This study does not identify their origin.
High-band difference. A difference before and after the addition was also observed in the high band (1–8 kHz) (Figure 1, Table 1). This difference (std. approximately 1.8–3.6 dB) exceeded the high-band variability between segments within the same recording when nothing was added—std. approximately 0.9–1.2 dB for without-addition (noise-only), and approximately 0.6–0.9 dB for room background alone—and did not arise from numerical linear addition to the same waveform (linear addition adds energy only in the 40-Hz band).
The present study reports this difference as an experimental observation and does not address its generation mechanism. To the best of our knowledge, no previous studies have reported such a difference. We also observed a similar difference in an earlier study on music [7]. Discriminating the cause of the difference, in particular, comparison against a control in which the without-addition state is separately and repeatedly recorded with the microphone fixed, rather than the within-recording variability used here as a reference, or comparing the presence/absence of addition with time alignment, exceeds the single-recording pair design of this study and is a task for future work. In particular, the without-addition and 40 Hz-addition conditions differ systematically, not only in the presence/absence of the 40 Hz sound field but also in whether the subwoofer is operating. The comparison in this study, which uses random variability as a reference, does not separate whether the observed difference is specific to the 40-Hz acoustic component or due to factors associated with the operation. On the other hand, in the reproduction experiment the same high-band difference was obtained with two different subwoofers (FOSTEX PM-SUBmini2 / Yamaha NS-SW050), two rooms, and two types of background-noise loudspeaker. This indicates that it is difficult to explain by factors specific to a particular unit or a particular room—broadband noise of a particular amplifier, distortion or resonance of a particular driver/cabinet, or unit-specific electrical interference. However, the recorder was the same in both experiments (TASCAM DR-07X); thus, the response of the capture chain to high-SPL 40 Hz (consumption of ADC/preamp headroom, or intermodulation) remains unseparated. Therefore, future research should be divided into two stages. (i) Compare the conditions in which the subwoofer is supplied with silence versus 40 Hz while energizing to separate factors associated with operation from the 40-Hz acoustic component. (ii) Replace the recorder with a system having more headroom, re-record with the matched acoustic conditions, and separate the response of the recording system from the acoustic difference based on whether the high-band difference remains. In addition, the level of the 40 Hz tone should be varied to examine how the difference scales with the amount of exposure.
Limitations. First, the high-band difference is small in absolute terms, approximately 1 dB or less in the octave average, but the per-frequency difference reaches several times the floor (random variability) over 1–8 kHz (Table 5); that is, the absolute amount is small, whereas the relative ratio to the floor is large. The high-band difference was reproduced with independently recorded takes in a different room with different equipment (Section 2.5); however, the number of rooms and equipment systems evaluated was still limited. Second, because the background noise was reproduced with a built-in loudspeaker, the radiated spectrum differed from the nominal value (Figure 4), and the interpretation of the differences between carriers was limited. Third, in the main experiment, the repetitions for each condition were segmented repetitions from a single recording, whereas the reproduction experiment (Section 2.5) was based on repetitions of independent recordings. Fourth, this study is limited to describing differences in physical quantities and does not address the interpretation of cause or mechanism or perceptual or evaluative judgments.
5. Conclusions
When low-frequency sound (40 Hz) is spatially added to indoor background noise (using three stationary noises of known spectral shapes as test signals), a predictable change scaling with the amount added arises in the low band (independent of the added frequency), and spectral difference appears clearly at 40 Hz and its harmonics (80 and 120 Hz).
A difference is also observed in the high band (1–8 kHz), and its character varies by carrier. Evaluated per frequency by normalizing by take-to-take variability, this high-band difference exceeds the floor and was reproduced with independently recorded takes in a different room with different equipment (white and pink). This study describes these as measured observations and does not interpret their cause or mechanism, nor make perceptual or evaluative judgments. Identifying the cause of the high-band difference requires dedicated control experiments—controls that equalize subwoofer operation (energized with silence vs. 40 Hz) and that separate the response of the recording system (headroom, intermodulation)—and is a task for future work. This study forms the basis for applied research that applies designed low-frequency exposure to real spaces [9], as well as for the author’s series of low-frequency studies [14,15,16].
Author Contributions
Conceptualization, Y.S.; methodology, Y.S.; software, Y.S.; formal analysis, Y.S.; investigation, Y.S.; data curation, Y.S.; writing—original draft preparation, Y.S.; writing—review and editing, Y.S. The author has read and agreed to the published version of the manuscript.
Funding
This research was funded by JSPS KAKENHI, grant number 24K15030. Additional support was provided by KAGA Electronics Co., Ltd.
Institutional Review Board Statement
Not applicable. This study involved acoustic measurements only and did not involve human participants or animals.
Informed Consent Statement
Not applicable.
Data Availability Statement
The data presented in this study are available on request from the corresponding author.
Conflicts of Interest
KAGA Electronics Co., Ltd. provided research funding for this study. The funder had no role in the design of the study; in the collection, analyses, or interpretation of data; in the writing of the manuscript; or in the decision to publish the results.
References
- Fuchs, H.V.; Zha, X.; Zhou, X.; Drotleff, H. Creating low-noise environments in communication rooms. Appl. Acoust. 2001, 62, 1375–1396. [Google Scholar] [CrossRef]
- Negreira, J.; Sjöström, A.; Glebe, D. Low-frequency behaviour of a sound field inside a reverberant room: Measurements and numerical prediction tools. Build. Acoust. 2019, 26, 93–108. [Google Scholar] [CrossRef]
- Dance, S.M.; Van Buuren, G. Effects of damping on the low-frequency acoustics of listening rooms based on an analytical model. J. Sound. Vib. 2013, 332, 6891–6904. [Google Scholar] [CrossRef]
- Meissner, M.; Wiśniewski, K. Influence of room modes on low-frequency transients: Theoretical modeling and numerical predictions. J. Sound. Vib. 2019, 448, 19–33. [Google Scholar] [CrossRef]
- Lau, S.-K.; Powell, E.A. Effects of absorption placement on sound field of a rectangular room: A statistical approach. J. Low. Freq. Noise Vib. Act. Control 2018, 37, 394–406. [Google Scholar] [CrossRef]
- Araújo Alves, J.; Neto Paiva, F.; Torres Silva, L.; Remoaldo, P. Low-frequency noise and its main effects on human health–A review of the literature between 2016 and 2019. Appl. Sci. 2020, 10, 5205. [Google Scholar] [CrossRef]
- Suzuki, Y. Effects of mixing low-frequency waves–Deep Micro Vibrotactile with sounds. J. Robot. Netw. Artif. Life 2022, 8, 289–292. [Google Scholar] [CrossRef]
- Sueur, J.; Farina, A.; Gasc, A.; Pieretti, N.; Pavoine, S. Acoustic indices for biodiversity assessment and landscape investigation. Acta Acust. United Acust. 2014, 100, 772–781. [Google Scholar] [CrossRef]
- Suzuki, Y. Designed low-frequency exposure shifts acoustic indices but selectively affects perceived calmness. Build. Acoust. manuscript submitted for publication. 2025. [Google Scholar] [CrossRef]
- Kasten, E.P.; Gage, S.H.; Fox, J.; Joo, W. The remote environmental assessment laboratory’s acoustic library: An archive for studying soundscape ecology. Ecol. Inform. 2012, 12, 50–67. [Google Scholar] [CrossRef]
- Pieretti, N.; Farina, A.; Morri, D. A new methodology to infer the singing activity of an avian community: The Acoustic Complexity Index (ACI). Ecol. Indic. 2011, 11, 868–873. [Google Scholar] [CrossRef]
- Bradfer-Lawrence, T.; Gardner, N.; Bunnefeld, L.; Bunnefeld, N.; Willis, S.G.; Dent, D.H. Guidelines for the use of acoustic indices in environmental research. Methods Ecol. Evol. 2019, 10, 1796–1807. [Google Scholar] [CrossRef]
- Hyland, E.B.; Schulz, A.; Quinn, J.E. Quantifying the soundscape: How filters change acoustic indices. Ecol. Indic. 2023, 148, 110061. [Google Scholar] [CrossRef]
- Kodama, A.; Suzuki, Y.; Kume, Y.; Ota, H. Examination of the effect of Deep Micro Vibrotactile stimulation on cognitive function for elderly with Alzheimer’s disease. Ann. Alzheimers Dement. Care 2021, 5, 1–3. [Google Scholar] [CrossRef]
- Kodama, A.; Suzuki, Y.; Sakuraba, K.; Kume, Y.; Ota, H. The effect of deep micro vibrotactile stimulation on cognitive function of mild cognitive impairment and mild dementia. Int. J. Environ. Res. Public Health 2022, 19, 3803. [Google Scholar] [CrossRef] [PubMed]
- Shimizu, T.; Ota, H.; Kodama, A.; Suzuki, Y.; Ohnuma, T.; Suzuki, R.; Sugawara, K.; Sato, Y.; Kodama, H. Unmodulated 40 Hz stimulation as a therapeutic strategy for aging: Improvements in metabolism, frailty, and cognitive function in senescence-accelerated prone 10 mice. Biomolecules 2024, 14, 1079. [Google Scholar] [CrossRef] [PubMed]
Figure 1.
Spectral difference before and after addition (center position; from top: white, pink, brown). The difference appears at 40 Hz and its integer multiples (80 and 120 Hz). A difference before and after addition is also observed above 1 kHz, and its character varies by carrier (Table 1).
Figure 1.
Spectral difference before and after addition (center position; from top: white, pink, brown). The difference appears at 40 Hz and its integer multiples (80 and 120 Hz). A difference before and after addition is also observed above 1 kHz, and its character varies by carrier (Table 1).
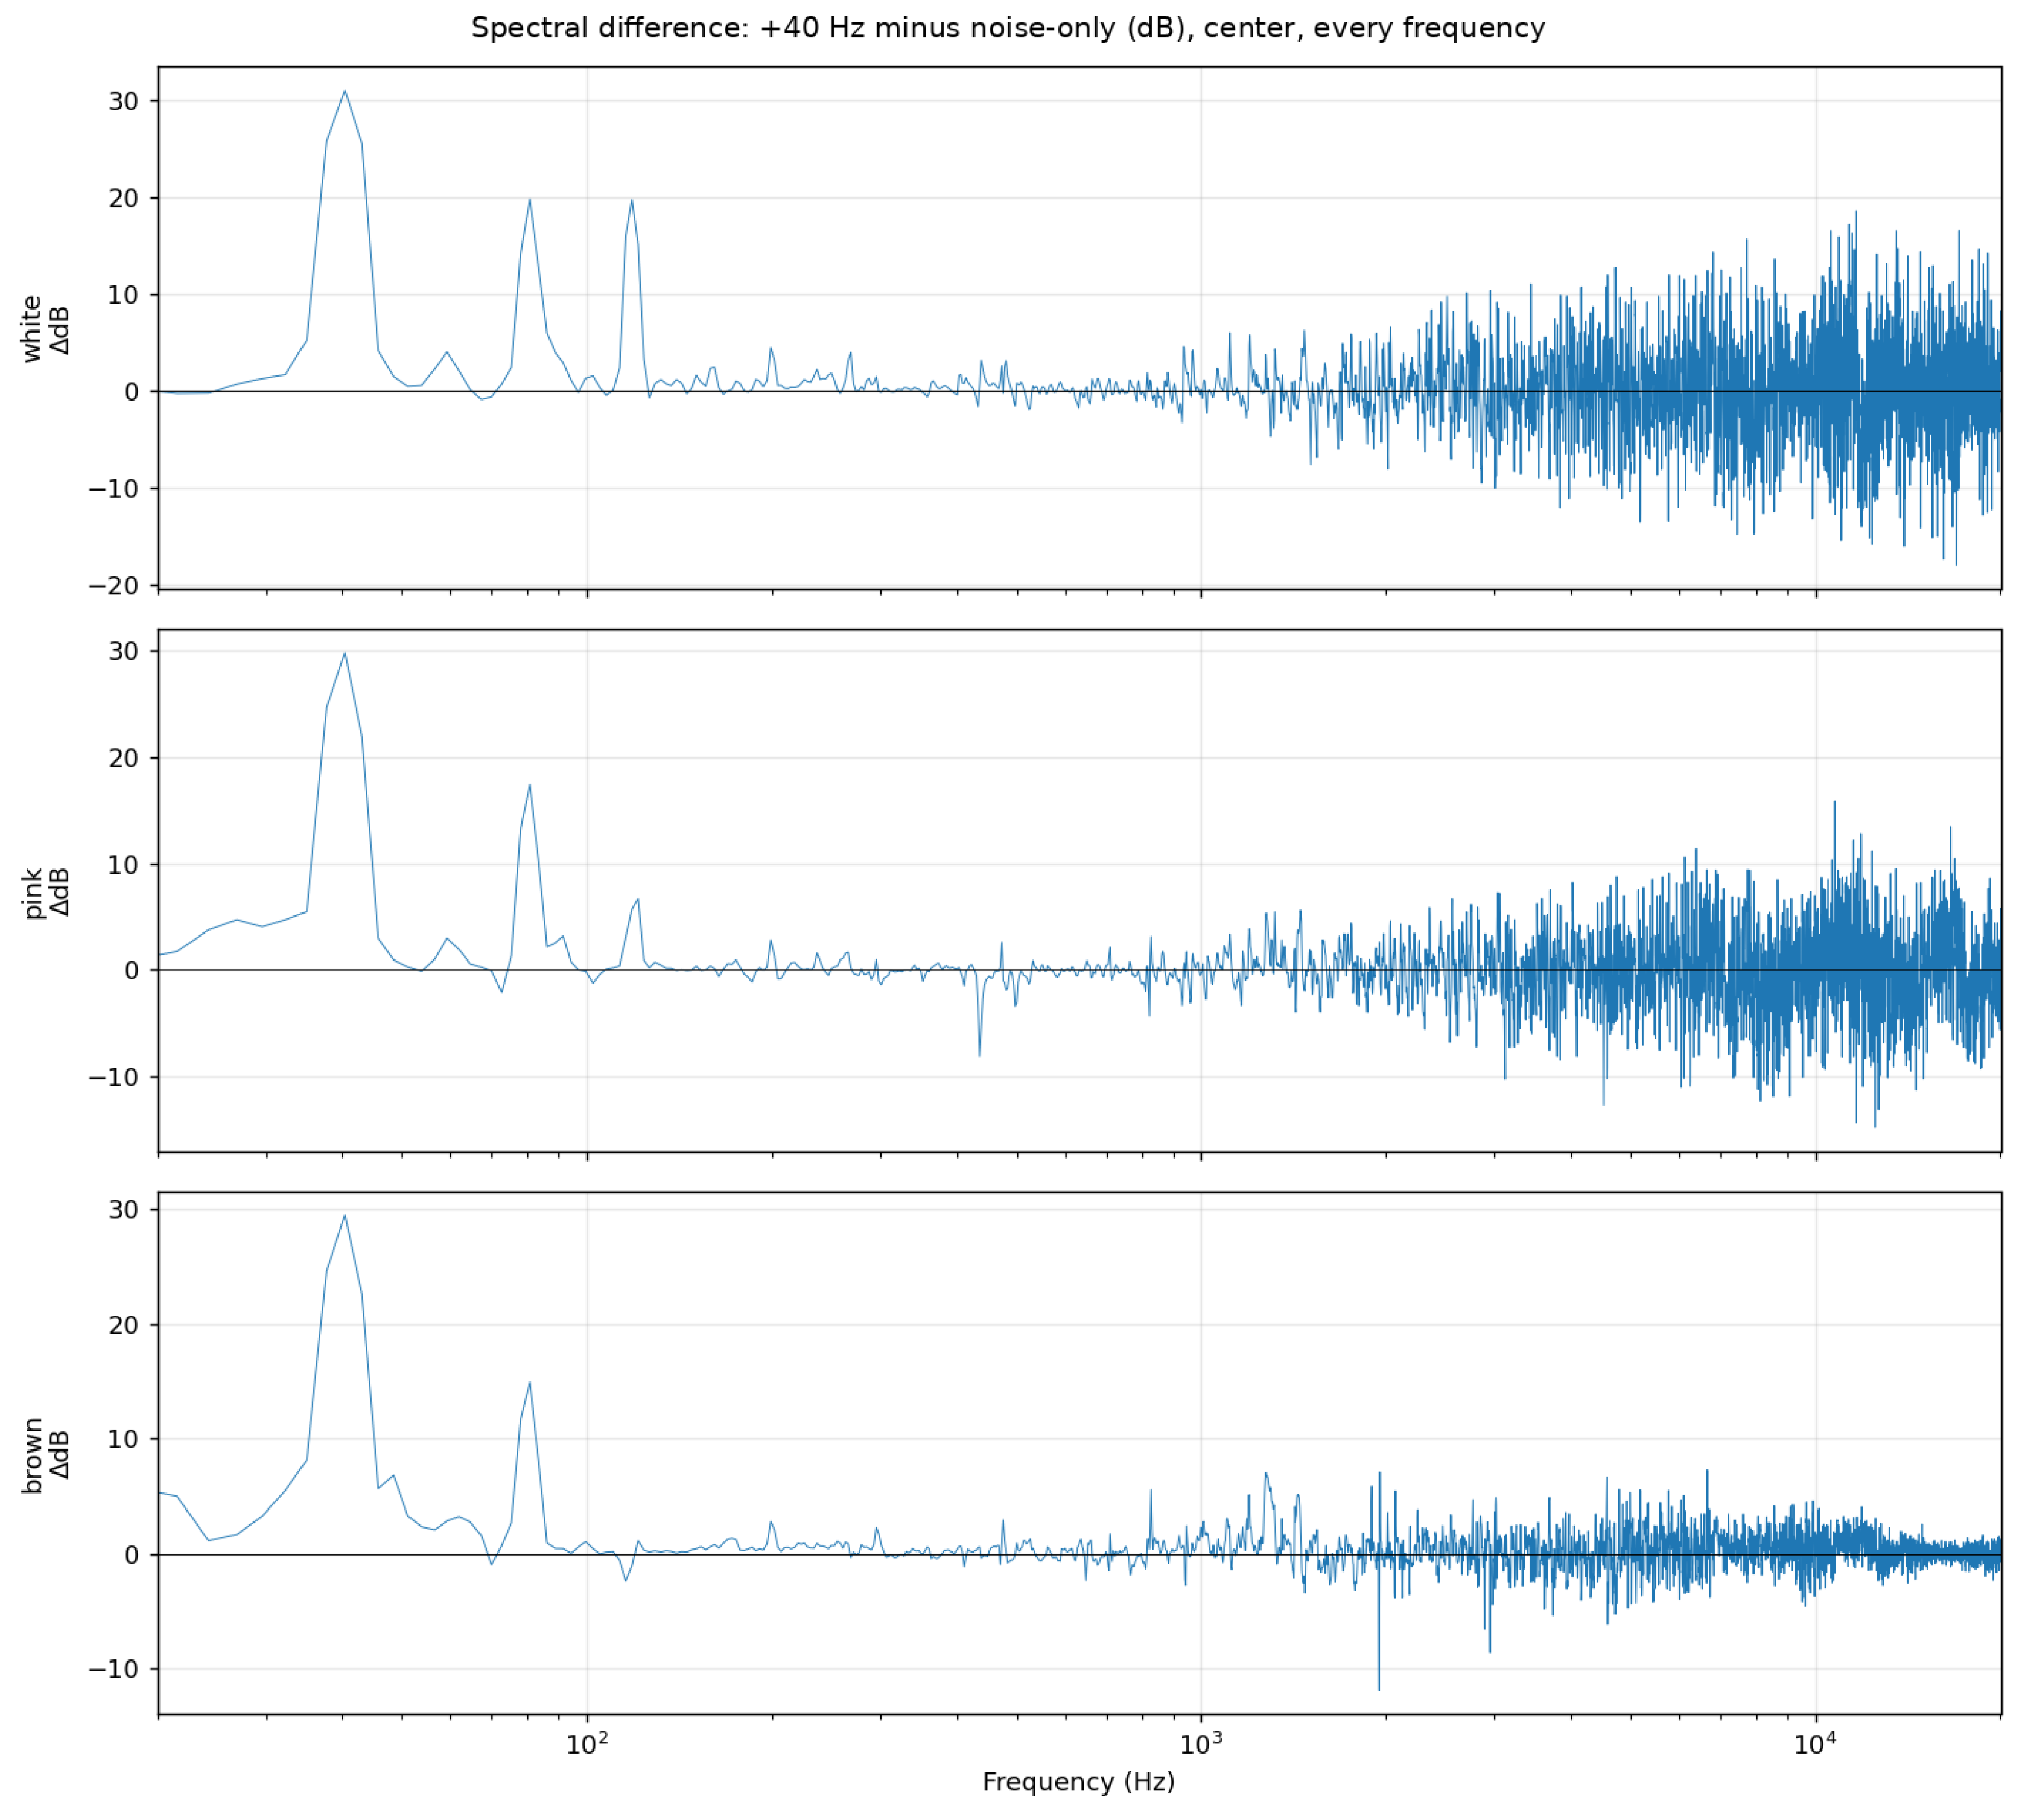
Figure 2.
Autocorrelation function of the background noise (white, center). Without addition (gray) it is nearly flat; after 40-Hz addition (red), it oscillates with a 25-ms period (=40 Hz).
Figure 2.
Autocorrelation function of the background noise (white, center). Without addition (gray) it is nearly flat; after 40-Hz addition (red), it oscillates with a 25-ms period (=40 Hz).
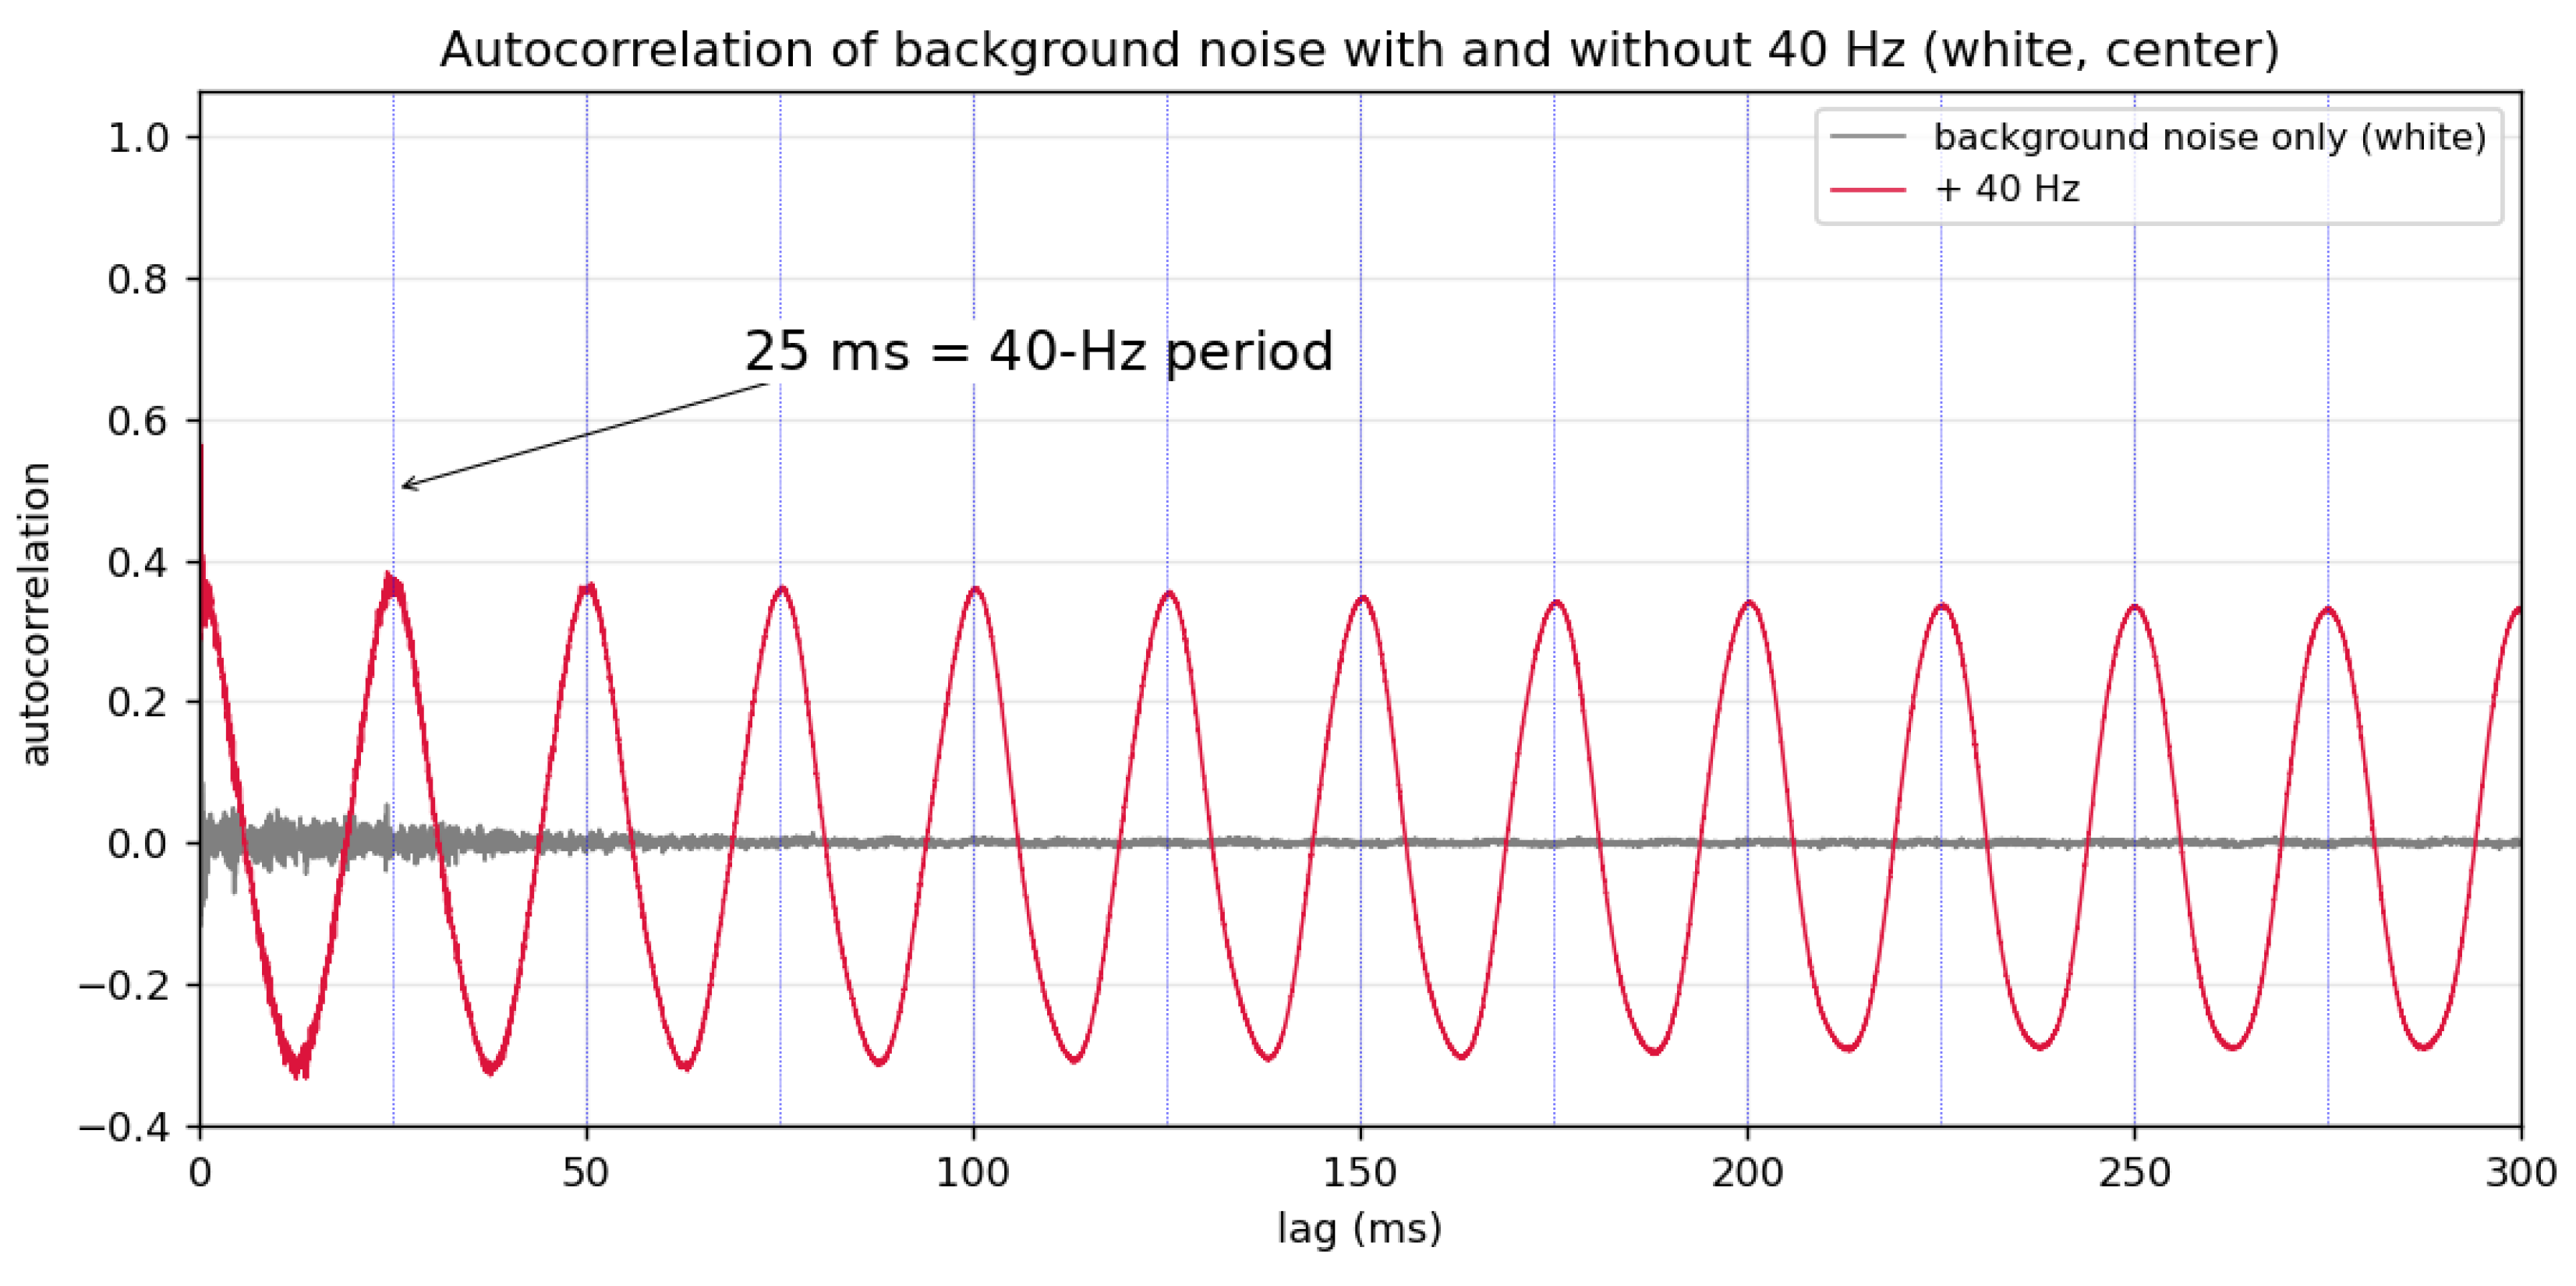
Figure 3.
Dependence of the autocorrelation structure strength on the amount g of the added low-frequency component (center position). Points are measured; the solid line is the prediction derived from linear superposition and normalization.
Figure 3.
Dependence of the autocorrelation structure strength on the amount g of the added low-frequency component (center position). Points are measured; the solid line is the prediction derived from linear superposition and normalization.
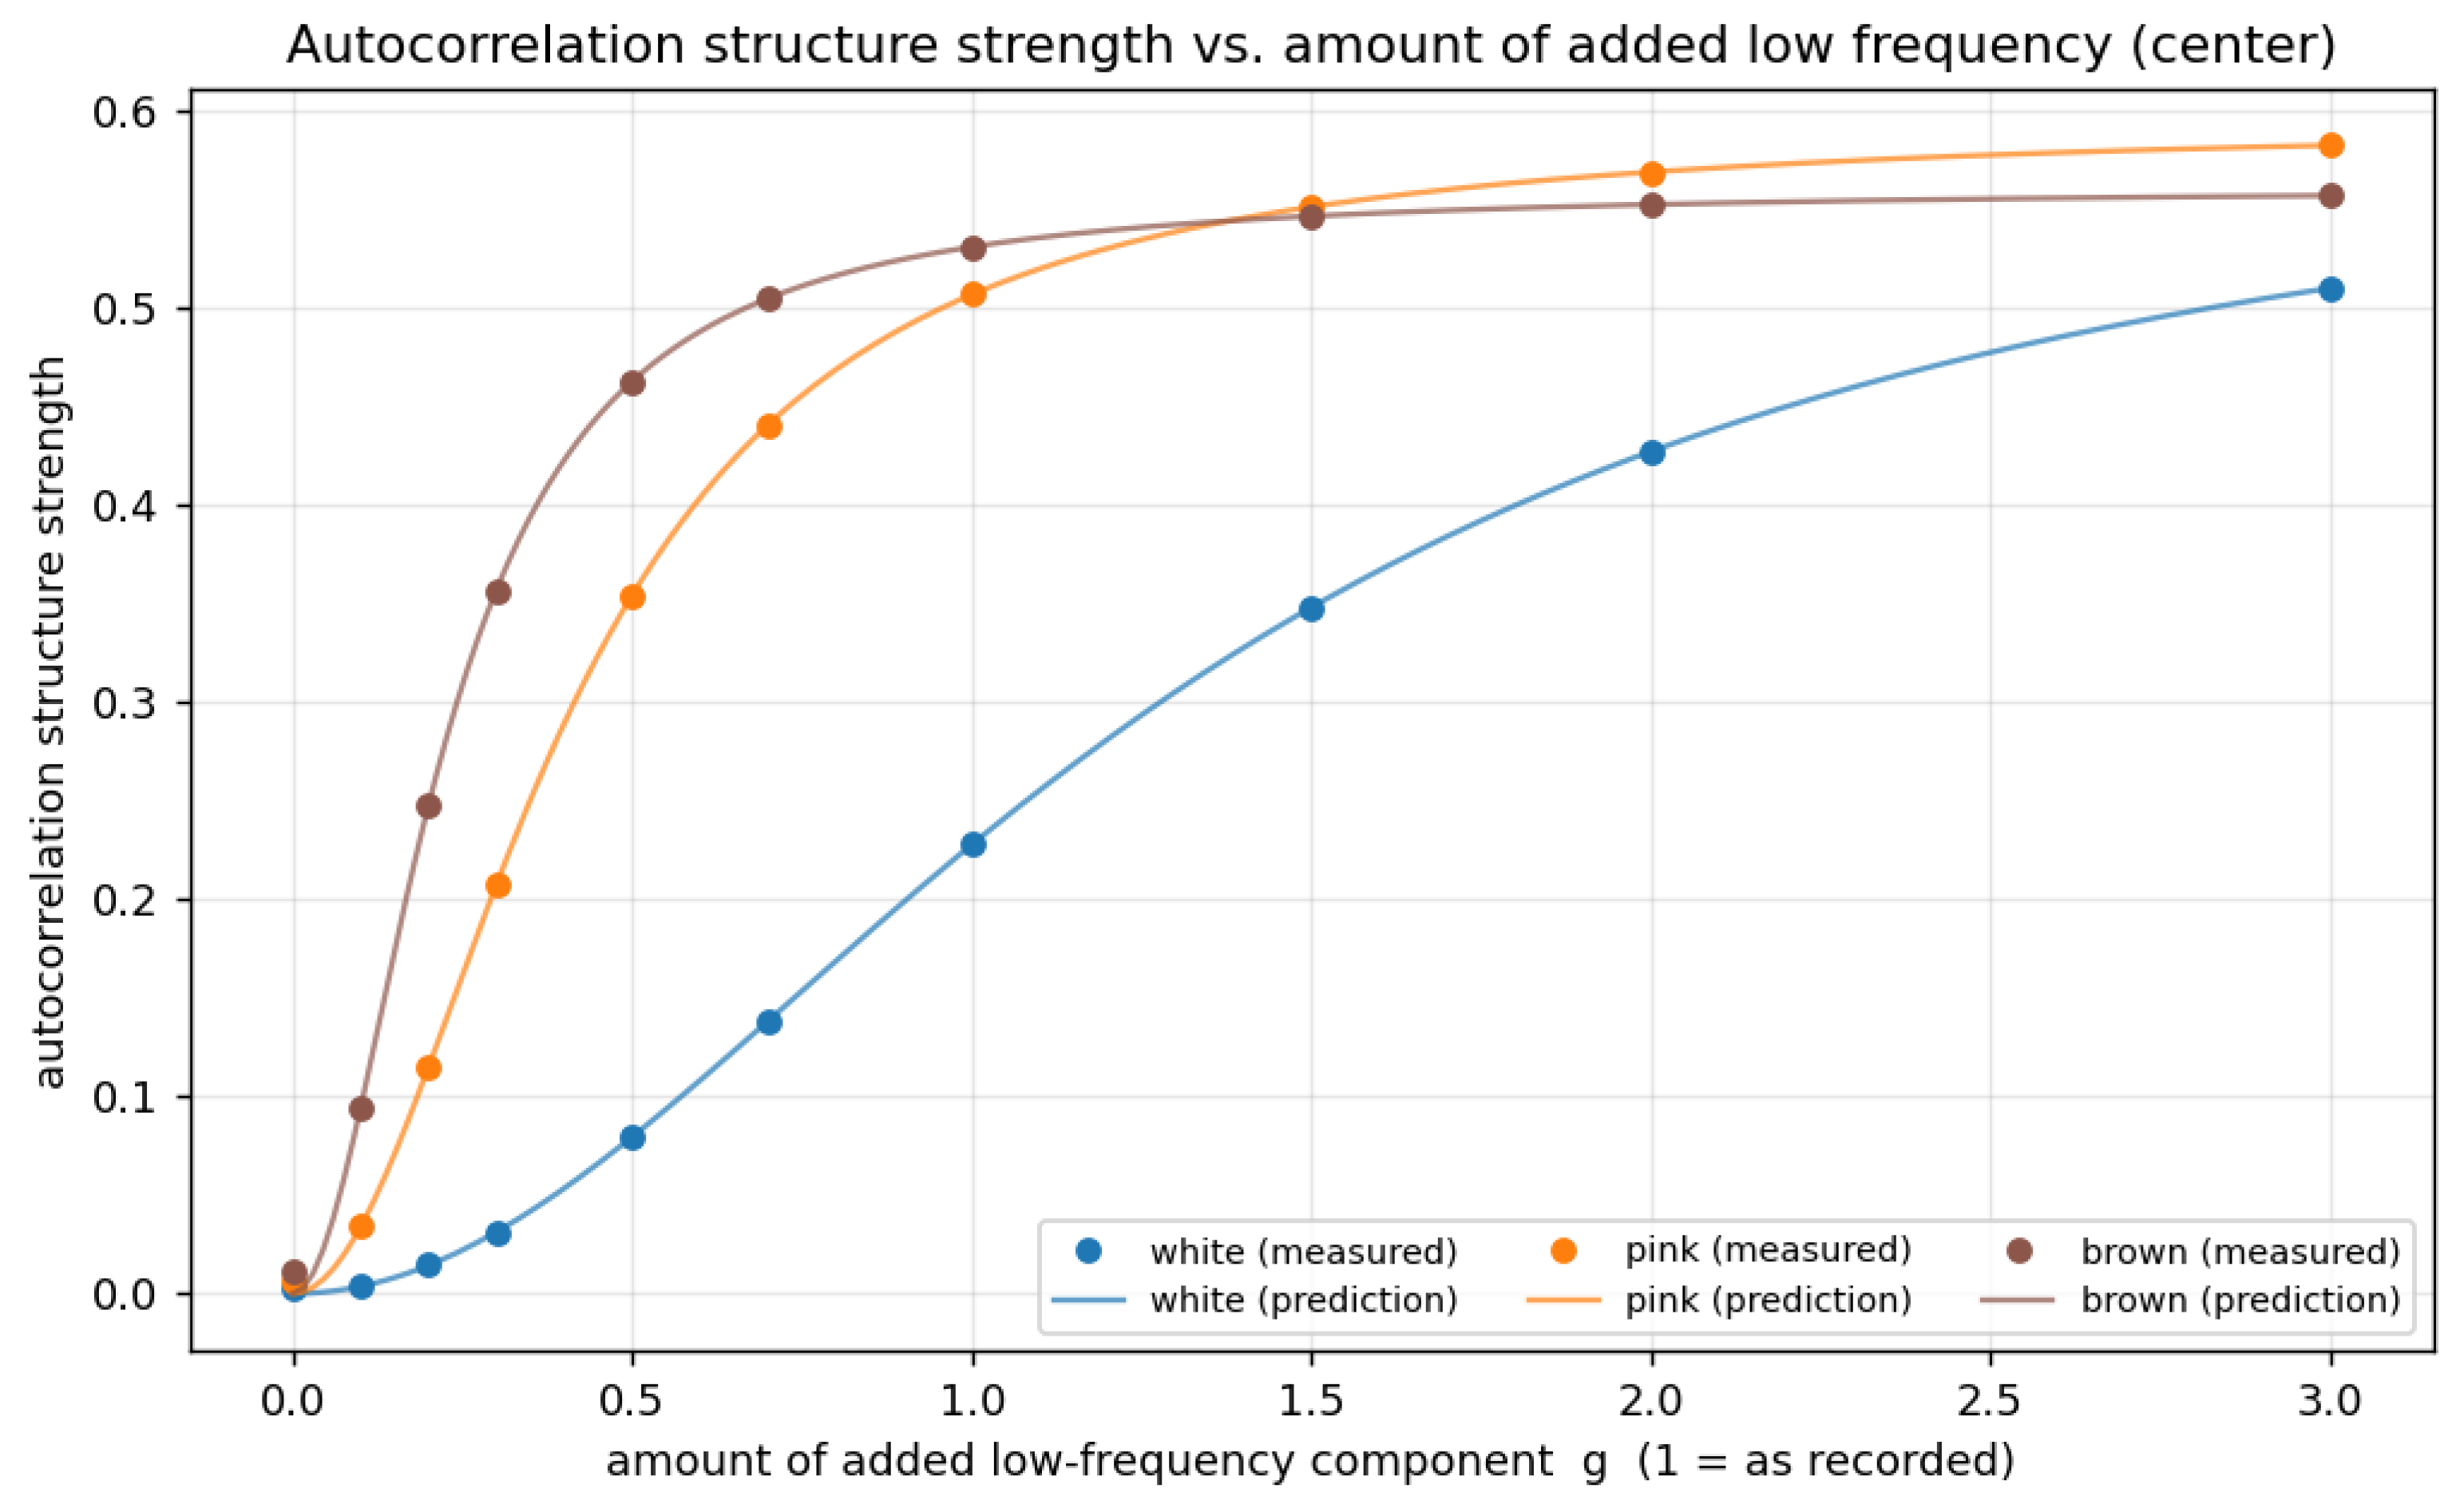
Figure 4.
Background-noise spectra measured at the microphone position (center position, before addition, normalized at 1 kHz). The dashed and dotted lines are the nominal slopes (−3 / −6 dB/oct). Filled circles are the measured 40-Hz value of each noise.
Figure 4.
Background-noise spectra measured at the microphone position (center position, before addition, normalized at 1 kHz). The dashed and dotted lines are the nominal slopes (−3 / −6 dB/oct). Filled circles are the measured 40-Hz value of each noise.
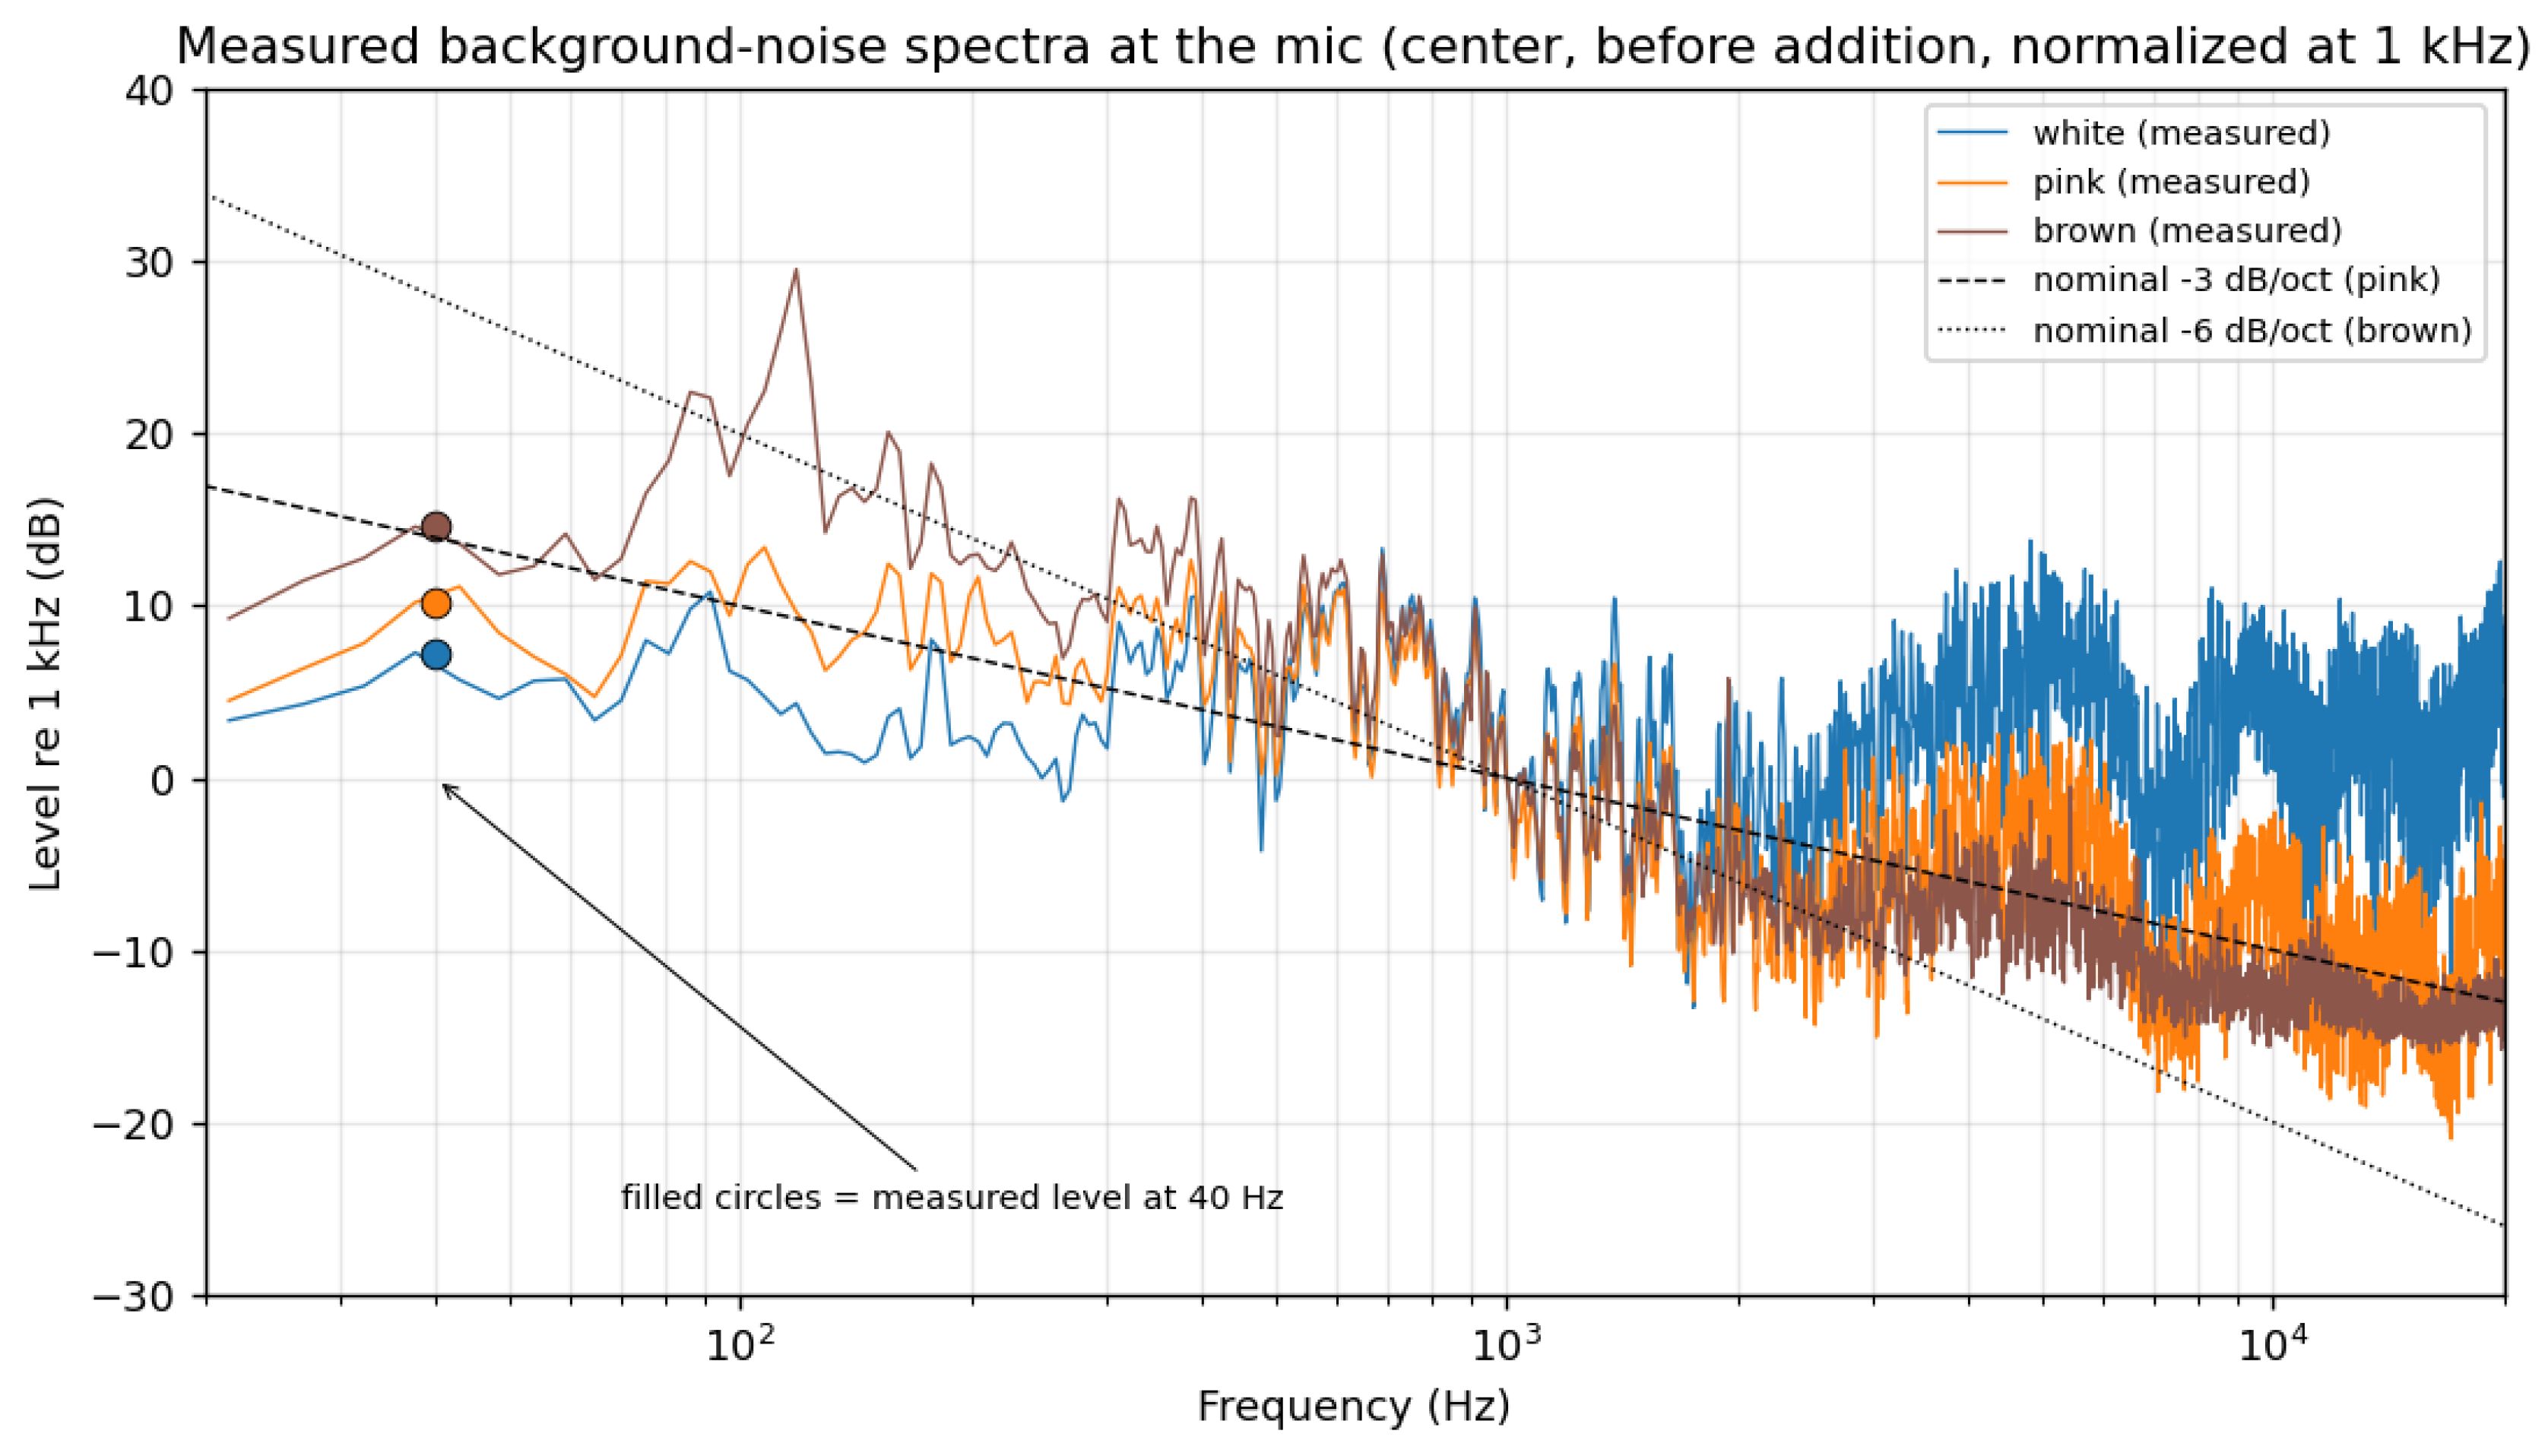

Table 1.
Spectral differences before and after addition (mean per octave band, dB, center position).
Table 1.
Spectral differences before and after addition (mean per octave band, dB, center position).
| Band (Hz) | White | Pink | Brown |
| ~40 (32–63) | +15.4 | +14.0 | +15.2 |
| 63–125 | +7.3 | +4.4 | +2.6 |
| 125–250 | +1.0 | +0.2 | +0.9 |
| 250–500 | +0.4 | +0.4 | +0.6 |
| 500–1k | 0.0 | +0.1 | +0.5 |
| 1k–2k | −0.1 | +0.3 | +1.1 |
| 2k–4k | 0.0 | −0.3 | +0.7 |
| 4k–8k | −0.1 | −0.1 | +1.0 |
| 8k–16k | +0.1 | −0.3 | +0.5 |
Table 2.
Change in soundscape indices (NDSI and low-band ACI) before and after addition (mean of three repetitions).
Table 2.
Change in soundscape indices (NDSI and low-band ACI) before and after addition (mean of three repetitions).
| Carrier | Position | NDSI before→after | ΔNDSI | ACI0–200 before→after | ΔACI0–200 |
| White | Center | 0.852→0.859 | +0.007 | 5.9→4.6 | −1.36 |
| White | Near wall | 0.784→0.770 | −0.014 | 6.2→3.7 | −2.49 |
| White | Corner | 0.779→0.769 | −0.010 | 5.7→4.4 | −1.36 |
| Pink | Center | 0.549→0.532 | −0.017 | 5.8→4.6 | −1.11 |
| Pink | Near wall | 0.451→0.453 | +0.002 | 5.8→3.9 | −1.87 |
| Pink | Corner | 0.480→0.404 | −0.076 | 5.6→4.3 | −1.25 |
| Brown | Center | 0.164→0.116 | −0.049 | 5.7→4.7 | −1.05 |
| Brown | Near wall | 0.039→0.002 | −0.037 | 5.9→3.8 | −2.07 |
| Brown | Corner | 0.163→0.030 | −0.134 | 5.8→4.4 | −1.37 |
Table 3.
Negative control: low-band ACI from the addition of a stationary sine wave (center position; amplitude identical across all frequencies).
Table 3.
Negative control: low-band ACI from the addition of a stationary sine wave (center position; amplitude identical across all frequencies).
| Background noise | Without addition | +40 Hz | +63 Hz | +90 Hz |
| White | 5.90 | 3.27 | 3.80 | 2.87 |
| Pink | 5.89 | 4.51 | 5.00 | 4.22 |
| Brown | 5.98 | 4.69 | 5.34 | 5.48 |
Table 4.
Change in autocorrelation structure strength before and after addition (mean ± standard deviation of three repetitions).
Table 4.
Change in autocorrelation structure strength before and after addition (mean ± standard deviation of three repetitions).
| Background noise | Position | Structure strength (before) | Structure strength (after) | Dominant freq. (after) |
| White | Center | 0.0026 ± 0.0001 | 0.2265 ± 0.0022 | 40 Hz |
| White | Near wall | 0.0045 ± 0.0000 | 0.3934 ± 0.0017 | 40 Hz |
| White | Corner | 0.0130 ± 0.0032 | 0.4968 ± 0.0052 | 40 Hz |
| Pink | Center | 0.0565 ± 0.0764 | 0.4985 ± 0.0091 | 40 Hz |
| Pink | Near wall | 0.1248 ± 0.0292 | 0.5957 ± 0.0069 | 40 Hz |
| Pink | Corner | 0.1198 ± 0.0062 | 0.6025 ± 0.0056 | 40 Hz |
| Brown | Center | 0.1503 ± 0.0044 | 0.5383 ± 0.0077 | 40 Hz |
| Brown | Near wall | 0.1405 ± 0.0117 | 0.6123 ± 0.0051 | 40 Hz |
| Brown | Corner | 0.0784 ± 0.0212 | 0.6035 ± 0.0047 | 40 Hz |
Table 5.
High-band difference in the reproduction experiment (different room, different equipment, independent takes). Values are octave-band averages of the quantity in which the before/after difference at each frequency is normalized by take-to-take variability (ratio to floor); a value above 1 exceeds the floor (take-to-take variability). Brown is omitted because it did not exceed the floor in that room.
Table 5.
High-band difference in the reproduction experiment (different room, different equipment, independent takes). Values are octave-band averages of the quantity in which the before/after difference at each frequency is normalized by take-to-take variability (ratio to floor); a value above 1 exceeds the floor (take-to-take variability). Brown is omitted because it did not exceed the floor in that room.
| Carrier | ch | 1–2k | 2–4k | 4–8k | 8–16k |
| White | L | 1.6 | 3.6 | 4.1 | 4.4 |
| White | R | 1.7 | 2.9 | 4.1 | 4.0 |
| Pink | L | 1.1 | 1.3 | 1.6 | 1.7 |
| Pink | R | 1.6 | 2.0 | 1.5 | 2.1 |
Disclaimer/Publisher’s Note: The statements, opinions and data contained in all publications are solely those of the individual author(s) and contributor(s) and not of MDPI and/or the editor(s). MDPI and/or the editor(s) disclaim responsibility for any injury to people or property resulting from any ideas, methods, instructions or products referred to in the content. |
© 2026 by the authors. Licensee MDPI, Basel, Switzerland. This article is an open access article distributed under the terms and conditions of the Creative Commons Attribution (CC BY) license (http://creativecommons.org/licenses/by/4.0/).
Copyright: This open access article is published under a Creative Commons CC BY 4.0 license, which permit the free download, distribution, and reuse, provided that the author and preprint are cited in any reuse.


