
Submitted:
20 July 2026
Posted:
21 July 2026
You are already at the latest version
Abstract
The incorporation of probiotic cultures into semi-hard cheese is limited by their low survival rate and potential negative impact on technological properties. This study evaluated the effects of adjunct probiotic Limosilactobacillus fermentum AG8, isolated from silage, on the chemical, technological, and antioxidant properties of semi-hard cow cheese during 60 days of ripening. Two cheese variants were produced: a control (CS) with a commercial mesophilic starter, and a probiotic variant (CS+AG8) supplemented with strain AG8. The addition of AG8 significantly increased cheese moisture content and reduced hardness at 10–45 days of ripening (p < 0.05), while enhancing springiness and chewiness at mid- and late ripening stages. Microstructural analysis revealed a more porous protein matrix in CS+AG8, associated with a threefold increase in exopolysaccharide (EPS) yield (1123.97 vs. 359.56 µg/g; p < 0.05). The probiotic cheese exhibited higher water-holding capacity and elevated levels of phenolic compounds and low-molecular-weight peptides in the protein-free extract, particularly at day 60. Furthermore, CS+AG8 demonstrated improved oxidative stability, with significantly lower TBARS values at mid and late ripening stages (p < 0.05). The adjunct strain survived throughout ripening, maintaining counts 1–2 log CFU/g higher than the control on selective MRS agar (p < 0.05). PLS-DA and correlation analyses identified peptide and phenolic content in the protein-free extract, water-adsorbing capacity, DPPH-scavenging activity of the aqueous extract, LAB count, protein content, and free fatty acid content as the most informative variables distinguishing the cheeses (VIP > 1.0). These results indicate that L. fermentum AG8 is a promising functional adjunct for producing semi-hard cheese with enhanced texture, microstructure, and antioxidant properties while ensuring adequate probiotic viability.
Keywords:
cheese
; probiotic
; chemical composition
; texture
; antioxidants
; lipids
; exopolysaccharide
1. Introduction
One of the most promising and rapidly growing areas in the food industry is the development of functional foods that combine health benefits with organoleptic appeal. The three most important characteristics of cheese as a food system are its moderate acidity, high buffering capacity and lipid matrix. The unique properties of cheese allow it to be considered an optimal system for the delivery of probiotic microorganisms to the gastrointestinal tract [1]. Unlike fermented milk drinks, semi-hard cheeses protect probiotics from the stomach because they are ripened for a long time and have a stable structure. This enhances their survival rate and facilitates effective delivery to the intestine [2].
However, there are a number of limitations when it comes to using probiotic cultures in the production of semi-hard cheeses. The viability of probiotics can be reduced and the proteolytic balance disrupted by high concentrations of salt, low redox potential and microbial competition with traditional starter cultures [3]. Heat treatment is also a critical factor, highlighting the need to select cultures that are resistant to stress [4]. It is important to note that even when viability is maintained, probiotics can negatively affect the organoleptic properties of cheese. This can cause excessive softening of the texture. It can also cause crumbly consistency. In some cases, a bitter aftertaste may develop due to enhanced proteolysis [5].
of particular scientific interest, and this is an area of research that is of great interest to scientists. As the ripening process continues, the caseins are subject to a process of enzymatic hydrolysis, which leads to the creation of bioactive peptides. These bioactive peptides possess radical-scavenging properties [6]. Some strains of lactic acid bacteria are capable of enhancing this process through the secretion of extracellular proteases and the production of metabolites (e.g. phenolic compounds) that possess direct antioxidant activity [7].
The genus Limosilactobacillus has attracted the attention of researchers due to its high resistance to acid and bile, and its ability to adhere to the intestinal epithelium [8]. L. fermentum, for example, has been shown to have strong antioxidant activity, which is linked to the production of glutathione and superoxide dismutase, as well as its ability to reduce α-dicarbonyl compounds [9]. Its effectiveness in cheeses has been confirmed by studies: when semi-soft cheese and soft cheese spreads are added to it, high antioxidant activity is retained by the strain, the oxidation of polyunsaturated fatty acids is reduced and reducing properties are exhibited [5,10].
Research into isolating probiotic strains from silage is a promising area of research as the silage microflora is adapted to extreme conditions, such as low pH, high concentrations of organic acids and oxygen deficiency [11,12,13,14]. This suggests that microbes taken from silage can handle more stress, which makes them good for making cheese, where bacteria are exposed to a lot of stress [15]. Given the increased resilience of probiotic strains in the cheese matrix, it is not surprising that various positive health effects of such cheeses on animals have been identified. For example, the consumption of probiotic cheeses may exert an immunomodulatory effect, with a reduction in immunosuppression caused by intense physical exertion [16]. In experiments with rats, consumption of goat’s cheese containing the probiotic Lactococcus lactis reduced the severity of osteoporosis [17]. Changes in the gut microbiome of animals have been observed to occur as a result of the regular consumption of cheese containing Lactococcus and Streptococcus. These changes are characterised by an increase in Firmicutes and a reduction in Bacteroidetes [18].
So, the whole point of this study was to find out what happens when you add a probiotic strain, Limosilactobacillus fermentum AG8, which is isolated from silage, to semi-hard cheese made from cow’s milk during the 60-day ripening period [19]. The objective of the study is twofold: firstly, to extend the range of technologically compatible probiotic cultures, and secondly, to formulate scientifically substantiated recommendations for the production of functional cheeses with augmented functional activity.
2. Materials and Methods
2.1. Strains and Semi-Hard Cow Cheese
Samples of hard cheeses were produced using the following lactic acid bacteria: a control sample (CS – cheese starter) prepared with the commercial starter culture CHOOZIT™ (Danisco, France). The cheese starter is a mesophilic–thermophilic, concentrated, freeze-dried direct-vat-set culture and consists of the following species: Lactococcus lactis subsp. lactis, Lactococcus lactis subsp. cremoris, Lactococcus lactis subsp. lactis biovar diacetylactis, Streptococcus salivarius subsp. thermophilus. In the CS+AG8 sample, the strain Limosilactobacillus fermentum AG8, described previously [19], was added.
Raw cow’s milk (3.6% crude protein, 4% fat, 4.15% lactose) was supplied by a local farm (Kazan, Republic of Tatarstan, Russia). The protein, fat, and lactose contents of the milk were measured using a milk analyzer Klever-M (Russia). The cheese was prepared as follows: upon arrival at the laboratory, the milk was pasteurized. Two batches were prepared for each cheese type at 65 °C for 30 min in a water bath. After cooling to 36 °C, cheeses were made by adding the starter cultures (CS, CS+AG8); the cheese variants are given in Table 1, and the milk was left to ripen for 90 min. All samples were inoculated with the commercial starter culture at a rate of 0.1 g of dry starter, pre-dissolved in 5 mL of skimmed milk, with the addition of 10 mL of an overnight LAB culture (commercial starter or L. fermentum AG8) grown in skimmed milk. The cheese formulation is presented in Table 1.
Then 0.2 ml liquid rennet (50000 UMCU) (Modern Technologies LLC, Raduzhny, Russia), according to the manufacturer, was added to 5 L milk and mixed. The mixture was allowed to coagulate at 36 °C for 30 min. Milk containers were set to rest for about 90 min until a firm coagulum was formed. Afterward, the coagulum was cut with a sterile stainless-steel curd cutter into small pieces (approximately 0.5 × 0.5 × 0.5 cm) to increase the expulsion of moisture from the curd. The curd was set to rest (15–30 min), then the whey was drained off and salt was added. The curd was homogenized into molds, was self-pressed for 1 hour, was pressed under pressure and was set to rest in refrigeration during 12 h. The one half part of cheeses was removed from molds, packaged, and stored at 4 °C during 1 day before testing (1 day) and other part of cheese was ripening during 60 days at 12 °C, air humidity 75% - 80%.
2.2. Determent of Chemical Composition
Evaluation of cheese yields, moisture, fat, and sensory properties of cheese samples Moisture, fat, protein and salt contents were measured by the InfraLUM® FT-12 (Russia) with appropriate software and calibration data for the product “cheese”. The pH was determined by pH meter with a penetration/immersion probe. Dry matter content was determined by the gravimetric method using the moisture analyzer “Evlas-2M” (Russia).
To determine the total titratable acidity (TTA), 5 g of sample was suspended in 20 ml of pure water and titrated with 0.1 M NaOH to a final pH of 8.2, detected by 1% phenolphthalein in ethanol. TTA of samples was expressed in Thorner degrees (̊T).
Fatty acids of cheeses were identified using the gas chromatograph Chromos GC-1000 (Russia) equipped with a flame ionization detector. Analysis conditions: initial column temperature 140 °C, held isothermally for 5 min, final column temperature 240 °C ramped at 4 °C/min; detector temperature 260 °C; injector temperature 230 °C; total analysis time 50 min. A standard mixture of fatty acid methyl esters comprising 37 components at a concentration of 10 mg/mL was used.
For total phenolic compounds (TPCs) analysis, a water extract (WE) was prepared by homogenizing 10 g of cheese in 50 mL distilled water (cheese suspension), extracting for 15 min at 4 °C, filtering through filter paper, and centrifuging at 8000 rpm for 10 min at room temperature. A protein-free extract (PFE) was obtained by adding 0.5 mL of 80% trichloroacetic acid to 10 mL of the aqueous extract to precipitate proteins, followed by centrifugation at 10,000 rpm for 10 min at room temperature after 10 min incubation. The supernatant was used for quantification of TPCs, glucose, and low-molecular-weight hydrolysis products (peptides).
2.3. Microbiological Analyses
Numbers of different groups of microorganisms were analyzed by serial dilutions, the following nutrient media were used: for Lactobacillus - MRS agar (Himedia, India), total lactobacteria-milk agar (Himedia, India). Cultivation after sowing was carried out at 38 °C for 1-3 days, depending on the species of microorganisms.
2.4. Scanning Electron Microscopy
The microstructure properties of cheeses were evaluated by SEM [22]. Briefly, these samples were fixed with 2.5% glutaraldehyde 4-5 h, subsequently washed three times with 0.2 M Na-K phosphate buffer (pH 7.0), then dehydrated using 30%, 40%, 50%, 60%, 70%, and 80% (twice for each concentration) at 15 min, and 95% ethanol dehydrated three times at 30 min. The samples were mounted on metal stubs and coated with gold-palladium alloy (∼10 nm thickness) using the Quorum Q150T ES coating machine. Samples were then observed using a self-emission scanning electron microscope Merlin (Carl Zeiss, Germany) at an acceleration voltage of 5 kV, secondary electrons detector. Magnifications are as indicated at the bottom of each figure.
2.5. Textural Profile Assay, Water-Holding and Water-Adsorbing Capacities
Texture analysis was performed according to [23] with some modifications. Cheese samples were cut into 1 × 1 × 1 cm cubes. Texture profile analysis was conducted at (25 ± 1) °C using a ST-2 Structurometer texture analyzer and ST-Data-TPA software (Quality Laboratory LLC, Russia). Tests were carried out with a 36 mm diameter cylindrical probe that penetrated the samples. Two compression cycles were performed at a speed of 0.5 mm/s, compressing samples to 50% of their original height. The analysis measured hardness (peak force during the first compression), springiness (ratio of the distance the plunger recovers during the second compression to the original compression distance), cohesiveness (ratio of the areas under the second and first compression curves), and chewiness (product of hardness, springiness, and cohesiveness).
To determine the water-holding capacity (WHC), 300–400 mg (M₁) of cheese sample was accurately weighed onto a fat-free filter paper and pressed with a 500 g weight for 10 min at room temperature. After this period, the sample was weighed (M₂) and WHC was calculated as follows:
1. Moisture mass in the sample (mg): W = M × H/100, where H is the sample moisture content (%);
2. WHC (%): WHC = [W - (M₁ - M₂)] / W × 100%.
For water-adsorbing capacity (WAC) determination, 5 g (M₁) of cheese sample was weighed into a pre-weighed centrifuge tube (M₀), 10 mL distilled water was added, and the mixture was left at room temperature for 10 min. The mixture was then centrifuged at 3000 rpm for 10 min, the supernatant was carefully decanted, and the tube with sediment was weighed (M₂). WAC (%) was calculated using the formula:
WAC = [(M₂ - M₀) - M₁] / M₁ × 100%.
2.6. Determination of the Total Amount of Exopolysaccharides (EPS)
Isolation and quantification of exopolysaccharides were carried out as described early [22] with modifications. Briefly, 10 g cheese with 50 ml distilled water was incubated in a flask at 100 °C for 30 min. After cooling until 4 °C, the samples were centrifuged at 7000 rpm for 15 min and 0.5 ml of 85% trichloroacetic acid was added to 10 ml of the supernatant and after 5 min incubation the centrifugation at 8000 rpm for 10 min was carried out. To precipitate the EPS, 5 ml of supernatant was mixed with 15 ml of chilled (-20 °C) ethanol and incubated for 48 h at 4 °C and centrifuged for 10 min at 8000 rpm. The precipitate was dissolved in 5 ml of pure water.
To quantify exopolysaccharides, 400 μl of the sample was mixed with 400 μl of a fresh 5% phenol solution in water, and 2 ml of 96% sulfuric acid was added. Samples were incubated at 30 °C for 10 min, then stirred and left for 10 min. The absorbance was measured at 490 nm, the reaction mixture with pure water added instead of sample served as a reference. The EPS was calculated by using a calibration curve measured with glucose solutions and presented as mg dextrose per g sample.
2.7. Determination of Antioxidant Capacities
The ferric reducing antioxidant power (FRAP) assay was carried out following the procedure described early [22] with modifications. Samples (cheese suspension, WE) were 2-fold pre-diluted for analysis; PFE was used in initial form. Briefly, 1 ml of the sample was mixed with 1 ml of 0.2 M potassium sodium phosphate buffer (pH 6.5) and 1 ml of 1% potassium ferricyanide. The reaction mixture was incubated for 20 min at 50 °C, cooled, and 1 ml of 10% trichloroacetic acid was added. The mixture was centrifuged at 2000 rpm for 10 min at 25 °C; supernatant was diluted twice with water (2 ml +2 ml) and 400 μl of 0.1% FeCl3. For the reference, a buffer was added instead of the potassium ferricyanide. The absorbance was measured at 700 nm (spectrophotometer SF-2000, Russia) and expressed as reducing force, which was expressed as absorbance at 700 nm relative to the control.
The radical-scavenging capacity was analyzed according to[22] with modifications. Briefly, 1 ml of sample (cheese suspension, WE, PFE or EPS) was mixed with 1 ml of freshly prepared DPPH solution (0.12 mM ethanol) and incubated at 25 °C in the dark for 30 min. The reaction mixture was centrifuged for 2 min at 10000 rpm and the absorbance was measured at 517 nm using a spectrophotometer SF-2000 (Russia). As a reference, ethanol has been used, as control absorbance DPPH solution (0.12 mM ethanol) has been used. The radical-scavenging activity was calculated as:
DPPH* scavenging activity % = [(control absorbance – extract absorbance)/ (control absorbance)] × 100%.
The hydroxyl -free radical scavenging capacity was carried out following the procedure described early[21] with modification. Briefly, 0.5 ml of sample (cheese suspension, WE, PFE or EPS) was mixed 0.5 mL 5 mM/L ferrous sulfate (FeSO4) solution, 0.5 mL 5 mM/L salicylic acid ethanol solution, 0.5 mL 3 mM/L hydrogen peroxide solution into 0.5 mL sample, and incubation at 37 °C for 30 min, 10000 r/min, centrifugation for 5 min, and took the supernatant OD510 nm as B1, ddH2O was used to replace the cell suspension of cell-free extract as the control group, and OD510 nm was measured as B0.
OH* scavenging activity (inhibition)% = (B0-B1)/ B0 × 100%.
2.8. Evaluation of Peroxide Value of Fat
The peroxide value was determined as described early [24]. The cheese samples (3 g) were weighed in a 100-mL glass stopper Erlenmeyer flask. Then it was heated for 3 min at 60 °C in a water bath to melt the fat and the flask was thoroughly agitated for 3 min with 30 mL acetic acid-chloroform solution (3:2 v/v) to dissolve the fat. The cheese particles were removed by filtration through the Whatman filter paper N1. The saturated potassium iodide solution (0.5 mL) and the starch solution were added to the filtrate. The titration was continued by standard solution of sodium thiosulfate. POV was calculated by the following equation and expressed as milli equivalent peroxide per kilogram of sample: POV (meq / kg) = ((S × N) / W) × 100 where “S” is the volume of titration (ml), “N” is the normality of sodium thiosulfate solution (M=0.01) and “W” is the sample weight (g).
2.9. Evaluation of Thiobarbituric Acid Reactive Substance (TBARS)
The 2-thiobarbituric acid (TBA) values were determined as described early [25]. The samples (2 g) were blended with 10 mL of 20% trichloroacetic acid solution (200 g/L of trichloroacetic acid in 135 mL/L phosphoric acid solution) in a homogenizer for 30 s. The cheese particles were removed by filtration through the Whatman filter paper N4. Then 2 mL of 0.02 M aqueous TBA solution (3 g/L) was added to 2 mL of filtrate in a test tube. After that, test tubes were incubated at 100 °C for 30 min and cooled with tap water. The absorbance of supernatant solutions was measured at 532 nm using a UV-VIS spectrophotometer (SF-2000, Russia). The TBA values were calculated from a standard curve and expressed as mg malonaldehyde per kilogram (MA/kg) of sample.
2.10. Evaluation of Free Fatty Acid Value
Free fatty acid value was determined according to the AOCS Official Method [26]. The sample (5 g) was dissolved with 30 mL chloroform using a homogenizer at 10,000 rpm for 1 min. The cheese particles were removed by filtration through the Whatman filter paper N1. After the addition of five drops of 1% phenolphthalein solution (in EtOH) as indicator, the titration was performed with 0.01 N potassium hydroxide solutions. FFA value was calculated as follows:
FFA (%) = (mL titration × Molarity of KOH × 28.2) /g of sample.
2.11. α-Glucosidase and Lipase Inhibitory Activity
The in vitro α-glucosidase inhibitory activity was done according to the method described early [27,28] with modification. The α-glucosidase inhibitory effect of the EPS was evaluated by using p-nitro-phenyl-α-D-glucopyranoside (p-NPG) substrate solution (0.5 mg∙mL-1 in 0.1 M potassium phosphate buffer, pH 6.8). Testing was conducted in 96-well plates. EPS samples were preliminarily diluted twofold five times to determine EC50. EPS sample (80 µL), and ⍺-glucosidase solution (40 µL) were mixed. After pre-incubation at 37 °C for 10 min, 80 µL pNPG was added as the substrate, and an enzymatic reaction was performed at 37 °C for 60 min. ⍺-Glucosidase activity was determined by measuring the release of p-nitrophenol from pNPG at 410 nm (LISA microplate reader, China). A solution without the EPS was used as a control. A solution without the substrate was used as a blank. The inhibition percentage was calculated as follows: Glucosidase inhibition, % = (Ac – As)/ Ac × 100, where (Ac) is the absorbance of the control and (As) is the absorbance of sample in the presence of the test substance.
The lipase inhibition activity of EPS was determined by a method described early [27,28] with modification. The p-nitrophenyl butyrate (NPB) was using as a substrate. Testing was conducted in 96-well plates. EPS samples were preliminarily diluted twofold five times to determine EC50. Lipase solution (100 µg∙mL-1) was prepared in a 0.1 mM potassium phosphate buffer (pH 6.0). EPS sample (100 µl) were mixed with lipase solution (100 µl) for pre-incubation at 10 min at 37 °C. The reaction was started by adding 20 µl NPB substrate in acetonitrile. After incubation at 37 °C for 15 min, the amount of p-nitrophenol released in the reaction was measured at 410 nm. The results were expressed as percentage inhibition, which was calculated as: Lipase inhibition, % = (Ac – As)/Ac × 100, where (Ac) is the absorbance of the control and (As) is the absorbance of sample in the presence of the test substance.
2.12. Statistical Analysis
All analyses were performed in three-five repetitions. Statistical significance of the results was determined at P < 0.05. Effective concentration for enzyme inhibition was calculated for α-glucosidase and lipase inhibitory activity using Origin8_2021 software. Principal component analysis, Spearman’s correlation analysis, cluster analysis and Partial Least Squares (PLS-DA) were performed to maximise the distinction between the Control and AG8 cheese variants.
3. Results
3.1. Сheese Composition
Table 2 presents the changes in basic chemical composition of the control cheese (SC) and the probiotic cheese (SC+AG8) during 60 days of ripening. At day 3, the cheeses differed markedly in moisture and fat content: SC+AG8 had a significantly higher moisture level and lower fat percentage than SC, suggesting that the addition of L. fermentum AG8 [27,29] and the associated EPS production slightly modified syneresis and curd contraction in the early stages of ripening. By day 10, both cheeses showed an increase in fat content and a decrease in moisture, reflecting typical semi-hard cheese ripening; however, SC+AG8 generally maintained marginally higher moisture values than SC, which is consistent with improved water retention in the protein–fat matrix due to the presence of exopolysaccharides.
Lactic acid concentration increased from day 3 to day 10 in both cheeses, reaching a maximum at day 10, but SC+AG8 cheese tended to have slightly lower lactic acid values at almost all time points, with several differences being statistically significant. This indicates that the adjunct AG8 culture did not cause excessive acidification and may have contributed to a more controlled acid development compared with the control starter alone.
Protein content gradually decreased during ripening in both variants, which reflects progressive proteolysis and moisture loss, but SC+AG8 consistently exhibited somewhat lower protein values than SC at later stages (45–60 days), again pointing to higher water binding and a more hydrated matrix.
Salt content was similar between cheeses and increased slightly by day 60, with a few time points showing significant differences; these minor variations are likely related to small differences in brining and water phase composition rather than to the probiotic per se. Overall, strain AG8 did not drastically change the gross chemical composition but slightly modulated moisture, acidity, and protein dynamics in a way compatible with functional semi-hard cheeses.
As shown in Figure 1, the percentage of individual fatty acids (C4:0–C22:0) at the end of ripening is summarised. Generally, SC+AG8 showed a tendency towards a higher proportion of certain short-chain fatty acids. These are important contributors to cheese flavour and may reflect enhanced lipolysis mediated by the adjunct L. fermentum strain. Simultaneously, the levels of unsaturated fatty acid cis-oleic (C18:1) increased marginally in the SC+AG8 sample compared to the SC sample.
This suggests that AG8 does not exacerbate the oxidation of unsaturated lipids and may even contribute to their preservation during the ripening process.
The fatty acid profile was slightly altered by the probiotic supplement, with a shift towards a composition that is more flavour-active and potentially more nutritionally beneficial, without leading to excessive accumulation of free fatty acids, which are associated with rancidity. The presence of butyric and other short-chain acids in SC+AG8 is consistent with the increased lipolytic activity often reported for adjunct lactobacilli. This can contribute to the development of a more complex and piquant flavor profile in semi-hard cheeses. At the same time, the balanced presence of palmitic (C16:0), stearic (C18:0) and unsaturated fatty acids indicates that the fat phase remained structurally stable and that AG8 did not disrupt the general lipid architecture of the product.
Figure 2 shows the concentration of phenolic compounds in the water extract of cheeses during the ripening process. In both the SC and SC+AG8 variants, the total phenolic content increased markedly from day 3 to day 30–45. This reflects the progressive release of phenolic-like compounds and other reducing substances from the cheese matrix during the processes of proteolysis and lipolysis. However, at most time points, the SC+AG8 variant had higher phenolic concentrations than SC, with several differences reaching statistical significance, especially during the middle of ripening.
By day 60, phenolic concentration in the water extract of SC+AG8 remained elevated compared with the control, suggesting that the adjunct strain contributed to the production or release of phenolic-like metabolites and small antioxidant molecules. This can be explained by AG8-mediated breakdown of milk proteins and lipids, as well as potential transformation of milk-derived or added bioactive compounds into more soluble forms. From a functional perspective, the higher content of phenolic compounds in the probiotic cheese variant indicates a greater antioxidant potential of the aqueous phase, which may be relevant for both product stability and health-related properties.
Figure 3 presents the changes in phenolic compounds (A), peptide content (B, absorbance at 340 nm), and glucose concentration (C) in the protein-free extract (PFE) of cheeses. The concentration of phenolic compounds in PFE increased with ripening in both cheeses, but SC displayed higher values than SC+AG8 at almost all sampling times, with statistically significant differences at several points. This confirms that not only the total water extract but specifically the protein-free fraction of the probiotic cheese contains more low-molecular-weight phenolic-like substances, which are easily diffusible and bioavailable.
The amount of low-molecular-weight peptides increased over time in both cheeses (Figure 3B), indicating ongoing proteolytic activity, but SC consistently showed slightly higher peptide levels than SC+AG8, particularly at 30–60 days, where differences were statistically significant. These data suggest that AG8 enhances secondary proteolysis, generating small peptides that may contribute to taste (bitterness, umami) and bioactivity, including antioxidant and ACE-inhibitory effects. The glucose levels (Figure 3C) in both cheese samples were relatively low at early stages but increased during ripening (3045 days) and then one decreased at the 60 day. This may be associated with the degradation of residual lactose and other carbohydrates into smaller sugars and fermentation products by the starter culture. The addition of L. fermentum AG8 intensifies the generation of low-molecular-weight metabolites—phenolics, peptides, and sugars—thus reinforcing the functional profile of the cheese.
3.2. Structural and Textural Profile of Cheeses
Figure 4 illustrates the evolution of water-holding capacity (WHC, A) and water-adsorbing capacity (WAC, B) of cheeses during ripening. For both parameters, the probiotic cheese SC+AG8 showed smaller values than the control at 3 days, and multiple differences were statistically significant (p < 0.05). WHC in SC+AG8 sample increased moderately with ripening and WHC in SC+AG8 reached higher percentages 45-60 days, indicating that the matrix of the probiotic cheese retained a larger proportion of water under the same conditions. This enhanced WHC is consistent with the presence of EPS produced by AG8, which can bind water and stabilize the gel network.
Similarly, WAC increased with ripening and was higher in SC than in SC+AG8, especially at the 3–30 days. In this period the cheese structure without probiotic strain had a greater ability to re-adsorb water. At later stages of ripening, the WAC indicator decreased in both cheeses and was at the level of 46-49%. The combination of higher WHC and WAC after 60 days of ripening implies that the AG8-containing matrix is more hydrated, less prone to syneresis, and better able to maintain desirable juiciness and mouthfeel throughout storage. From a technological standpoint, these properties are particularly valuable for semi-hard cheeses, as they help balance firmness and elasticity and reduce the risk of dryness or crumbly texture in prolonged ripening.
The texture profile parameters of the cheeses during ripening were shown at Figure 5. Hardness increased in both cheeses as ripening progressed, reflecting proteolysis and water loss, but SC+AG8 showed a less pronounced increasing in hardness, especially at 10–45 days, where values were significantly lower than in SC. This indicates that the probiotic cheese develops a softer, more tender body, which is often appreciated in semi-hard, adjunct-culture cheeses. At the same time, springiness (Figure 5B) and cohesiveness (Figure 5C) were higher in SC+AG8 than in SC at mid and late ripening, suggesting that despite being softer, the probiotic cheese is more elastic and structurally integrated.
Resilience (Figure 5D), which characterizes the ability of the cheese to recover after deformation, also tended to be higher in SC+AG8 at several time points, indicating a more dynamic and less brittle matrix. Chewiness (Figure 5E) and gumminess (Figure 5F) decreased during ripening for both variants but followed different trajectories. In SC, these parameters remained relatively high at later stages, reflecting a denser structure, whereas SC+AG8 exhibited lower chewiness and gumminess, consistent with a smoother and creamier perception in the mouth. Taken together, the texture profile indicates that AG8 addition leads to a softer yet more elastic cheese with improved biting and chewing properties, which can be associated with the combined effects of EPS production, modified proteolysis, and altered water distribution.
The microstructure of control cheese exhibits a relatively compact, homogeneous protein matrix with smaller and more uniformly distributed pores, which is typical for semi-hard cheeses produced with conventional starters only (Figure 6). In contrast, the SC+AG8 microstructure is more open and porous, with larger voids and channels and a more irregular arrangement of the protein network. These features suggest that the adjunct lactobacilli and their metabolites, including EPS, influenced casein aggregation and the pattern of proteolysis during ripening.
The presence of microcavities and a more heterogeneous structure in SC+AG8 can explain the lower hardness and higher water retention observed in the texture and hydration measurements. The EPS produced by AG8 likely forms a weak gel within the casein network, increasing the network’s flexibility and its capacity to entrap water and small solutes. In addition, the altered microstructure may facilitate diffusion of salt, lactic acid, and bioactive metabolites, contributing to a more uniform ripening process.
Overall, the microstructural evidence is in line with the macroscopic physicochemical and textural differences between SC and SC+AG8 and supports the conclusion that the adjunct probiotic strain significantly modifies the internal architecture of the cheese matrix.
3.3. Count of LAB
The viability of cells in the cheese matrix is a key factor in improving the survival of probiotics in the human gastrointestinal tract and enhancing the functionality of the dairy product. This protective effect stems from the cheese’s natural buffering capacity and nutrient-rich environment, which shields the probiotics from the acidic conditions and bile salts present during digestion. Cheeses started with high LAB counts (approximately 9–10 log CFU/g) on skim milk agar (Figure 7) and maintained them throughout ripening. However, SC+AG8 often showed slightly higher counts than SC at intermediate time points, indicating that the adjunct strain survived and was active in the cheese environment. The differences at some time points were statistically significant, confirming that AG8 did not negatively affect the main starter population and contributed to the overall LAB load.
On selective MRS agar, which targets lactobacilli, SC+AG8 exhibited substantially higher cell counts than SC at all stages, with differences of about 1–2 log CFU/g, and these were significant across the ripening period. This demonstrates the successful implantation and persistence of L. fermentum AG8 in the cheese matrix during at least 60 days, which is essential for probiotic functionality. The sustained high counts of lactobacilli in SC+AG8 indicate that the cheese can be considered a potential carrier of live probiotic cells, while the control cheese remains dominated by traditional starter LAB with lower lactobacillus levels.
3.4. Оxidative State of Milk Fat and Antioxidant Properties
The degree of dairy fat preservation during cheese ripening directly influences the shelf life of the finished product. Lipolytic activity from starter cultures and endogenous enzymes can lead to free fatty acid release, promoting off-flavors and oxidative rancidity if uncontrolled. The free fatty acid (FFA) levels increased in both cheeses as ripening progressed, reflecting lipolysis (Figure 8). However, SC+AG8 often showed slightly lower FFA values compared with SC at the later stages, suggesting that the release of free fatty acids was not excessive in the probiotic cheese and remained under control. The peroxide value (POV), which reflects primary lipid oxidation, rose early in ripening but remained lower in SC+AG8 than in SC at most time points, indicating better protection of milk fat against peroxidation in the presence of AG8.
The thiobarbituric acid reactive substances (TBARS), representing secondary oxidation products, followed a similar pattern: TBARS values increased during ripening, but the SC+AG8 cheese consistently exhibited significantly lower TBARS levels than the control at mid and late stages. This indicates that the probiotic cheese experienced less oxidative degradation of lipids, which is consistent with the higher phenolic content and antioxidant activity observed in the extracts. From a practical standpoint, the improved oxidative stability of SC+AG8 can contribute to longer shelf life, better flavor stability, and preservation of nutritional quality, especially regarding unsaturated fatty acids.
The ferric reducing antioxidant power (FRAP) was detected in three types of samples (Figure 9): cheese suspension (A), water extract (B), and protein-free extract (C) over the ripening period. In all three matrices, FRAP values decreased from day 3 to day 30–45, reflecting the metabolised of reducing agents such as sugars, peptides, phenolics, and other secondary metabolites during cheese maturation. At each time point excluded 3 day, SC+AG8 showed higher FRAP values compared with SC, and the differences were statistically significant at several points, particularly at 60 days.
In cheese suspension (Figure 9A), the higher FRAP of SC+AG8 indicates that the whole cheese environment has a greater capacity to reduce ferric ions, which is a global indicator of antioxidant potential. In water extract (Figure 9B), the differences between cheeses are even less apparent, suggesting that water-soluble antioxidant compounds are less abundant in the probiotic cheese. The protein-free extract (Figure 9C) shows that low-molecular-weight, non-protein antioxidants are also present at higher concentrations in SC+AG8 than in SC. These results confirm that AG8 stimulates the production or release of reducing, antioxidant-active metabolites that improve the overall redox status of the cheese and may contribute to health-promoting properties when consumed.
The DPPH radical-scavenging activity like a FRAP was measured in cheese suspension, water and protein-free extracts during ripening (Figure 10). DPPH inhibition increased during 3-30 days at testing of cheese suspension, which unparallels to amount of FRAP. The SC+AG8 and SC cheeses demonstrated similar DPPH-scavenging during the ripening period, with significant differences at several time points (10 and 30 days). In water extracts, DPPH inhibition in SC+AG8 sample was higher than SC it, indicating a stronger radical-quenching capacity of the water-extractability components of probiotic cheese.
The protein-free extracts of both cheese showed similar trends. The increase in radical-scavenging activity in the cheese protein free extract after 30-45 days of ripening may be attributed to the accumulation of low-molecular-weight metabolites (such as bioactive peptides, organic acids, phenolic-like substances, and exopolysaccharides). These compounds play a key role in the antioxidant capacity of the probiotic cheese. Combined with FRAP and phenolic data, Figure 10 confirms that the addition of L. fermentum AG8 significantly enhances the radical-scavenging potential of the cheese, which is beneficial for both product stability and potential functional properties in vivo.
Table 3 summarizes the characteristics of the exopolysaccharide (EPS) fraction isolated from control and probiotic cheeses. The amount of EPS was approximately threefold higher in SC+AG8 than in SC (1123.97 vs 359.56 μg/g cheese, p < 0.05), clearly demonstrating that L. fermentum AG8 is an efficient EPS producer in the cheese matrix. This elevated EPS content is consistent with the improved water-binding, texture, and microstructural features described above.
Interestingly, the EPS fraction from cheeses also exhibited markedly stronger antioxidant activity. Unfortunately, DPPH radical-scavenging of SC+AG8 EPS at 1 mg/mL was about twice as less as in the control (56.37% vs 28.13%, p < 0.05), and hydroxyl radical-scavenging activity showed a similar trend (32.0% vs 18.0%, p < 0.05).
In addition to antioxidant properties, the EPS from cheeses displayed significant inhibitory effects against digestive enzymes. The EC50 values for lipase and glucosidase inhibition were substantially higher in the probiotic SC+AG8 EPS fraction compared with the control EPS, indicating that much smaller amounts of control EPS were required to achieve 50% inhibition.
Overall, Table 3 demonstrates that L. fermentum AG8 increases EPS production in cheese ripening. However, the quality of synthesized EPS in terms of antioxidant properties was inferior to the EPS in the control cheese variant.
3.4. PCA, Cluster Analyse, PLS-DA and Correlation
PCA and cluster analysis were performed on the dataset obtained for composition, texture, bacterial count and antioxidant properties (see Figure 11). The differences between the cheese samples were found to be driven by PC1 (‘Maturation factor’), with the highest loadings observed for cohesion, resil, moisture, springiness, fat content, hardness, pH value, lactic acid bacteria (LAB) and salt content. Taken together, these parameters describe the progression of structural and physicochemical changes during the 60-day cheese maturation process. PC2, the ‘antioxidant-lipid factor’, is determined by reducing power, lactic acid level, phenolic compounds, the suspension’s radical-scavenging activity and free fatty acid content. The combination of these data reflects the antioxidant activity and oxidative status of the samples. The third factor, PC3, contributes an additional 18.7%, and PC1, PC2 and PC3 together account for 79%.
Cluster analysis (Figure 11C) revealed that the control and AG8 cheese samples were initially grouped into distinct pairs, which confirms the significant impact of time on sample similarity. Pairwise clustering of the control and AG8 samples over time (three control and three AG8 samples, ten control and ten AG8 samples, and so on) indicates that the maturation time factor has a stronger effect on separating the samples than the AG8 starter culture factor. This is consistent with PCA: the samples move along PC1 (the maturation factor), while the AG8 and Control samples are separated along PC2 (the antioxidant profile).
PLS-DA analysis (Figure 12AB) enabled the control and AG8 samples to be separated as effectively as possible, which could not be achieved using PCA alone. A clear separation of the groups is evident on LV1 (the X-axis): the majority of the AG8 samples are shifted to the left (negative LV1 values), while the control samples are shifted to the right. However, the small number of images must be taken into account as the calculation was based on mean values; therefore, cross-validation is unstable and the model should be interpreted with caution. The maturation time factor (~60 days) overlaps the group separation on LV2.
The VIP (Variable Importance in Projection) analysis identified the seven most significant variables (VIP > 1.0), which provide insight into the differences between the Control and AG8 cheese variants. An analysis of the key factors influencing differences in cheese properties identified the following parameters: peptide and total phenolic compound content in the protein-free extract (Pept = 2.08 and TPC_(PFE) = 1.58, respectively); water-absorbing capacity (WAC = 1.98); radical-scavenging activity of the aqueous extract (DPPH_(ext) = 1.93); lactic acid bacteria content (LAB_(MRS) = 1.53); protein content (Prot = 1.49); and free fatty acid content (FFA = 1.26). These variables are the most informative for distinguishing the effect of the L. fermentum AG8 starter culture from the control.
Correlation analysis (Figure 12C) revealed 12 significant correlations that can be categorised based on their biological relevance. Firstly, a correlation was identified between the population of lactic acid bacteria (LAB) and the structure and oxidation state of the cheese, as indicated by firmness, moisture content, and malondialdehyde levels.
The more LAB cells there are, the softer the cheese is, because these cells increase the breakdown of protein, which makes the cheese less firm. A protein gel of reduced density exhibits superior moisture retention properties. Retaining moisture within the cheese creates a softer texture. Conversely, a loss of moisture during ripening increases the fat and protein content per unit mass of cheese, which is a classic example of the relationship between volume and density. The reduction in MDA indicates the antioxidant function of AG8: this strain inhibits the peroxidation of fats.
The subsequent group of relationships can be categorised under the overarching designation of ‘oxidation and texture’. A strong positive correlation (r = +0.818) was found between lipid oxidation and stiffness, which may lead to the cross-linking of proteins under conditions of increased oxidative stress. As moisture is lost during ripening, malondialdehyde accumulates (concentrates), so there is also a strong correlation (+0.867) between these parameters. The presence of free fatty acids is often associated with the firmness of cheese, which is a well-known indicator of its ripening stage.
In terms of antioxidant properties, correlations were found between antiradical and reducing activities, which is not surprising given that both serve as indicators of increased antioxidant activity. Furthermore, both parameters correlate with the amount of polyphenolic compounds present. In the protein-free extract, peptide formation was found to correlate with phenolic content, suggesting that proteolysis and antioxidant activity are related processes. This highlights the role of milk protein metabolites and de novo synthesised compounds by lactic acid bacteria in imparting antioxidant properties to cheese.
An analysis of the results obtained in this study makes it possible to propose a mechanism by which L. fermentum AG8 acts on cheese during the ripening process. The strongest correlations were found between LAB_MRS and MDA (r = −0.74) and between LAB_MRS and HARD (r = −0.78). These correlations provide the most compelling evidence for the probiotic’s mechanism of action. The results suggest that a higher abundance of L. plantarum AG8 is linked to a decrease in oxidative stress (MDA) and a softer texture. This is thought to be due to the strain’s proteolytic and antioxidant activity.
4. Discussion
The potential use of non-starter lactic acid bacteria (NSLAB) in cheese production has long been a topic of discussion. While their role in the early stages of cheese production is not particularly noticeable, as demonstrated by BrigImparfait-Marcó et al. (2007) [30], Kocaoglu-Vurma et al. (2008) [31] and Barreto Pinilla et al. (2024) [32], NSLAB play a significant role in the middle and late stages of cheese ripening. The use of a non-starter strain of Limosilactobacillus (formerly Lactobacillus) fermentum AG8, isolated from silage, as a co-culture in the production of semi-hard cheese from cow’s milk using CHOOZIT starter culture (control CS) is described in this article. We previously described this strain as a probiotic LAB; its whole genome was sequenced [33] and its ability to produce antibacterial peptides was identified. Furthermore, the inclusion of fermented L. fermentum AG8 sour cream in the diet of mice had a positive effect on lipid metabolism, reducing harmful lipid fractions (LDL and VLDL) and increasing beneficial HDL levels while reducing gut coliform bacteria[34].
The addition of L. fermentum AG8 to the cheese starter culture had a number of technological consequences. During the early stages of cheese ripening (3–10 days), there was an increase in moisture content and a decrease in fat and protein levels. However, acidity levels decreased and this is not surprising, as most non-starter strains have a lower lactic acid accumulation rate than starter cultures[35]. Conversely, the incremental escalation in acidity facilitates enhanced command of the fermentation process during the maturation phase.
An increase in the levels of short-chain fatty acids (C4:0, C6:0), unsaturated fatty acids and the total content of phenolic compounds was observed in CS_AG8 cheese (an increase of 20–50% by 60 days), as well as an increase in low-molecular-weight peptides and glucose in the protein-free extract. A link has been identified between an increase in short-chain fatty acid content and AG8-mediated lipolysis. This process improves flavour characteristics without leaving an unpleasant aftertaste. In the Edam cheese model, the addition of the probiotic Lacticaseibacillus casei VC201 had a negligible effect on the cheese’s fatty acid composition [36], but an intensification of proteolytic processes was observed. The same results were obtained when the probiotic strain Lactobacillus mucosae DPC 6426 was added to the starter culture for Cheddar or Swiss cheeses [37]. In these cheeses, the level of free amino acids increased, indicating enhanced proteolysis. However, no change in the cheese’s flavour was observed after ripening.
The moderate increase in moisture content and EPS, and the resulting decrease in hardness and chewiness of the semi-hard cheese in the L. fermentum AG8 (CS_AG8) treatment, are consistent with previous reports on Cheddar cheese [38]. The ability of L. fermentum AG8 to synthesise EPS on various substrates has been reported on before [Nikitina, 2025]. That study demonstrated the role of the EPS-synthesising strain L. lactis subsp. cremoris DPC6532 (EPS+) in shaping cheese texture by increasing the cheese matrix’s moisture-retention capacity. As shown earlier, the formation of a cheese matrix with a higher moisture content alters the cheese’s textural properties, affecting its sensory characteristics [23]. The increase in antioxidant activity in cheese components is undoubtedly linked to L. fermentum AG8’s ability to synthesise biologically active peptides [33]. Several authors have written about the role of the bacterium Limosilactobacillus fermentum in producing antibacterial, antidiabetic and antioxidant peptides during the fermentation of cheese [39,40,41]. Furthermore, as we have demonstrated, the ability of L. fermentum AG8 to increase the overall antioxidant activity of cheese is due to the increased release of phenolic compounds and low-molecular-weight peptides during the ripening process. The antioxidant role of L. fermentum ME-3 in the production of ‘Pikantne’ semi-soft cheese has previously been reported[10]. It has also been reported that other probiotics play a role in the formation of components that protect against reactive oxygen species in cheese. [42]. Despite the high antioxidant activity, the maintenance of high cell viability of the probiotic L. fermentum AG8 and starter microorganisms during ripening remains crucial; cell counts more than 10^7 CFU/g indicate the strong potential of this strain for inclusion in a meso-thermophilic starter culture for semi-hard cheeses.
5. Conclusions
The technological and functional properties of semi-hard cheese are positively affected by the addition of the Limosilactobacillus fermentum AG8 strain to the starter culture during production. The probiotic culture increases moisture retention, improves texture and promotes the formation of a more porous microstructure in the cheese. Additionally, increased antioxidant activity and the accumulation of biologically active compounds were observed during ripening. The results show that L. fermentum AG8 is a good choice as a functional additive for making cheeses with better properties and the potential to be probiotic.
Author Contributions
Conceptualization, methodology, writing—original draft preparation, review and editing, visualization, supervision, funding acquisition - E.V.N., investigation, writing—original draft preparation – N.M.A., investigation, writing—original draft preparation, visualization – Ed.Sh.Y.
Funding
The work was carried out with the financial support of the Russian Science Foundation (RSF project-26-14-00455).
Institutional Review Board Statement
Not applicable.
Informed Consent Statement
Not applicable.
Data Availability Statement
We encourage all authors of articles published in MDPI journals to share their research data. In this section, please provide details regarding where data supporting reported results can be found, including links to publicly archived datasets analyzed or generated during the study. Where no new data were created, or where data is unavailable due to privacy or ethical restrictions, a statement is still required. Suggested Data Availability Statements are available in section “MDPI Research Data Policies” at https://www.mdpi.com/ethics.
Acknowledgments
In this section, you can acknowledge any support given which is not covered by the author contribution or funding sections. This may include administrative and technical support, or donations in kind (e.g., materials used for experiments).
Conflicts of Interest
The authors declare no conflicts of interest.
References
- Mohammadzadeh, M.; Moayedi, A.; Khomeiri, M.; et al. Exploring the probiotic properties of Lactiplantibacillus pentosus and gamma aminobutyric acid production for cheese development. Appl. Food Res. 2025, 5(1), 100817. [Google Scholar] [CrossRef]
- Balthazar, C.F.; Gentès, M.C.; Mikhaylin, S.; et al. Functionality and Bioactivity of Probiotic Semi hard Cheese Made from Milk Treated by Pulsed Electric Field. Food Bioprocess Technol. 2025, 18, 7131 7148. [Google Scholar] [CrossRef]
- Metrouh, R.; Fares, R.; Mechai, A.; Debabza, M.; Menasria, T. Technological properties and probiotic potential of Lactiplantibacillus plantarum SJ14 isolated from Algerian traditional cheese “Jben”. J. Food Process. Preserv. 2022, 46, e16482. [Google Scholar] [CrossRef]
- Minervini, F.; Siragusa, S.; Faccia, M.; Dal Bello, F.; Gobbetti, M.; De Angelis, M. Manufacture of Fior di Latte cheese by incorporation of probiotic lactobacilli. J. Dairy Sci. 2012, 95(2), 508 520. [Google Scholar] [CrossRef] [PubMed]
- Albenzio, M.; Santillo, A.; Caroprese, M.; Marino, R.; Trani, A.; Faccia, M. Biochemical patterns in ovine cheese: influence of probiotic strains. J. Dairy Sci. 2010, 93(8), 3487 3496. [Google Scholar] [CrossRef] [PubMed]
- Yang, W. Evaluation of the antioxidant activity and identification of potential antioxidant peptides in commercially available probiotic Cheddar cheese. LWT 2024, 205, 116486. [Google Scholar] [CrossRef]
- Gu, X.; Wang, H.; Wang, L.; et al. The antioxidant activity and metabolomic analysis of the supernatant of Streptococcus alactolyticus strain FGM. Sci. Rep. 2024, 14, 8413. [Google Scholar] [CrossRef] [PubMed]
- Hao, H.; Nie, Z.; Wu, Y.; Liu, Z.; Luo, F.; Deng, F.; Zhao, L. Probiotic Characteristics and Anti Inflammatory Effects of Limosilactobacillus fermentum 664 Isolated from Chinese Fermented Pickles. Antioxidants 2024, 13, 703. [Google Scholar] [CrossRef] [PubMed]
- Yaikhan, T.; Wonglapsuwan, M.; Pahumunto, N.; Nokchan, N.; Teanpaisan, R.; Surachat, K. Probiogenomic analysis of Limosilactobacillus fermentum SD7, a probiotic candidate with remarkable aggregation abilities. Heliyon 2025, 11(3), e42451. [Google Scholar] [CrossRef] [PubMed]
- Songisepp, E.; Kullisaar, T.; Hütt, P.; Elias, P.; Brilene, T.; Zilmer, M.; Mikelsaar, M. A new probiotic cheese with antioxidative and antimicrobial activity. J. Dairy Sci. 2004, 87(7). [Google Scholar] [CrossRef] [PubMed]
- Heinl, S.; Wibberg, D.; Eikmeyer, F.; Szczepanowski, R.; Blom, J.; Linke, B.; Goesmann, A.; Grabherr, R.; Schwab, H.; Pühler, A.; Schlüter, A. Insights into the completely annotated genome of Lactobacillus buchneri CD034, a strain isolated from stable grass silage. J. Biotechnol. 2012, 161(2), 153 166. [Google Scholar] [CrossRef] [PubMed]
- Fugaban, J.I.I.; Vazquez Bucheli, J.E.; Park, Y.J.; Suh, D.H.; Jung, E.S.; Franco, B.D.G.M.; Ivanova, I.V.; Holzapfel, W.H.; Todorov, S.D. Antimicrobial properties of Pediococcus acidilactici and Pediococcus pentosaceus isolated from silage. J. Appl. Microbiol. 2022, 132(1), 311 330. [Google Scholar] [CrossRef] [PubMed]
- Zeng, H.; Liu, Y.; Huang, K.; Chen, H.; Yang, B.; Wang, J. Lactiplantibacillus plantarum A1, C1 and C10 Are Potential Probiotics Isolated from Pineapple Residual Silage. Microorganisms 2022, 11(1), 29. [Google Scholar] [CrossRef] [PubMed]
- Silva, Y.A.; Cardoso, M.V.S.B.; Carvalho, B.F.; Schwan, R.F.; Ávila, C.L.S. Lactic acid bacteria strains isolated from rehydrated corn grain silage enhance the chemical and microbiological characteristics and aerobic stability of these silages. J. Appl. Microbiol. 2025, 136(8), lxaf185. [Google Scholar] [CrossRef] [PubMed]
- Zhang, C.; Quan, X.; Lian, W.; Liu, R.; Wen, Q.; Chen, X. Phenotypic characterization and genomic analysis of Limosilactobacillus fermentum phage. Curr. Res. Food Sci. 2024, 8, 100748. [Google Scholar] [CrossRef] [PubMed]
- Lollo, P.C.; Cruz, A.G.; Morato, P.N.; Moura, C.S.; Carvalho Silva, L.B.; Oliveira, C.A.; Faria, J.A.; Amaya Farfan, J. Probiotic cheese attenuates exercise induced immune suppression in Wistar rats. J. Dairy Sci. 2012, 95(7), 3549 3558. [Google Scholar] [CrossRef] [PubMed]
- Liu, S.; Li, C.; Lv, Y.; Xue, S.; Zhao, K.; Chang, H.; Zhao, H.; Jin, B.; Ding, A.; Zhao, Y.; Wei, M.; Yuan, H.; Wang, S.; Sun, Y. Butyrate producing Lactococcus lactis fermented goat cheese enhances bone health and reduces osteoporotic bone loss. J. Dairy Sci. 2025, 108(9), 9048 9061. [Google Scholar] [CrossRef] [PubMed]
- Lu, S.; Gao, M.; Kuttappan, D.; Amalaradjou, M.A. Low Fat Cheddar Cheese Influences Gut Microbiota Composition and Diversity in Human Microbiota Associated Mice. Foods 2025, 15(1), 66. [Google Scholar] [CrossRef] [PubMed]
- Gavrilova, E.; Anisimova, E.; Gabdelkhadieva, A.; Nikitina, E.; Vafina, A.; Yarullina, D.; Bogachev, M.; Kayumov, A. Newly isolated lactic acid bacteria from silage targeting biofilms of foodborne pathogens during milk fermentation. BMC Microbiol. 2019, 19(1), 248. [Google Scholar] [CrossRef] [PubMed]
- Sungatullina, A.; Petrova, T.; Kharina, M.; Mikshina, P.; Nikitina, E. Effect of flaxseed mucilage on the probiotic, antioxidant, and structural mechanical properties of the different Lactobacillus cells. Fermentation 2023, 9, 486. [Google Scholar] [CrossRef]
- Nikitina, E.; Petrova, T.; Sungatullina, A.; Bondar, O.; Kharina, M.; Mikshina, P.; Gavrilova, E.; Kayumov, A. The profile of exopolysaccharides produced by various Lactobacillus species from silage during not fat milk fermentation. Fermentation 2023, 9, 197. [Google Scholar] [CrossRef]
- Nikitina, E.; Petrova, T.; Vafina, A.; Ezhkova, A.; Yahia, M.N.; Kayumov, A. Textural and functional properties of skimmed and whole milk fermented by novel Lactiplantibacillus plantarum AG10 strain isolated from silage. Fermentation 2022, 8, 290. [Google Scholar] [CrossRef]
- Monsalve Atencio, R.; Sanchez Soto, K.; Chica, J.; et al. Interaction between phospholipase and transglutaminase in the production of semi soft fresh cheese and its effect on the yield, composition, microstructure and textural properties. LWT 2022, 154, 112722. [Google Scholar] [CrossRef]
- Sallam, K.I.; Ishioroshi, M.; Samejima, K. Antioxidant and antimicrobial effects of garlic in chicken sausage. LWT 2004, 37(8), 849 855. [Google Scholar] [CrossRef] [PubMed]
- Schmedes, A.; Hølmer, G. A new thiobarbituric acid (TBA) method for determining free malondialdehyde (MDA) and hydroperoxides selectively as a measure of lipid peroxidation. J. Am. Oil Chem. Soc. 1989, 66(6), 813 817. [Google Scholar] [CrossRef]
- Rukunudin, I.; et al. A modified method for determining free fatty acids from small soybean sample sizes. J. Am. Oil Chem. Soc. 1998, 75, 563 568. [Google Scholar] [CrossRef]
- Mikshina, P.V.; Kharina, M.; Sungatullina, A.; Petrova, T.; Sibgatullin, T.A.; Nikitina, E. Influence of Flaxseed Mucilage on the Formation, Composition, and Properties of Exopolysaccharides Produced by Different Strains of Lactic Acid Bacteria. Int. J. Biol. Macromol. 2024, 281, 136092. [Google Scholar] [CrossRef] [PubMed]
- Khrundin, D.V.; Nikitina, E.V. Effect of Homogenization and Pectin on Chemical, Textural, Antioxidant and Sensory Characteristics of L. bulgaricus Fermented Oat Based Product. Foods 2025, 14, 2615. [Google Scholar] [CrossRef] [PubMed]
- Nikitina, E. Effect of Carbon Source on the Synthesis and Antioxidant Properties of Exopolysaccharides of Lactic Acid Bacteria. BIO Web Conf. 2025, 181, 02021. [Google Scholar] [CrossRef]
- Briggiler Marcó, M.; Capra, M.L.; Quiberoni, A.; Vinderola, G.; Reinheimer, J.A.; Hynes, E. Nonstarter Lactobacillus strains as adjunct cultures for cheese making: in vitro characterization and performance in two model cheeses. J. Dairy Sci. 2007, 90(10), 4532 4542. [Google Scholar] [CrossRef] [PubMed]
- Kocaoglu Vurma, N.A.; Harper, W.J.; Drake, M.A.; Courtney, P.D. Microbiological, chemical, and sensory characteristics of Swiss cheese manufactured with adjunct Lactobacillus strains using a low cooking temperature. J. Dairy Sci. 2008, 91(8), 2947 2959. [Google Scholar] [CrossRef] [PubMed]
- Barreto Pinilla, C.M.; da Silva Oliveira, W.; de Oliveira Garcia, A.; Spadoti, L.M.; Redruello, B.; Del Rio, B.; Alvarez, M.A.; Torres Silva, E.; Alves, A. Brazilian indigenous nonstarter lactic acid bacteria enhance the diversification of volatile compounds in short aged cheese. Lett. Appl. Microbiol. 2024, 77(4), ovae036. [Google Scholar] [CrossRef] [PubMed]
- Pavlova, A.; Ozhegov, G.; Yahia, M.N.; Gogoleva, N.; Shagimardanova, E.; Kayumov, A.; Nikitina, E. Whole genome sequence data of Lactobacillus fermentum AG8, the producer of antibacterial peptides. IOP Conf. Ser. Earth Environ. Sci. 2021, 715, 012071. [Google Scholar] [CrossRef]
- Nikitina, E. Effect of Sour Creams Fermented by Limosilactobacillus fermentum AG8 and Lactiplantibacillus plantarum AG9 on Mice. Curr. Res. Nutr. Food Sci. 2025, 13(2), 702 714. [Google Scholar] [CrossRef]
- Amiri, S.; Kohneshahri, S.R.A.; Nabizadeh, F. The effect of unit operation and adjunct probiotic culture on physicochemical, biochemical and textural properties of Dutch Edam cheese. LWT 2022, 155, 112859. [Google Scholar] [CrossRef]
- Bonazza, F.; Morandi, S.; Silvetti, T.; Tamburini, A.; De Noni, I.; Masotti, F.; Brasca, M. Effects of Protective Lacticaseibacillus casei VC201 Culture on Late Blowing Prevention, Lipid Profile, and Sensory Characteristics of Valtellina Casera PDO Cheese During Ripening. Foods 2025, 14(14), 2433. [Google Scholar] [CrossRef] [PubMed]
- Ryan, P.M.; Burdíková, Z.; Beresford, T.; Auty, M.A.; Fitzgerald, G.F.; Ross, R.P.; Sheehan, J.J.; Stanton, C. Reduced fat Cheddar and Swiss type cheeses harboring exopolysaccharide producing probiotic Lactobacillus mucosae DPC 6426. J. Dairy Sci. 2015, 98(12), 8531 8544. [Google Scholar] [CrossRef] [PubMed]
- Costa, N.E.; Hannon, J.A.; Guinee, T.P.; Auty, M.A.; McSweeney, P.L.; Beresford, T.P. Effect of exopolysaccharide produced by isogenic strains of Lactococcus lactis on half fat Cheddar cheese. J. Dairy Sci. 2010, 93(8), 3469 3486. [Google Scholar] [CrossRef] [PubMed]
- Das, B.; Basaiawmoit, B.; Sakure, A.A.; Maurya, R.; Bishnoi, M.; Kondepudi, K.K.; Tiwary, B.K.; Mankad, P.M.; Patel, A.; Hati, S. Production, Characterization, and Molecular Dynamic Study of Antidiabetic and Antioxidative Peptides of Fermented Cheese Whey with Anti inflammatory Properties using Limosilactobacillus fermentum. Curr. Pharm. Des. 2025, 31(40), 3247 3265. [Google Scholar] [CrossRef] [PubMed]
- Rodríguez Sojo, M.J.; Ruiz Malagón, A.J.; Rodríguez Cabezas, M.E.; Gálvez, J.; Rodríguez Nogales, A. Limosilactobacillus fermentum CECT5716: Mechanisms and Therapeutic Insights. Nutrients 2021, 13(3), 1016. [Google Scholar] [CrossRef] [PubMed]
- Novak, J.; Butorac, K.; Leboš Pavunc, A.; Banić, M.; Butorac, A.; Lepur, A.; Oršolić, N.; Tonković, K.; Bendelja, K.; Čuljak, N.; Lovrić, M.; Šušković, J.; Kos, B. A Lactic Acid Bacteria Consortium Impacted the Content of Casein Derived Biopeptides in Dried Fresh Cheese. Molecules 2021, 27(1), 160. [Google Scholar] [CrossRef] [PubMed]
- Yang, W.; Zhang, X.; Sun, M.; Jiao, Y.; Li, X.; Liu, L.; Wang, Z. The Peptide Fractions of Cheddar Cheese Made with Lactobacillus helveticus 1.0612 Play Protective Effects in H₂O₂ Induced Oxidative Damaged Caco 2 Cells Models. Foods 2023, 12(14), 2790. [Google Scholar] [CrossRef] [PubMed]
Figure 1.
Percentage content of various fatty acids in semi-hard cheeses. Asterisks indicate significant differences at p < 0.05 between groups.
Figure 1.
Percentage content of various fatty acids in semi-hard cheeses. Asterisks indicate significant differences at p < 0.05 between groups.
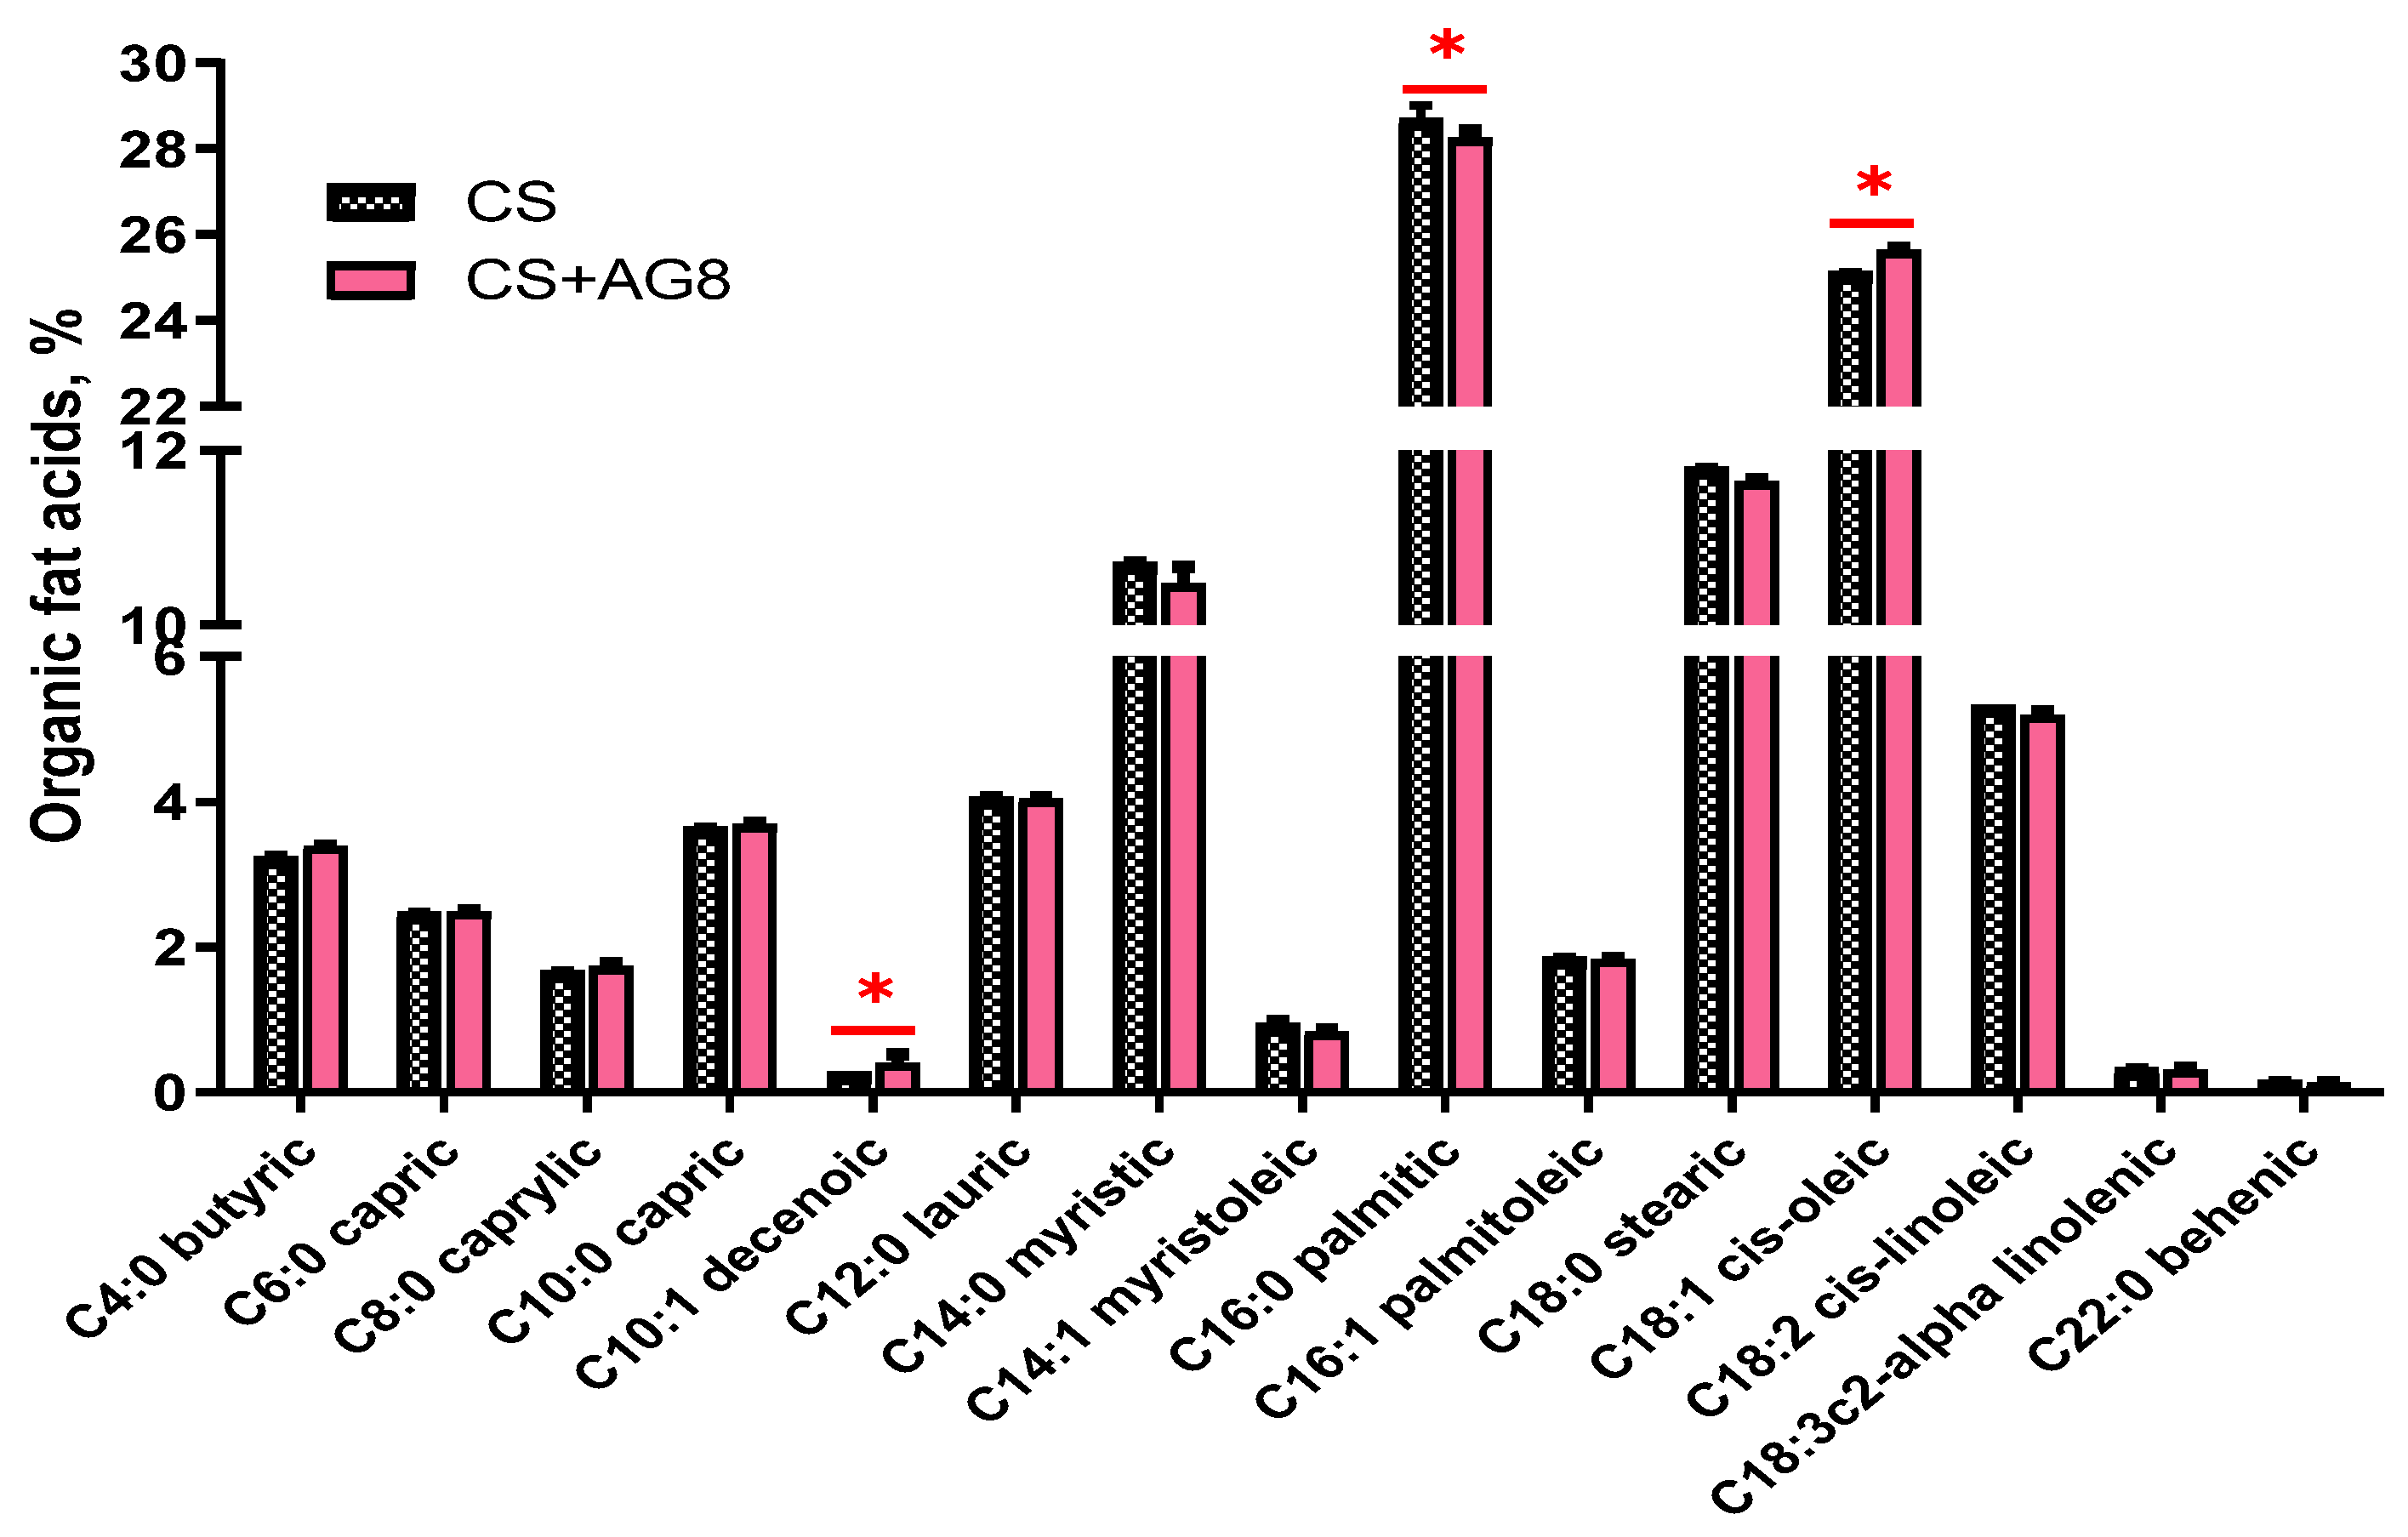
Figure 2.
Concentration of phenolic compounds in water extract of cheese. Asterisks indicate significant differences at p < 0.05 between groups.
Figure 2.
Concentration of phenolic compounds in water extract of cheese. Asterisks indicate significant differences at p < 0.05 between groups.
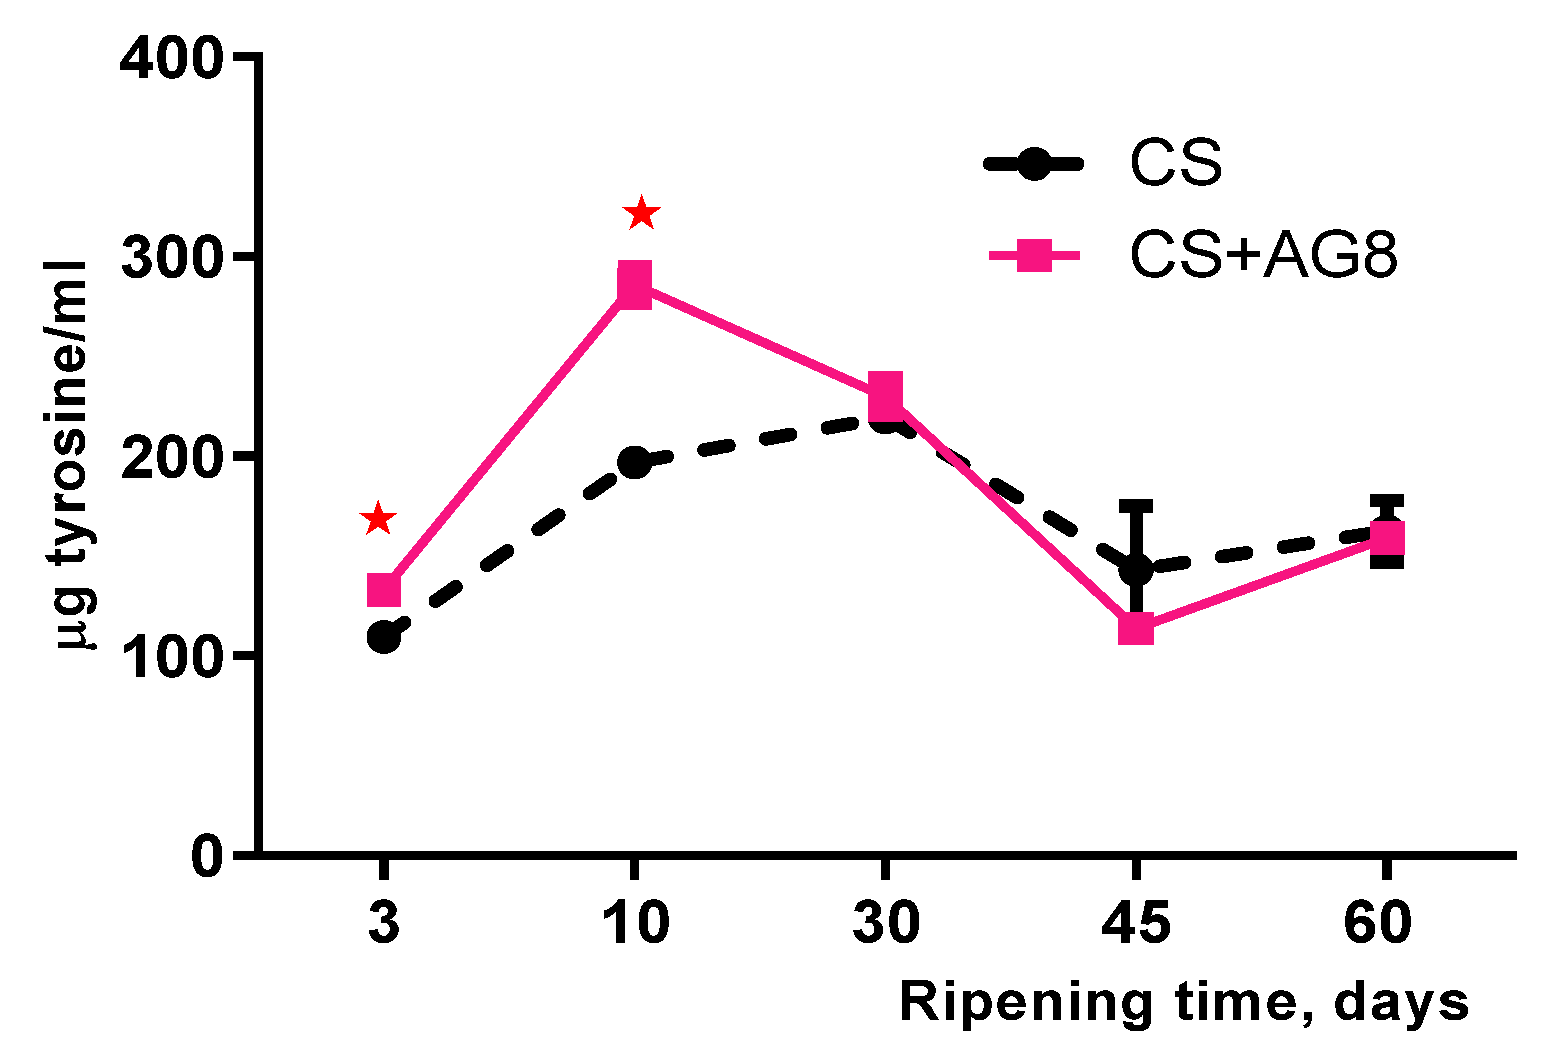
Figure 3.
Concentration of phenolic compounds (A), proteolysis products (B), and glucose (C) in the protein-free extract. Asterisks indicate significant differences at p < 0.05 between groups.
Figure 3.
Concentration of phenolic compounds (A), proteolysis products (B), and glucose (C) in the protein-free extract. Asterisks indicate significant differences at p < 0.05 between groups.
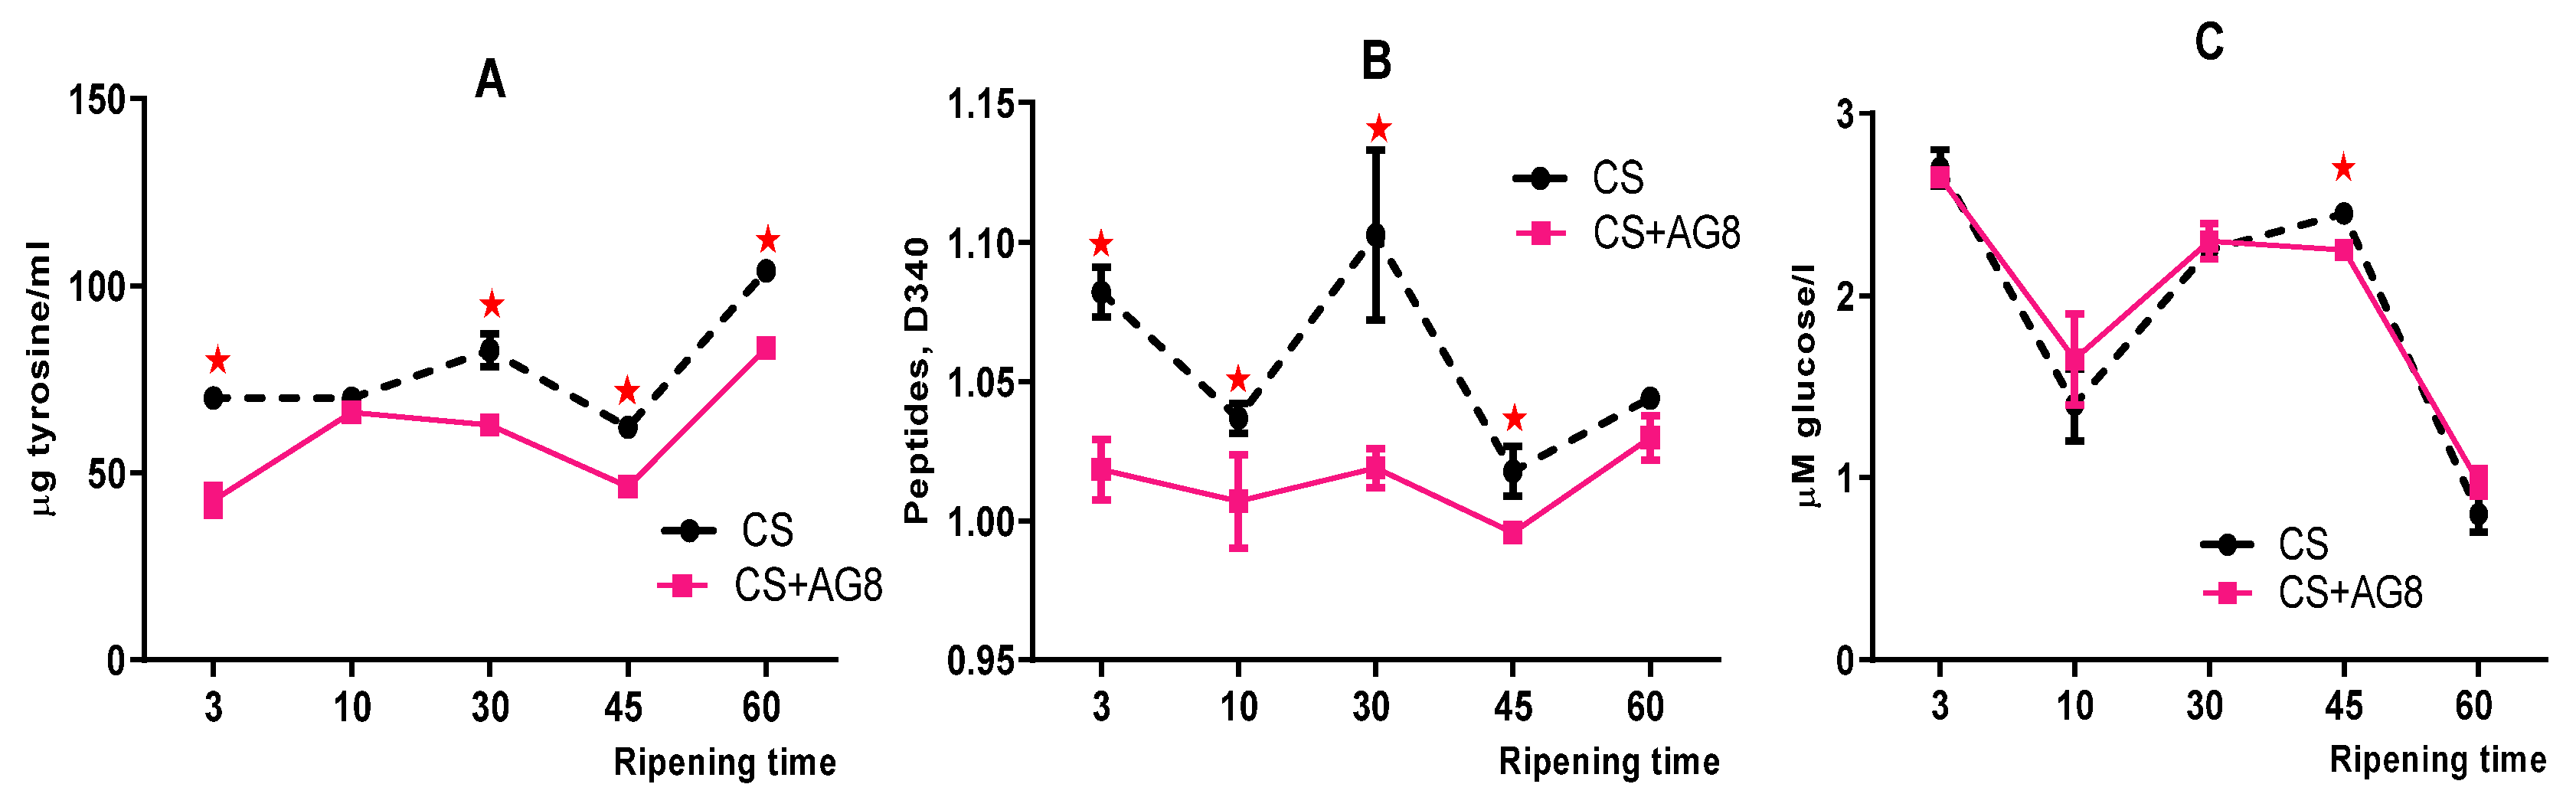
Figure 4.
Changes in water-holding (A) and water-adsorbing capacity (B) of cheeses during ripening. Asterisks indicate significant differences at p < 0.05 between groups.
Figure 4.
Changes in water-holding (A) and water-adsorbing capacity (B) of cheeses during ripening. Asterisks indicate significant differences at p < 0.05 between groups.
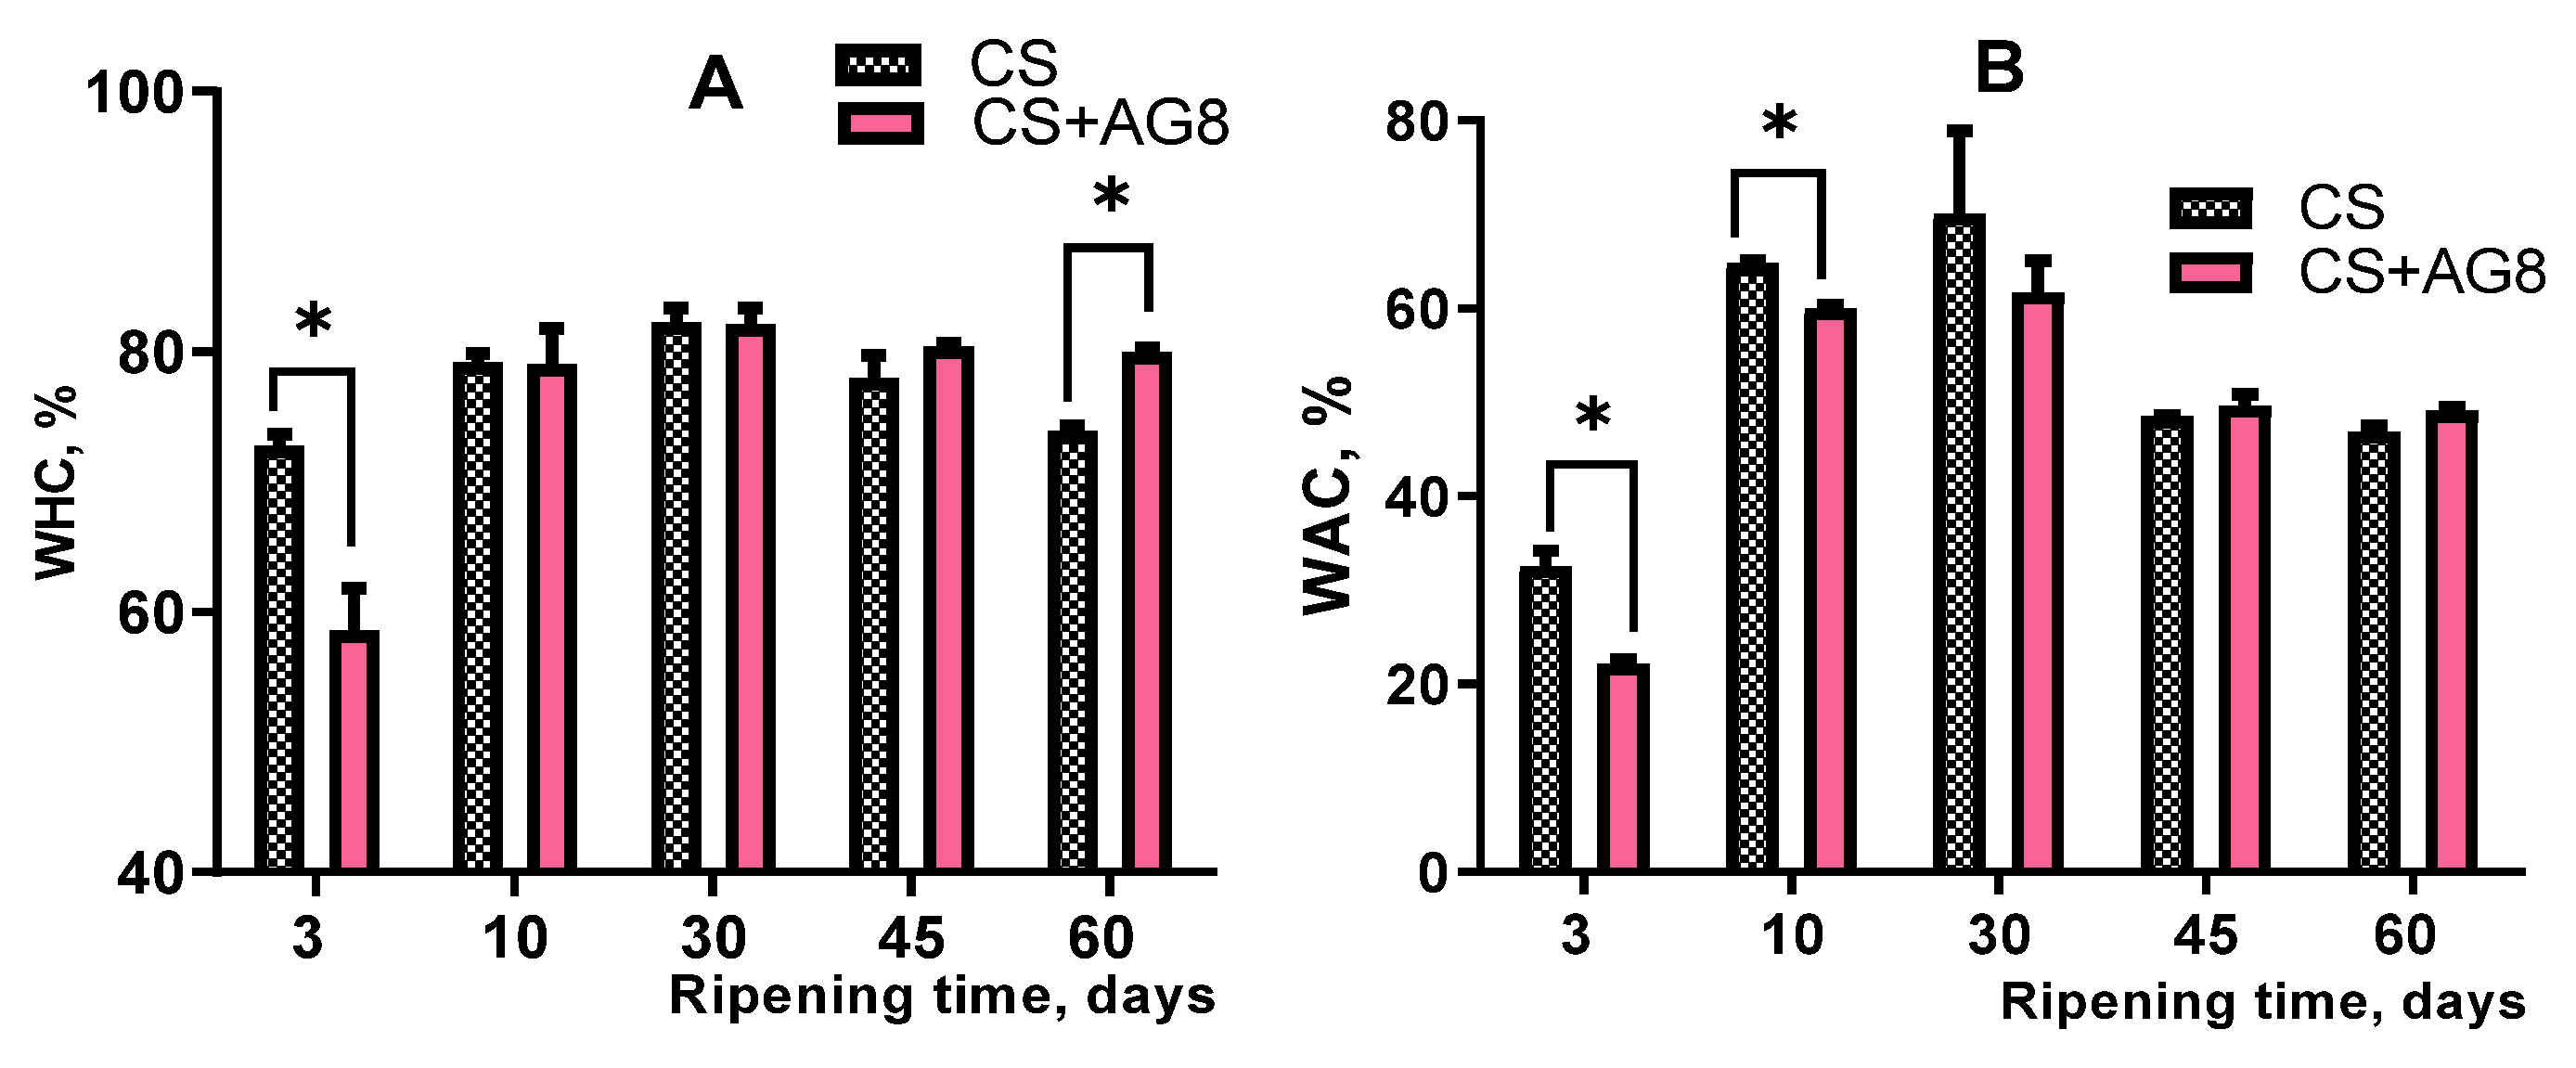
Figure 5.
Texture changes in cheese during ripening (A – Hardness, B – Springiness, C – Cohesiveness, D – Resilience, E – Chewiness, F – Gumminess). Asterisks indicate significant differences at p < 0.05 between groups.
Figure 5.
Texture changes in cheese during ripening (A – Hardness, B – Springiness, C – Cohesiveness, D – Resilience, E – Chewiness, F – Gumminess). Asterisks indicate significant differences at p < 0.05 between groups.
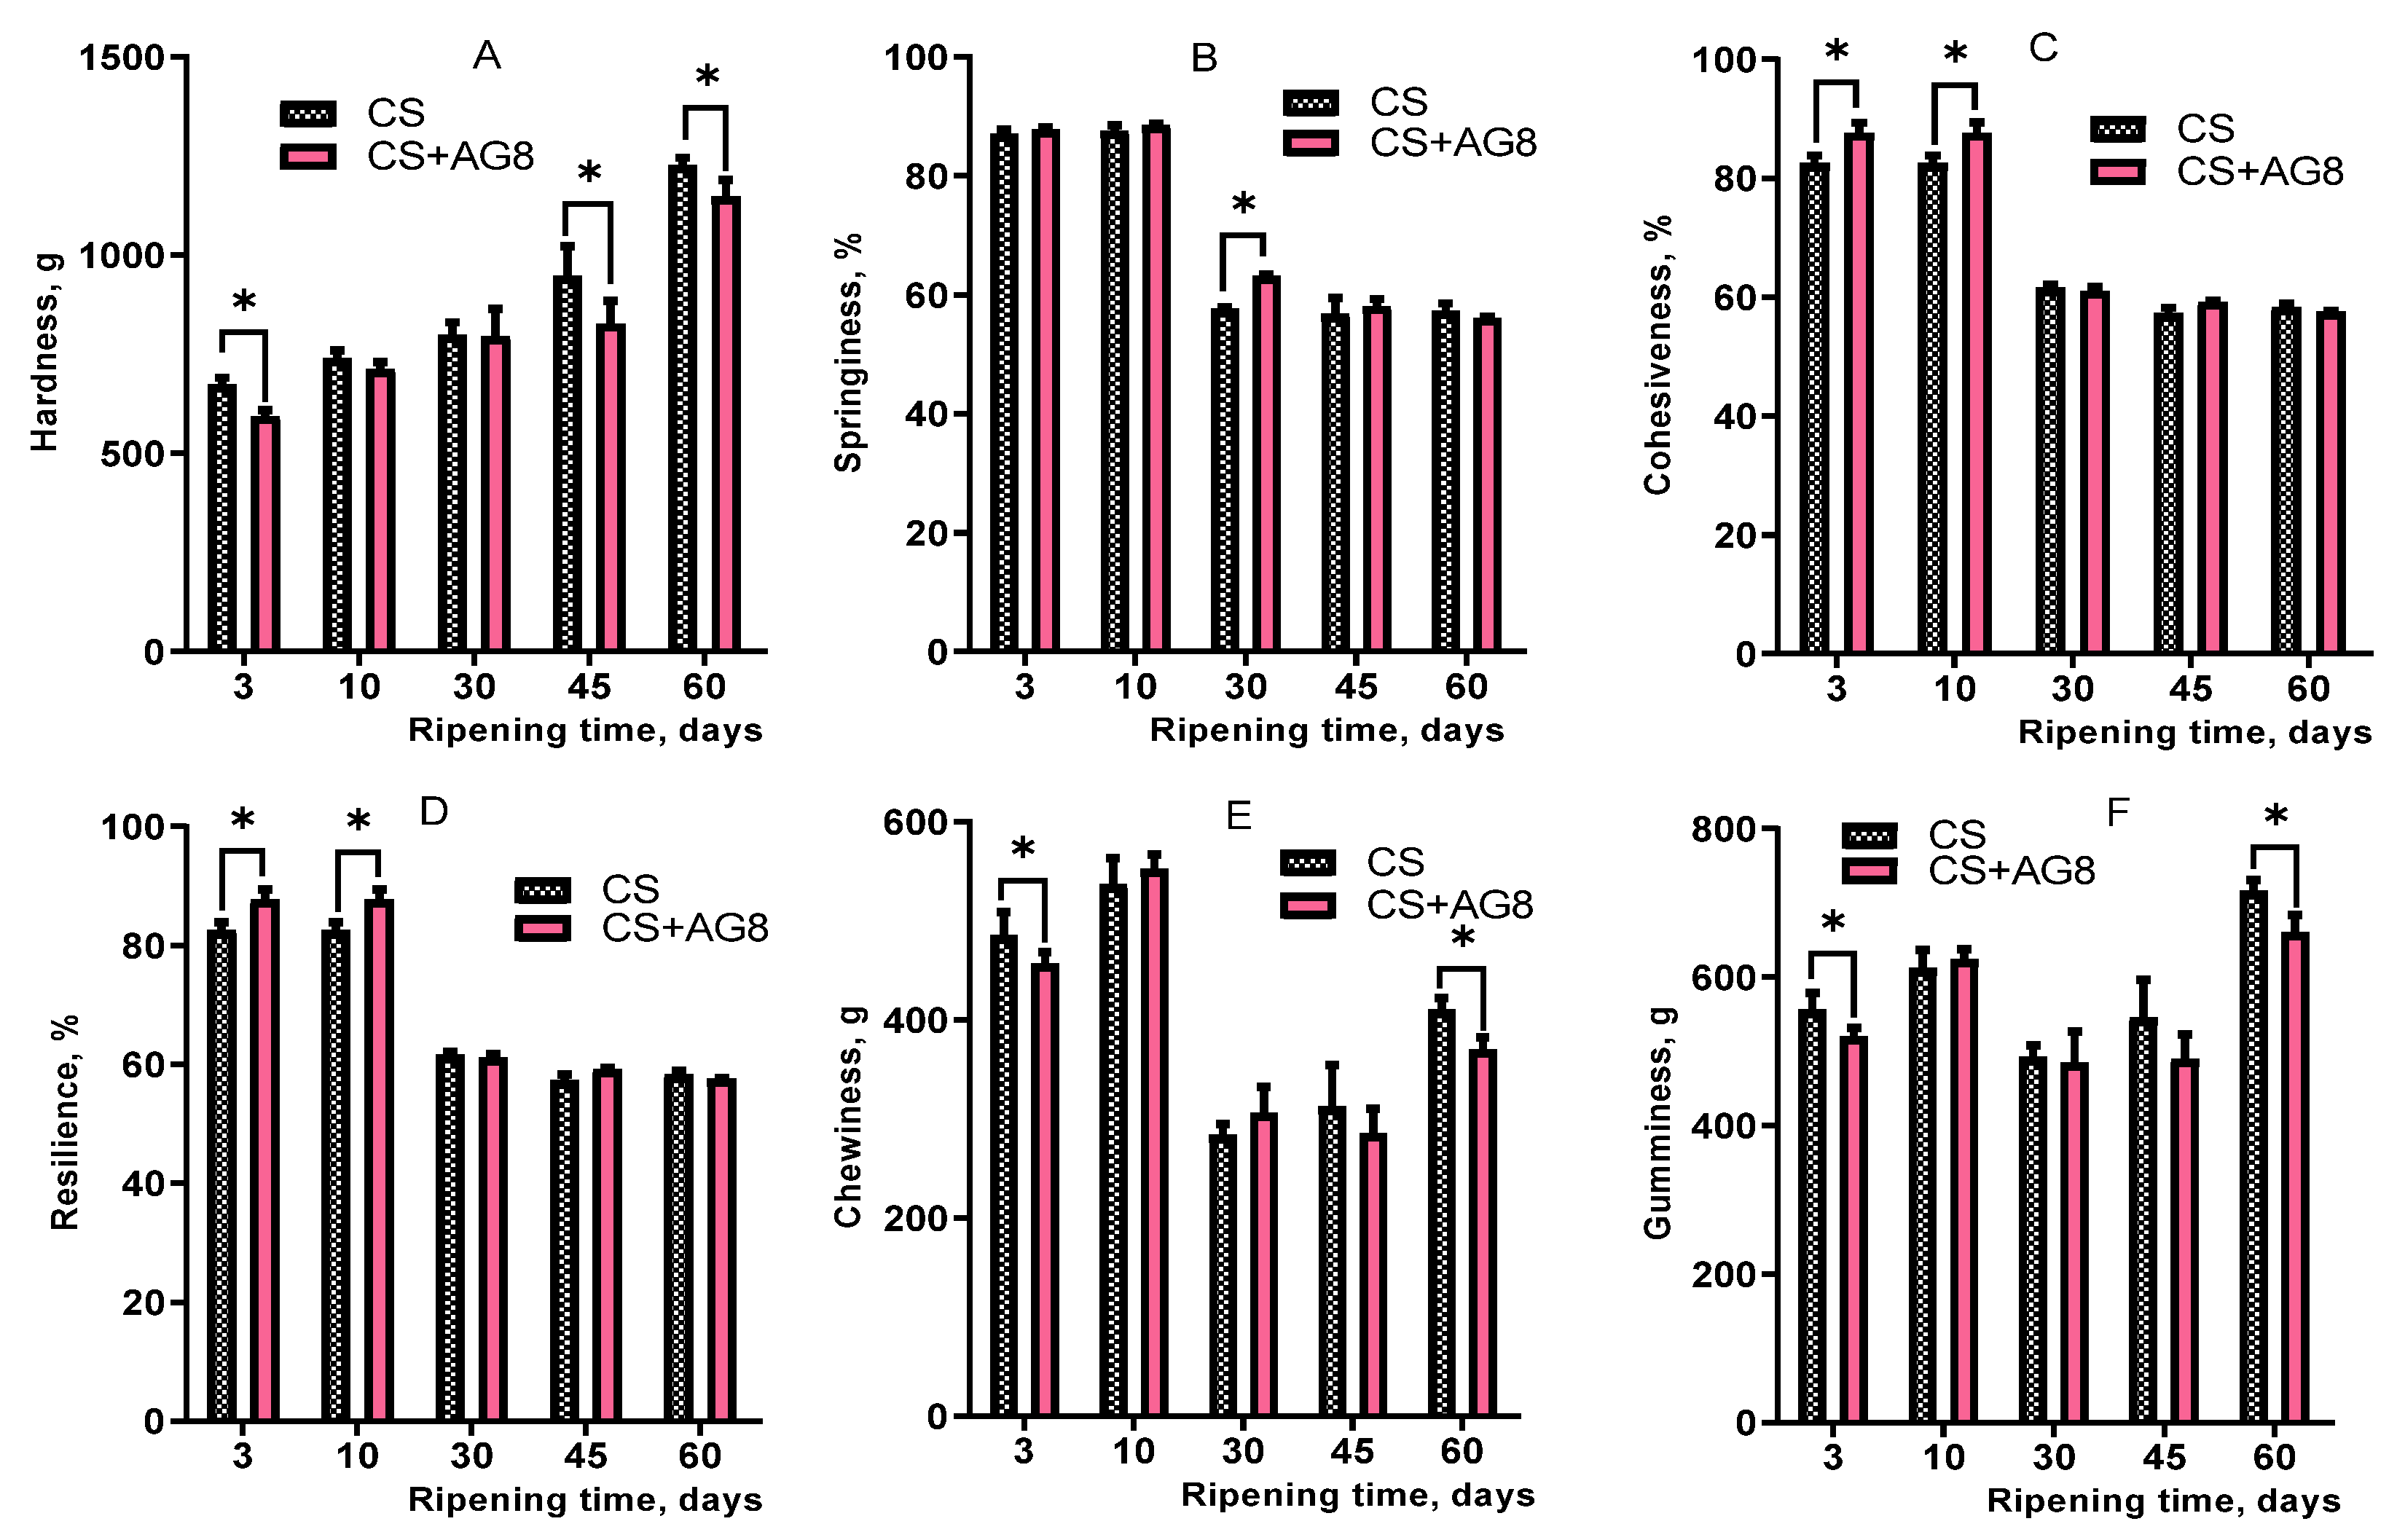
Figure 6.
Cheese microstructure after 60 days of ripening: A, B – cheese CS, C, D – cheese CS+AG8 (A, C – увеличение 5000, B, D – увеличение 20000).
Figure 6.
Cheese microstructure after 60 days of ripening: A, B – cheese CS, C, D – cheese CS+AG8 (A, C – увеличение 5000, B, D – увеличение 20000).
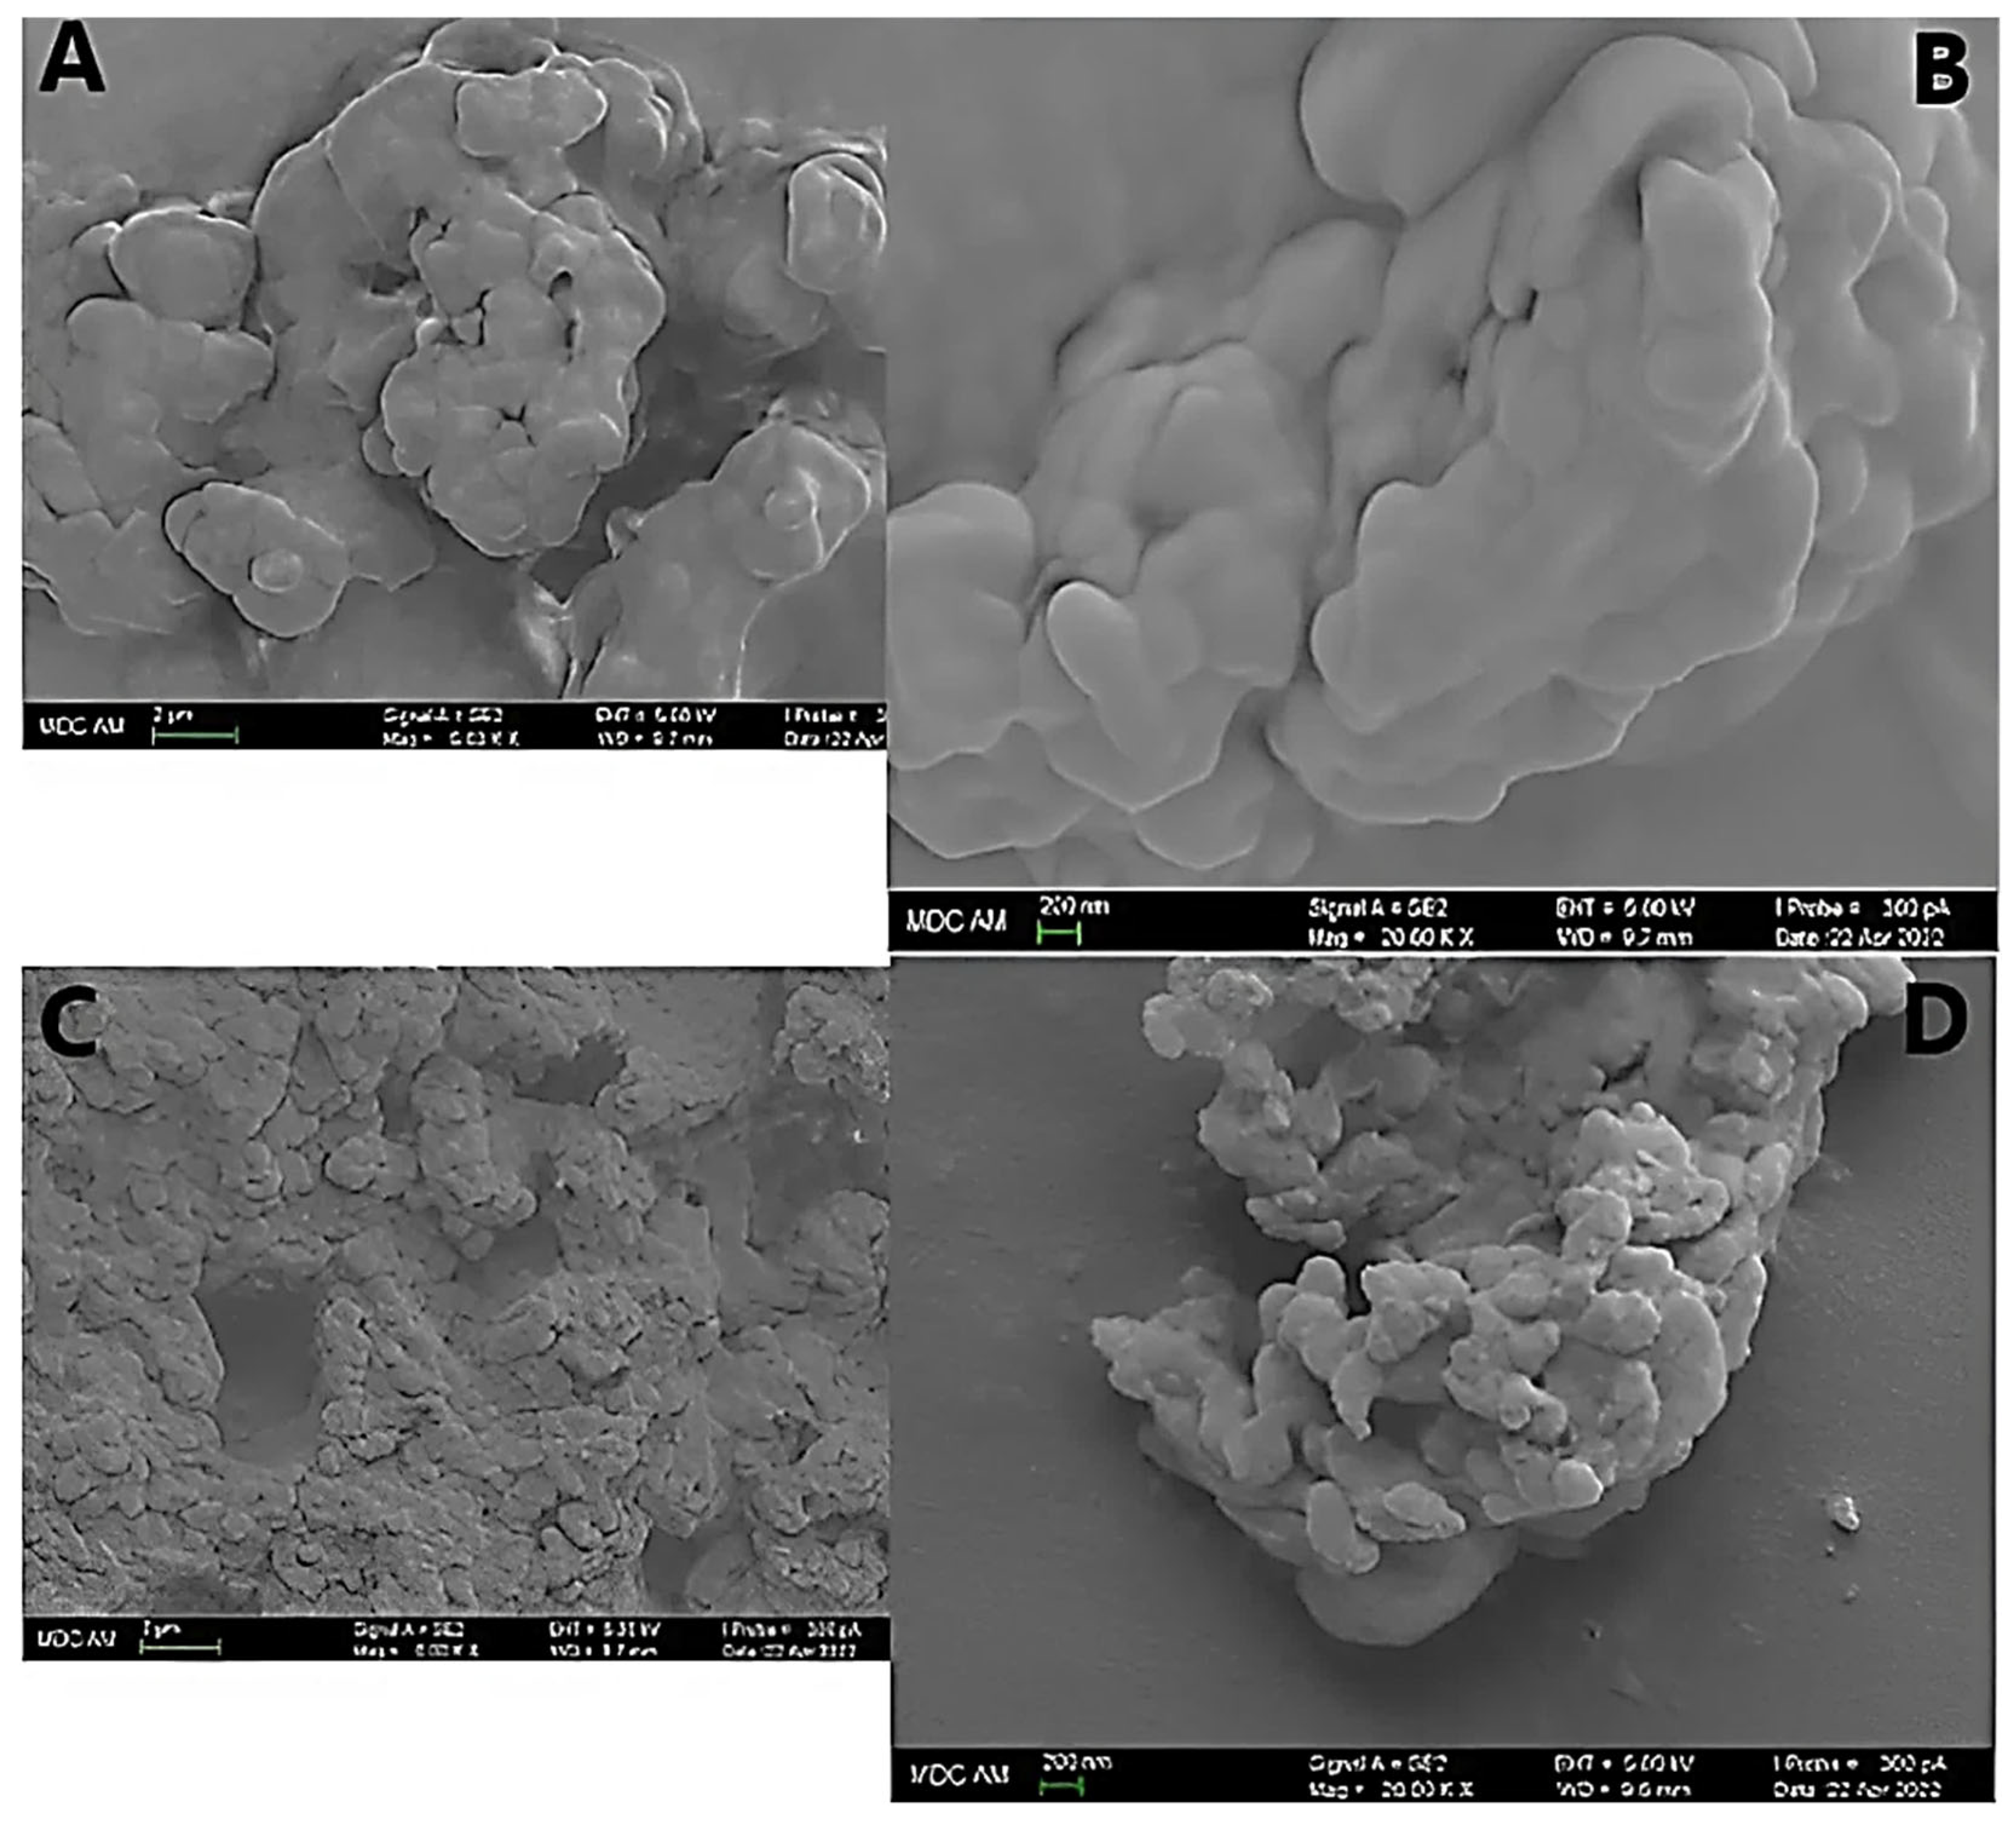
Figure 7.
Total count of lactic acid bacteria (A) and count of Lactobacillus (B) in cheese. Asterisks indicate significant differences at p < 0.05 between groups.
Figure 7.
Total count of lactic acid bacteria (A) and count of Lactobacillus (B) in cheese. Asterisks indicate significant differences at p < 0.05 between groups.
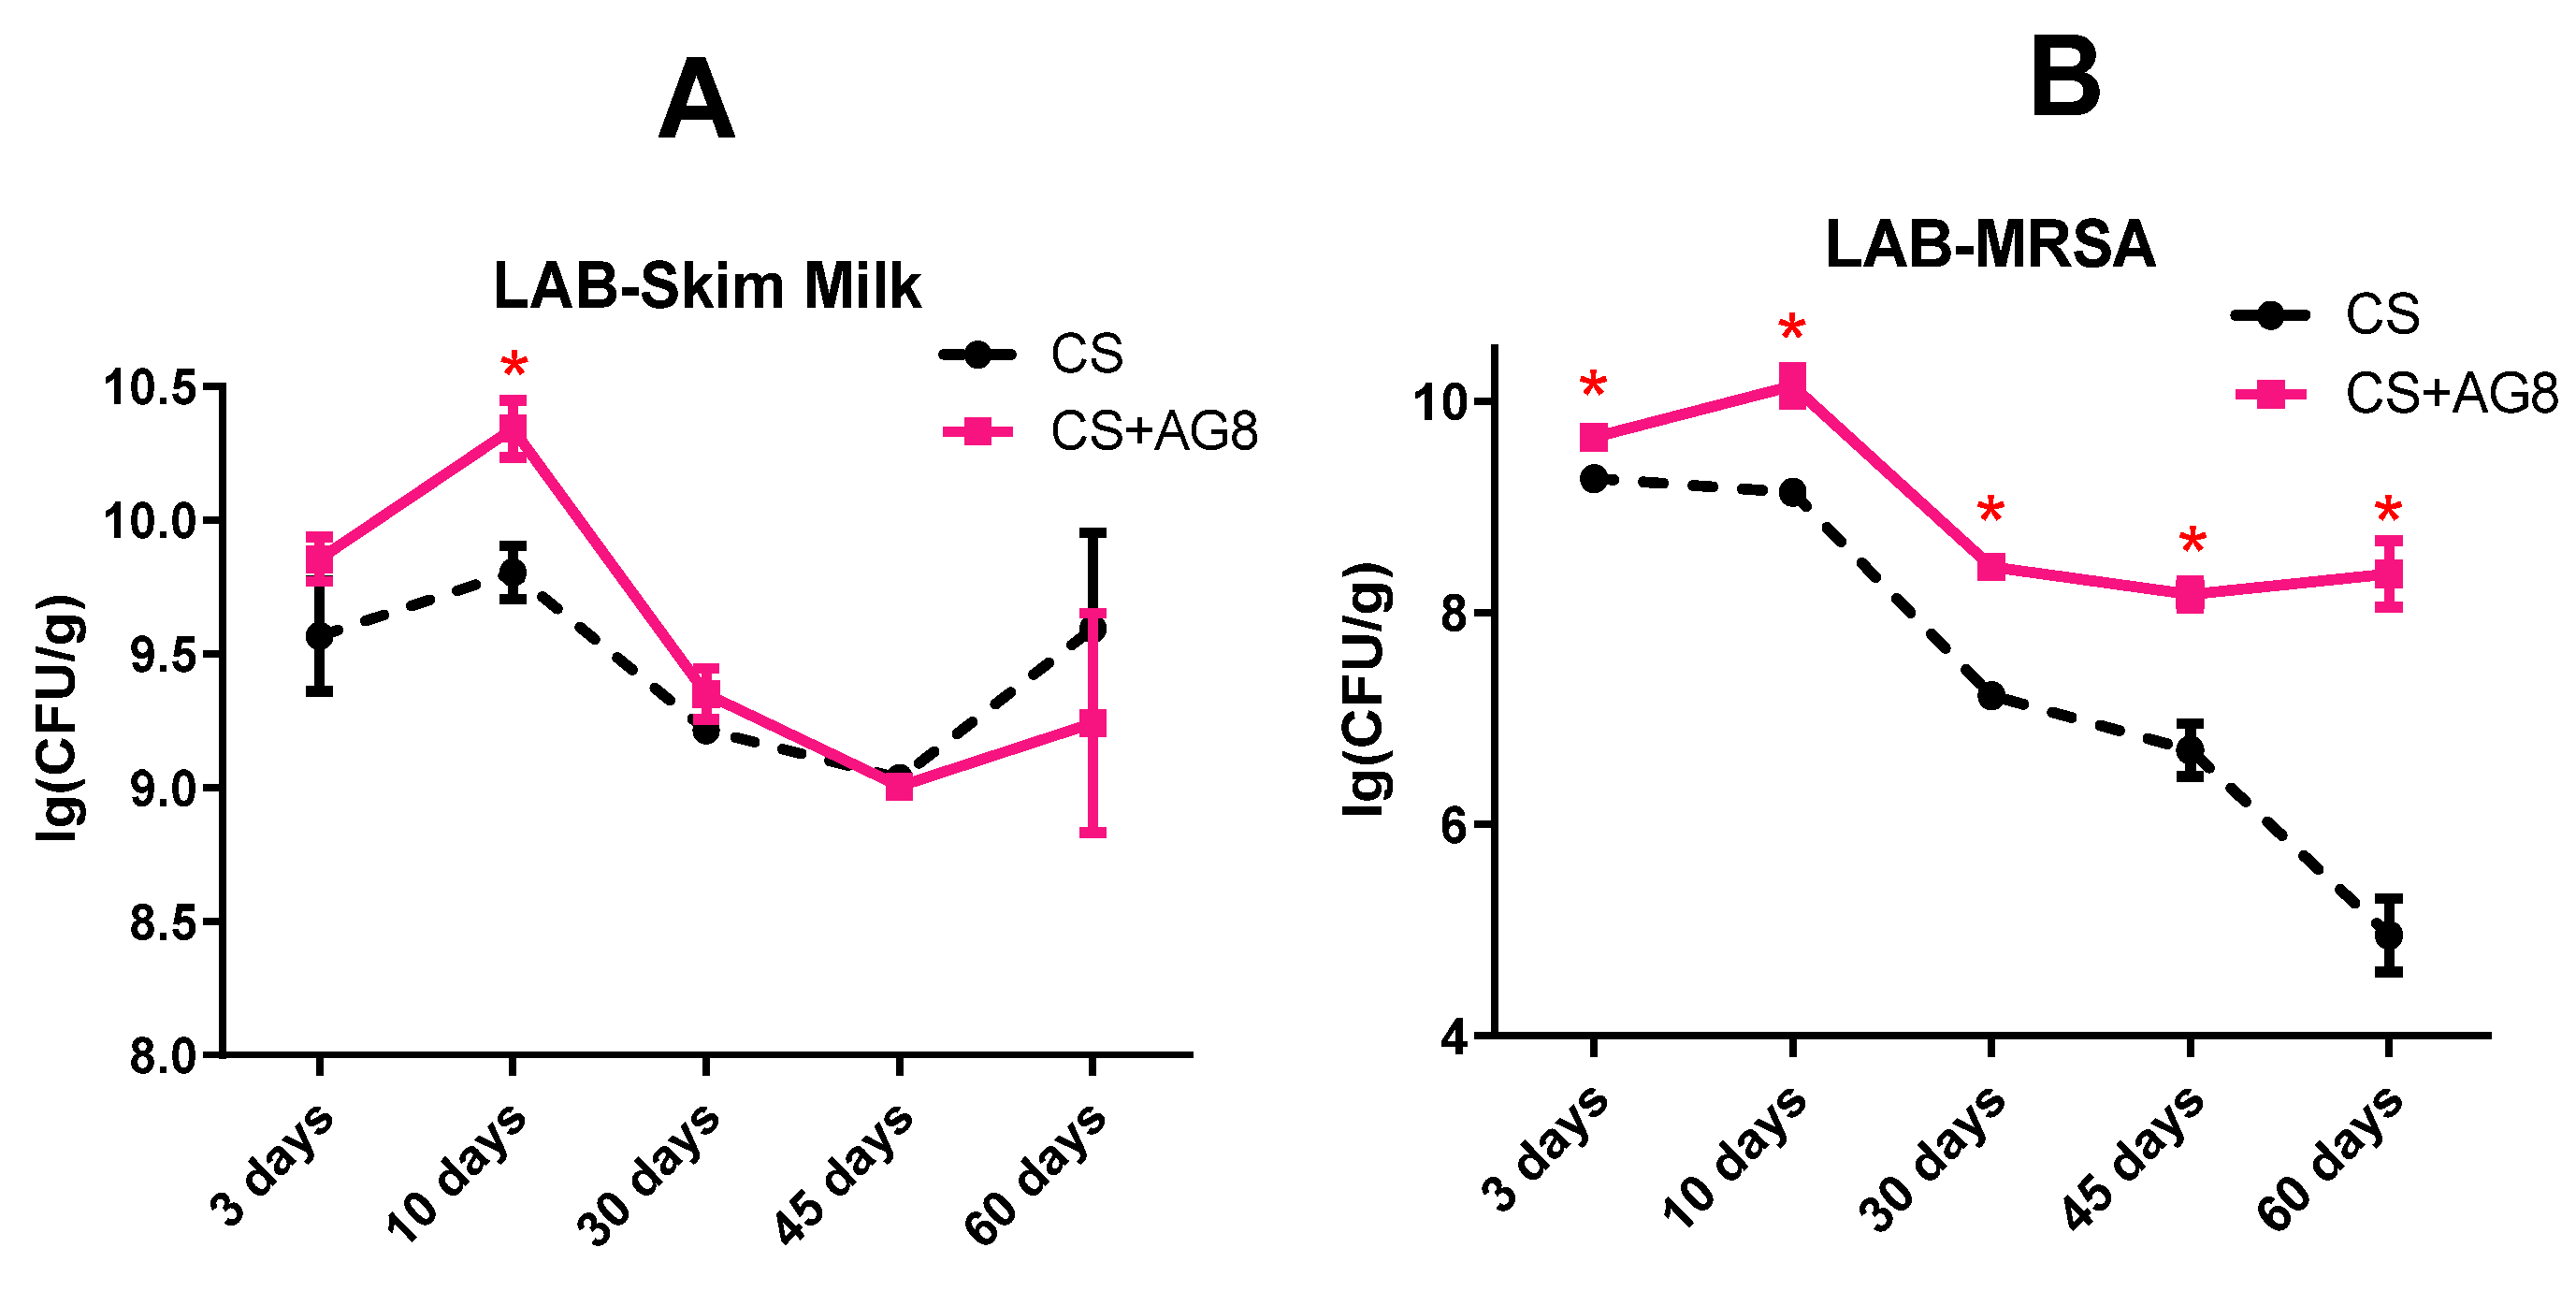
Figure 8.
The free fatty acid value (FFA), peroxide value (POV) and thiobarbituric acid reactive substance (MDA) of cheeses during ripening. Asterisks show significant difference at p < 0.05.
Figure 8.
The free fatty acid value (FFA), peroxide value (POV) and thiobarbituric acid reactive substance (MDA) of cheeses during ripening. Asterisks show significant difference at p < 0.05.
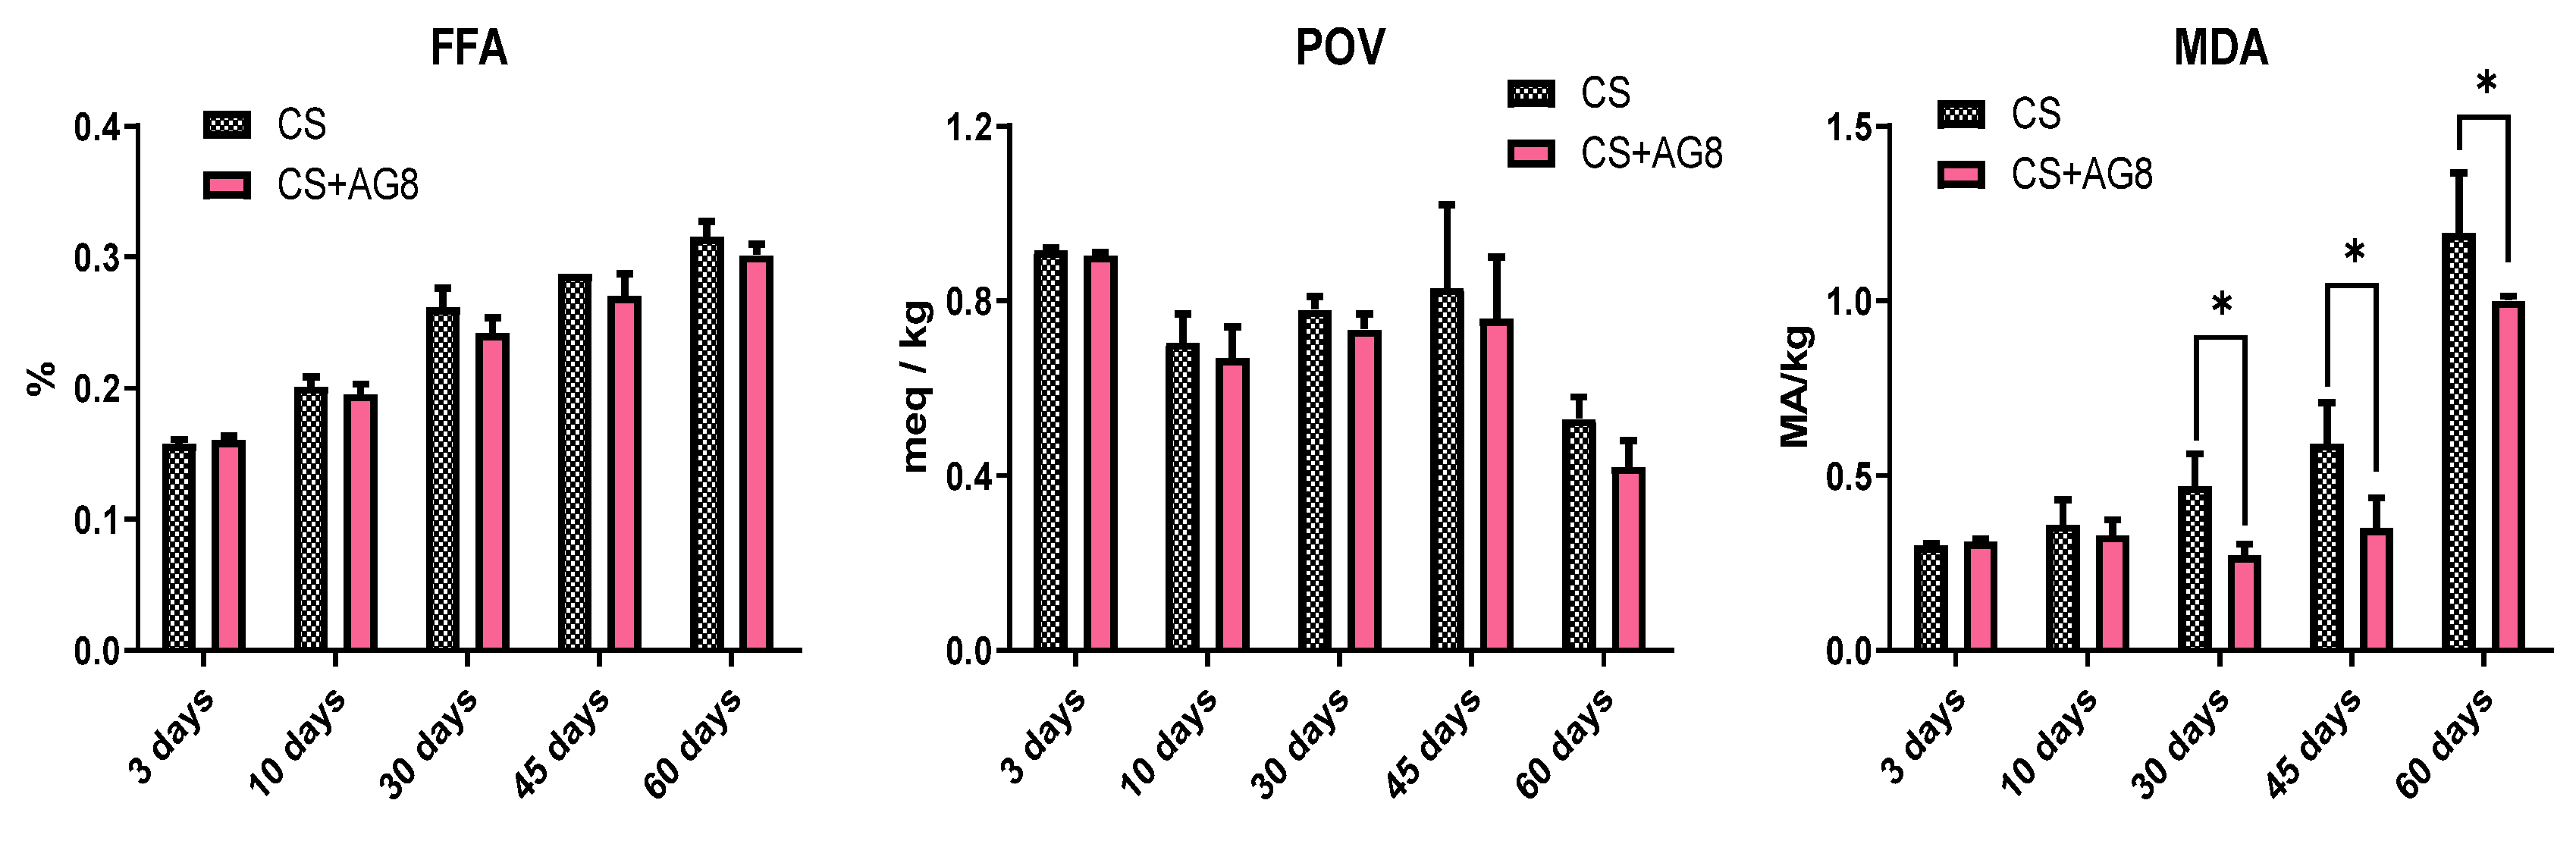
Figure 9.
FRAP (A – cheese suspension, B – water extract, C – protein-free extract). Asterisks indicate significant differences at p < 0.05 between groups.
Figure 9.
FRAP (A – cheese suspension, B – water extract, C – protein-free extract). Asterisks indicate significant differences at p < 0.05 between groups.
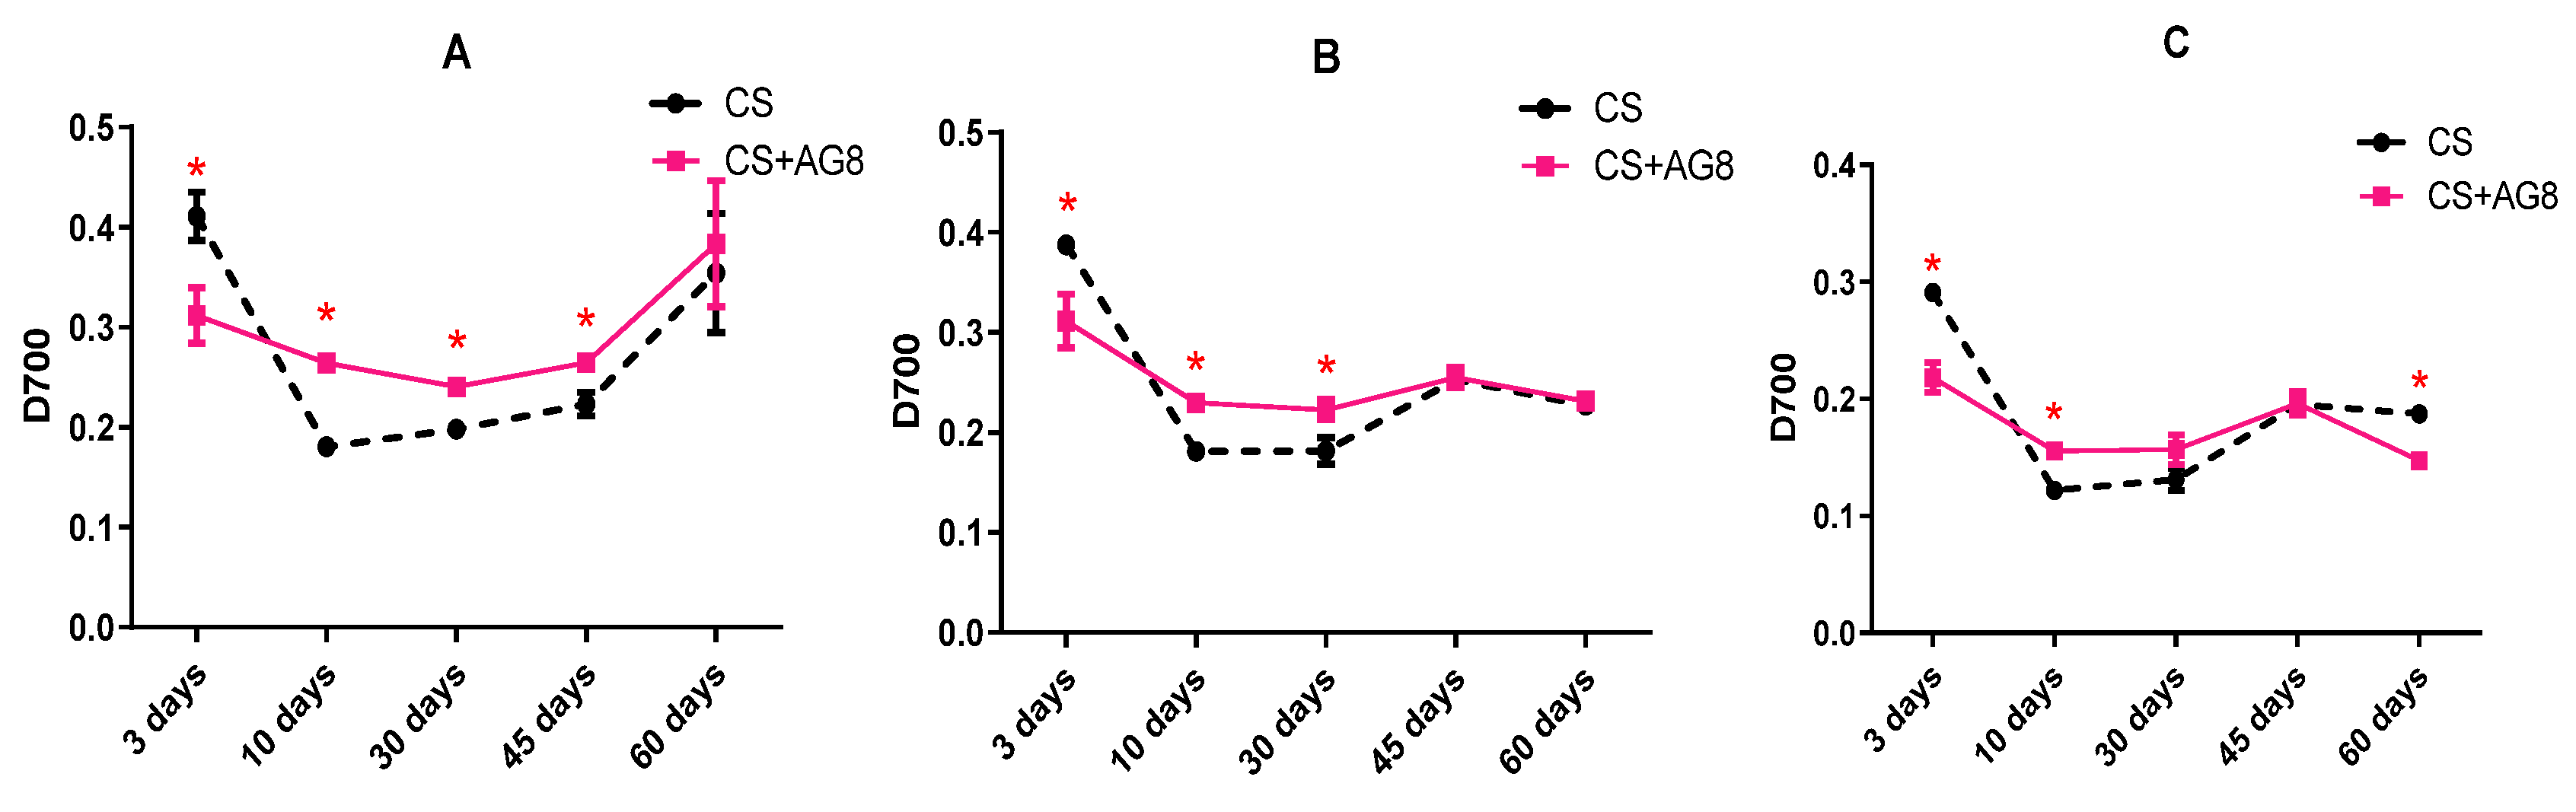
Figure 10.
DPPH-scavenging activity (A – cheese suspension, B – water extract, C – protein-free extract). Asterisks indicate significant differences at p < 0.05 between groups.
Figure 10.
DPPH-scavenging activity (A – cheese suspension, B – water extract, C – protein-free extract). Asterisks indicate significant differences at p < 0.05 between groups.
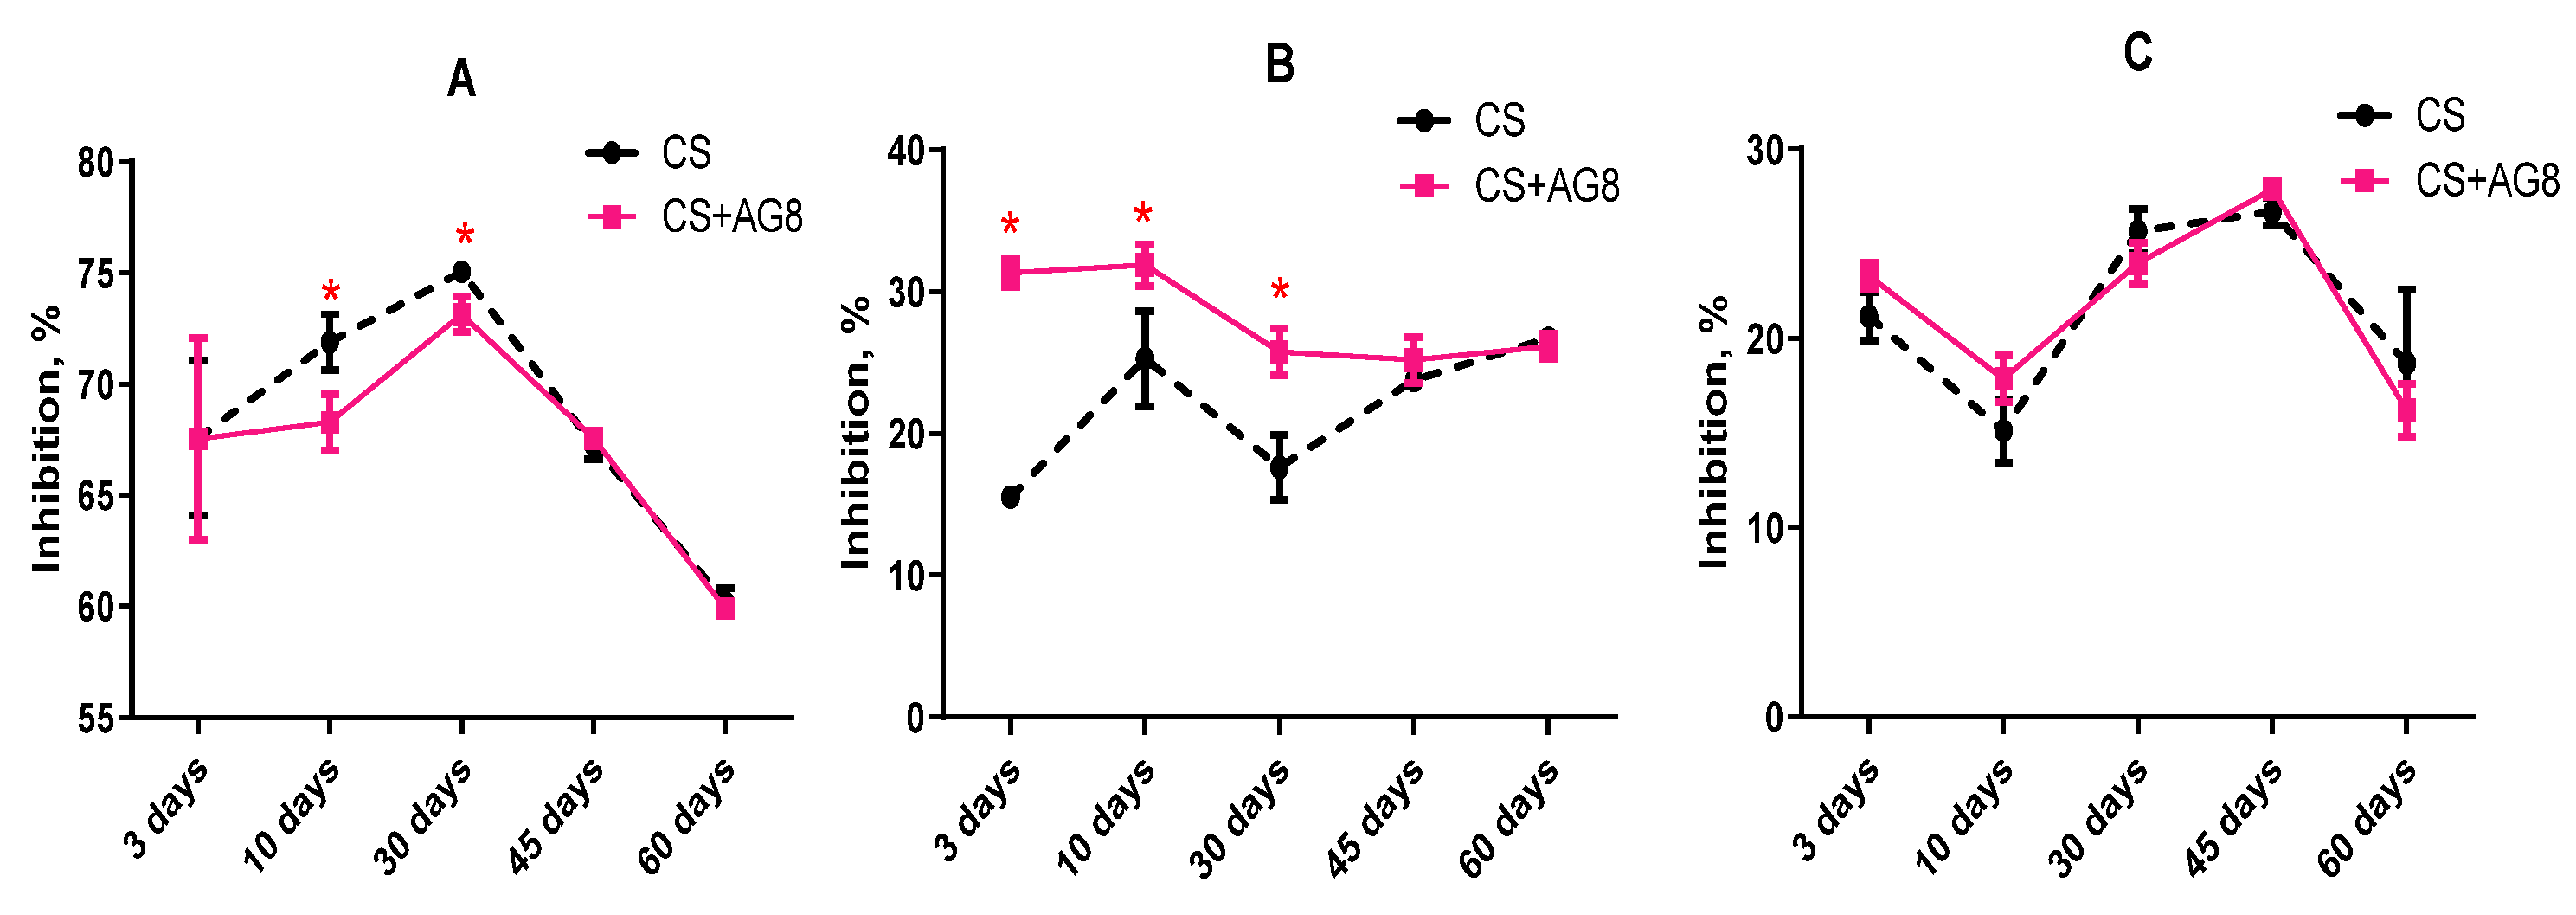
Figure 11.
PCA score plot (A), PCA loading plot (B) and cluster dendrogramm (C) of cheese sample.
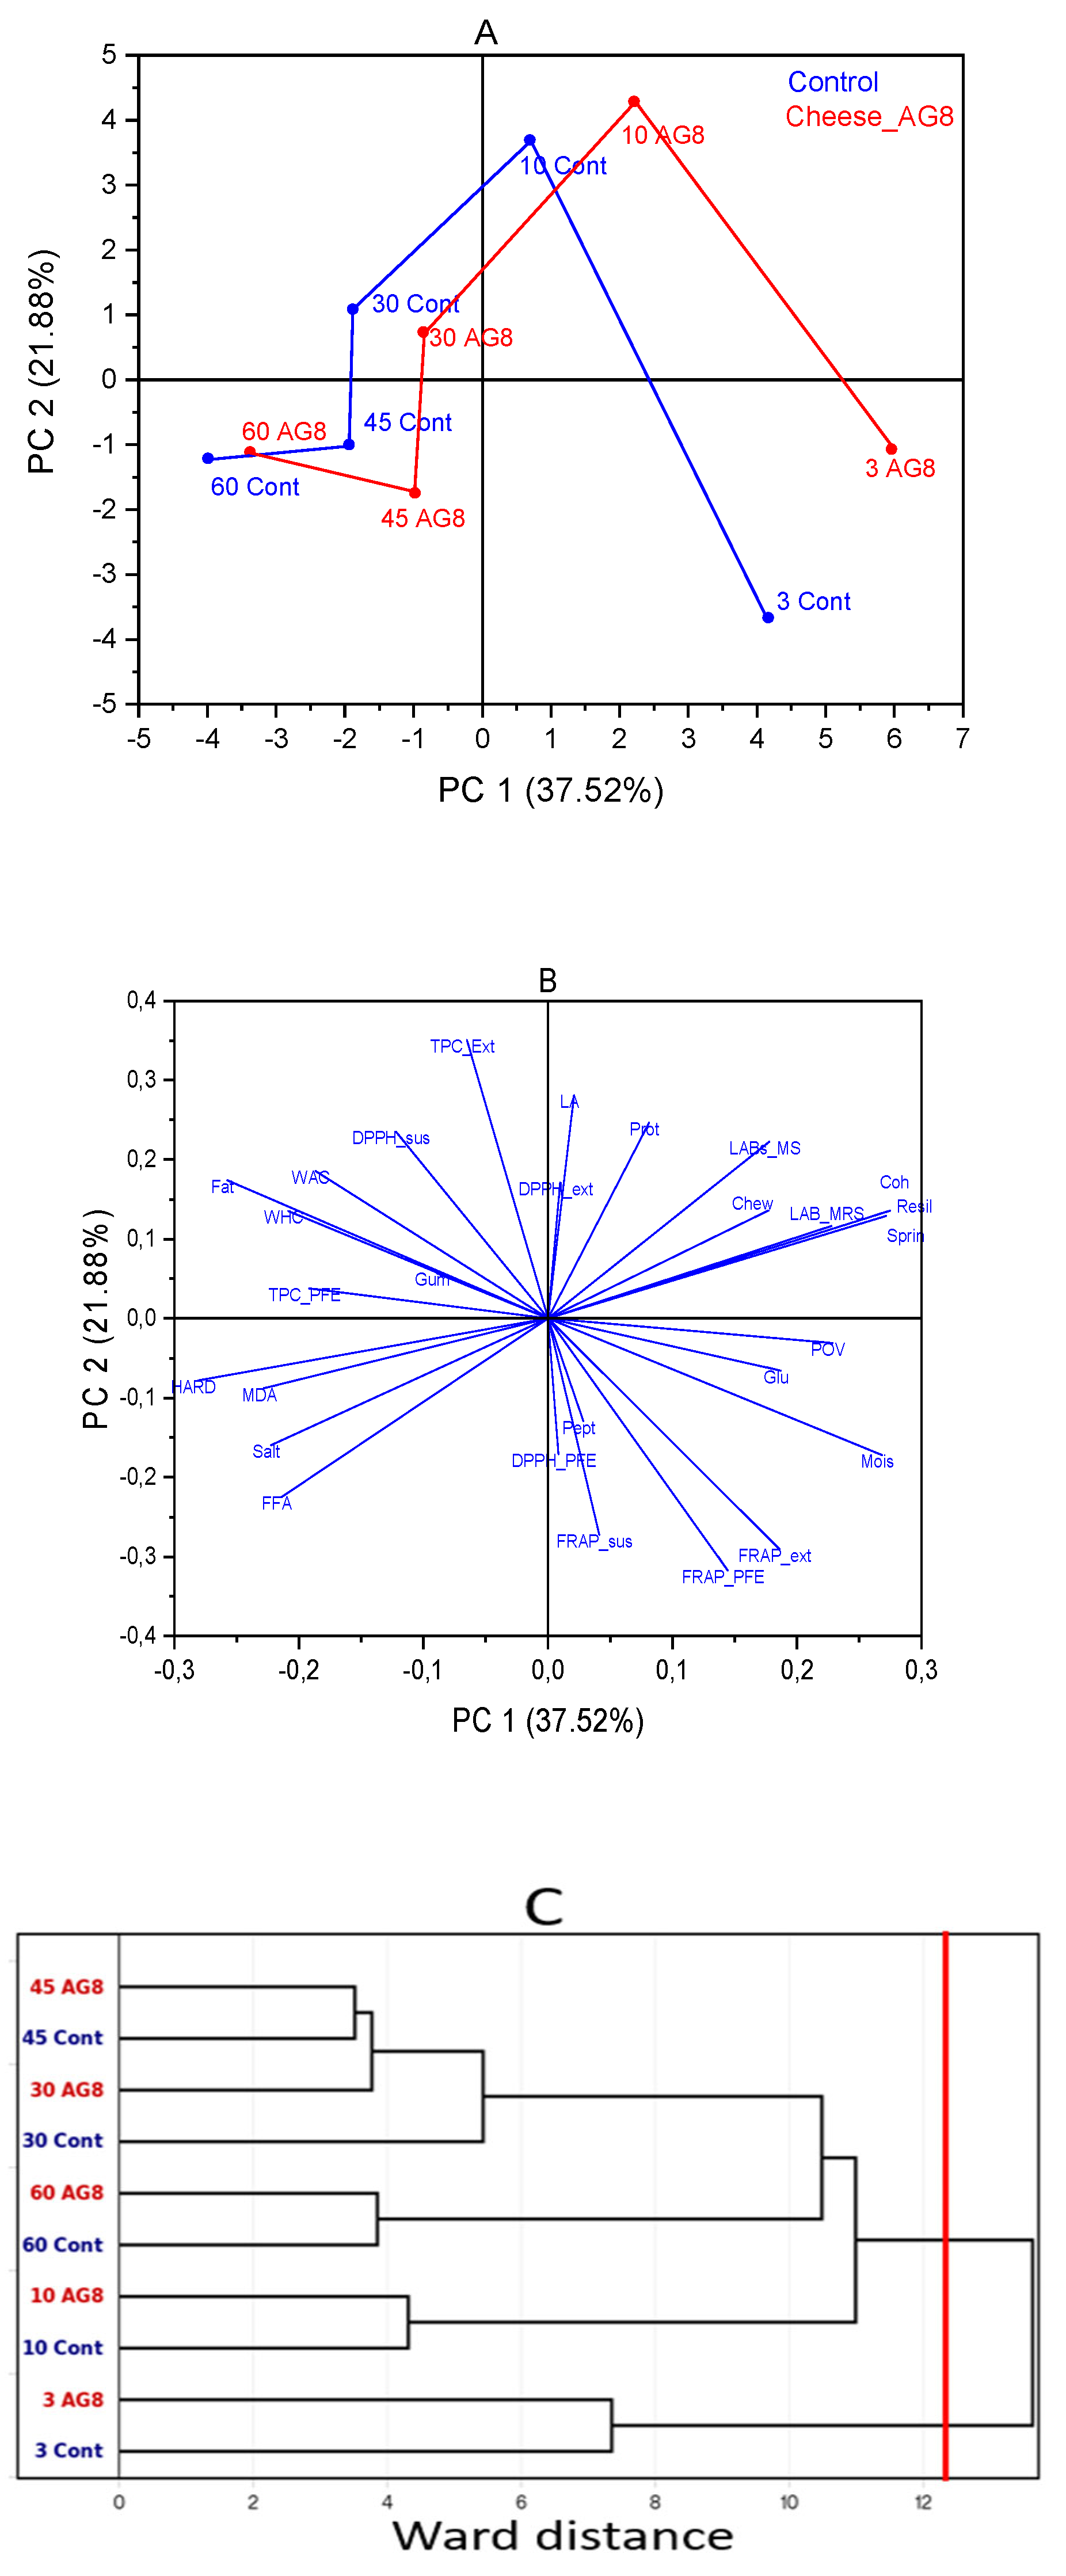
Figure 12.
PLS-DA score plot of cheese samples (A), Variable Importance of cheese factores (В), Spearmen`s heatmap correlation (C) (* - p < 0.05, ** - p < 0.01, *** - p < 0.001).
Figure 12.
PLS-DA score plot of cheese samples (A), Variable Importance of cheese factores (В), Spearmen`s heatmap correlation (C) (* - p < 0.05, ** - p < 0.01, *** - p < 0.001).
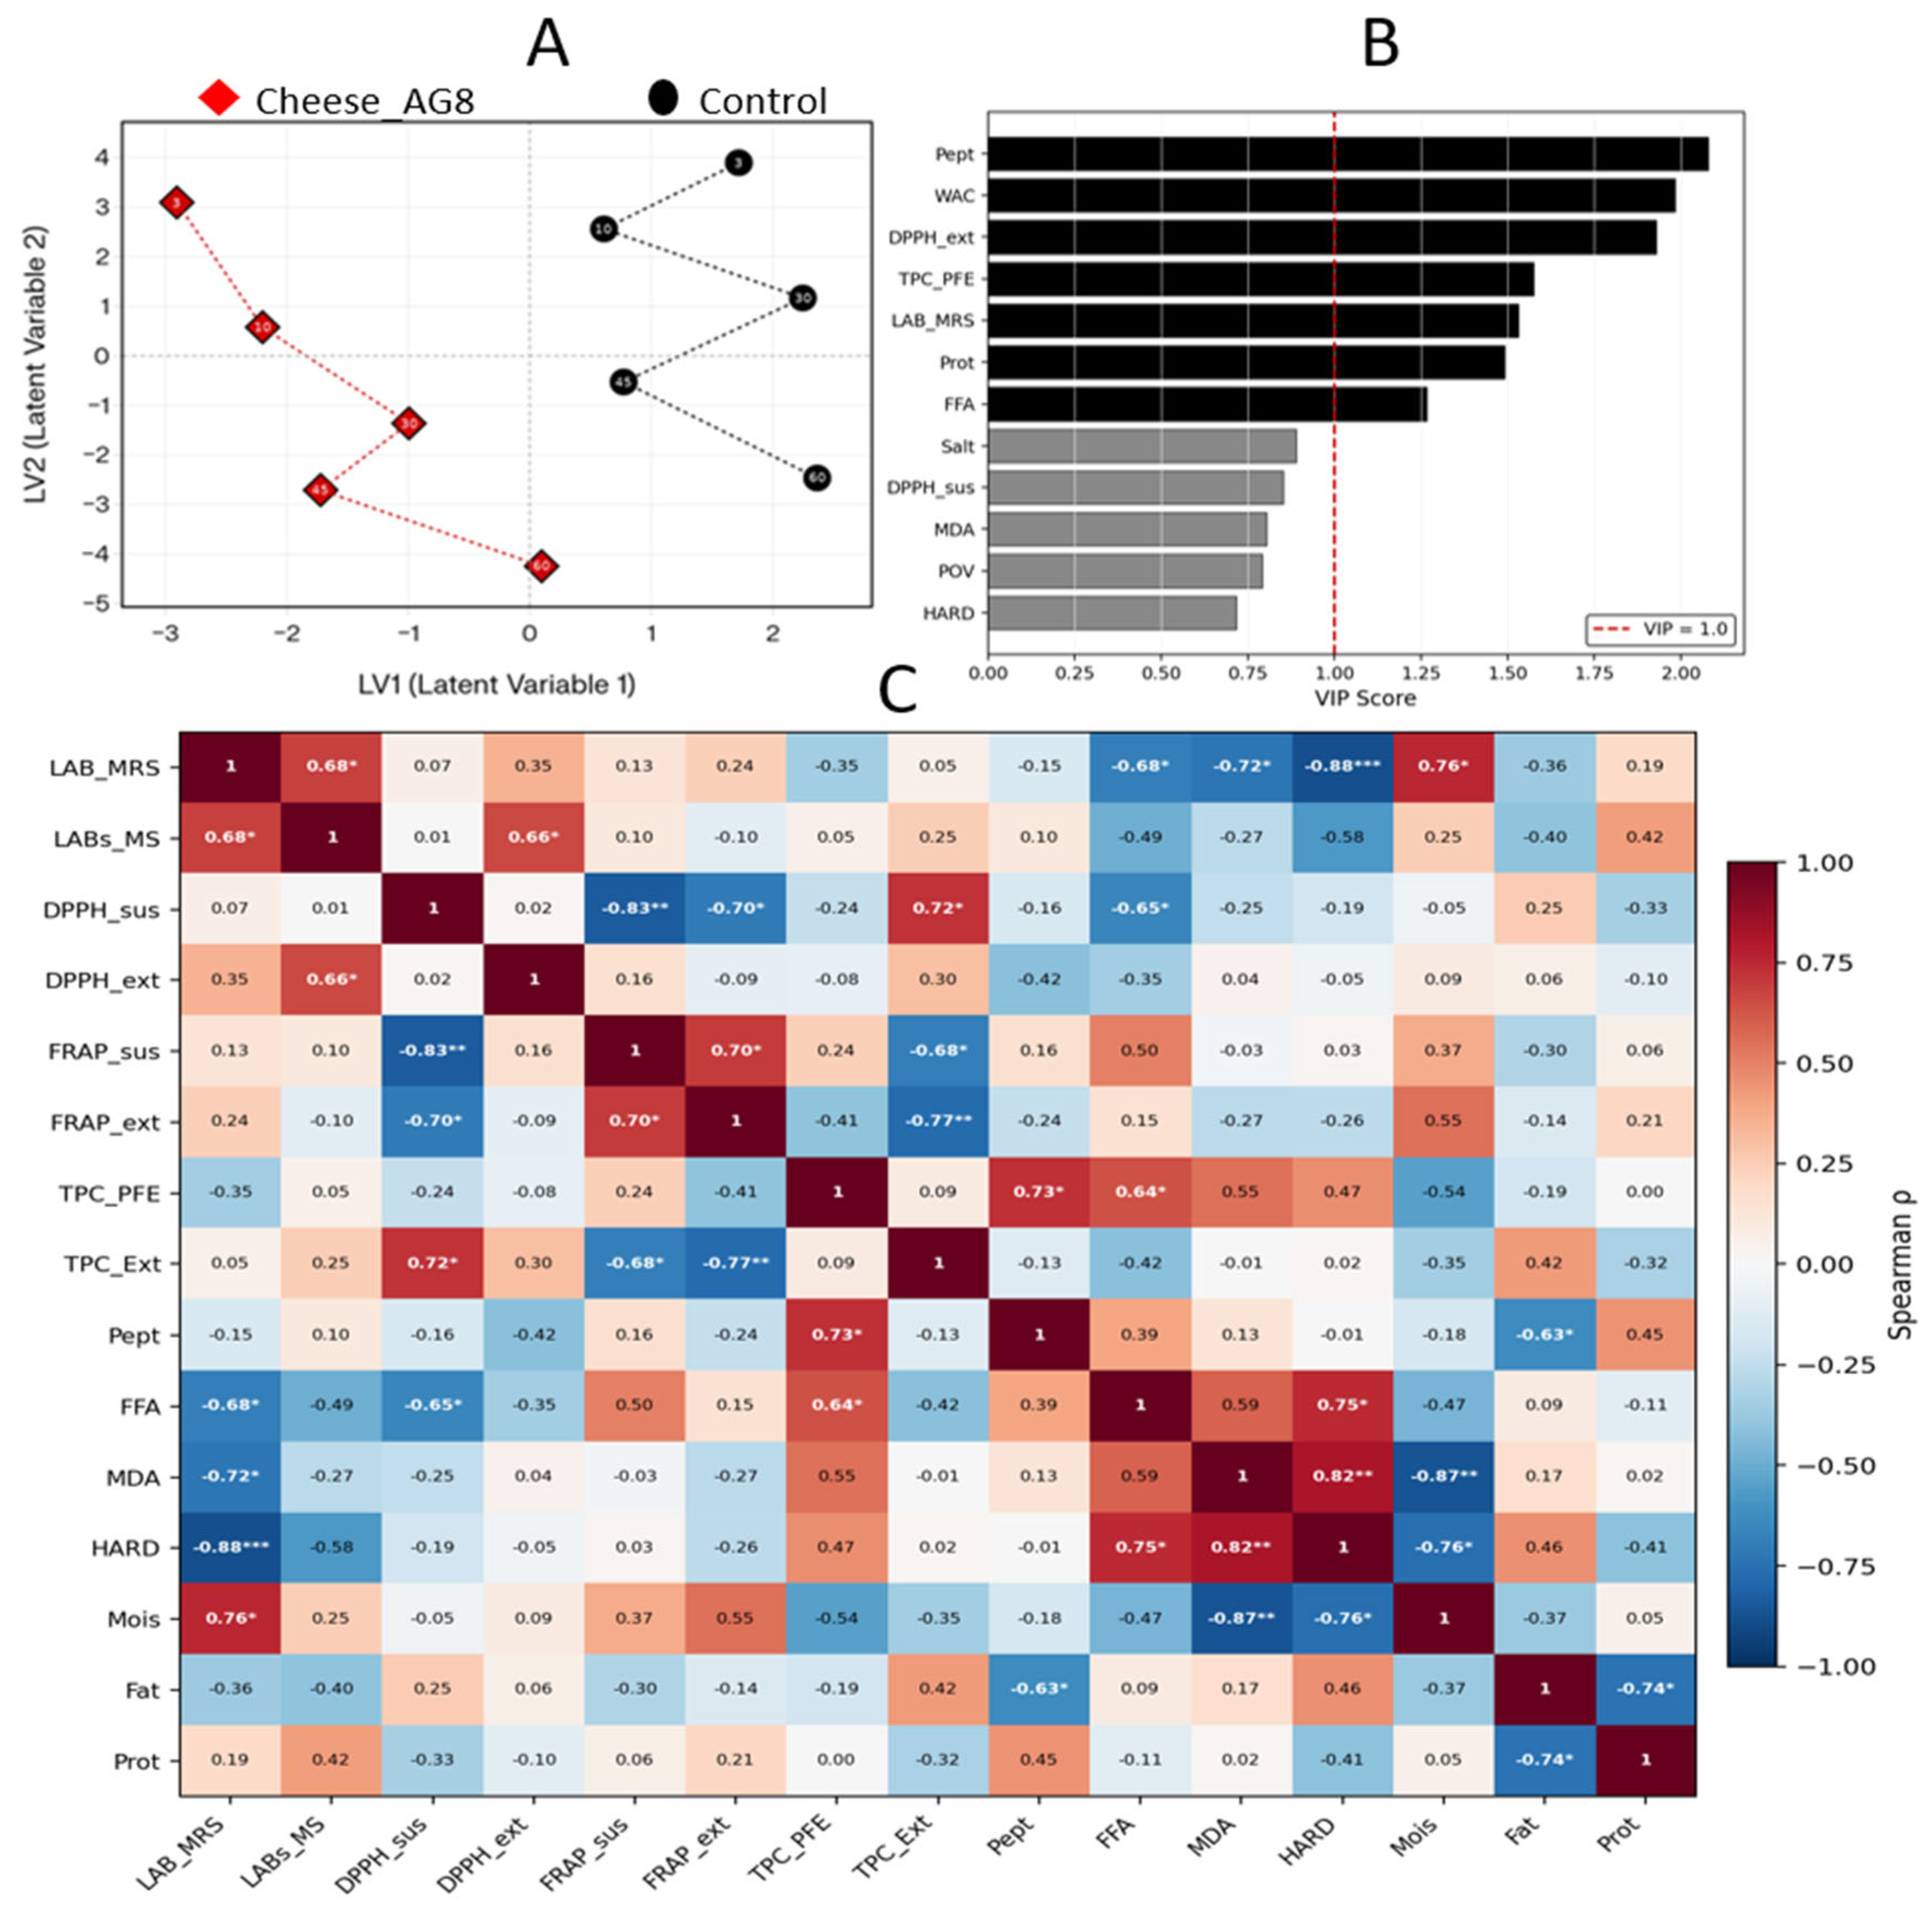

Table 1.
Cheese recipe.
| Components | CS control | CS+AG8 |
| Raw cow milk | 5 L | 5 L |
| Liquid commercial starter CHOOZIT™ | 10 ml | - |
| Liquid starter Limosilactobacillus fermentum AG8 | - | 10 ml |
| Commercial starter CHOOZIT™ (powder) | 0.1 g | 0.1 g |
| Liquid rennet | 0.2 ml | 0.2 ml |
| Calcium chloride solution (10%) | 5 ml | 5 ml |
Table 2.
Chemical composition of cheeses (mean values ± SD, n = 3).
| Samples | Ripening time,days | Lactic acid, % | Fat, % | Moister, % | Protein, % | Salt, % |
| CS | 3 | 1.422±0.013a | 26.40±0.71 a | 44.05±0.71 a | 26.33±0.07 a | 3.22±0.07 |
| 10 | 1.755±0.013 | 35.97±0.24 a | 35.52±0.71 | 25.33±0.40 | 3.18±0.40 | |
| 30 | 1.755±0.038 | 37.39±0.38 | 34.76±0.14 | 24.30±0.40 | 3.15±0.40 | |
| 45 | 1.521±0.038 | 37.78±0.05 | 34.70±0.28 | 24.50±0.33 | 3.48±0.33 | |
| 60 | 1.341±0.013 | 37.40±0.09 | 34.33±0.32 | 24.40±0.24 | 3.87±0.24 | |
| CS+AG8 | 3 | 1.364±0.010 a | 23.65±0.78 | 46.65±0.71 a | 26.64±0.13 a | 3.06±0.13 |
| 10 | 1.647±0.013 a | 37.78±0.17 | 35.99±0.71 | 23.16±0.84 a | 3.08±0.84 | |
| 30 | 1.746±0.025 | 37.49±0.09 | 36.72±0.71 a | 22.98±0.68 | 3.80±0.68 | |
| 45 | 1.431±0.038 a | 37.78±0.12 | 36.22±0.71 a | 22.13±0.51 a | 3.87±0.51 | |
| 60 | 1.224±0.025 a | 37.10±0.10 a | 35.91±0.04 a | 23.23±0.07 a | 3.77±0.07 |
a Letters indicate significant differences at p < 0.05 between groups.
Table 3.
Characterization of the exopolysaccharide fraction of cheeses (mean values ± SD, n = 5).
| Parameters | Control | Cheese_AG8 |
| Amount EPS, µg/g cheeze | 359 ± 56.37 | 1123.97 ± 49.95 a |
| Radical-scavenging activity (DPPH), % inhibition (1 mg/mL) | 28.13 ± 5.03 | 6.33 ± 2.72 a |
| Hydroxyl radical-scavenging activity, % inhibition (1 mg/mL) | 17.98 ± 3.38 | 5.06 ± 0.41 a |
| Lipase inhibition, EC50, µg/mL | 85.42 ± 13.4 | 315.16 ± 16.03 a |
| Glucosidase inhibition, EC50, µg/mL | 137,35 ± 21.55 | 552.54 ± 28.10 a |
a Letters indicate significant differences at p < 0.05 between groups.
Disclaimer/Publisher’s Note: The statements, opinions and data contained in all publications are solely those of the individual author(s) and contributor(s) and not of MDPI and/or the editor(s). MDPI and/or the editor(s) disclaim responsibility for any injury to people or property resulting from any ideas, methods, instructions or products referred to in the content. |
© 2026 by the authors. Licensee MDPI, Basel, Switzerland. This article is an open access article distributed under the terms and conditions of the Creative Commons Attribution (CC BY) license (http://creativecommons.org/licenses/by/4.0/).
Copyright: This open access article is published under a Creative Commons CC BY 4.0 license, which permit the free download, distribution, and reuse, provided that the author and preprint are cited in any reuse.


