

Submitted:
18 July 2026
Posted:
21 July 2026
You are already at the latest version
Abstract
In today’s increasingly complicated network environments, effective cybersecurity analytics necessitate scalable data processing systems that can handle massive amounts of diverse traffic data. This article compares relational, graph-based, and streaming data systems for cybersecurity analytics using the CICIDS2017 dataset. We specifically compare a columnar cloud data warehouse (Amazon Redshift) with a graph database (Neo4j) using example analytical queries to investigate trade-offs in query expressiveness, performance, and data modeling flexibility. In addition, we evaluate a real-time data intake pipeline built on Apache Kafka and Apache Cassandra to investigate ingestion throughput and low-latency storage features under simulated streaming workloads. The systems are examined independently to highlight their strengths and weaknesses in batch analytics, relationship-centric analysis, and real-time monitoring. The findings offer practical insights into how alternative data models and processing paradigms impact cybersecurity analytical tasks, as well as recommendations for selecting optimal data systems for network traffic analytics and intrusion detection use cases.
Keywords:
cybersecurity analytics
; network traffic analysis
; Redshift
; Neo4j
; Apache Kafka
; Apache Cassandra
; intrusion detection system (IDS)
; big data architecture
1. Introduction
In the evolving cybersecurity landscape, protecting network infrastructure and sensitive data has become increasingly critical. The rapid growth of networked systems and the rising sophistication of cyber attacks demand intrusion detection and analysis solutions that can scale to large data volumes while supporting both historical and near-real-time analysis. However, traditional data processing systems often face challenges related to scalability, latency, rigid schemas, and limited support for heterogeneous data access patterns.
To better understand how different data processing paradigms address these challenges, this paper presents an experimental comparison of multiple data systems commonly used in cybersecurity analytics. Specifically, we examine the use of Amazon Redshift, a columnar cloud data warehouse, and Neo4j, a graph database, to analyze network traffic data using representative analytical queries. Using the CICIDS2017 benchmark dataset [1], we compare these systems in terms of query expressiveness, performance behavior, and data modeling characteristics. In addition, to study real-time ingestion capabilities, we evaluate a streaming data pipeline based on Apache Kafka and Apache Cassandra, which is designed to support high-throughput, low-latency storage of network traffic records.
The systems are evaluated as independent pipelines to isolate the strengths and limitations of relational, graph-based, and wide-column data models for cybersecurity workloads. By examining batch analytics, relationship-centric queries, and streaming ingestion separately, this study provides practical insights into how different data processing approaches impact common network traffic analysis and intrusion detection tasks.
1.1. Contributions
This paper makes the following contributions:
- We analyze and contrast data modeling strategies, including star schema, graph representations, and wide-column time-series schema, highlighting their impact on cybersecurity query design and execution.
- We independently evaluate relational and graph data systems using representative cybersecurity analytical queries to examine how different data models influence query design, analytical capabilities, and system behavior.
- We evaluate a Kafka–Cassandra streaming architecture to examine its suitability for scalable real-time data ingestion and continuous cybersecurity monitoring.
- Unlike prior studies that primarily focus on integrated cybersecurity frameworks or intrusion detection models, this work provides an independent comparative evaluation of relational, graph-based, and streaming data systems, offering practical guidance for selecting data architectures based on cybersecurity analytics requirements.
1.2. Research Questions
This study primarily investigates the following research questions:
- RQ1: How do different data models, relational (Amazon Redshift) and graph-structured (Neo4j), compare with one another on query expressiveness and performance for cyber analytics?
- RQ2: How suitable is a Kafka–Cassandra–based streaming architecture for supporting real-time cybersecurity monitoring through scalable data ingestion, schema evolution, and low-latency analytics?
2. Related Work
The rising sophistication of modern cyber threats has prompted the development of a variety of data-driven techniques for intrusion detection and security analytics. Recent research in this area has covered a wide range of topics, including big data architectures for cybersecurity, real-time and streaming intrusion detection systems (IDS), graph- and knowledge-based threat modeling, and AI-powered security analytics.
Ullah and Babar [6] publish a comprehensive systematic literature study of big data cybersecurity analytics systems, identifying twelve quality features and seventeen architectural techniques across seventy-four systems. Their research emphasizes performance, scalability, accuracy, and dependability as primary design goals, while also exposing recurring issues with interoperability, modifiability, and privacy. This paper establishes a fundamental understanding of architectural trends and limitations in large-scale cybersecurity analytics.
Several studies propose integrated systems for real-time intrusion detection. Patel et al. [7] propose a simulation-based intrusion detection system (IDS) for industrial contexts that uses digital twins to localize attacks in real-time by comparing them to nominal system behavior. Their approach proves the viability of simulation-driven analytics in industrial IoT and critical infrastructure protection. Roshan and Zafar [8] offer AE-Integrated, a deep learning-based IDS that uses ensemble autoencoders and a Kafka-based streaming pipeline to achieve high detection accuracy on the CICIDS2017 dataset. Ouhssini et al. [9] describe a cloud-based distributed IDS that uses Apache Kafka for ingestion and Apache Spark for anomaly detection, exhibiting scalability across multi-cloud settings. Other works expand this strategy by incorporating machine learning models such as Isolation Forests, Random Forests, and LSTMs into big data security frameworks [10].
Beyond streaming and machine learning pipelines, academics have looked into wider cybersecurity architectures that include compliance, governance, and enterprise systems. Adejumo and Ogburie [11] focus on AI-driven cybersecurity programs for financial institutions, emphasizing layered protection mechanisms and regulatory compliance. Annapareddy [12] explores the relationship between big data, deep learning, and ERP systems, proposing that hybrid data architectures are crucial for spotting contextual abnormalities in enterprise-scale contexts.
Graph-based and knowledge-driven techniques have gained popularity for modeling complicated linkages in cybersecurity data. Pelofske et al. [13] model OSINT-based threat intelligence using Neo4j, demonstrating how graph databases may facilitate attack-path analysis and correlation across diverse threat indicators. Olcsák et al. [14] incorporate IDS alerts into attack graphs by converting Suricata-generated warnings into structured STIX objects and storing them in a Neo4j graph database. Their findings demonstrate the efficacy of graph representations in capturing links between incidents, indicators, and cyber-observable entities, hence improving attack-path visualization and incident correlation.
Daoud et al. [15] recently proposed sophisticated IDS approaches that use knowledge graphs, machine learning, and deep learning models. Their research demonstrates how graph-based semantic representations might overcome traditional IDS shortcomings, such as high false-positive rates and poor generalization to unknown attacks, by allowing for better reasoning over security data.
Similarly, end-to-end big data frameworks for automated threat detection have been developed. Ameedeen et al. [16] provide a cybersecurity analytics framework that includes Apache Kafka for data intake, Apache Flink for stream processing, deep learning models for anomaly detection, and automated reaction mechanisms. While framework-driven techniques prioritize detection accuracy and automation, they often abstract away the underlying data management trade-offs.
In contrast to previous research that has focused on integrated detection frameworks, machine learning models, or semantic reasoning, our study takes a data-systems-centric approach. We conduct empirical evaluations of relational, graph-based, and streaming data platforms as independent systems to investigate performance behavior, data modeling flexibility, and ingestion features for cybersecurity analytics. Rather than providing a new IDS or attack detection model, we present practical insights into how various data processing paradigms support large-scale cybersecurity workloads.
3. System Architecture and Data Modeling
This section discusses the experimental setup and data modeling methodologies utilized in the evaluated systems. Rather than presenting a unified or integrated architecture, this section describes the separate deployment and setup of relational, graph-based, and streaming data systems to support various cybersecurity analytics workloads. Each system is evaluated individually to emphasize its organizational structure, data modeling options, and applicability for specific types of analysis, such as historical batch analytics, relationship-centric queries, and real-time data ingestion.
3.1. Overview Diagram
Figure 1 depicts the three separate data processing pipelines tested in this study. All pipelines are based on the CICIDS2017 dataset, but they are set up and studied independently to identify the strengths and limitations of each data system.
Python-based ETL pipelines import structured network traffic data into Amazon Redshift for batch analytics, allowing for SQL-based queries on historical data. In parallel, Apache NiFi is used to convert the same dataset into a graph-compatible format and load it into Neo4j, allowing for relationship-oriented analysis via Cypher queries.
To assess real-time ingestion behavior, a synthetic workload generator developed from CICIDS2017 simulates streaming network traffic. This stream is published to Apache Kafka, a message broker, and then ingested by Apache Cassandra. Cassandra offers high-throughput, low-latency storage ideal for time-series and monitoring workloads. This streaming pipeline is assessed independently to determine intake throughput and latency characteristics, rather than end-to-end analytical integration.
3.2. Data Modeling
This subsection describes how the CICIDS2017 data were modeled for each database platform: Redshift, Neo4j, and Cassandra. Each of them uses a different data modeling method suitable for their storage and querying capabilities.
3.2.1. Relational Star-Schema Modeling:
As is evident from Figure 2, we use a star schema to represent the CICIDS2017 dataset on Amazon Redshift. The schema consists of one fact table and a number of dimension tables, including Source, Destination, Protocol, Packet, Flag, Date, and Flow Dimensions.
The fact table contains numeric measures and foreign keys referencing all dimensions. Dimension tables contain categorical attributes and are denormalized for performance. The dimension tables are short and wide (low number of rows, high number of columns) while the fact table is long and narrow (high number of rows, lower number of attributes).
ETL processing for Redshift was done through Python scripts, which handled cleaning, surrogate key creation, and load operations.
3.2.2. Graph-Oriented Data Modeling
The graph data model follows the same logical representation as the relational model but is implemented using Neo4j, where data are represented as nodes and relationships instead of relational tables. The graph was constructed through an ETL pipeline implemented using Apache NiFi, which transformed the CICIDS2017 dataset into node and relationship CSV files for import into Neo4j. This representation enables relationship-centric cybersecurity analytics such as multi-hop traversal, attack path exploration, and structural pattern discovery.
The graph schema consists of five node types and four relationship types, as summarized in Table 1. Each node represents a distinct cybersecurity entity, while relationships capture the interactions and associations among these entities. This schema provides a structured representation of network traffic suitable for graph-based cybersecurity analysis.
Each relationship contains a count property representing the frequency of the corresponding interaction observed in the dataset.
3.2.3. Wide-Column Time-Series Modeling:
In Cassandra, we used a wide-column NOSQL schema optimized for real-time ingestion. Each record is keyed by a composite primary key (e.g., Flow ID and Timestamp), and the remaining fields are numerical and categorical metrics such as packet counts, flag values, byte sizes, and attack labels.
The schema is designed for low-latency queries and high-speed writes, targeted for real-time monitoring and time-series applications. Data was streamed into Cassandra from Kafka using a simulated data generator and thread consumers.
3.3. ETL Strategy
Each target system in our architecture required a bespoke ETL process, based on its ingestion method and data model. We used a combination of Python, Apache NiFi, and Kafka to extract data from CSV files, transform it, and load it into Redshift, Neo4j, and Cassandra.
3.3.1. Batch ETL for Relational Warehouse:
For Redshift, we followed a batch ETL pipeline using Python scripts. The CICIDS2017 CSV files were read and cleaned to remove missing or corrupted rows. Some derived fields were added (e.g., concatenated IP: Port fields), and surrogate keys were given to all dimension tables. Data was loaded into the dimension tables first, then the fact table using foreign key references. We used Redshift’s COPY command for high-performance bulk loading from S3 buckets and applied distribution and sort keys for performance optimization.
3.3.2. Graph ETL for Relationship Analytics:
For Neo4j, we used Apache NiFi to implement a flow-based ETL pipeline. We loaded CSV files via NiFi’s GetFile processor, parsed them using RecordReader components, and directed them by record type. Each flow dynamically builds Cypher queries to build nodes and relationships in Neo4j. This ETL pipeline also handled data cleansing, attribute mapping, and transformation of flat tabular data into graph representations suitable for traversal queries. NiFi also provided a simple way to visualize the flow logic and data dependencies.
3.3.3. Streaming ETL for Wide-Column Store:
For streaming data in real time, we simulated real-time data from CICIDS2017 by building a custom Python application that published rows to Kafka topics. Kafka producers streamed data in batches of 100–500 records/sec. Kafka consumers, built with multi-threaded Python, consumed the data and performed transformations on the fly while inserting it into Cassandra. Low-latency ingestion and fault-tolerant data streaming were the main goals. We tuned batch sizes, buffer thresholds, and retry policies to optimize performance at simulated real-world load.
4. Methodology
This section describes the experimental setup and data processing workflows used to evaluate different data systems for cybersecurity analytics. Rather than presenting a unified or integrated system, this section outlines the independent batch and streaming pipelines developed for Amazon Redshift, Neo4j, Apache Kafka, and Apache Cassandra. The methodology covers data generation, preprocessing, transformation, schema design, and loading procedures applied within each system. An overview of the tools, data sources, and modeling choices for each platform is provided in Table 2.
4.1. Batch ETL for Relational Warehouse
Amazon Redshift ETL pipeline was used to allow analytical querying of the CICIDS2017 data on a star schema basis. The raw data, in the form of multiple CSV files—each corresponding to one day’s network data—was first amalgamated into a single DataFrame by using Python. Merging was performed to enable equal preprocessing and transformation.
Missing values during the transformation step, particularly in the Flow Bytes/s column, were imputed using the median per grouped attack label. Median imputation was used in place of the mean to reduce the impact of outliers. Timestamps were parsed and normalized into a consistent YYYY-MM-DD HH:MM:SS format to facilitate effective time-based querying in Redshift.
Then, the dataset was decomposed into individual dimension tables: Source, Destination, Protocol, Packet, Flag, Date, and Flow. Each of the dimension tables was de-duplicated, and a surrogate key was added to each unique record using a simple range-based ID generator in Python.
For composite attributes such as Source IP: Port and Destination IP: Port, we created new derived columns by concatenating the related columns. In the Flow dimension, a SHA-256 hash was calculated over a set of flow-related attributes (e.g., flow duration, byte rates, and IAT measures) to generate a unique fingerprint for each occurrence of a flow. These hash values were then used to determine individual flows, and each one was linked to a surrogate key.
After we had constructed all the dimension tables, we built the fact table by replacing raw values with respective surrogate keys from the dimension tables. Each fact record has a foreign key reference to the respective entities along with the attack label.
All of the resulting fact and dimension tables were exported as individual CSVs and uploaded into an Amazon S3 bucket. Using Redshift’s COPY command, we performed parallel, efficient data ingestion from S3 into Redshift. We also defined distribution keys across highly joined columns and sort keys across the timestamp column to improve analytical query performance.
This Redshift-powered star schema infrastructure facilitated elastic processing of complex analytics such as top attacking IP identification, protocol usage pattern analysis, and time-based anomaly cluster detection.
4.2. Graph ETL for Relationship Analytics
To represent and comprehend complex network relationships, we loaded a Neo4j graph database with Apache NiFi as the ETL engine. The main source data (CICIDS2017) remained the same, but the schema of the data was transformed from a table to a graph representation to enable querying on relationships and visualization of the attack path.
Apache NiFi was selected for its visual programming interface and flow-based architecture, making it well-suited for orchestrating multi-stage transformations. Each raw CSV file—representing entities like Source IP, Destination IP, Protocol, and Events—was first ingested using NiFi’s GetFile processor. Data was parsed using CSVReader and routed to specific flow branches based on record type using RouteOnAttribute.
Each branch handled a specific entity or relationship. For example:
- Source and Destination IPs were depicted as nodes.
- Protocols and Events were depicted as nodes.
- Relations such as COMMUNICATES_WITH, USES_PROTOCOL, and TRIGGERS_EVENT were used to relate nodes.
Processors like UpdateAttribute and ConvertRecord normalized fields and generated Cypher-ready queries. Composite keys, such as IP: Port, were built for uniqueness. These fields were used as primary keys for node identification and were hashed wherever used for de-duplication.
The most critical job was dynamically generating Cypher queries, Neo4j’s native query language. This was achieved by using ReplaceText to construct MERGE and CREATE queries, and PutCypher to execute them straight into the Neo4j database. This offered idempotent inserts and avoided duplicate edges and nodes.
The consequent graph model supported sophisticated analytics that are not possible using a traditional relational schema. For example, we could traverse multi-hop paths, identify the key connector nodes in an attack chain, and graph inter-host communication using Neo4j’s native browser UI.
NiFi’s modularity, error tracing, and traceability rendered it a valuable asset in the process management of ETL procedures into a graph database, especially when mapping flat CSV logs to structured, relationship-aware entities.
4.3. Streaming ETL for Wide-Column Store
In order to simulate real-time intrusion detection, we established a streaming data pipeline using Apache Kafka for event transport and Apache Cassandra for high-velocity storage. A synthetic dataset, derived from CICIDS2017, was generated with Python data generation libraries. IPv4 addresses for source and destination nodes were created with IP address generators, and ports, protocols, timestamps, and attack types were randomly assigned to create realistic flow records. The information was exported to a CSV file and used as input to the producer pipeline.
A Python Kafka producer was put in place to read every record of the synthetic dataset, serialize it as JSON, compress it using zlib, and post it to a Kafka topic named test-topic. The producer was configured with a batch size of 64 KB and a linger time of 5 milliseconds to provide a trade-off between throughput and latency, as in real-world streaming.
On the consumer side, a multithreaded Kafka consumer was implemented to subscribe to the same topic and consume data in parallel. Each consumer thread handled a Kafka partition, decompressing incoming messages and deserializing the data into structured records. The records were written into Cassandra using batched writes. The Cassandra schema was a wide-column model optimized for time-series ingestion, with a composite primary key based on flow identifiers and timestamps.
The pipeline configuration, summarized in Table 3, demonstrated effective real-time data streaming and storage behavior using Kafka and Cassandra for intrusion detection workloads requiring low-latency event capture and scalable throughput.
4.3.0.1. Synthetic Traffic Generation:
To evaluate the ingestion throughput and latency characteristics of the Kafka–Cassandra streaming pipeline under controlled conditions, we employ a synthetic network traffic generator inspired by the CICIDS2017 dataset. The primary objective of this synthetic workload is systems-level performance evaluation rather than the realistic emulation of cyber attack behavior.
The generator produces flow-level records with schema consistency matching the original dataset, including fields such as flow identifiers, source and destination IP addresses, ports, protocols, timestamps, and attack labels. Values are generated using configurable randomization strategies (e.g., IPv4 address generation, valid port ranges, categorical protocol selection) and timestamp progression, enabling scalable and repeatable workload generation at specified ingestion rates. This design allows controlled stress testing of the streaming pipeline while avoiding dependencies on packet-level replay or raw PCAP processing.
By decoupling ingestion benchmarking from attack realism, the synthetic workload enables reproducible evaluation of throughput, buffering behavior, and end-to-end latency in the Kafka–Cassandra pipeline. The synthetic data is used exclusively for streaming performance analysis and is not employed for intrusion detection accuracy evaluation or machine learning model training.
5. Experimental Setups, Results and Analysis
This section outlines the experimental setups, performance measurements, and analytical observations made while evaluating various data systems for cybersecurity analytics. We look at batch analytics with Amazon Redshift and Neo4j, as well as a real-time ingestion pipeline built on Apache Kafka and Apache Cassandra. The purpose of these tests is to empirically highlight performance features, modeling trade-offs, and system behavior across several data processing paradigms, rather than to evaluate a unified or integrated platform.
5.1. Experimental Setup
We benchmarked three deployment setups: Redshift for SQL-style OLAP queries, Neo4j for graph-style traversal, and Kafka+Cassandra for stream ingestion. Each setup was standalone and tested to highlight trade-offs in latency, modeling sophistication, and ingestion scale.
5.1.1. Relational Warehouse Cluster Configuration:
The Amazon Redshift cluster was started in the us-west-1 (N. California) region using two dc2. large nodes. Each of these nodes contains 15 GiB of memory and 2 vCPUs. The cluster was configured as shown in Table 4 for public access, with TCP port 5439 routed to the client machine through a custom VPC security group.
To enable loading data from Amazon S3, the cluster was set up with an IAM role that contains S3 read and Redshift run rights. All data files in CSV format were stored in a bucket named myawsbucketfordwproject and loaded into Redshift using Redshift’s parallelized COPY command.
5.1.2. Graph Analytics Engine Configuration:
Neo4j was utilized to represent and examine complex relationships within the CICIDS2017 dataset using a graph data model. The experiments were conducted on local machines on a MacBook Pro with 16 GB of RAM and an Apple M1 chip.
We used Neo4j Community Edition 5.x, and the data were streamed in using Apache NiFi. The ETL pipeline processed tabular network logs into structured graph data comprised of nodes and relationships. Apache NiFi processors such as UpdateAttribute, ConvertRecord, and PutCypher were used to generate and execute Cypher queries dynamically. Node and relationship data were preprocessed as CSV files, archived as Node.zip and Relationship.zip.
The previous graph contained approximately 1.1 million nodes and 2.3 million relationships that supported downstream analysis such as multi-hop traversal, identification of pivot nodes, and visualizations of attack chains. Table 5 summarizes the Neo4j configuration.
5.1.3. Streaming Ingestion Pipeline Configuration:
For real-time data ingestion simulation, Apache Kafka, Zookeeper, and Cassandra were executed on the local machine with Docker. Eight-partitioned Kafka topics were established, and simulated CICIDS-style data were published in JSON format via a Python producer with zlib compression. Custom Python code using Faker and NumPy was utilized to generate synthetic data, producing random flow records with various IP addresses, ports, protocols, timestamps, and attack labels to mimic real network traffic.
The consumer, which was in Python, used multi-threading to read and insert batches into Cassandra. Cassandra utilized a time-series schema via a composite primary key of flow_id, time_stamp. The ingestion pipeline processed over 20,000 records per simulation with an average throughput of 100–500 records/sec/thread. Table 6 provides the Kafka and Cassandra Streaming Pipeline configuration.
It is important to note that these systems were deployed on different execution environments (cloud-based for Redshift and local for Neo4j and Kafka–Cassandra). As a result, performance results are interpreted comparatively within each system rather than as direct absolute latency comparisons across platforms.
5.2. Amazon Redshift Query Optimization
We executed ten representative analytical queries on Amazon Redshift to evaluate the effectiveness of the proposed optimization strategy. As detailed in Appendix A, the selected workload reflects common cybersecurity analytical tasks, including attack frequency analysis, protocol-based traffic analysis, anomaly detection, packet-level statistics, and temporal traffic aggregation, thereby providing a comprehensive assessment of query performance. Each query was tested on two schema variants: one without optimization, and one using distribution and sort keys. Table 7 highlights the significant performance improvements observed with optimized schema design.
5.3. Selection of Representative Cybersecurity Analytical Tasks
This section presents the representative analytical tasks selected to evaluate the proposed data systems. These tasks were chosen because they reflect common cybersecurity analyses performed during network monitoring and incident investigation rather than being selected arbitrarily. Each query represents a distinct analytical objective frequently encountered by security analysts, enabling the evaluation of how relational and graph-based data models support different cybersecurity workloads. Accordingly, the same analytical tasks were implemented using SQL in Amazon Redshift and Cypher in Neo4j to examine their suitability for identical analytical scenarios. In contrast, the Kafka–Cassandra pipeline was evaluated independently to demonstrate its capability for continuous data ingestion and low-latency processing in real-time cybersecurity monitoring rather than historical analytical query processing.

Table 8.
Representative Cybersecurity Analytical Tasks Used for Evaluation
| Query | Analytical Task | Cybersecurity Significance |
|---|---|---|
| Q1 | Attack Frequency Analysis | Identifies recurring attack sources and supports the detection of suspicious network behavior. |
| Q2 | Threat Source Identification | Determines the most active source IPs associated with different attack categories to assist forensic investigations. |
| Q3 | Attack Target Analysis | Identifies the most frequently targeted destination systems, enabling prioritization of defensive measures. |
| Q4 | Traffic Statistical Characterization | Analyzes packet-level statistics across attack types to understand network traffic behavior and attack characteristics. |
5.4. Comparative Evaluation of Representative Analytical Tasks
To complement the optimization study, we evaluated four representative cybersecurity analytical tasks on both Amazon Redshift and Neo4j. These tasks were selected because they reflect common network security investigations, including attack frequency analysis, event ranking, destination traffic analysis, and packet-level statistics. Rather than serving as exhaustive performance benchmarks, they provide an independent comparison of relational and graph-based data models by illustrating differences in data representation, query formulation, and execution behavior. The corresponding SQL and Cypher implementations are provided in Appendix B to facilitate reproducibility, while the execution times for each analytical task are reported in Table 9.
All mentioned execution times are for single experimental runs conducted under controlled conditions. While this is enough for displaying relative system behavior and modeling trade-offs, future studies will incorporate repeated trials and formal statistical analysis to better analyze performance variability.
Columnar storage and index joins enhance the performance of Redshift, while Neo4j’s graph traversal logic is better at processing certain relationship-based queries. Screenshots of query results and performance logs will be made publicly available upon acceptance to support reproducibility.
Note: Query 2 in Neo4j was significantly slower than in Redshift due to more costly traversals and a lack of indexing on intermediate node properties. While Neo4j excels at relationship-centric queries, in this instance, dense connectivity between nodes led to deeper traversal and longer runtime, suggesting a trade-off in graph databases for certain types of aggregations.
5.5. Evaluation of the Kafka–Cassandra Streaming Pipeline
Unlike Amazon Redshift and Neo4j, which were evaluated using representative analysis tasks based on historical cybersecurity data, the Kafka–Cassandra pipeline was created to show off a streaming-oriented architecture for continuous network traffic ingestion and low-latency data storage. The goal of this experiment is not to compare query execution performance to other platforms, but to determine the viability of using a distributed streaming pipeline for real-time cybersecurity monitoring.
To simulate a continuous network environment, synthetic CICIDS2017-style traffic was created and published to Apache Kafka topics. Kafka consumers received incoming events and stored them in Apache Cassandra using a wide-column data format designed for high-throughput sequential writes. The evaluation focuses on system-level performance parameters such as ingestion throughput and end-to-end latency, both of which are crucial for security operations that require continuous event collecting and monitoring.
The experimental results show that the suggested streaming pipeline can handle large ingestion throughput while maintaining low processing latency, showing its appropriateness for real-time cybersecurity monitoring applications. These findings indicate that the Kafka–Cassandra architecture can successfully supplement historical analytical systems by allowing for scalable event intake and durable storing of continually generated network traffic.
5.6. Practical Decision Matrix
Instead of pointing to a universally better option, the experimental evaluation shows that each data system has unique capabilities depending on the analytical goal. Based on the observed characteristics of the examined platforms, Table 10 presents practical advice for picking an appropriate data system for different cybersecurity analytical situations.
The decision matrix is meant to provide practical help for picking data systems that meet specified cybersecurity needs. Rather than defining a single best-performing platform, the experimental results show that the applicability of each system is dependent on the analytical workload, data characteristics, and operational goals.
6. Discussion & Limitations
Several technical and practical observations were made while designing, deploying, and evaluating the data systems under consideration in this study. These findings represent the differences in requirements and trade-offs across relational, graph-based, and streaming data platforms when applied to cybersecurity analytics workloads.
Lessons Learned
- ETL Complexity Varies by Platform: Amazon Redshift necessitated tight schema design and surrogate key management to enable efficient analytical querying. Neo4j, on the other hand, focused on relationship-centric modeling and creating dynamic Cypher queries. The Kafka and Cassandra-based streaming pipeline prioritizes parallelism, intake rate tuning, and operational consistency.
- Data Modeling Strongly Influences Query Design: Representing the same network traffic data with relational, graph, and wide-column models revealed that query formulation and optimization methodologies are inextricably linked to the underlying data model. Effective analytics necessitate platform-specific design considerations rather than a one-size-fits-all solution.
- Batch and Streaming Analytics Serve Complementary Roles: Batch-oriented systems, such as Redshift and Neo4j, are ideal for historical analysis and exploratory exploration, whereas the Kafka-Cassandra pipeline enables low-latency ingestion for near-real-time monitoring. Balancing these approaches remains a practical problem for cybersecurity analytics procedures.
Technical Challenges
- Schema and Key Mapping: Early versions of the Redshift schema included discrepancies in foreign key mappings. These concerns were overcome during ETL by creating surrogate keys methodically and carefully aligning fact and dimension tables.
- Kafka–Cassandra Throughput Tuning: Optimizing ingestion performance necessitated precise adjustment of Kafka batch sizes and Cassandra insert procedures. Small batches resulted in inefficiencies, but excessively large batches created memory strain. Empirically determined settings (e.g., batch size of 5 and Kafka buffering of 64 KB) resulted in a stable balance of performance and resource consumption.
- Streaming Consistency Management: To ensure message ordering and eliminate duplication in the Kafka-Cassandra pipeline, partitions and consumer offsets needed to be handled explicitly in a multi-threaded execution environment.
6.1. Limitations
This study has several limitations that should be considered when interpreting the results. First, the evaluated platforms were deployed in different computing environments. Amazon Redshift was evaluated on a managed cloud cluster, whereas Neo4j and the Kafka–Cassandra pipeline were deployed in a local environment. Consequently, the reported execution times should not be interpreted as hardware-normalized performance benchmarks. Instead, the experimental evaluation is intended to provide an independent assessment of the behavior, query characteristics, and practical applicability of relational, graph-based, and streaming data systems for representative cybersecurity analytical tasks.
Second, the analytical workload consists of a representative set of cybersecurity queries rather than an exhaustive benchmark covering every possible network analysis scenario. While the selected queries capture common tasks such as attack frequency analysis, traffic aggregation, relationship exploration, and anomaly detection, additional workloads may further characterize the behavior of these platforms under different operational requirements. In addition, the reported execution times are based on single experimental runs and therefore do not capture variability across repeated executions. Although the experiments provide representative observations of system behavior, repeated trials with statistical measures such as mean execution time and standard deviation would provide a more comprehensive assessment of performance stability.
Finally, the Kafka–Cassandra evaluation focuses primarily on demonstrating a streaming architecture for continuous cybersecurity monitoring. Although ingestion throughput and end-to-end latency were analyzed, the study does not investigate long-term operational characteristics such as fault tolerance, recovery behavior, or scalability under large distributed deployments, which remain important directions for future work.
7. Conclusion and Future Directions
This paper presented a comparative evaluation of relational, graph-based, and streaming data systems for cybersecurity analytics using the CICIDS2017 dataset. Amazon Redshift, Neo4j, and a Kafka–Cassandra pipeline were evaluated independently to assess their performance characteristics, data modeling implications, and suitability for different classes of network traffic analysis workloads.
The results demonstrate that optimized Redshift schemas can significantly improve query performance for OLAP-style aggregation and time-series analysis. Neo4j enables expressive relationship-centric queries and multi-hop exploration of network interactions, which are difficult to model efficiently using purely relational approaches. The Kafka–Cassandra pipeline exhibited stable ingestion throughput and low end-to-end latency under controlled workloads, highlighting its applicability for near-real-time data capture and monitoring scenarios.
Rather than proposing a unified or integrated platform, this study emphasizes the complementary strengths and trade-offs of different data processing paradigms when applied to cybersecurity analytics. The reported performance results should be interpreted as an independent evaluation of representative analytical workloads under their respective deployment environments rather than as hardware-normalized performance benchmarks. These findings provide practical guidance for selecting appropriate data systems based on analytical requirements, data characteristics, and performance constraints.
Future work includes extending this evaluation to more advanced graph analytics, conducting repeated experimental trials with multiple executions to report average execution times and standard deviations, and deploying the evaluated platforms within a common computing environment to enable hardware-normalized benchmarking. In addition, exploring tighter integration between batch and streaming systems remains an important direction. The synthetic traffic generator used for streaming performance evaluation may also be extended to preserve empirical feature distributions and temporal characteristics derived from real network traffic datasets. Such extensions could enable more realistic benchmarking scenarios and potentially support the development of a reusable synthetic network traffic dataset or benchmarking framework as a standalone research contribution. Other directions include incorporating machine learning models for automated anomaly detection and developing visualization dashboards to support interactive security monitoring.
Author Contributions
Conceptualization, M.K. and V.P.; methodology, M.K.; software, M.K.; validation, M.K. and V.P.; formal analysis, M.K.; investigation, M.K.; resources, M.K.; data curation, M.K.; writing—original draft preparation, M.K.; writing—review and editing, M.K. and V.P.; visualization, M.K.; supervision, V.P.; project administration, V.P. All authors have read and agreed to the published version of the manuscript.
Funding
This research received no external funding.
Institutional Review Board Statement
Not applicable.
Informed Consent Statement
Not applicable.
Data Availability Statement
The CICIDS2017 dataset used in this study is publicly available at https://www.unb.ca/cic/datasets/ids-2017.html. Experimental artifacts, query scripts, and configuration details are available at the following repositories: https://github.com/mayankkksadc/Data_Warehouse_Project_1, https://github.com/mayankkksadc/Data_Warehouse_Project_Graph_Analysis, and https://github.com/mayankkksadc/network-traffic-simulation.
Acknowledgments
The authors acknowledge the insightful contributions made by Prem Shah, Mayuka Kothuru, and Kushal Adhyaru in the early stages of this work.
Conflicts of Interest
The authors declare no conflicts of interest.
Abbreviations
The following abbreviations are used in this manuscript:
| IDS | Intrusion Detection System |
| ETL | Extract, Transform, Load |
| OLAP | Online Analytical Processing |
| SQL | Structured Query Language |
| NoSQL | Non-Relational Database System |
| CSV | Comma-Separated Values |
| JSON | JavaScript Object Notation |
| OSINT | Open-Source Intelligence |
| IAT | Inter-Arrival Time |
| VPC | Virtual Private Cloud |
| IAM | Identity and Access Management |
| STIX | Structured Threat Information Expression |
| PCAP | Packet Capture |
Appendix A Redshift Analytical Query Workload
To evaluate the impact of the proposed Redshift optimization strategy, we executed a workload consisting of ten representative analytical queries on both the baseline schema and the optimized schema. Since the optimization was performed through physical database design (distribution keys, sort keys, compression encoding, and table organization) rather than query rewriting, the same SQL queries were executed in both experimental settings. Therefore, only the analytical objectives are summarized in this appendix.
The complete SQL implementation of all benchmark queries is available in the GitHub repository to facilitate reproducibility.
Table A1.
Analytical Query Workload Used for Redshift Optimization Evaluation
| Query | Analytical Objective |
|---|---|
| Q1 | Measure the frequency of FTP-Patator attacks grouped by source IP address and source port. |
| Q2 | Identify the source IP generating the highest number of events for each attack category. |
| Q3 | Compute the average packet size for every attack class. |
| Q4 | Analyze the hourly distribution of network traffic for each attack category. |
| Q5 | Retrieve the top three destination IP addresses receiving the highest traffic for every attack class. |
| Q6 | Compute the total number of forwarded packets for each source IP grouped by communication protocol. |
| Q7 | Identify the highest forwarded packet volume for each source IP and protocol combination. |
| Q8 | Detect sudden spikes in packet length using window-based temporal analysis. |
| Q9 | Identify source-destination pairs exhibiting unusually high TCP flag counts that may indicate suspicious activity. |
| Q10 | Detect anomalous traffic patterns by jointly analyzing TCP/UDP flag counts, packet length statistics, protocol type, source, destination, and hourly traffic distribution. |
The execution latency of these ten analytical queries before and after applying the proposed optimization strategy is reported in Section 5.2.
Appendix B Representative Cross-Database Analytical Queries
To ensure a fair comparison between the relational and graph data models, four representative cybersecurity analytical tasks were implemented using both Amazon Redshift (SQL) and Neo4j (Cypher). These queries correspond to the common analytical scenarios discussed in Section 5 and were selected because they represent practical network security investigations routinely performed by security analysts.
For each analytical task, the equivalent SQL and Cypher implementations are presented below.
Appendix B.1. Query 1: FTP-Patator Attack Frequency by Source
Analytical Objective:
Identify the frequency of FTP-Patator attacks generated by each source IP address and source port.
Amazon Redshift (SQL)
SELECT s.source_ip,
s.source_port,
f.Label,
COUNT(*)
FROM source_dim s
JOIN fact_table f
ON s.surrogate_key = f.Source_ID_FK
GROUP BY s.source_ip,
s.source_port,
f.Label
HAVING f.Label=’FTP-Patator’;
Neo4j (Cypher)
MATCH (s:Source)-[r:ATTACK_INITATED]->(l:Label)
WHERE l.Label_Name=’FTP-Patator’
RETURN s.Source_IP,
s.Source_Port,
COUNT(r);
Appendix B.2. Query 2: Top Source IP by Event Count
Analytical Objective:
Identify the source IP responsible for the highest number of events for each attack category.
Amazon Redshift (SQL)
WITH labelcount AS (
SELECT s.source_ip,
s.source_port,
f.Label,
COUNT(*) AS cnt,
ROW_NUMBER() OVER
(PARTITION BY f.Label
ORDER BY cnt DESC) AS row_rank
FROM source_dim s
JOIN fact_table f
ON s.surrogate_key=f.Source_ID_FK
GROUP BY s.source_ip,
s.source_port,
f.Label)
SELECT source_ip,
source_port,
Label,
cnt AS Max_Count
FROM labelcount
WHERE row_rank=1;
Neo4j (Cypher)
MATCH (s:Source)-[r:ATTACK_INITATED]->(l:Label)
WITH l.Label_Name AS label,
s.Source_IP AS SourceIP,
s.Source_Port AS SourcePort,
COUNT(r) AS Total_Count
ORDER BY Total_Count DESC
LIMIT 1
RETURN label,
SourceIP,
SourcePort,
Total_Count AS Max_Count;
Appendix B.3. Query 3: Top Three Destination IPs
Analytical Objective:
Identify the three destination IP addresses receiving the highest traffic volume for each attack category.
Amazon Redshift (SQL)
WITH denserankcount AS (
SELECT d.destination_ip,
f.Label,
COUNT(*) AS Total_Count,
DENSE_RANK() OVER
(PARTITION BY f.Label
ORDER BY Total_Count DESC)
FROM dest_dim d
JOIN fact_table f
ON f.Dest_IP_FK=d.surrogate_key
GROUP BY d.destination_ip,
f.Label)
SELECT destination_ip,
Label,
Total_Count
FROM denserankcount
WHERE dense_rank<=3;
Neo4j (Cypher)
MATCH (l:Label)-[r:ATTACKED]->(d:Destination)
WITH l.Label_Name AS label,
collect({
Destination_IP:d.Destination_IP,
Destination_Port:d.Destination_Port,
EventCount:r.Count}) AS collect_stats
UNWIND collect_stats AS unwind_stats
WITH label,unwind_stats
ORDER BY unwind_stats.EventCount DESC
WITH label,
collect(unwind_stats)[0..3]
AS final_combined_stats
UNWIND final_combined_stats AS top_stats
RETURN label,
top_stats.Destination_IP,
top_stats.EventCount;
Appendix B.4. Query 4: Average Packet Size by Attack Type
Analytical Objective:
Compute the average packet size associated with each attack category.
Amazon Redshift (SQL)
SELECT f.Label,
AVG(p.Average_Packet_Size)
FROM fact_table f
JOIN packet_dim p
ON p.surrogate_key=f.Packet_FK
GROUP BY f.Label;
Neo4j (Cypher)
MATCH (p:Packet)-[r:CLASSIFIED_AS]->(l:Label)
WITH l.Label_Name AS label,
AVG(p.Average_Packet_Size)
AS Average_Packet_Size
RETURN label,
Average_Packet_Size;
References
- Sharafaldin, I.; Lashkari, A.H.; Ghorbani, A.A.; et al. Toward generating a new intrusion detection dataset and intrusion traffic characterization. ICISSp 2018, 1, 108–116. [Google Scholar] [CrossRef]
- Amazon Web Services. Amazon Redshift Documentation. 2023. Available online: https://docs.aws.amazon.com/redshift/ (accessed on 2024-06-01).
- Neo4j, Inc. Neo4j Graph Database Platform. 2023. Available online: https://neo4j.com/docs/ (accessed on 2024-06-01).
- Apache Software Foundation. Apache Kafka Documentation. 2023. Available online: https://kafka.apache.org/documentation/ (accessed on 2024-06-01).
- Apache Software Foundation. Apache Cassandra Documentation. 2023. Available online: https://cassandra.apache.org/doc/latest/ (accessed on 2024-06-01).
- Ullah, I.; Babar, M. Architectural Tactics and Quality Attributes for Big Data Cybersecurity Analytic Systems: A Systematic Literature Review. J. Syst. Softw. 2020, 170, 110763. [Google Scholar] [CrossRef]
- Patel, A.; Schenk, T.; Knorn, S.; Patzlaff, H.; Obradovic, D.; Halblaub, A.B. Real-time, simulation-based identification of cyber-security attacks of industrial plants. In Proceedings of the 2021 IEEE International Conference on Cyber Security and Resilience (CSR); IEEE, 2021; pp. 267–272. [Google Scholar]
- Roshan, K.; Zafar, A. AE-Integrated: Real-time network intrusion detection with Apache Kafka and autoencoder. Concurr. Comput. Pract. Exp. 2024, 36, e8034. [Google Scholar] [CrossRef]
- Ouhssini, M.; Afdel, K.; Idhammad, M.; Agherrabi, E. Distributed intrusion detection system in the cloud environment based on Apache Kafka and Apache Spark. In Proceedings of the 2021 Fifth International Conference On Intelligent Computing in Data Sciences (ICDS); IEEE, 2021; pp. 1–6. [Google Scholar]
- lakshmi Middae, V. Enhancing Cloud Security with AI-Driven Big Data Analytics. Am. J. Eng. Technol. 2025, 7, 185–191. [Google Scholar] [CrossRef]
- Adejumo, A.; Ogburie, C. The role of cybersecurity in safeguarding finance in a digital era. World J. Adv. Res. Rev. 2025, 25, 1542–1556. [Google Scholar] [CrossRef]
- Annapareddy, V.N. The Intersection of Big Data, Cybersecurity, and ERP Systems: A Deep Learning Perspective. J. Artif. Intell. Big Data Discip. 2025, 2, 45–53. [Google Scholar]
- Pelofske, E.; Liebrock, L.M.; Urias, V. Cybersecurity threat hunting and vulnerability analysis using a Neo4j graph database of open source intelligence. arXiv 2023, arXiv:2301.12013. [Google Scholar]
- Olcsák, L.; Fleiner, R.; Újfalusi, Z.G.; Bánáti, A. IDS incident integration into Attack Graph. In Proceedings of the 2025 IEEE 23rd Jubilee International Symposium on Intelligent Systems and Informatics (SISY), 2025; pp. 000195–000200. [Google Scholar] [CrossRef]
- DAOUD, M.A.; MOSTEFAOUI, S.A.M.; MEGHAZI, H.M.; LABBADI, O.; Zenina, C.; BOUGUESSA, A. Advanced Intrusion Detection Systems Leveraging Knowledge Graph-Based Techniques. In Proceedings of the 2024 12th International Conference on Systems and Control (ICSC), 2024; pp. 424–428. [Google Scholar] [CrossRef]
- Ameedeen, M.A.; Hamid, R.A.; Aldhyani, T.H.; Al-Nassr, L.A.K.M.; Olatunji, S.O.; Subramanian, P. A framework for automated big data analytics in cybersecurity threat detection. Mesopotamian J. Big Data 2024, 2024, 175–184. [Google Scholar] [CrossRef]
Figure 1.
Independent experimental setups for evaluating batch analytics (Amazon Redshift, Neo4j) and real-time streaming ingestion (Kafka–Cassandra) using the CICIDS2017 dataset.
Figure 1.
Independent experimental setups for evaluating batch analytics (Amazon Redshift, Neo4j) and real-time streaming ingestion (Kafka–Cassandra) using the CICIDS2017 dataset.
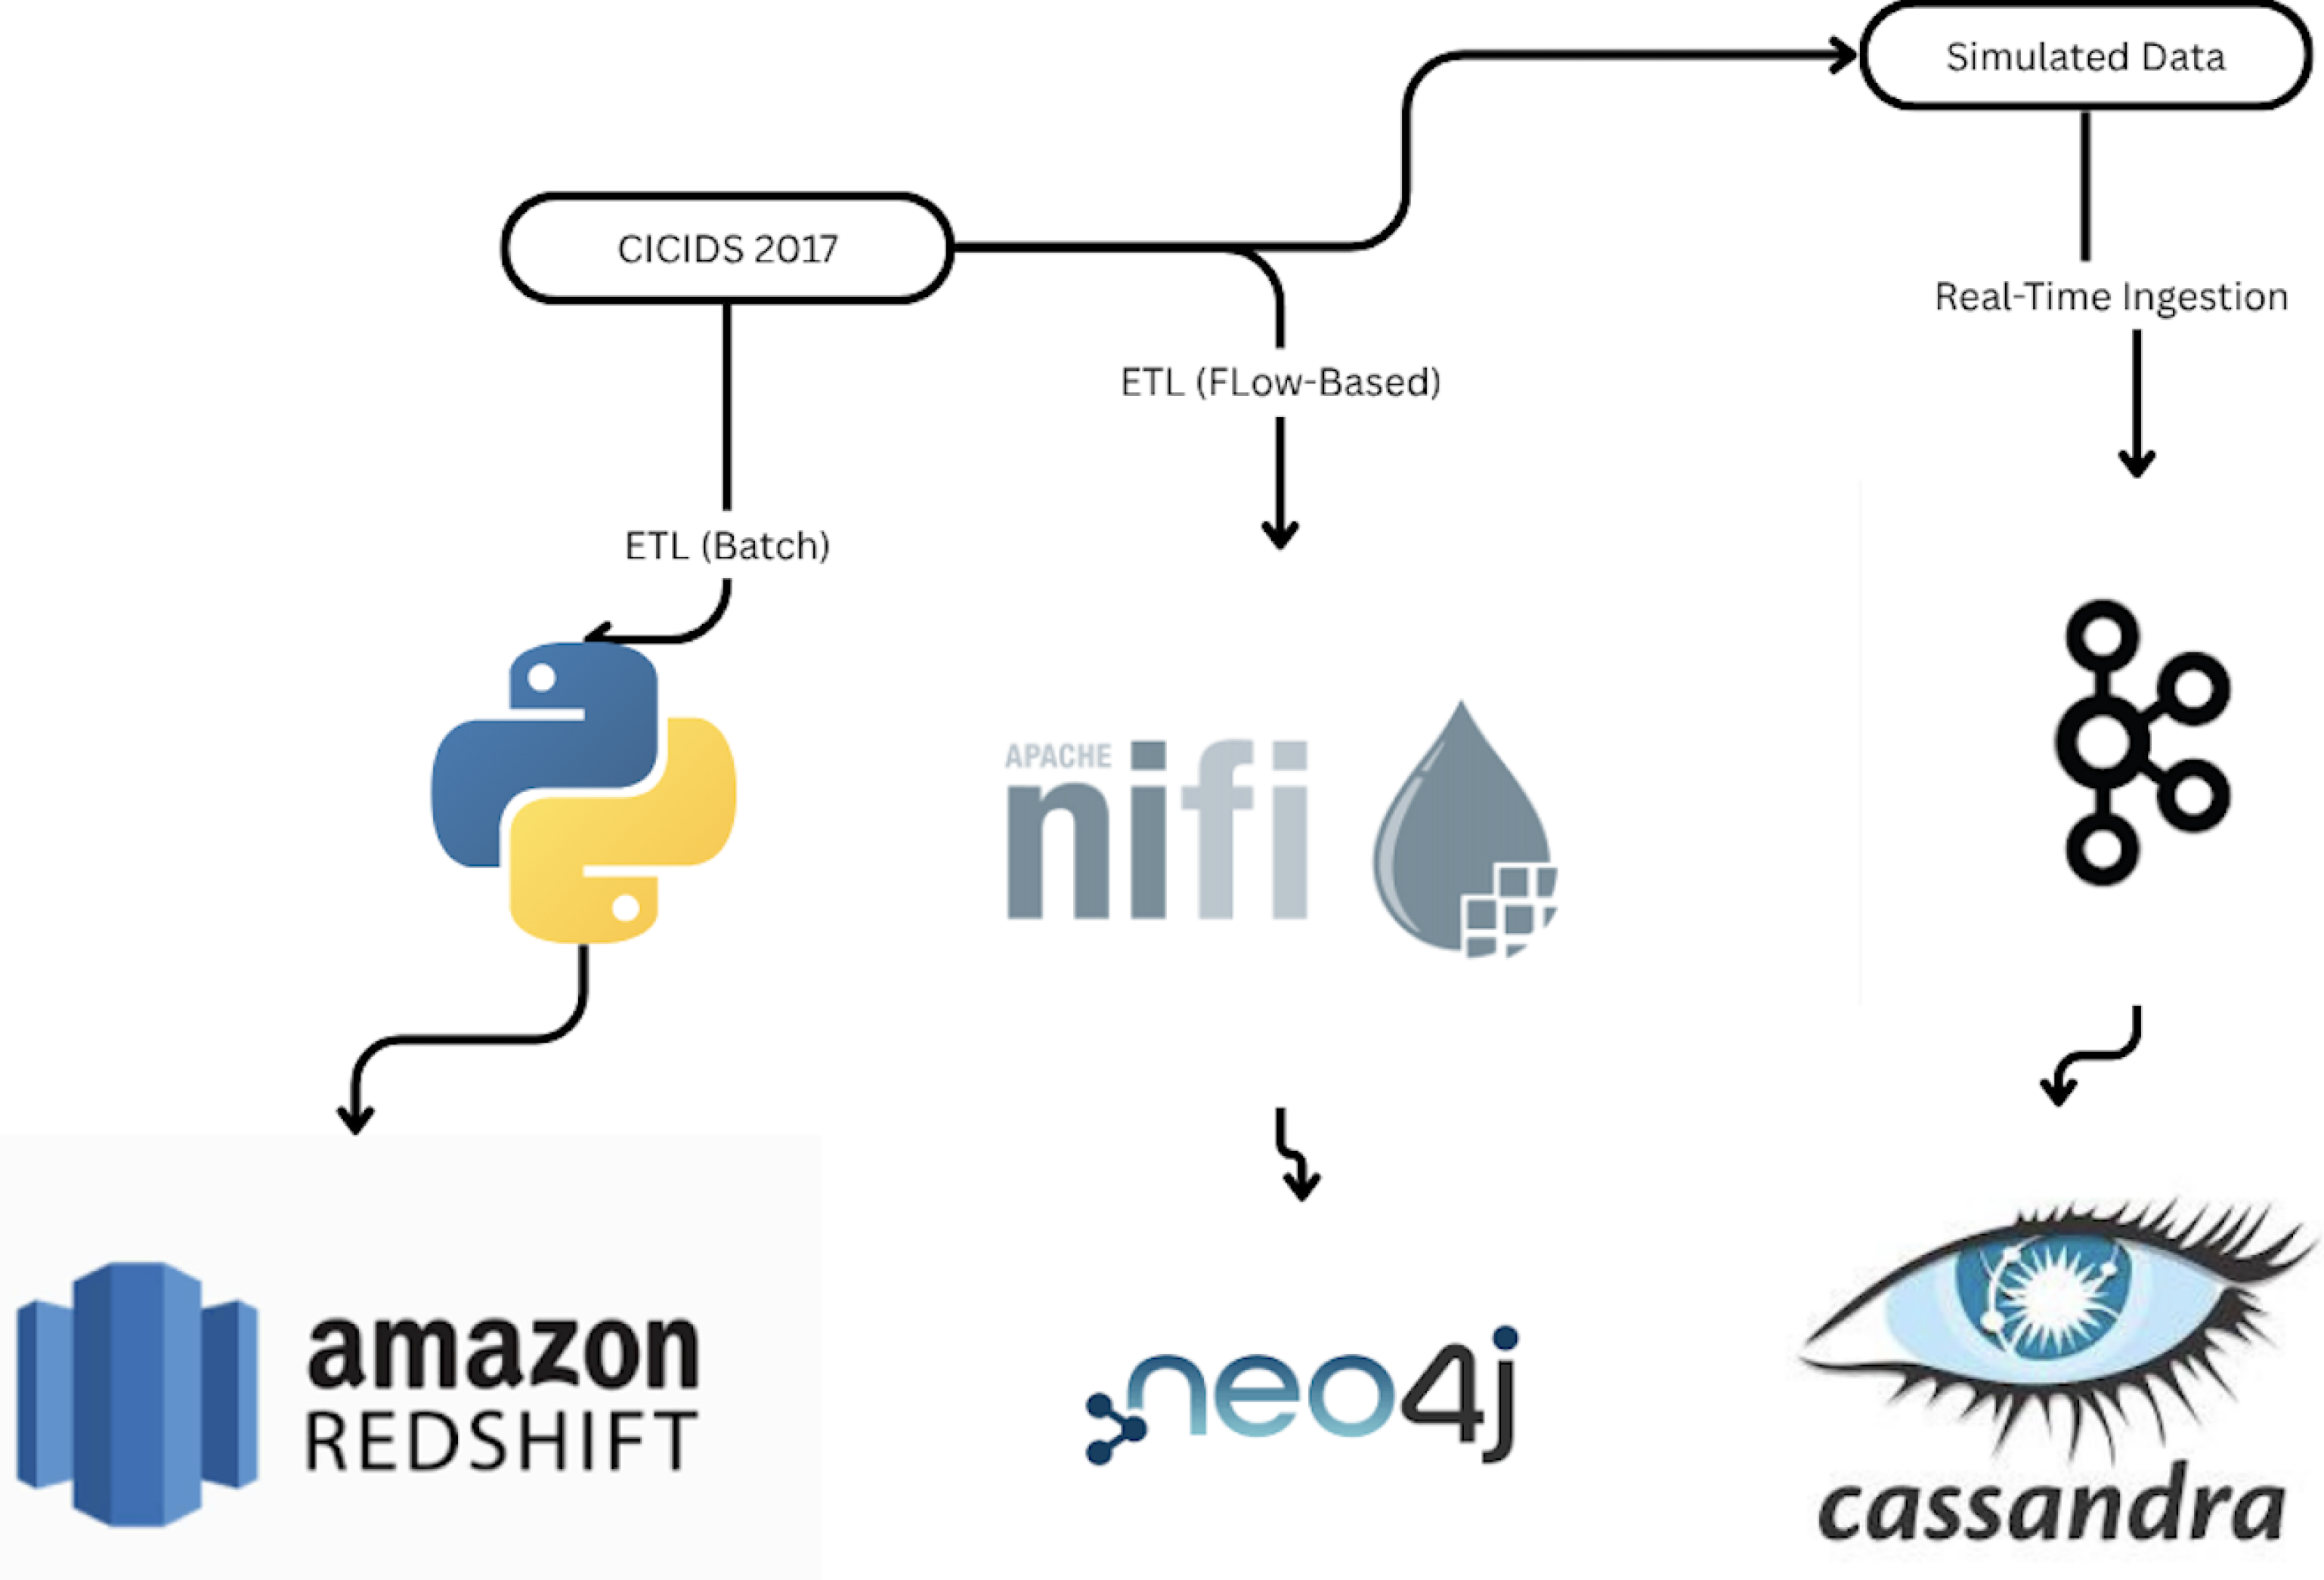
Figure 2.
Star Schema used in Redshift
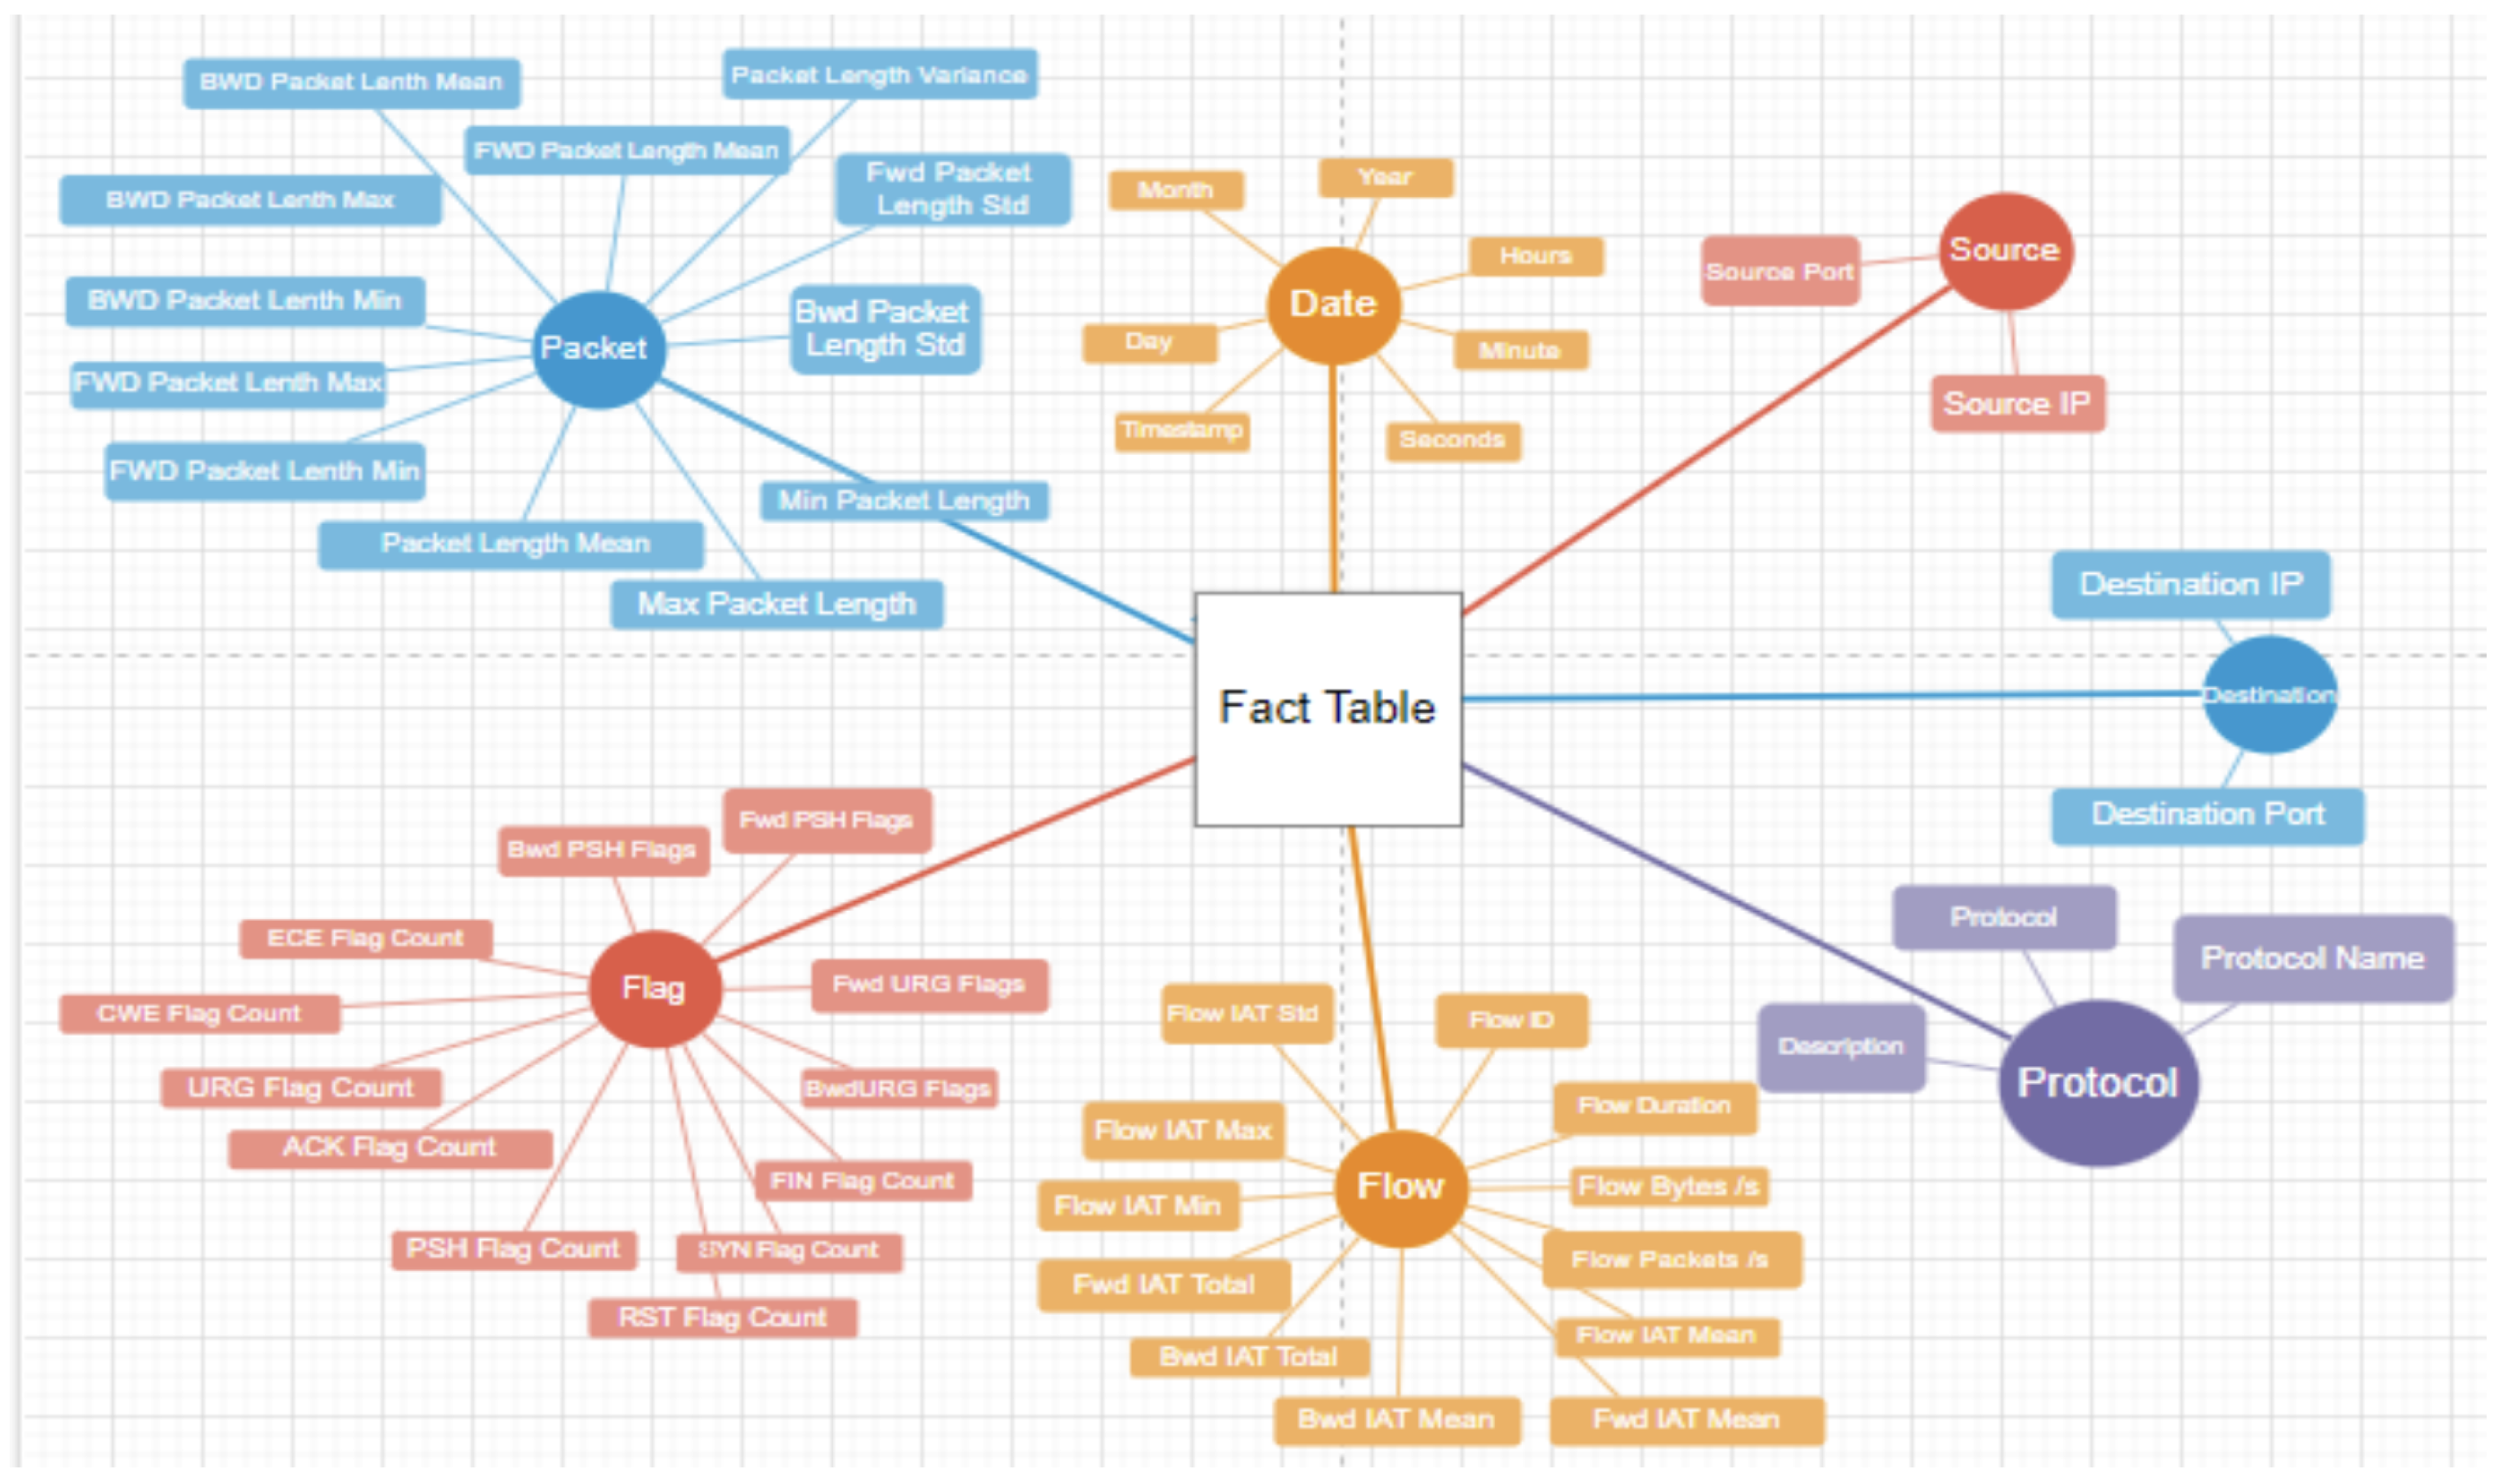
Table 1.
Graph Schema Used for Neo4j Data Modeling
| Type | Entity | Description | Role |
|---|---|---|---|
| Node | Source | Source IP address and source port. | Source endpoint |
| Node | Destination | Destination IP address and destination port. | Destination endpoint |
| Node | Protocol | Network communication protocol. | Protocol information |
| Node | Packet | Packet-level statistical features. | Traffic statistics |
| Node | Label | Traffic class (normal or attack type). | Attack category |
| Relationship | ATTACK_INITIATED | Connects Source to Label. | Source → Label |
| Relationship | ATTACKED | Connects Label to Destination. | Label → Destination |
| Relationship | CLASSIFIED_AS | Connects Packet to Label. | Packet → Label |
| Relationship | COMMONLY_ATTACKED_BY | Connects Protocol to Label. | Protocol → Label |
Table 2.
ETL Overview Across Platforms
| Target System | ETL Tool | Data Source | Load Type | Data Model |
|---|---|---|---|---|
| Amazon Redshift | Python Scripts | CSV (CICIDS) | Batch | Star Schema |
| Neo4j | Apache NiFi | CSV (CICIDS) | Batch | Graph (Nodes + Edges) |
| Cassandra | Kafka Consumers | Simulated Stream | Real-Time | Wide-Column (Time-Series) |
Table 3.
Kafka–Cassandra Streaming Configuration
| Parameter | Value |
|---|---|
| Kafka Batch Size | 64 KB |
| Linger Time | 5 ms |
| Kafka Partitions | 8 |
| Consumer Threads | 8 |
| Poll Size | 1000 messages/thread |
| Cassandra Batch Insert Size | 5 |
| Primary Key Design | flow_id + time_stamp |
| Compression | zlib (JSON) |
Table 4.
Relational Warehouse Cluster Configuration
| Parameter | Configuration |
|---|---|
| Cluster Identifier | redshift-cluster-dw-project |
| Node Type | dc2.large |
| Number of Nodes | 2 |
| Region | us-west-1 (N. California) |
| Public Accessibility | Enabled |
| VPC Routing | Turned off |
| Security Group | sg-0a562329055481de4 (TCP 5439 open) |
| S3 Bucket | myawsbucketfordwproject |
Table 5.
Graph Analytics Engine Experimental Configuration
| Parameter | Configuration |
|---|---|
| Neo4j Version | Community Edition 5.x |
| Host Machine | MacBook Pro (Local) |
| Operating System | macOS (Ventura/Sonoma) |
| Processor | Apple M1 |
| RAM | 16 GiB |
| ETL Tool | Apache NiFi (External) |
| Data Model | Nodes + Relationships (Graph) |
| Node Count | 1.1 million (approx.) |
| Relationship Count | 2.3 million (approx.) |
Table 6.
Streaming Ingestion Pipeline Configuration
| Parameter | Configuration |
|---|---|
| Deployment Environment | Docker on MacBook Pro (Local) |
| Producer Language | Python (kafka-python) |
| Message Format | JSON + zlib compression |
| Kafka Topic | cicids_traffic_2 |
| Kafka Partitions | 8 |
| Batch Size | 65536 bytes (64 KB) |
| Linger Time | 5 ms |
| Cassandra Write Mode | Threaded, Batched Inserts |
| Primary Key | flow_id, time_stamp |
| Synthetic Records Simulated | 20,000+ |
| Ingestion Rate | 100–500 records/sec/thread |
Table 7.
Relational Warehouse Query Performance (With vs. Without Optimization)
| Query | Without Optimization (ms) | With Optimization (ms) |
|---|---|---|
| FTP-Patator Attack Frequency | 286 | 55 |
| Top Source IPs by Event Count | 850 | 1000 |
| Average Packet Size | 4000 | 368 |
| Hourly Distribution of Traffic | 5000 | 407 |
| Top Destination IPs | 473 | 489 |
| Total Packets by Source | 5000 | 415 |
| Top Packets by Source/Protocol | 621 | 405 |
| Packet Size Spike Detection | 5000 | 2000 |
| High Flag Count Combinations | 744 | 599 |
| Anomaly Detection (Flag+Hour) | 5000 | 1000 |
Note: The slight performance degradation in the "Top Source IPs by Event Count" query, even after optimizing the schema, is because of a distribution key mismatch. Although the fact table had been distributed on Label, this query joins and aggregates on Source_ID_FK and source_ip, resulting in additional data shuffling between nodes. These trade-offs are common in Redshift when optimizing for more than one query pattern.
Table 9.
Relational Warehouse vs. Graph Analytics Engine Query Execution Time
| Query # | Redshift (ms) | Neo4j (ms) |
|---|---|---|
| 1: Attack Frequency Analysis | 286 | 32 |
| 2: Threat Source Identification | 850 | 3914 |
| 3: Attack Target Analysis (Top-3 by Label) | 473 | 429 |
| 4: Traffic Statistical Characterization | 4000 | 326 |
Table 10.
Decision Matrix for Selecting Data Systems in Cybersecurity Analytics
| Requirement | Preferred System | Rationale |
|---|---|---|
| Historical analytics | Amazon Redshift | Optimized for SQL-based aggregation and large-scale historical reporting. |
| Relationship analysis | Neo4j | Supports efficient graph traversals and attack path exploration. |
| Real-time monitoring | Kafka–Cassandra | Provides high-throughput event ingestion and low-latency storage for continuous network monitoring. |
| Enterprise cybersecurity platform | Hybrid Architecture | Integrates historical analytics, graph analysis, and real-time streaming to support comprehensive cybersecurity operations. |
Disclaimer/Publisher’s Note: The statements, opinions and data contained in all publications are solely those of the individual author(s) and contributor(s) and not of MDPI and/or the editor(s). MDPI and/or the editor(s) disclaim responsibility for any injury to people or property resulting from any ideas, methods, instructions or products referred to in the content. |
© 2026 by the authors. Licensee MDPI, Basel, Switzerland. This article is an open access article distributed under the terms and conditions of the Creative Commons Attribution (CC BY) license (http://creativecommons.org/licenses/by/4.0/).
Copyright: This open access article is published under a Creative Commons CC BY 4.0 license, which permit the free download, distribution, and reuse, provided that the author and preprint are cited in any reuse.