

Submitted:
18 July 2026
Posted:
21 July 2026
You are already at the latest version
Abstract
Background. This article addresses the challenge of estimating the engineering effort required to migrate high-performance computing business logic from legacy monolithic services to microservice architecture. While the study is grounded in empirical tasks within the financial sector, its findings are highly relevant to a broad spectrum of similar domain-agnostic software migration problems.Objective. The primary objective of this work is to develop a software migration effort estimation method that explicitly accounts for infrastructure overhead by integrating Complexity Amplification Factors (CAF) and Complexity Control Factors (CCF).Methods. A modified Use Case Size Points (USP) method was developed, integrating infrastructure-specific CAF and CCF factors to systematically enhance structural estimation precision.Results. Empirical results demonstrate that the predictive model incorporating both CAF and CCF significantly increases the accuracy of development effort predictions compared to standard baseline approach. Migration effort remains stable within dedicated architectural task classes, yielding a Mean Relative Error (MRE) within acceptable bounds. However, use-case classes exhibit diverging prediction profiles: 0.24 for the Write Model and 0.54 for the Read Model. Furthermore, predictive precision depends on isolating internal step heterogeneity within individual use cases (e.g. 0.33 for validation steps).Conclusions. This work provides a framework for estimating the effort required to migrate data-intensive monolithic systems to microservice-oriented architectures. The proposed framework optimizes resource allocation by transforming an inherently unpredictable migration process into a manageable workflow, offering a scalable foundation for managing the lifecycle of complex computer systems.
Keywords:
software
; migration
; effort estimation
; complexity factor
; microservice
; scalability
; distributed system
; prediction
; optimization
; operational infrastructure
Introduction
Empirical industry benchmarks indicate that approximately 20% of projects developed from scratch fail, and another 54% experience significant challenges. [1]. To mitigate these risks, accurate software metrics during development and maintenance phases remain critical for informed decision-making and successful project management.
Parametric software sizing traditionally relies on algorithmic formulations mapping source code volume [2,3] and subsequent predictive enhancements [4,5,6,7]. Among several categories of methods used to estimate the effort methods of estimation based on specifications of requirements stand out with their relative simplicity (they don’t require providing software components and algorithms specifications as input data) and ability to estimate software size and effort at early phases of software development [8].
Effort estimation of data-intensive monolith software migration to microservice architecture is one of the most challenging tasks [9]. Concerns related to the complexity involved on scaling monolithic architectures have shifted interests in industry towards the adoption of microservice architectures [9,10] where each microservice becomes an independent unit of development, deployment, versioning, scaling, and management [11].
The migration process is fraught with challenges, and one of the critical issues is that microservices push a massive amount of complexity into the operational domain [12]. Complex deployment management and configuration friction frequently trigger system degradation or architecture regression (back to monolith) [12]. These operational complexities are deeply coupled with core development and maintenance phases. All these aspects should be considered during migration planning, but the traditional use-case based estimation methodologies fail to capture these infrastructure factors, leading to systemic budget and schedule overruns.
Consequently, this study work is devoted to an effort estimation methodology for migrating high-performance systems to microservice architectures, focusing specifically on the intrusion of operational specificities into the development and maintenance processes for which the Development Team is held responsible.
The Object of Study is the software migration process within heterogeneous IT infrastructures.
The Subject of Study is the approach to system migration that accounts for operational domain factors within effort estimation frameworks.
The Purpose of the Work is to develop a comprehensive method for the effort estimation of the migration of high-performance oriented logic. This method aims to increase the accuracy of resource planning and optimize the lifecycle management of computer systems by accounting for Complexity Amplification Factors (CAF) and Complexity Control Factors (CCF) related to the operational domain.
Review of the Literature
Conventional Use Case Points (UCP) and its derivatives, such as USP [13] and FUSP [14], suffer from four critical vulnerabilities [15]: complexity definition subjectivity (PRB1), factor rating bias (PRB2), non-standardized classification (PRB3), and historical data dependency (PRB4).
Prior research [16,17] mitigated these flaws for Domain-Driven Design variations (DDD) migration using frame-based knowledge structures and a modified FUSP approach [13]. However, this framework cannot be directly applied to data-intensive monolith-to-microservice migrations, because it ignores the complexity amplification factor associated with the specific characteristics of the technological and operational infrastructure.
The traditional USP method [18] provides environmental factors, Technical: Technical (TAF) and Environmental Adjustment Factors (EAF) globally across the entire project. This static approach fails in legacy migrations for two reasons. Firstly, global factors like language difficulty (E8) or application experience (E2) vary radically. In legacy domains (e.g., hospital systems), general team experience is neutralized by idiosyncratic, obsolete workflows, meaning standard factor weights (e.g., 0.5) are severely underestimated. Secondly, the traditional [0;5] rating scale lacks objective, architectural criteria.
Modernizing obsolete legacy systems confirms that technical and human capability constraints act as interconnected, high-friction bottlenecks [19], introducing massive operational complexity [20]. However, contemporary evaluation frameworks omit these underlying operational and infrastructure contexts, focusing almost exclusively on software-centric code transformations and functional boundary identification [20,21]. Even when runtime metrics (e.g. network latency, CPU load) are tracked to validate container orchestration feasibility, existing literature lacks predictive models to estimate the engineering effort required to reach these performance thresholds [22].
Conventional estimation models rely on retrospective, post-factum metrics extracted from repository deltas, such as altered Lines of Code, class-level coupling shifts etc. [23]. This approach miscalculates effort within high-performance, data-intensive systems. For instance, optimizing a low-latency read model across 180 million rows may require a developer to spend days analyzing query execution plans, benchmarking index performance, and profiling memory utilization, only to produce a multi-line database configuration shift or a single optimized index definition. This systematic omission is structurally quantified in recent systematic reviews [24,25]:
– In [24], the authors reveal that 42% of decomposition methodologies rely strictly on static functional attributes (cohesion, coupling), whereas only 33% incorporate performance-related metrics predominantly confined to idealized case studies. Authors highlighted that data-intensive systems lack academically validated criteria to evaluate service boundaries under intense database-level dependencies.
– A systematic mapping by [25] exposes this methodological isolation: a mere 3% of legacy-to-microservice modernization literature addresses cost and effort estimation, and only 4.5% investigates testing and verification, while the overwhelming majority (50.7%) remains confined to algorithmic code refactoring and static architectural partitioning.
– This statistical distribution substantiates the premise of this study: the development of an effort estimation model that explicitly quantifies localized infrastructure-level complexity by introducing structural Complexity Amplification Factors (hereafter CAF) and Complexity Control Factors (hereafter CCF).
Task Definition
Based on the literature analysis the foundational research gap in estimating high-performance, data-intensive system migrations is defined as follows: traditional predictive effort estimation methodologies apply abstract, static, project-wide adjusters (e.g. TAF and EAF) that fail to account for the non-linear cognitive and engineering workload required to optimize complex data-intensive operations.
Consequently, the core scientific problem addressed in this study is the necessity to transform the unpredictable process of migrating legacy data-intensive system into a predictable, mathematically bounded engineering one.
The objective of this paper is to develop and validate an infrastructure-aware migration framework for data-intensive systems that integrates predictive, dual-factor effort estimation (complexity amplification and complexity control factors, CAF and CCF) with a risk-optimized execution strategy.
To achieve this objective, the following tasks must be addressed:
1. Formalization of a Dual-Factor Infrastructure-Aware Complexity Model (CAF-CCF Framework). To establish a predictive mathematical framework extending Use Case Size Point metrics via CAF and CCF to quantitatively account for software infrastructure development, tuning, and reuse.
2. Comparative Performance Evaluation. To evaluate the accuracy increase of the developed CAF-CCF model against the baseline approach [16,17] on high-throughput Write and Read data models. Testing is conducted utilizing a high-performance financial reporting system baseline processing up to 2 million daily transactions and a 30 million record operational dataset.
Materials and Methods
The proposed approach is based on modified UUSP (hereafter xUUSP) method [16,17] based on granular, weighted accumulation of structural elements. The total complexity of a Use Case is defined by Equation (1).
is the weight of a functional step (in case of presence = 3.0 for condition-action pairs, = 1.0 otherwise, = 0 for empty slots and when ) which is normally equaled to 1. For example, for checking object version step is equal to 3, because it is connected with alternative handling: checking the condition and generating exception (this metrics remains from basic USP method) which gives us = 3.0 multipled by it brings in result 3;
is the informational capacity weight ( denotes the number of fields-properties engaged in the k-th slot);
represents the weight of the simple rule, while indicates the number of simple rules connected to the k-th slot. Similarly, and represent average rules, and correspond to complex ones;
is the weight of dependency ( represents the number of dependent entities engaged in the operation of the k-th slot).
Which in general form can be defined as
Adapting the core principle of Taguchi’s Robust Design [26] to the baseline xUUSP, assuming that a system must achieve stability under the influence of uncontrollable noise (CAF) through internal control factors (CCF), this study presents the Heatmap Complexity Metaphor as a mathematical abstraction mapping functional size against localized engineering resistance. Operational complexity is quantified as a regional "temperature," where elevated values indicate escalated workloads.
To quantitatively estimate the engineering effort anomalies software complexity is modeled as a continuous scalar field C() mapped over the multi-dimensional migration task space . The vector components xj denote infrastructure dimensions.
The dynamic Complexity Amplification Factor (CAF) is formalized as a function of the effort flux-to-volume ratio, operating as a discrete scalar representation of field divergence across a use case step sk , as shown in Equation (4).
If the baseline use case estimation as μ(Ui), its modified architecture-aware version μ+(Ui), which considers CAF, is defined by Equation (5).
wei – the weight of the enti parameter for i-th use case. Engineering inputs into data entities/structures are already captured by the CAF factors, primarily the Data management complexity factor (αD). Therefore, by default wei = 0 avoids double counting of entities' contribution, but the enti parameter remains manageable in case the CAF does not cover the direct per-entity contribution.
Correlating this model with Taguchi's principles, there are three boundary states for a use case migration, governed by its steps complexity αM(sk). Since αM(sk) is a strictly positive multiplier acting on the baseline step size, these states are defined relative to the neutral baseline weight w0, at which no amplification occurs (μ⁺(sk) = μ(sk)):
Source (αM(sk) > w0): Dominance of negative factors that "heat up" the migration zone, demanding significantly higher temporal effort than predicted (μ⁺(sk) > μ(sk)).
Sink (0 < αM(sk) < w0): Dominance of architectural control factors (reusable domain components, comprehensive documentation) that absorb the complexity, so that the required effort falls below the baseline (μ⁺(sk) < μ(sk)).
Equilibrium (αM(sk) = w0): An idealized engineering scenario where active tools and domain alignment fully offset technological risks, leaving the estimate unchanged (μ⁺(sk) = μ(sk)).
To quantify the hidden engineering effort absorbed by the cross-functional team during the migration lifecycle, we define five infrastructure-aware components of αM:
Data management complexity factor (αD): Measures the engineering overhead of building robust data infrastructures, handling multi-tier operational or archive database environments, orchestrating data transitions, executing data partitioning, and fine-tuning database container configurations.
Concurrency complexity factor (αCC): Evaluates the workload required to design, implement mechanisms necessary to meet system throughput thresholds.
Testing complexity factor (αST): Quantifies the engineering workload required to construct testing infrastructure for validating system quality attributes. This encompasses synthesizing datasets mimicking production environments.
Environment & Security Engineering factor (αES): Measures the operational effort absorbed by developers during infrastructure configuration and deployment environment tuning.
Monitoring & Logging factor (αML): Evaluates the cost of of telemetry, distributed tracing, and log aggregation layers into the application.
Equation (4) thus provides the theoretical justification for αM(sk) as a multiplicative amplification effect. In practice, αM(sk) is its discretized, empirically assessed counterpart the aggregate of the five complexity components above, acting as the normalized surrogate for ∂C/∂xj and applied in Equation (5) to rescale the baseline step size μ(sk).
We can formally quantify and map the cross-cutting interactions between the complexity factors as a dependency diagram and correspondent adjacency matrix (Figure 1), where the vertices represent the deterministic metric dimensions, and the edges reflect unidirectional systemic dependencies. The structural density of matrix A highlights that (Data Management) and (Concurrency) operate as the root engineering bottlenecks of the system.
These infrastructure dimensions are natively intertwined with application source code and deployment environments. Implementing telemetry hooks, data partitioning, and workload-generation algorithms cannot be treated as superficial administrative configurations isolated within standard operational or DevOps workflows.
The qualitative-to-quantitative mapping of the empirical component scales within this framework is grounded in established software engineering estimation paradigms. To mitigate estimation subjectivity, we adopt a classical parametric approach: rather than generating arbitrary numerical values, expert evaluators align the target architecture with strict, predefined linguistic intervals backed by empirical criteria. While traditional models isolate subjective cost drivers via macro-level organizational or team attributes (e.g. [27]), the proposed framework binds empirical adjustments directly to a vector of negative infrastructure factors.
Utilizing the extended Use Case Size Point (xUUSP) approach captures the functional intent of the system prior to implementation, isolating technological resistance factors directly at the architectural and infrastructural layers.
To systematically quantify the Complexity Amplification Factor (CAF), specific factor models are formulated.
Data management complexity factor () is defined by Eq. (6)-(7).
(hereafter MD) represents the operational multiplicity of databases.
(AD) quantifies the data routing and aggregation friction, measuring the mental effort required to construct unified result sets across boundary conditions.
(RD) describes read model complexity capturing the engineering overhead of building high-performance data extraction pipelines.
(WD) encapsulates the Write Model complexity, isolating the effort required to implement high-throughput transactional ingestion.
Assessment scale for factor components is presented in Table 1. The indicators are based on [28,29] works devoted to Polyglot persistence, work [30] devoted to data-access performance anti-patterns in data-intensive systems and a work [31] devoted to scheduling data-intensive workloads.
As an example, let us consider a typical batch ingestion task of buffered records. While the high-level business logic is trivial (receiving payload and persisting it to a database), severe performance degradation occurs under intensive load due to write latency, thread starvation, and database locking. These specifics trigger the developer to refactor the step to use an optimized pipeline leveraging the PostgreSQL COPY command, bypassing standard Object-Relational Mapping (ORM) abstractions. Here, the Write Model metric spikes to 5, driving > 0, meaning the step's implementation timeline expands due to infrastructure-level write tuning.
Concurrency complexity factor is defined similarly to the data storage complexity factor and is calculated according to Eq. (8)-(9).
(PC) quantifies Parallel Efficiency and Threading Gain, which evaluates the complexity of applying multi-threading or asynchronous processing to the step.
(DCC) represents the Data-Driven Concurrency Complexity, capturing the structural effort of parallelizing computations based on data decomposition.
(MB) defines the Event-Driven and Bus Coordination complexity, measuring the cognitive load of implementing message queues, handling asynchronous events etc.
(CS) encapsulates the Concurrency Synchronization Complexity, defining the engineering overhead introduced during the development process.
Assessment scale for factor components is presented in Table 2. The indicators are mainly based on the works of Martin Kleppmann [32,33] (Chapters 11, 12, 13) and [31]. For Concurrency Synchronization complexity we used work [34].
As an example, let us consider a task of totals calculation in case of multi-parameter query which involves multiple databases (e.g. operational database and archive). Data-Driven Concurrency (): the routine establishes a spatial-temporal data decomposition by scanning an active instance concurrently with multiple isolated archive nodes which may have the queried data. The implementation is based on Scatter-Gather pattern, forcing synchronization alignment over intermediate state fragments before invoking aggregate totals logic.
Monitoring complexity factor is defined by Eq. (10)-(11).
(DT) quantifies the overhead of propagating correlation IDs across asynchronous message boundaries or decoupled database access points.
(AL) measures the engineering effort required to design diagnostic telemetry dashboards and threshold triggers for detecting performance lags.
To ensure academic rigor, the evaluation bounds are aligned with the distributed observability frameworks of Kleppmann [32,33] and the multi-store governance models of [29]. The corresponding assessment scale is presented in Table 3.
For example, in a production-ready environment, a concurrent cross-database query operates under a high-volume telemetry ingestion pipeline, utilizing tools such as Prometheus for time-series metrics collection and Grafana for dashboard visualization. For this specific step the monitoring complexity is .
The Environment and Security Engineering factor is defined by Eqs. (12)-(13).
(ID) - Infrastructure Deployment and Containerization Complexity which measures the operational overhead of multi-container orchestration, deployment environment configuration, and reverse proxy routing paths.
(AC) - Access Control and Security Engineering Friction. Quantifies the engineering effort required to establish encrypted communication channels, enforce secure transport layers, and orchestrate programmatic access tokens.
(PA) - Pipeline Automation Complexity evaluates the workload of developing declarative automation scripts to drive continuous deployment, codebase updates, automated service builds, and container runtime lifecycle recycling routines.
The assessment scales for the Environment and Security Engineering factor (αES) subcomponents are presented in Table 4. The objectivity of the assessment scale is grounded in the methodologies established in [35,36,37].
For instance, setting up the environment requires configuring Nginx to securely expose the query endpoint via HTTPS (). The container topology must link both the operational and archive databases to the core query service using isolated networks in docker-compose.yml (= 6).
The Testing Complexity Environment factor is given by Eq. (14)-(15).
(TI) represents the overhead of configuring validation environments, ranging from isolated local execution beds to multi-container integration testing rigs.
(DS) quantifies the workload required to synthesize high-volume relational data structures or stream topologies mimicking real-world production states.
evaluates the cognitive effort of verifying execution correctness, transitioning from deterministic state assertions to specialized testing oracles.
The decomposition of testing complexity into infrastructure configuration (), synthetic data generation (), and test oracle design () is grounded in classical testing theory (e.g., Myers' work [39] and ISO/IEEE 29119 [40] standards). This structural taxonomy is formally extended to the domain of data-intensive software engineering by [41], who identify test data management and oracle uncertainty under big data characteristics as primary drivers of verification overhead, and [32], who establishes the architectural friction introduced by asynchronous state distribution, fault-tolerance mechanisms, and eventual consistency boundaries. The corresponding assessment scale for the factor is presented in Table 5.
The system stabilization under described negative factors, modeled by CAF, is achieved via control factors (CCF). Within this context, these control factors represent the systematic reuse of architectural solutions established during preceding migration steps. Omitting CCF introduces severe forecasting distortions, causing systemic overestimation of subsequent engineering effort.
Control Factors are intrinsically coupled with the baseline α-factors formalized in Table 1, Table 2, Table 3, Table 4 and Table 5, eliminating the necessity for independent assessment matrices. The mathematical model for structural step-level sizing is defined by Eq. (16).
The subtractive interplay ensures that the deployment of pre-existing, mature technical solutions suppress environment friction, thereby establishing stability within the prediction process.
Experiments and Results
The experimental baseline is a high-performance financial reporting system engineered for high-throughput ingestion and low-latency, high-dimensional analytical querying. Migration requirements dictated decomposing the legacy monolith into three decoupled microservices utilizing a hybrid storage strategy.
The topology comprises two distinct functional microservices – the Positions Ingestion Front and Back Services which are decoupled via a high-throughput message queue infrastructure. This layer executes continuous ingestion, schema validation, and stream processing of up to 2 million daily transactions. Analytical queries are isolated within a dedicated Reporting Service operating against a dual-layer database topology:
– Operational Database Layer which maintains a rolling hot dataset of approximately 30 million active positions, ensuring two consecutive months of data availability for real-time reporting with a maximum 10-second propagation latency.
– Archive Database Layer which contains historically static data offloaded to an annual archive segregated into per-year tables.
The Reporting Service executes under extreme read-side pressure driven by three following bottlenecks. First, single-request multi-tenant queries execute arbitrary filtering across multiple dimensions (Accounts, Brokers, Companies, Instruments, and performance metrics) over user-defined temporal boundaries, computing global aggregations alongside paginated transactional datasets. Second, the engine resolves a domain hierarchy containing up to 10 nested organizational levels at runtime, aggregating metrics across descendent nodes. Third, under peak concurrent operational loads targeting over 50 distinct accounts or a top-level ancestral broker node against the 30 million hot dataset, the upper-bound response time is bounded at 10 seconds.
To isolate intensive transaction ingestion from analytical workloads, the architecture implements the Command Query Responsibility Segregation (CQRS) pattern [43] (Figure 2). Within high-load environments, conventional architectures introduce resource contention and database locking anomalies, where long-running analytical queries degrade write-side transactional insertions [32]. Enforcing a strict structural segregation between the Write Model (decoupled Front and Back Ingestion Workers) and the Read Model (dedicated Reporting Service) ensures that massive write-side data bursts do not block read-side analytical report generation. The Write Model employs an asynchronous pipeline isolating the internet-facing ingestion layer from the persistence tier via a fault-tolerant message queue infrastructure.
The decoupled target architecture comprises the following structural components (Figure 2). Front Write Service interacts with the external environment to receive transactions. Message Queue acts as a fault-tolerant buffer to mitigate ingestion spikes and isolate database maintenance windows. Back Write Service consumes transaction batches up to 10 thousand records and executes binary bulk copy into the operational DB. Operational Database maintains rolling partition tables to isolate hot datasets. Archiver Service executes automated monthly data migration routines, offloading records from operational to the archive DB.
Two supplementary subsystems ensure systemic observability and logging. Log Management Service captures error states, connection lifecycles, bulk copy operation execution traces etc. Monitoring Service collects real-time telemetry to detect performance gaps, tracing critical KPIs including ingestion lag, batch processing throughput, and container-level resource utilization metrics.
To resolve multi-entity arbitrary filtering and deep hierarchical constraints at runtime, a multi-layered indexing strategy is implemented within the Read Model. Partition Pruning evaluates date boundaries to isolate queries to specific monthly physical tables, instantly excluding up to 70% of the baseline dataset. Composite B-Tree Indexes optimized for composite filtering across company, account, and temporal dimensions. Generalized Inverted Indexes (GIN) resolves the 10-level nested organizational broker hierarchy, eliminating multi-column joins.
To empirically validate the migration complexity model, the implementation of core demonstrative use cases tracking Closed Positions handling was evaluated. These operations encompass: adding an archived closed position batch (UC-1), compiling broker-level (UC-3) and company-level reports (UC-4). While baseline functional requirements and schema structures were inherited from the legacy system, the decoupled target architecture activated distinct complexity dimensions.
Table 6 represents the unadjusted Use Case Unit Size Points (xUUSP) against the actual execution hours (E) for the UC-1 (data ingestion). Use case step estimation (μ) made using formula (1) with the simple rule weight equaled to 0.1 (), w0 = 1, and all weights of the components are equaled to 1.
As shown by the empirical baseline data, linear estimation CAF fails to correlate with actual engineering time expenses. For instance, steps 1.1, 1.3, 1.4, and 1.5 are assigned an identical unadjusted weight of 1 xUUSP point, yet their actual completion timelines vary significantly (from 1 to 4.5 hours). The estimation of CAF using Table 1, Table 2, Table 3, Table 4 and Table 5 for each step is presented in Table 7 and estimation of using CAF is presented in Table 8. Supplementary materials (including the raw data and intermediate results) are available at [44].
As we can see, Mean Relative Error (hereafter MRE) deviation does not exceed 0.2, that means PRED(0.25) = 100%. The next experiments are connected to data request use cases. We selected most complex reports which were realized in the following order: UC-3, UC-4. The steps of UC-3 are defined in Table 9 and estimation of using CAF is presented in Table 10.
The average estimation to effort ratio E/μ+(sk) is not similar as we have for Write Model (0.55 vs 0.25). While data-processing steps exhibit a stable baseline conversion profile, request validation tasks (UC-1.2, UC-3.1) demonstrate a distinctly lower resource consumption value (MRE = 0.5). For both UC-1.2 and UC-3.1 size-to-effort ration E/μ+(sk) gravitate toward 0.33. This variance confirms that a single use case encompasses heterogeneous classes of operational steps, necessitating class-specific calibration scales. Applying 0.33 coefficient for this step increases PRED(0.25) to 100%, whereas its inclusion bounds the metric at 67%.
Table 11 presents the analytical decomposition of use case steps for Company-Level Reporting UC-4), evaluated against CAF and CCF factors. Direct application of the unadjusted complexity profile yields 56 size points. Under the baseline calibration framework (0.55), this metrics projections dictate an engineering effort of 30.8 hours, whereas empirical tracking reveals an actual execution of 12.7 hours.
The primary driver behind this overestimation is the omission of CCF which represents architectural reuse synergy. Specifically, the caching infrastructure, dynamic query filters, aggregation handlers, and indexing topologies engineered for the preceding Broker-Level Report (UC-3) are adapted to execute company-level data queries, reducing actual development effort. Table 12 presents the effort estimation results for UC-4 using the xUUSP method with CAF.
Results in Table 12 confirm the validation step (4.1) requires a dedicated coefficient (0.33) whereas other operations adhere to the baseline 0.54 threshold.
Discussion
The empirical evaluation highlights a critical limitation of traditional algorithmic frameworks (e.g., Use Case Points) when applied to microservice architecture migrations for data-intensive systems. Traditional methods assume independent, identically distributed complexity across functional requirements and apply global adjustment factors uniformly. Although the baseline xUUSP method [16] addresses minor conventional limitations, it cannot be directly applied to such migrations. Such engineering transformations require deep infrastructure configurations, including container orchestration, dynamic partitioning, multi-threaded pipeline synchronization, and real-time telemetry extraction.
Evaluating subsequent use cases exclusively via Complexity Amplification Factor (CAF) causes severe linear overestimation in some cases. E.g. omitting historical contexts (CCF) resulted in a projected effort of 30.8 hours for the company report (UC-4), while actual expenditure was 12.7 hours. This discrepancy is resolved by the architectural reuse synergy, where the technical friction of complex operations is absorbed during the stabilization of preceding modules, such as the broker report (UC-3). Furthermore, predictive accuracy depends on isolating internal step heterogeneity: while core operations align with a baseline conversion coefficient (0.25 for Write and 0.54 for Read Model), validation tasks require a distinct calibration scale (0.33) to prevent distortion.
A methodological limitation of this study concerns the quantified engineering effort scope. The calibration framework accounts exclusively for the productive payload, isolating specific development tasks directly contributing to functional realization and infrastructure interaction, excluding all exploratory overheads, which include non-productive research spikes, failed experimental paths.
Conclusions
This paper introduced a novel dual-factor adjustment to existing framework [17] designed to refine functional software sizing in data-intensive, high-performance distributed systems. The introduction of the Complexity Amplification and Control Factor (CAF, CCF) establishes a mechanism that mathematically accounts for software infrastructure development, configuration, and reuse.
The practical validity of this framework was verified through empirical calibration on a high-throughput financial position ingestion and reporting subsystem characterized by massive data volumes and stringent performance requirements. The experimental results indicate that while baseline complexity estimations cannot be used for prediction (1 point task can take from 1 to 4.5 hours) due to the misclassification of inherited infrastructure configurations, the integrated CAF-CCF model could be used to predict net engineering effort with high precision. The resulting size-to-effort ratio (E/μ+) converged into a predictable band (0.25 for the Write Model and 0.54 for the Read Model), confirming the calibration model’s reliability.
References
- Bachtiar, R. D. B.; Prasetya, M. E. Evaluation of Risk Management Implementation in IT Projects Using ISO 31000 in an ICT Solutions Company. Account. Financ. Stud. 2024, vol. 4(no. 1), 17–33. [Google Scholar] [CrossRef]
- Anandhi, V.; Chezian, R. M. “Regression techniques in software effort estimation using COCOMO dataset”. Proc. 2014 International Conference on Intelligent Computing Applications, Coimbatore, India, Mar. 2014. [Google Scholar] [CrossRef]
- Manalif, E.; Capretz, L. F.; Ho, D. “Fuzzy rules for risk assessment and contingency estimation within COCOMO software project planning model”. In Exploring Innovative and Successful Applications of Soft Computing; Masegosa, A. D., Ed.; Information Science Reference: Hershey, PA, USA, 2014; pp. 88–111. [Google Scholar] [CrossRef]
- Tadayon, N. “Adaptive dynamic COCOMO II in cost estimation”. Proc. Serp’04: International Conference on Software Engineering Research and Practice, Las Vegas, NV, USA, Jun. 2004; Available online: https://www.researchgate.net/publication/221611029_Adaptive_Dynamic_COCOMO_II_in_Cost_Estimation.
- Yang, D.; Wan, Y.; Tang, Z.; Wu, S.; He, M.; Li, M. “COCOMO-U: An extension of COCOMO II for cost estimation with uncertainty”. Softw. Process Workshop 2006, 132–141. [Google Scholar] [CrossRef]
- Kazemifard, M.; Zaeri, A.; Ghasem-Aghaee, N.; Nematbakhsh, M. A.; Mardukhi, F. “Fuzzy Emotional COCOMO II Software Cost Estimation (FECSCE) using multi-agent systems”. Appl. Soft Comput. 2011, vol. 11, 2260–2270. [Google Scholar] [CrossRef]
- Attarzadeh; Ow, S. H. “Improving estimation accuracy of the COCOMO II using an adaptive fuzzy logic model”. Proc. IEEE International Conference on Fuzzy Systems, Taipei, Taiwan, Jun. 2011. [Google Scholar] [CrossRef]
- Silhavy, R.; Silhavy, P.; Prokopova, Z. “Using actors and use cases for software size estimation”. Electronics 2021, vol. 10(no. 5), 592. [Google Scholar] [CrossRef]
- Laigner, R.; et al. “From a monolithic big data system to a microservices event-driven architecture”. Proc. 46th Euromicro Conference on Software Engineering and Advanced Applications (SEAA), Portoroz, Slovenia, 2020; pp. 213–220. [Google Scholar] [CrossRef]
- Thönes, J. “Microservices”. IEEE Softw. 2015, vol. 32(no. 1), 116. [Google Scholar] [CrossRef]
- Jamshidi, P.; Pahl, C.; Mendonça, N. C.; Lewis, J.; Tilkov, S. “Microservices: The journey so far and challenges ahead”. IEEE Softw. 2018, vol. 35(no. 3), 24–35. [Google Scholar] [CrossRef]
- Mendonça, N. C.; Box, C.; Manolache, C.; Ryan, L. “The monolith strikes back: Why Istio migrated from microservices to a monolithic architecture”. IEEE Softw. 2021, vol. 38(no. 5), 17–22. [Google Scholar] [CrossRef]
- Braz, M. R.; Vergilio, S. R. “Software effort estimation based on use cases”. Proc. 30th Annual International Computer Software and Applications Conference (COMPSAC), Chicago, IL, USA, Sep. 2006; pp. 221–228. [Google Scholar] [CrossRef]
- Braz, M.; Vergilio, S. “Using fuzzy theory for effort estimation of object-oriented software”. Proc. 16th IEEE International Conference on Tools with Artificial Intelligence (ICTAI), Boca Raton, FL, USA, Nov. 2004; pp. 196–201. [Google Scholar] [CrossRef]
- Nhung, H. L. T. K.; Hoc, H. T.; Van Hai, V. “A review of use case-based development effort estimation methods in the system development context”. In Software Engineering and Computer Systems: 2019 International Conference; Springer: Cham, Switzerland, 2019; pp. 484–499. [Google Scholar] [CrossRef]
- Lytvynov; Khandetskyi, V.; Lytvynov, M. “The estimation of effort for domain-driven architectural variations migration using modified use case size points method”. Proc. International Scientific and Practical Conference “Modern Information Technologies and Artificial Intelligence Systems (MIT@AIS-2025)”, May 19–22, 2025; pp. 149–152. Available online: https://drive.usercontent.google.com/u/0/uc?id=1iVEiy8u0IJ9jgcQyvyhRiId3vKpAyGf–&export=download.
- Lytvynov, A.; Khandetskyi, V. S.; Lytvynov, M. O. “Estimation of effort of migration among domain-driven design architectural variations”. Radio Electron. Comput. Sci. Control 2026, no. 1, 159–175. [Google Scholar] [CrossRef]
- Arthi, B.; Selvarani, A. G. “Simplified software effort estimation using fuzzy set theory”. Aust. J. Basic Appl. Sci. 2015, vol. 9(no. 23), 347–353. Available online: https://www.ajbasweb.com/old/ajbas/2015/July/347-353.pdf.
- Abu Bakar, H.; Razali, R.; Jambari, D. I. “A qualitative study of legacy systems modernisation for citizen-centric digital government”. Sustainability 2022, vol. 14(no. 17), 10951. [Google Scholar] [CrossRef]
- Henríquez, C.; Valencia, J. R.; Sánchez, G. “Architectural evolution from monolithic to microservices in scalable systems: A case study of Netflix”. Prospectiva vol. 23, 12, 2025. Available online: https://ojs.uac.edu.co/index.php/prospectiva/en/article/view/3683.
- Bernsteiner, R.; Blasisker, M.; Kohlegger, M.; Ploder, C.; Schlogl, S. “Performance comparison between a monolithic and a microservice application”. Proc. SQAMIA 2025 Workshop on Software Quality, Analysis, Monitoring, Improvement, and Applications, CEUR Workshop Proceedings, 2025; Available online: https://ceur-ws.org/Vol-4077/paper2.pdf.
- Pontarolli, R. P.; Bigheti, J. A.; de Sá, L. B. R.; Godoy, E. P. “Microservice-oriented architecture for Industry 4.0”. Eng 2023, vol. 4(no. 2), 1179–1197. [Google Scholar] [CrossRef]
- Timana Peña, J. A.; Rodríguez, C. Piñeros; Martínez, L. Sierra; Ordóñez, D. Peluffo. “Effort estimation in agile software development: A systematic map study”. INGE CUC 2023, vol. 19(no. 1), 22–36. [Google Scholar] [CrossRef]
- Oumoussa; Saidi, R. “The ontology-based mapping of microservice identification approaches: A systematic study of migration strategies from monolithic to microservice architectures”. Computers vol. 14(no. 4), 133, 2025. [CrossRef]
- Fávero, L. F.; Almeida, N. R. d.; Affonso, F. J. “A systematic mapping study on the modernization of legacy systems to microservice architecture”. Appl. Syst. Innov. vol. 8(no. 4), 86, 2025. [CrossRef]
- Taguchi, G.; Chowdhury, S.; Wu, Y. Taguchi’s Quality Engineering Handbook; John Wiley & Sons: Hoboken, NJ, USA, 2005; p. 1696 p. ISBN 978–0–471–41334–9. [Google Scholar]
- Available online: https://www.scribd.com/document/258523757/Taguchi-Quality-Engineering-Handbook-pdf.
- Musilek. “On the sensitivity of COCOMO II software cost estimation model”. Proc. IEEE International Conference, 2002. [Google Scholar] [CrossRef]
- Khine, P. P.; Wang, Z. “A review of polyglot persistence in the big data world”. Information 2019, vol. 10(no. 4), 141. [Google Scholar] [CrossRef]
- Halili, M. K.; et al. “Polyglot persistence in microservices: Managing data diversity in distributed systems”. In Proc. IEEE International Conference on Internet of Things and Intelligence Systems (IoTaIS); IEEE, 2025; pp. 247–253. [Google Scholar] [CrossRef]
- Muse, B. A.; Nafi, K. W.; Khomh, F. “Data-access performance anti-patterns in data-intensive systems”. Empir. Softw. Eng. 2024, vol. 29, 144. [Google Scholar] [CrossRef]
- Stavrinides, G. L.; Karatza, H. D. “Scheduling data-intensive workloads in large-scale distributed systems: Trends and challenges”, in Modeling and Simulation in HPC and Cloud Systems; Kołodziej, J., Pop, F., Dobre, C., Eds.; Springer: Cham, Switzerland, 2018; pp. 3–21. [Google Scholar] [CrossRef]
- Kleppmann, M. Designing Data-Intensive Applications: The Big Ideas Behind Reliable, Scalable, and Maintainable Systems; O’Reilly Media: Sebastopol, CA, USA, 2017; p. 616 p. Available online: https://www.oreilly.com/library/view/designing-data-intensive-applications/9781491903063/ISBN 978-1-4493-7332-0.
- Kleppmann, M.; Riccomini, C. Designing Data-Intensive Applications, 2nd ed.; O’Reilly Media: Sebastopol, CA, USA, 2026; p. 672 p. Available online: https://www.oreilly.com/library/view/designing-data-intensive-applications/9781098119058/ISBN 978-1-0981-1906-5.
- Meng, K.; Li, M.; Zhou, H.; Zhang, L. “Optimizing split-brain arbitration decisions in dual data centers”. In Advanced Intelligent Computing Technology and Applications; Huang, D. S., Zhang, Q., Zhang, C., Chen, W., Eds.; Springer: Singapore, 2025; vol. 15853, pp. 1–10. [Google Scholar] [CrossRef]
- Johnson, B.; Zein, S.; Cadet, E.; Osundare, O. S.; Ekpobimi, H. O. “Creating a scalable containerization model for enhanced software engineering in enterprise environments”. Glob. J. Eng. Technol. Adv. 2024, vol. 21(no. 2), 139–150. [Google Scholar] [CrossRef]
- Jampani, S.; et al. “Kubernetes and containerization for SAP applications”. J. Quantum Sci. Technol. 2024, vol. 1(no. 4), 305–323. [Google Scholar] [CrossRef]
- Rai, P. G.; Tiwari, G. M.; Yadav, A. J.; Chauhan, A. S.; Gojare, A. “Automated deployment of full-stack applications using a CI/CD pipeline in a DevOps environment”. Int. J. Adv. Comput. Theory Eng. 2026, vol. 15(no. 1), 59–65. [Google Scholar] [CrossRef]
- Yasmeen, S. “Cloud-native enterprise architecture and AWS platform engineering: Transforming large-scale applications through containerization and strategic migration”. World J. Adv. Res. Rev. 2026, vol. 30(no. 1), 1254–1261. [Google Scholar] [CrossRef]
- Myers, G. J.; Sandler, C.; Badgett, T. The Art of Software Testing, 3rd ed.; Wiley: Hoboken, NJ, USA, 2012; p. 239 p. Available online: https://malenezi.github.io/malenezi/SE401/Books/114-the-art-of-software-testing-3-edition.pdfISBN 978-1-118-03196-4.
- ISO/IEC/IEEE 29119-1:2013“Software and systems engineering – Software testing – Part 1: Concepts and definitions”; IEEE, 2013; pp. 1–64. Available online: https://wildart.github.io/MISG5020/standards/ISO-IEC-IEEE-29119-1.pdfISBN 978-0-7381-8597-2.
- Felderer, M.; Russo, B.; Auer, F. “On testing data-intensive software systems”. In Security and Quality in Cyber-Physical Systems Engineering; Biffl, S., Eckhart, M., Lüder, A., Weippl, E., Eds.; Springer: Cham, Switzerland, 2019. [Google Scholar] [CrossRef]
- Basiri; Behnam, N.; de Rooij, R.; Hochstein, L.; Kosewski, L.; Reynolds, J.; Rosenthal, C. “Chaos engineering”. IEEE Softw. 2016, vol. 33(no. 3), 35–41. [Google Scholar] [CrossRef]
- Overeem, M.; et al. “An empirical characterization of event sourced systems and their schema evolution – Lessons from industry”. J. Syst. Softw. 2021, vol. 178. [Google Scholar] [CrossRef]
- Lytvynov, M. Lytvynov, Working Materials for the Article "High-Performance Data-Intensive Software Migration Effort Estimation. In dataset, Zenodo; 2026. [Google Scholar] [CrossRef]
Figure 1.
Factors dependency diagram and incidence matrix.
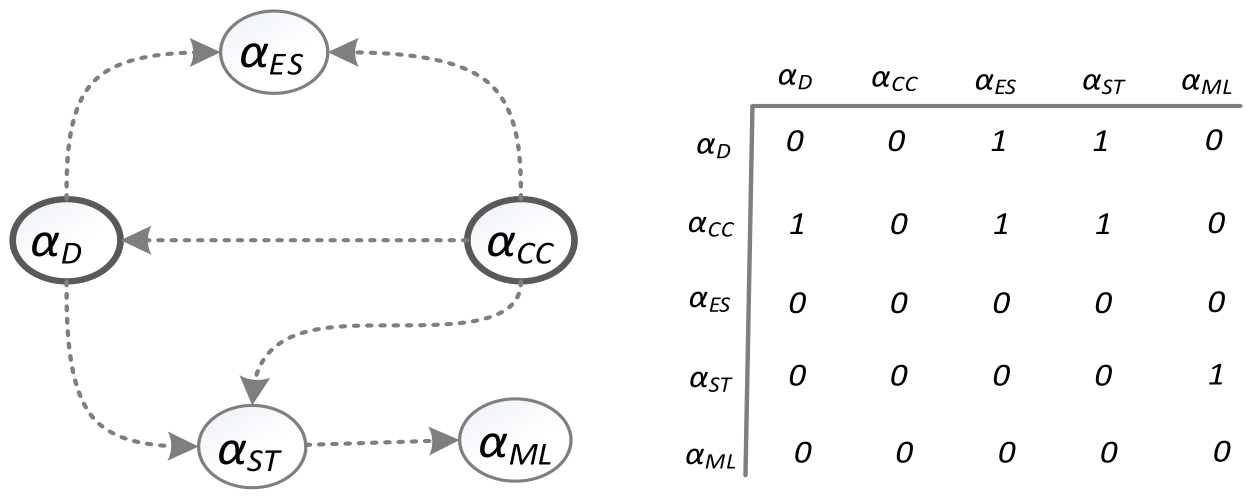
Figure 2.
Architecture of the test system.
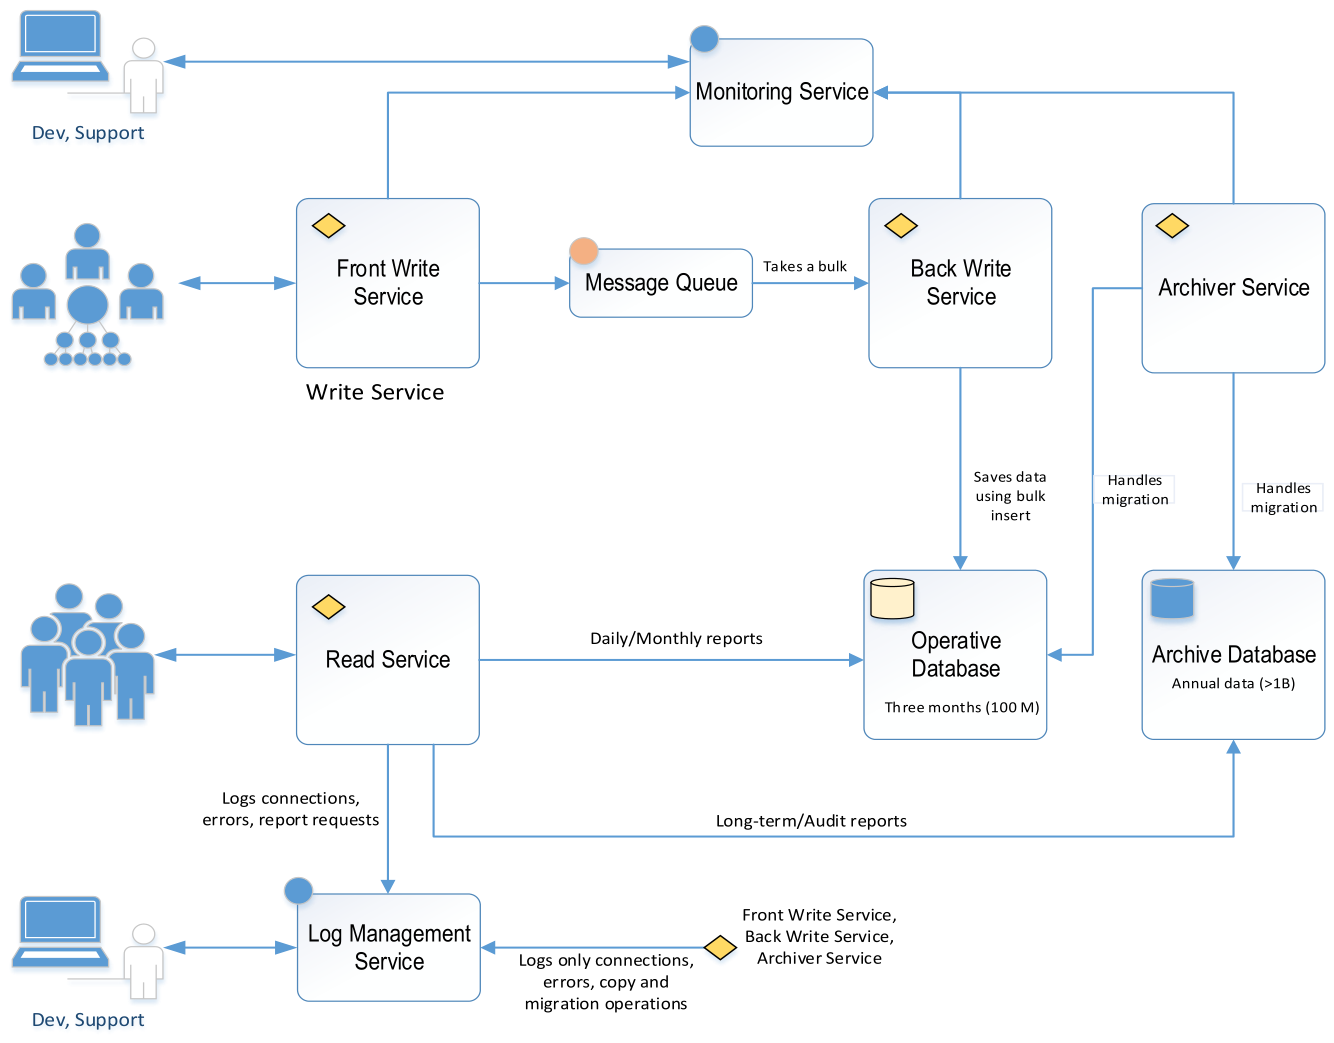

Table 1.
Assessment Scale for factor components.
| Score | Complexity | Description and Indicators |
| Operational multiplicity of databases (MD) | ||
| 0 | Baseline | Single database instance interaction. |
| 1–5 | Medium | Concurrent access to databases; polyglot persistence [28]. |
| 6–8 | High | Multi-database state coordination; multi-tenant schemas [30]. |
| 9-10 | Extreme | Full topology abstraction; dynamic or undefined distributed instances; column-family environments [29]. |
| Routing and aggregation (AD) | ||
| 0 | Baseline | Direct data mapping; zero cross-boundary transformations or routing logic. |
| 1–5 | Medium | Static logical routing based on simple parameters. |
| 6–8 | High | Complex cross-database aggregation [30,31]. |
| 9-10 | Extreme | Non-deterministic routing under heavy replication lag, manual sorting and split-brain resolution [29]. |
| Read model complexity (RD) | ||
| 0 | Baseline | Standard queries; nominal execution time. |
| 1–5 | Medium | Custom SQL queries bypassing ORM; basic join optimization and active partition management. |
| 6–8 | High | Execution plan micro-tuning; forced indexation; materialized view management. |
| 9-10 | Extreme | Real-time streaming aggregations combined with cache merging, backpressure mechanisms [30,32,33]. |
| Write model complexity (WD) | ||
| 0 | Baseline | Basic single-row data manipulation language operations. |
| 1–5 | Medium | Managed batch insertions via transaction blocks up to 10K records; WAL resolution [31]. |
| 6–8 | High | High-throughput streaming via low-level interfaces (e.g., PostgreSQL COPY), memory-buffer allocations [30]. |
| 9-10 | Extreme | Concurrent mass-ingestion under strict SLA boundaries, manual locking management, sharding, partition creation. Utilization of reactive engines based on Event Loop pattern [30,31] |
Table 2.
Assessment Scale for factor components.
| Score | Complexity | Description and Indicators |
| Parallel Efficiency and Threading Gain (MD) | ||
| 0 | Baseline | Sequential computation strictly within a single thread. |
| 1–5 | Medium | Standard asynchronous I/O execution using framework abstractions. |
| 6–8 | High | Compute-bound optimization using manual load balancing or gang scheduling policies [31,32] |
| 9-10 | Extreme | Non-linear overhead handling under severe thread context-switching and synchronization bottlenecks [31,32] |
| Data-Driven Concurrency Complexity (DCC) | ||
| 0 | Baseline | Monolithic processing without dataset decomposition, partitioning, or sharding. |
| 1–5 | Medium | Data division into independent chunks processed via local parallel loops with isolated state mutations. |
| 6–8 | High | Distributed parallel execution requiring non-trivial data-sharding or map-reduce partition realignment [32]. |
| 9-10 | Extreme | Dynamic, non-deterministic streaming partitions with real-time stateful windowing [32]. |
| Event-Driven and Bus Coordination complexity (MB) | ||
| 0 | Baseline | In-process synchronous execution. |
| 1–5 | Medium | Linear command queue ingestion or fire-and-forget event publishing via standard message bus layers [32]. |
| 6–8 | High | Choreographed event-driven interaction; distributed Saga orchestration; dynamic routing etc. [32,33]. |
| 9-10 | Extreme | High-intensity event streaming. Processing massive high-volume data streams [32,33]. |
| Concurrency Synchronization complexity (CS) | ||
| 0 | Baseline | No race condition mitigation tasks. |
| 1–5 | Medium | Synchronization using standard primitives. |
| 6–8 | High | Fine-grained, lock-free synchronization (e.g., Disruptor pattern). |
| 9-10 | Extreme | Complex distributed state protection via multi-layered remote lock managers with active split-brain handling [34]. |
Table 3.
Assessment Scale for factor components.
| Score | Complexity | Description and Indicators |
| Distributed Tracing Complexity (DT) | ||
| 0 | Baseline | No distributed correlation IDs. |
| 1–5 | Medium | Standard correlation ID injection across services. |
| 6–8 | High | Multi-layered distributed tracing; custom correlation context management across heterogeneous message brokers, sharding pipelines, or message choreography [29,32]. |
| 9-10 | Extreme | Dynamic, end-to-end tracing across non-deterministic multi-datacenter topologies [33]. |
| Alert and Metric Localization (AL) | ||
| 0 | Baseline | Standard diagnostic logging via basic logs. |
| 1–5 | Medium | Centralized metric collection; time-series telemetry exporters for tracking baseline system performance and throughput boundaries. |
| 6–8 | High | Telemetry aggregation for eventual consistency diagnostics; dashboards detecting replication lag boundaries [32]. |
| 9-10 | Extreme | Self-healing observability infrastructure. |
Table 4.
Assessment Scale for factor components.
| Score | Complexity | Description and Indicators |
| Infrastructure and Containerization (ID) | ||
| 0 | Baseline | Local execution. |
| 1–5 | Medium | Standard single-node containerization; isolated service mapping without advanced network routing topologies. |
| 6–8 | High | Multi-container coordination; proxy routing; networks and persistent storage allocation [35]. |
| 9-10 | Extreme | Multi-node cluster orchestration with dynamic ingress routing and automated scaling [36,38]. |
| Access Control and Security Engineering (AC) | ||
| 0 | Baseline | No explicit security configuration required |
| 1–5 | Medium | Basic credential management via environment configurations and password-based access control. |
| 6–8 | High | Secure cryptographic access control (e.g. managing SSL/TLS certificates within Nginx etc.) |
| 9-10 | Extreme | Zero-Trust architecture implementation with automated rolling secret management modules. |
| Pipeline Automation and Scripting (PA) | ||
| 0 | Baseline | Manual deployment. |
| 1–5 | Medium | Linear automated task resolution. Basic scripts automating. |
| 6–8 | High | Advanced pipeline automation scripting. |
| 9-10 | Extreme | CI/CD pipelines with automated deployment strategies [37]. |
Table 5.
Assessment Scale for factor components.
| Score | Complexity | Description and Indicators |
| Test Environment and Infrastructure Complexity (TI) | ||
| 0 | Baseline | Standard local unit testing [39]. |
| 1–5 | Medium | Integration testing via local containerization; isolated database or cache instances with deterministic lifecycles [40]. |
| 6–8 | High | Distributed integration testing [32]. |
| 9-10 | Extreme | Multi-database infrastructure orchestration with active chaos engineering injection [42]. |
| Data Synthesis and State Generation Complexity (DS) | ||
| 0 | Baseline | Test data is static, deterministic, and localized [39]. |
| 1–5 | Medium | Automated generation of relational mock structures or state histories via seeding for conditional path coverage [40]. |
| 6–8 | High | Synthesizing massive, mathematically consistent production-like datasets to validate Read Model profiling [41]. |
| 9-10 | Extreme | Real-time synthetic generation of non-deterministic, infinite data streams with dynamic behavioral mutations. |
| Test Oracle and Assertion Complexity (TO) | ||
| 0 | Baseline | Simple deterministic assertions checking exact state matching or expected exception throwing [39]. |
| 1–5 | Medium | Asynchronous state transition assertions; eventual consistency verification; data layer consistency validation [32]. |
| 6–8 | High | Specialized test oracles validating parallel invariants, distributed transactional safety, saga rollbacks, or out-of-order event sequences [39,41]. |
| 9-10 | Extreme | Formal mathematical verification or non-deterministic property-based testing of live streaming topologies. |
Table 6.
Unadjusted Use Case Unit Size Points estimation using xUUSP.
| Step | Step description | μ | E | Description |
| 1.1 | Decompress data collection | 1 | 1 | Compressor and decompressor, 2 tests, considering that PHP compatibility. |
| 1.2 | Validate data | 3 | 1 | Validator with 10 rules |
| 1.3 | Insert data to queue | 1 | 2 | Testing queue, tuning to handle batch |
| 1.4 | Take data from queue | 1 | 4.5 | Handling persistence AckAsync, adding telemetry monitoring. |
| 1.5 | Save to DB | 1 | 1.5 | Processing bulk insert using copy. |
| Entities | 1 | - | - | |
| Summary (UUSP) | 8 | 10 | - |
Table 7.
The estimation of CAF components applied to UC-1.
| Step | μ | E | CAF | Description | |
| 1.1 | 1 | 1 | TI | 3 | Consider PHP-compatibility |
| TO | 1 | Basic tests | |||
| ID | 1 | Select and add a compress library | |||
| 1.2 | 3 | 1 | TO | 1 | Validator for10 rules |
| 1.3 | 1 | 2 | ID | 6 | Select fast queue, dockerization and tuning |
| MB | 3 | Splitting messages to chunks, defining chunk size, putting them to envelops for further monitoring | |||
| 1.4 | 1 | 4.5 | MB | 6 | AsynAck handling |
| ID | 6 | Seq, Prometheus and Grafana tuning | |||
| AL | 3 | Fixing IngestionLatency, IngestionLagGauge etc. | |||
| DT | 3 | Monitoring of packages: insertion and faults. | |||
| TI | 3 | Testing for insert before Ack and other cases. | |||
| 1.5 | 1 | 1.5 | WD | 7 | Save data batch using COPY and WriteAsync. |
Table 8.
The estimation of UC-1 using xUUSP method with CAF.
| Step | μ | CAF | E | E/μ+ | (0.25 ×) | MRE | |
| 1.1 | 1 | 4 | 4 | 1 | 0.25 | 1 | 0 |
| 1.2 | 3 | 1 | 3 | 1 | 0.33 | 0.8 | 0.2 |
| 1.3 | 1 | 8 | 8 | 2 | 0.25 | 2.0 | 0 |
| 1.4 | 1 | 18 | 18 | 4.5 | 0.25 | 4.5 | 0 |
| 1.5 | 1 | 7 | 7 | 1.5 | 0.21 | 1.8 | 0.2 |
| Entities | 1 | 0 | |||||
| Total | 8 | 40 | 10 | k = 0.25 | 10.1 | MMRE = 0.08 |
Table 9.
The estimation of CAF components applied to UC-3 (Broker report).
| Step | μ | E | CAF | Description | |
| 3.1 | 0.6 | 0.2 | TO | 1 | Validator for 2 rules |
| 3.2 | 1 | 24 | MD | 6 | Operative and archive DB, partitions |
| AD | 7 | Gluing, caching totals, considering archive DB | |||
| RD | 8 | DSL-filters, query optimization. | |||
| ID | 5 | DB dockerized nodes parameters optimization, adding nodes to monitor postges and system | |||
| AL | 5 | Specific parameters monitoring: CPU, Disk, memory, BrokerDbDuration parameter | |||
| TI | 8 | Testing platform deployment for experiments includes stress-testing oriented client application | |||
| DS | 8 | Data synthesis to make test closer to real situation. | |||
| 3.3 | 1 | 8 | MD | 5 | Pagination, considering three scenarios of data reside |
| RD | 6 | Complex paged query, partially resolved by step 3.2 | |||
| TO | 4 | Validation of scenarios | |||
Table 10.
The estimation of UC-3 using xUUSP method with CAF.
| ID | μ | CAF | E | E/μ+ | (0.55 ×) | MRE | |
| UC-3.1 | 0.6 | 1 | 0.6 | 0.2 | 0.33 | 0.3 | 0.5 |
| UC-3.2 | 1 | 44 | 44 | 24 | 0.55 | 24.2 | 0.008 |
| UC-3.3 | 1 | 14 | 14 | 8 | 0.57 | 7.7 | 0.0375 |
| Entities | 1 | 0 | |||||
| Total | 3.6 | 58.6 | 32.2 | k = 0.55 | 32.2 | 0.18 |
Table 11.
The estimation of CAF components applied to UC-4.
| Step | μ | E | CAF | CCF | Description | |
| 4.1 | 0.6 | 0.2 | TO | 1 | 1 | Validator for 2 rules |
| 4.2 | 1 | 10 | MD | 6 | 3 | Refer to UC-3 data structures. |
| AD | 7 | 5 | Refer to UC-3 aggregation logic. | |||
| RD | 6 | 3 | Refer to UC-3 query optimization. | |||
| ID | 5 | 5 | Completely closed by UC-3. | |||
| AL | 5 | 3 | Telemetry collection is based on UC-3. | |||
| TI | 8 | 4 | Testing platform includes stress-testing oriented client application | |||
| DS | 8 | 2 | Based on UC-3 experience. Data sets construction making test context closer to real situation. | |||
| 4.3 | 1 | 2.5 | MD | 5 | 3 | Data pagination is based on UC-3. |
| RD | 5 | 3 | Complex paged query (based on UC-3). | |||
| TO | 4 | 2 | Scenarios validation; assessment of cache policies. | |||
Table 12.
The estimation of UC-4 using xUUSP method with CAF.
| ID | μ | CAF | CCF | E | E/μ+ | (0.54×) | MRE | |
| 4.1 | 0.6 | 1 | 0 | 0.6 | 0.2 | 0.33 | 0.3 | 0.5 |
| 4.2 | 1 | 42 | 24 | 18 | 10 | 0.55 | 9.7 | 0.03 |
| 4.3 | 1 | 13 | 8 | 5 | 2.5 | 0.5 | 2.7 | 0.08 |
| Entities | 1 | 0 | ||||||
| Total | 3.6 | 56 | 33 | 23.6 | 12.7 | k=0.54 | 12.7 | 0.2 |
Disclaimer/Publisher’s Note: The statements, opinions and data contained in all publications are solely those of the individual author(s) and contributor(s) and not of MDPI and/or the editor(s). MDPI and/or the editor(s) disclaim responsibility for any injury to people or property resulting from any ideas, methods, instructions or products referred to in the content. |
© 2026 by the authors. Licensee MDPI, Basel, Switzerland. This article is an open access article distributed under the terms and conditions of the Creative Commons Attribution (CC BY) license (http://creativecommons.org/licenses/by/4.0/).
Copyright: This open access article is published under a Creative Commons CC BY 4.0 license, which permit the free download, distribution, and reuse, provided that the author and preprint are cited in any reuse.