
Submitted:
20 July 2026
Posted:
21 July 2026
You are already at the latest version
Abstract
Cryogenic technologies have become an important catalyst for the development of sciece in the 20th century. They have played a significant role in biology (preservation of animal and plant gene pools and biological samples) and medicine (cryosurgery and cryotherapy). In photobiology, the use of deep cooling has deepened our understanding of the mechanisms of key processes: photosynthesis, vision, and photoregulation in plants. This review, based on the author's work, focuses on the characteristics and results of applying deep cooling methods in spectrofluorimetry of several major photoreceptor pigments. Two key effects of object cooling—a sharp narrowing of pigment spectral bands and an increase in their fluorescence quantum yield—have enabled, firstly, advances in the description of the multicomponent system of chlorophyll, phycobilins, and carotenoids, as well as the processes of light energy harvesting during photosynthesis. The system of chlorophyll forms and the energy migration between them and from accessory pigments are reproduced in model systems with aggregated pigments, indicating the important role of pigment-pigment interactions in the formation of the system of forms and during primary photoprocesses within them. Secondly, the fluorescence of visual and bacterial rhodopsins, and of phytochrome in its native state was detected in vivo; their primary photoprocesses were studied, and their general scheme was proposed. Structural and functionally distinct types of phytochrome A were discovered. The advantages of the application of cryotechnology in the spectroscopy of complex biological pigment systems are discussed.
Keywords:
cryotechnology
; fluorescence spectroscopy
; photosynthetic pigments
; photoreceptors
; (bacterio)rhodopsin
; phytochrome
; photoreaction
1. Introduction
Cryogenic technology and engineering have had a significant impact on the development of science in the 20th century, serving as a catalyst for progress in physics, electronics, astronautics, medicine, and other fields. The primary areas in which cryogenic technology initially had a significant impact include the study of fundamental physical phenomena such as superconductivity and superfluidity, the development of cryoelectronics, astronautics and rocketry, and thermonuclear fusion. Cryogenic technology also plays a significant role in biology (developing methods for preserving biological samples and storing the gene pool of animals and plants) and medicine (cryosurgery and cryotherapy). Cryogenic technology has also become fundamentally important in photobiology, particularly in the study of biological pigments and photoreceptors. Cryogenic cooling (to temperatures of liquid nitrogen and liquid helium) increases the sensitivity of photodetectors by reducing thermal noise, improves spectral resolution, and stabilizes intermediate products during photoreactions. The advantages of this experimental approach are particularly evident in spectrofluorimetry of complex pigment systems due to two main effects: a sharp increase in the quantum yield of pigment fluorescence and a significant narrowing of their individual spectral bands.
Modern photobiology is seeing a trend toward the interpenetration of its various fields and the search for common principles underlying individual photobiological processes. The initial stages of energy conversion—the generation of excited states and the subsequent primary photoprocesses that occur with them—are considered the general basis of photobiological phenomena; and fluorescence spectrofluorometry is becoming one of the most direct methods for studying these processes.
Our work has investigated the primary stages of several fundamental photobiological processes that are diverse in nature and function: photosynthesis in green plants, the process of light energy storage by bacteriorhodopsin in halobacteria, and photoreception involving visual rhodopsin and plant phytochrome. Methods for fluorescence studies of multicomponent biological pigment systems have been developed and utilized: conventional, low-temperature (down to 4 K), derivative (1st and 2nd), selective, and differential spectrofluorometry, along with mathematical analysis of the data obtained using these methods.
The measurements were carried out with unique setups developed in our group based on high-aperture monochromators, in particular those for Raman spectrometry, and on photomultipliers cooled down to liquid nitrogen temperature [1,2]. A number of commercial instruments with standard sensitivity, spectral resolution, and low levels of stray light were also used (spectrofluorometers like “Spex Fluorolog 1680”, Jobin Yvon-Spex, France and “Schimadzu RF540 and RF5000”, Shimadzu, Japan).
Within the context of the journal's scope and the current Special issue, the purpose of this review is to examine the results of comparative studies of fundamental biological processes—light energy harvesting during photosynthesis and light signal reception by biological photoreceptors (plant phytochromes, visual and bacterial rhodopsins)—with an emphasis on the advantages of application of deep cooling methods. Due to space limitations, this publication primarily presents the author's and collaborators' own data.
2. Low-Temperature Fluorescence Studies of Chlorophyll and Accessory Photosynthetic Pigments
Fluorescence spectroscopy has proven to be very effective in the investigation of (1) the molecular organization of the light-harvesting chlorophylls (closed tetrapyrroles) and phycobiliproteins (chromoproteins with open-chain tetrapyrroles as a chromophore); (2) chromophore-chromophore interactions and chromophore-protein complex formation; and (3) the initial photoprocesses taking place in them—absorption of light quanta, excitation energy transfer and trapping by the reaction centers, its emission and dissipation (see [3]).
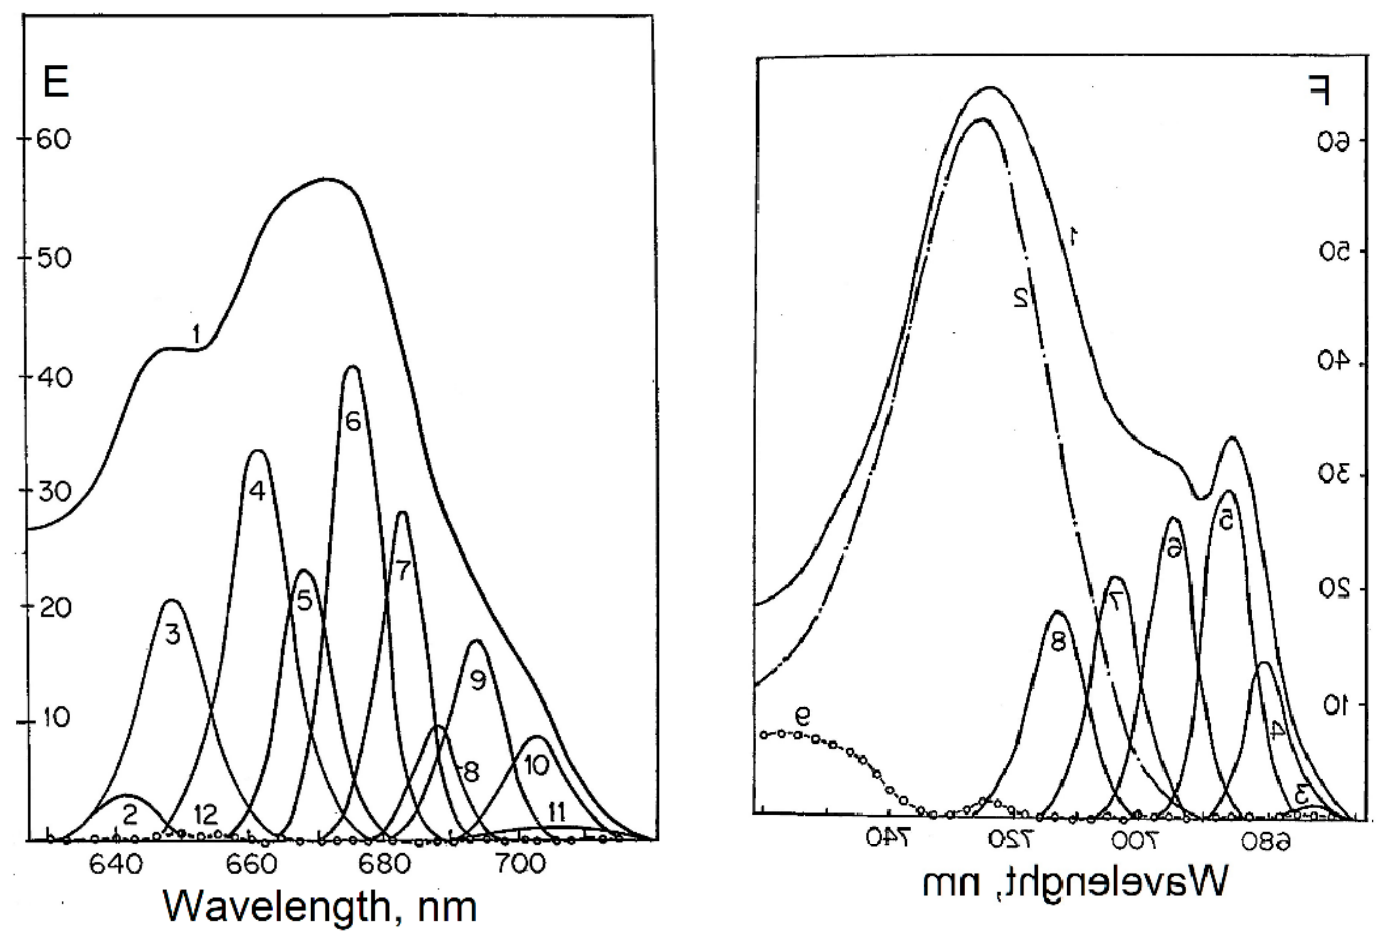
The system of chlrophyll excitation centers. In 1960th, a concept on the existence of 2-3 native forms of Chl in plant cells was put forward (see review in [4]) . In our work, it was further developed and deepened. The existence of a fine structure of low-temperature fluorescence spectra was confirmed, including about 10 bands. Deep cooling contributed to a better manifestation of the structure, without affecting the position of the bands, due to the enhancement of their intensity and a decrease in their half-widths (from 15 nm at 293 K to 8 nm at 77 K and 4 nm at 4 K) (Figure 1) [5,6]. The structure became clearly visible in the derivative emission spectra with decreasing temperature; the existence of the two types of the bands was shown - narrow (half-band width 8 nm at 77 K) and wide (20-35 nm) (8). The results obtained—the number of bands in the spectra, their positions, half-widths, and intensities—gave grounds to speak about the existence of a number of radiating centers in plant cells [9].
These bands were found to be very similar or identical for many studied species of higher plants, including green, blue-green, brown, and red algae. Each band in the excitation (absorption) spectrum was successfully assigned a band in the emission spectrum, thus characterizing each electronic excitation center [9]. Two types of centers were identified: centers with narrow absorption/emission bands and centers with broad bands. The first are included in both photosystems and are universal for all studied plant species, the second belong only to photosystem 1 their position and width being species-depent.
Figure 2.
Analysis of fluorescence excitation (left) and emission (right) spectra of Chlorella at 77 K into a number of Gaussian curves based on their fine structure obtained with the use of deep cooling technology (down to 77 and 4 K) and derivative spectroscopy (1st and 2nd). From [6] (modified).
Figure 2.
Analysis of fluorescence excitation (left) and emission (right) spectra of Chlorella at 77 K into a number of Gaussian curves based on their fine structure obtained with the use of deep cooling technology (down to 77 and 4 K) and derivative spectroscopy (1st and 2nd). From [6] (modified).
Model systems—solutions, monolayers, and thin films of pigments. It was established [5,9] that the diversity of their fluorescence spectra is determined by the existence of multiple centers. By pairwise correlating the bands in these systems, we characterized a series of states (more than 15), including two spectral types: aggregates with narrow spectral bands and associates with broad bands, indicating two modes of monomer packing within the aggregate. A close similarity was established between pigment systems in cells and models across a number of properties: the number of different centers belonging to the two spectral types; the spectral characteristics of individual centers; the magnitude of the fluorescence quantum yield and its dependence on temperature; and the nature of energy migration processes in these systems. It is important to note that in both cases, the concentration factor is decisive in the organization and composition of the systems.
This analogy cannot be accidental and points to the fundamental role of pigment-pigment interactions in the formation of native forms. However, a number of differences are also evident, one of which is the constancy and species-specific composition of the forms within the cell. Stabilizing the pigment system and preventing its "thermodynamic death" due to spontaneous crystallization appears to be one of the primary functions of the protein-lipid component of the pigment-protein complex.
Excitation energy migration between native pigment forms. The presence of many independent chlorophyll electron excitation centers within the cell suggests energetic interactions and energy migration between them and from accompanying pigments. A comparative quantitative analysis of energy migration allowed us to identify three functional groups: (1) a short-wavelength donor group; (2) an intermediate donor-acceptor group; and (3) an acceptor group, including minor forms absorbing in the region beyond 690 nm. The functional distribution of forms between photosystems 1 and 2 of photosynthesis was established [10]. In photosystem 1, the efficiency of energy transfer to the final acceptor turned out to be close to 100% (Figure 3). It includes practically all forms and they account for about 40% of all the energy absorbed and transferred to the reaction center (to P700) through the chlorophyll form Chl738/708. In photosystem 2, the excitation energy transfer occurs predominantly sequentially between the two spectrally closest forms "down" along the excited level forming the "steps of the energy ladder". In general, about 50% of the light energy absorbed by chloroplasts flows to the acceptor forms of photosystem 2 . Energy transfer from chlorophyll B, predominantly included in photosystem 2, occurs to a significant extent bypassing the short-wavelength forms of chlorophyll A to a group of forms absorbing in the region beyond 680 nm. Energy migration from carotenoids in photosystem 1 is about 50%. In photosystem 2, energy transfer from xanthophylls is more efficient, approximately 70-80%. Energy transfer does not occur through the carotenoid molecules themselves.
Phycobilins, the accompanying pigments of algae, transfer energy to chlorophyll a with an efficiency of over 70% [11]. We studied energy migration in a system of phycobilin forms from the blue-green alga Nostoc muscorum, comprising eight different spectral centers (see review [12]). This process was characterized by homogeneous transfer within each pigment and efficient heterogeneous exothermic transfer. The obtained migration efficiency coefficients, as well as estimates of the overlap integrals, Förster critical radii, and distances in donor-acceptor pairs, allowed us to detail the transfer process and present its schematic (Figure 4). According to their predominant functional role, as in the case with chlorophyll, three groups of forms can be distinguished: 1) donor group (phycoerythrin I, phycoerythrin II, phycocyanin I); 3) donor-acceptor group (phycocyanin II and phycoerythrocyanin); 3) acceptor group (allophycocyanin and allophycocyanins B and C). The direct energy acceptors from phycobilins are apparently the intermediate forms of Chl. Estimates of the transfer rates suggest that the inductive-resonance mechanism is the most likely.
Modeling of energy transfer between chlorophyll forms showed that their spectral analogs, aggregated forms, can be also divided into three groups: a short-wavelength donor, a long-wavelength acceptor, and an intermediate group. Energy migration between chlorophyll a aggregates generally follows the same patterns as in the system of native forms. Energy migration in an artificial carotene-chlorophyll a complex was observed with high efficiency in pigment films and monolayers, whereas no transfer occurred in solution [13]. The upper limit of the average distance at which transfer can be observed is 20 Å. The second factor determining transfer efficiency is the concentration ratio between the donor and acceptor: maximum efficiency is achieved when acceptor molecules predominate. Comparison of the characteristics of energy migration from carotene in cells and in models reveals a number of common properties: complex transfer, similar process efficiencies, their dependence on the donor/acceptor concentration ratios, the absence of temperature dependence of efficiency, and the lability of the complexes.
A theoretical analysis of the factors of energy transfer [10] determining its efficiency in the system of chlorophyll forms—their concentration and relative abundance, the position and contour of absorption and fluorescence bands, overlap integrals— has shown that heterogeneous energy transfer from the short-wavelength to longer-wavelength forms is possible within the entire system of centers, and homogeneous energy transfer, within each of the forms. The content of the forms determines the high efficiency of energy transfer between the main absorbing centers (short-wavelength and intermediate forms), weakens energy flow to the longest-wavelength ones, and sharply reduces homogeneous and heterogeneous energy transfer between the longest-wavelength minor forms.
Thus, the combined data obtained allowed us to present a general picture of excitation energy transfer during photosynthesis [9,10]. The multicomponent nature of the pigment system determines the diversity of energy interactions between the various centers and, at the same time, the directionality and high speed of energy transfer. The transfer system itself is apparently the result of its self-assembly during chlorophyll aggregation.
3. Low-Temperature Spectrofluorometry of Photoreceptors—(Bacterio)Rhodopsin and Phytochrome
Low-temperature fluorescence spectroscopy was also applied in our studies to the key biological photoreceptors. These photoreceptors share a common property: they are chromoproteins with a retinal and a bilin as a prosthetic group, respectively, capable of photochromism with a common type of photoreaction—chromophore photoisomerization.
Visual rhodopsin until recently was considered non-fluorescent [14,15]. In our laboratory, however, we were able to demonstrate that the initial photoactive states of rhodopsin from the outer segments of frog [16] and bovine [17] retinal rods fluoresce in the 600-650 nm region with an emission at 77 K of (6±2)x10-4 and 10-3, respectively (Figure 5). Evidence that the emission is due to the photoactive pigment in both cases is provided by the coincidence of the fluorescence excitation spectrum and the absorption spectra, as well as the correlation between fluorescence and absorption changes during the rhodopsin photoreaction. Doukas et al. [18] observed fluorescence of squid and bovine rhodopsin in the 620-640 nm region with an emission of 10-5 at room temperature. Also, Cronin and Goldsmith [19] measured the fluorescence of the meta intermediate of a crayfish at room temperature with maxima at 670 and 515 nm in the emission and excitation spectra and a yield of (1.6±0.4)x10-3. Discussion on the issue of rhodopsin fluorescence see in more detail in [20].
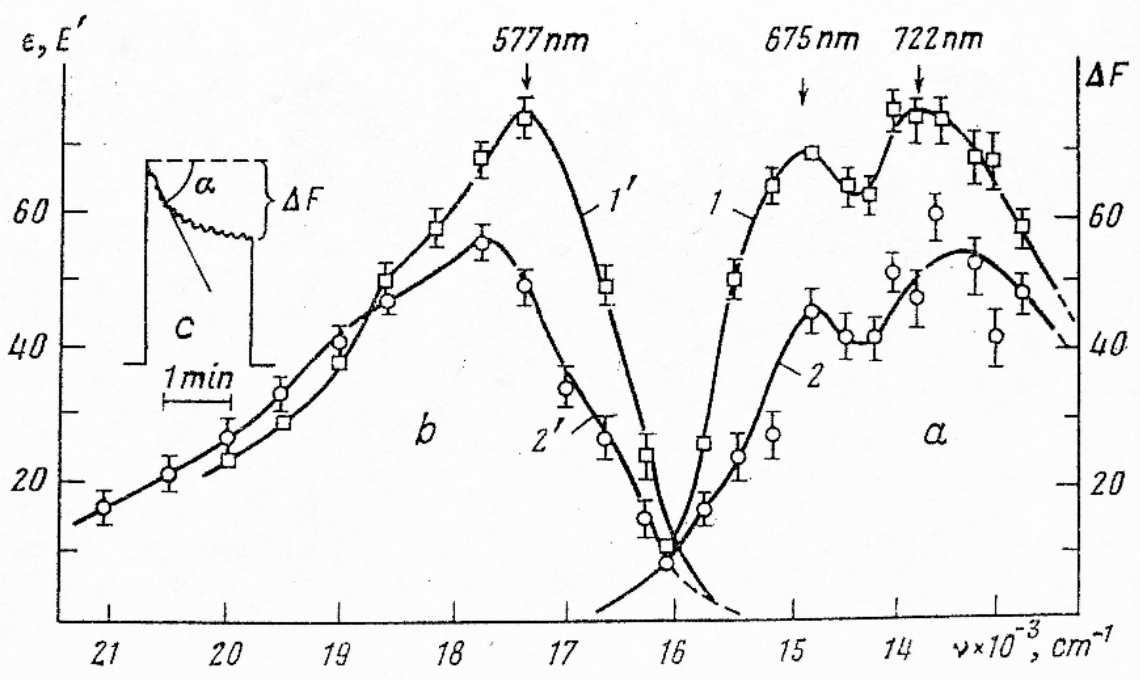
Bacteriorhodopsin. The discovery of a photoenergetic process in halobacteria that involves bacteriorhodopsin [21], which is related to visual rhodopsin, has attracted the attention of researchers who study both vision and photosynthesis. We conducted experiments to detect bacteriorhodopsin fluorescence and recorded emission from purple membranes with maxima at 665, 720-730, and 780-790 nm and a quantum yield of 10-3 at 77 K [22,23,24] . Its attribution to bacteriorhodopsin was confirmed by the correspondence of its excitation spectrum to the pigment absorption spectrum, a direct correlation between changes in fluorescence intensity and pigment conversion during the photoreaction, and the disappearance of fluorescence upon membrane bleaching. It turned out that the initial state of bacteriorhodopsin, trans-bacteriorhodopsin, does not fluoresce even at low temperatures. However, upon illumination, it transforms into an isochromic photoactive state, iso-bacteriorhodopsin, with a quantum yield of 10-3 at 77 K. Fluorescence of 13-cis-bacteriorhodopsin was also recorded in dark-adapted purple membranes, as was fluorescence of the bacteriorhodopsin conversion intermediate P585, with a maximum at 730-740 nm (at 200 K). It was also established that the bathointermediates of trans- and 13-cis-bacteriorhodopsin conversion do not fluoresce in the spectral region studied. Subsequently, measurements of the fluorescence spectra of purple membranes with similar parameters were carried out by a number of authors (see review [20]), and thus the existence of bacteriorhodopsin fluorescence could be considered established.
Figure 6.
Fluorescence (a) and fluorescence excitation (b, points) spectra of iso- (1) and 13-cis- (2) bacteriorhodopsin at 77 K; 1′—absorption spectrum of light-adapted membranes (mixture of the states of trans- and iso-bacteriorhodopsin); 2′—spectrum of 13-cis-bacteriorhodopsin. The excitation spectra were constructed from the initial angle of slope of the curve of change in fluorescence (c) in the course of the photoreaction; fluorescence spectra, from the amplitude ∆F; points—mean of 5-7 measurements; vertical lines show standard error [24].
Figure 6.
Fluorescence (a) and fluorescence excitation (b, points) spectra of iso- (1) and 13-cis- (2) bacteriorhodopsin at 77 K; 1′—absorption spectrum of light-adapted membranes (mixture of the states of trans- and iso-bacteriorhodopsin); 2′—spectrum of 13-cis-bacteriorhodopsin. The excitation spectra were constructed from the initial angle of slope of the curve of change in fluorescence (c) in the course of the photoreaction; fluorescence spectra, from the amplitude ∆F; points—mean of 5-7 measurements; vertical lines show standard error [24].
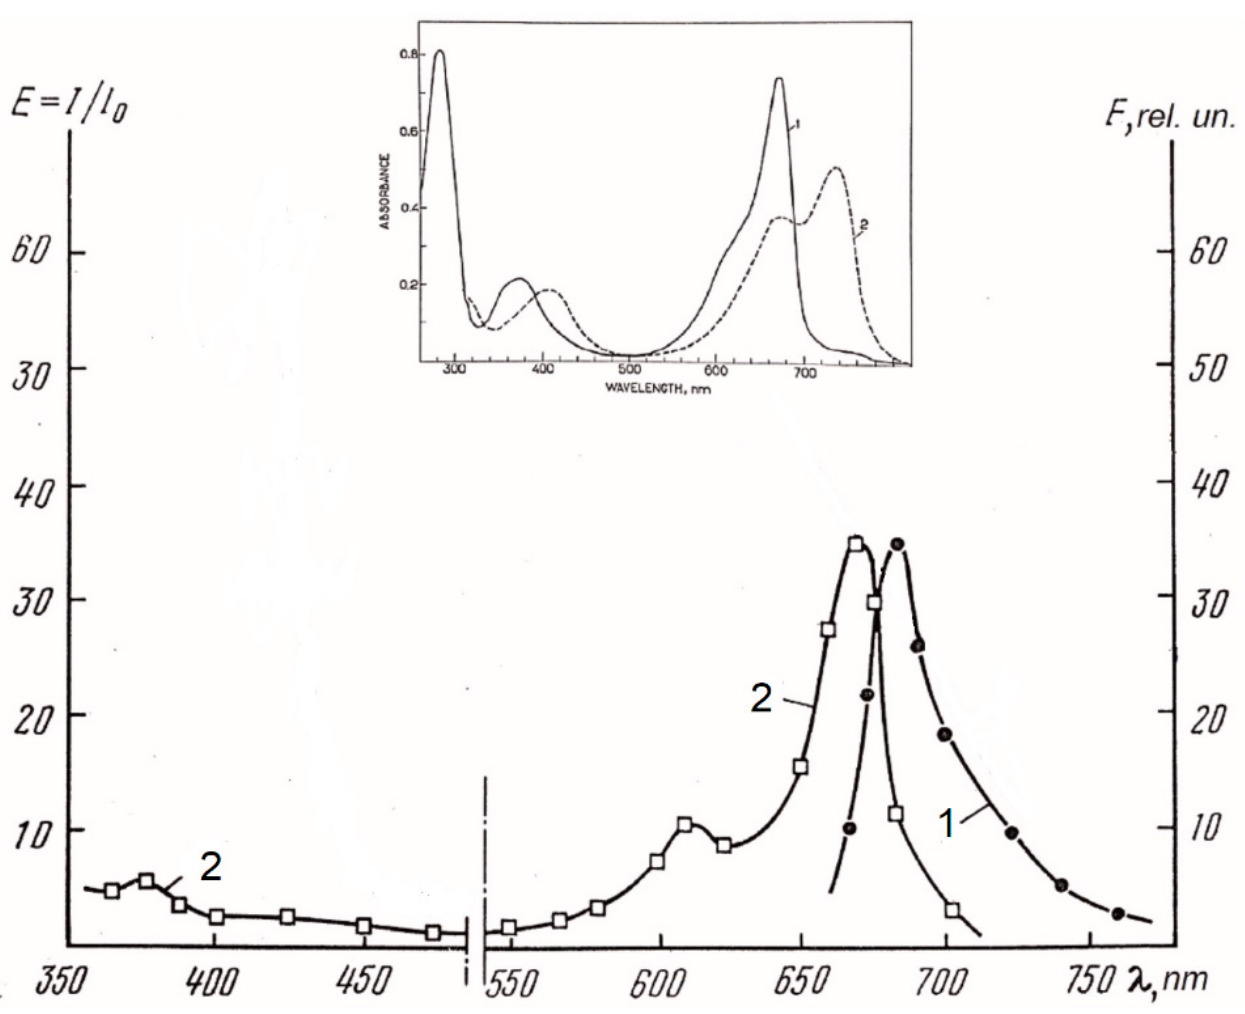
Phytochrome mediates the perception of both light quality and intensity by plants [25]. Its functioning is known to be based on the photoconversion of the initial red form (Pr) into active far-red form (Pfr), which includes light and several dark stages [26]. The difficulty of studying it is largely due to the extremely low concentration of the pigment in plant tissues, its lability, and the limitations of existing experimental approaches. We attempted to detect phytochrome fluorescence in plant tissues and develop a fluorescence method for its study [27,28,29]. It should be noted that several studies in the literature were devoted to fluorescence measurements of purified phytochrome (see review [26]), however, reliable data on its fluorescence in the native state in cells were lacking. In etiolated seedlings of higher plants, we detected phytochrome fluorescence with maxima in the emission spectrum at 686 nm and excitation at 672-673 nm (Figure 3) and a yield of >0.3 at 77 K. Fluorescence showed a sharp temperature dependence; its yield dropped tens of times with an increase in temperature to room temperature (Figure ).
Figure 7.
Fluorescence of phytochrome in the stems of etiolated pea seedlings at 77 K: 1—emission spectrum under monochromatic excitation at 630 nm; 2—excitation spectrum (emission is monitored at > 700 nm). The spectra were corrected for the backgound fluorescence. Inset: absorption spectrum of intact 124-kDa oat phytochrome measured at 275 K after adaptation to (1) saturating far-red light (λa= 735 nm) and (2) red light (λa = 650 nm). From [27,28].
Figure 7.
Fluorescence of phytochrome in the stems of etiolated pea seedlings at 77 K: 1—emission spectrum under monochromatic excitation at 630 nm; 2—excitation spectrum (emission is monitored at > 700 nm). The spectra were corrected for the backgound fluorescence. Inset: absorption spectrum of intact 124-kDa oat phytochrome measured at 275 K after adaptation to (1) saturating far-red light (λa= 735 nm) and (2) red light (λa = 650 nm). From [27,28].
A number of facts indicated that the observed emission belonged to phytochrome, its red form (see reviews [29,30]) :
1. The fluorescence excitation spectrum was found to be close to the low-temperature absorption spectrum of purified phytochrome. A close similarity between the fluorescence characteristics of the native pigment in the cell and the isolated pigment was also observed.
2. A correlation was established between the phytochrome content in the sample, measured by the traditional differential absorption method, and the fluorescence intensity.
3. A direct correlation was found between the fluorescence intensity and the photoconversion of Pr to Pfr at room temperature (Figure 8) and to the primary photoproduct lumi-R at low temperature.
4. Phytochrome emission was observed in wild-type plants and phytochrome overexpressors, the level of phytochrome fluorescence correlated well with its content in modified plants. Phytochrome mutants without the essential phytochromes A and B lacked fluorescence.
5. Phytochrome fluorescence was detected in the transgenic bacterium E. coli and yeast P. pastoris expressing phytochrome A.
Fluorescence of the photoreaction product of Pr, lumi-R, was also detected, with an emission maximum at 705-710 nm and excitation at 696 nm and a yield close to that of Pr. The far-red form apparently has a significantly lower fluorescence yield than Pr and lumi-R; its emission could not be observed even at 4 K [26].
The development of a fluorescence method for studying pigments over a wide temperature range (293–77 K) allowed for a detailed characterization of phytochrome in its native state using a number of parameters [30]: (1) fluorescence emission spectra and fluorescence excitation spectra (congruent to the absorption ones), (2) position and half-band width of their major maxima, (3) polarization degree of the emission, (4) concentration of the pigment ([Ptot]), (5) the extent of the Pr→lumi-R (at 77–85 K) (γ1) and Pr→Pfr (at ambient T) (γ2) conversion, (6) activation and kinetic characteristics of the Pr fluorescence quenching and photoreaction (Figure 8).
The state and properties of native phytochrome in cells were studied in detail in relation to its functional activity. The results obtained can be summarized as follows [30,31].
1. Two types of photoreceptor differing in their ability to undergo photoconversion at low temperatures were discovered for phytochrome A (type 1 and type 2) and one type (type 2) for phytochrome B. It was shown that this phenomenological difference between the two types of phytochrome A is due to the existence of an activation barrier Ea of the Pr—lumi-R photoreaction, which is low in the case of type 1 (hundreds of J/mol) and relatively high (tens of kJ/mol) for type 2.
2. The use of this clear phenomenological criterion for distinguishing between the two phytochrome types—the depth of the drop in phytochrome emission intensity under the influence of light at low temperatures (77-85 K) (Figure 8) (50% for type 1 and < 5% for type 2)—made it possible to trace changes in the content of two pigment pools in plants of different species and ages, their mutants and transgenic forms, and in expression systems (E. coli, P. pastoris), as well as with changes in environmental factors. Light, kinase/phosphatase balance, pH, and hormones (jasmonate) were shown to affect the content and functions of the two phyA pools. As a result, they were quantitatively and qualitatively characterized as the major, longer-wavelength, water-soluble and light-labile (type 1), and the minor, shorter-wavelength, relatively light-stable, and amphiphilic (type 2).
3. A study of point and deletion mutants of phytochrome A revealed structural differences between the two types, localized in the N-terminal segment of the molecule. These two photoreceptor types are likely differ in the degree of phosphorylation (at one or more serine residues)—type 1 is phosphorylated and type 2 is dephosphorylated.
4. The properties of the two phytochrome A pools and changes in their content in response to light in wild-type plants and their mutants with altered photoregulatory responses suggest that the two different pools of phytochrome A are responsible for the two types of plant photoreactions (the so-called very-low- and high-energy responses), while phytochrome B is responsible for the 3d—the low-energy type.
5. Within the type 1 of phytochrome A photoactive at low temperatures, different conformers of the pigment were detected. This is evidenced by the complex nature of the dose dependence of the low-temperature (85 K) photoconversion of phytochrome A (in etiolated pea stems) from Pr into lumi-R and reverse upon illumination by red and far-red light, respectively.
Thus, low-temperature phytochrome fluorescence studies suggest a complex phytochrome system comprising, in addition to different phytoromes (level 1), various modified types within a single phytochrome (level 2), and conformers of a single moleclar type (level 3). From the experimental point of view, the developed fluorescence method for phytochrome analysis proved to be 1.5-2 orders of magnitude more sensitive and much more informative than traditional absorption and immunochemical methods.
Analysis of the fluorescent and photochemical characteristics of rhodopsins and phytochromes suggests fundamental similarities in the properties of their excited states and primary photoprocesses, as well as differences that are quantitative in nature.
1. All of the pigments examined are capable of undergoing photochromic transformations to varying degrees, with different states of photoactive (bacterio)rhodopsin and phytochrome likely initiating different transformation cycles for these pigments.
2. An inverse correlation is observed between the fluorescence yield and the pigment's photoactivity; the yield is particularly low for photoactive states and relatively high for non-photoactive forms, indicating strong competition between radiative deactivation and photoreaction.
3. Fairly good agreement is observed between the calculated lifetimes of the excited states of pigments and direct measurements of the photoreaction times and lifetimes of excited states.
4. The emission and excitation (absorption) spectra of rhodopsins and phytochrome do not obey the mirror symmetry rule: the emission spectra are characterized by greater structure than the absorption (excitation) spectra.
5. The existence of isochromic states of bacteriorhodopsin and phytochrome, differing in fluorescence yield and photoreaction rate, indicates the need to overcome an energy barrier during the photoreaction.
6. The fluorescence of rhodopsins and phytochrome is strongly polarized in the direction of the absorption transition point. Based on this, it can be assumed that conformational changes in the excited state, indicated by the violation of the mirror symmetry rule, do not lead to a significant change in the transition moment.
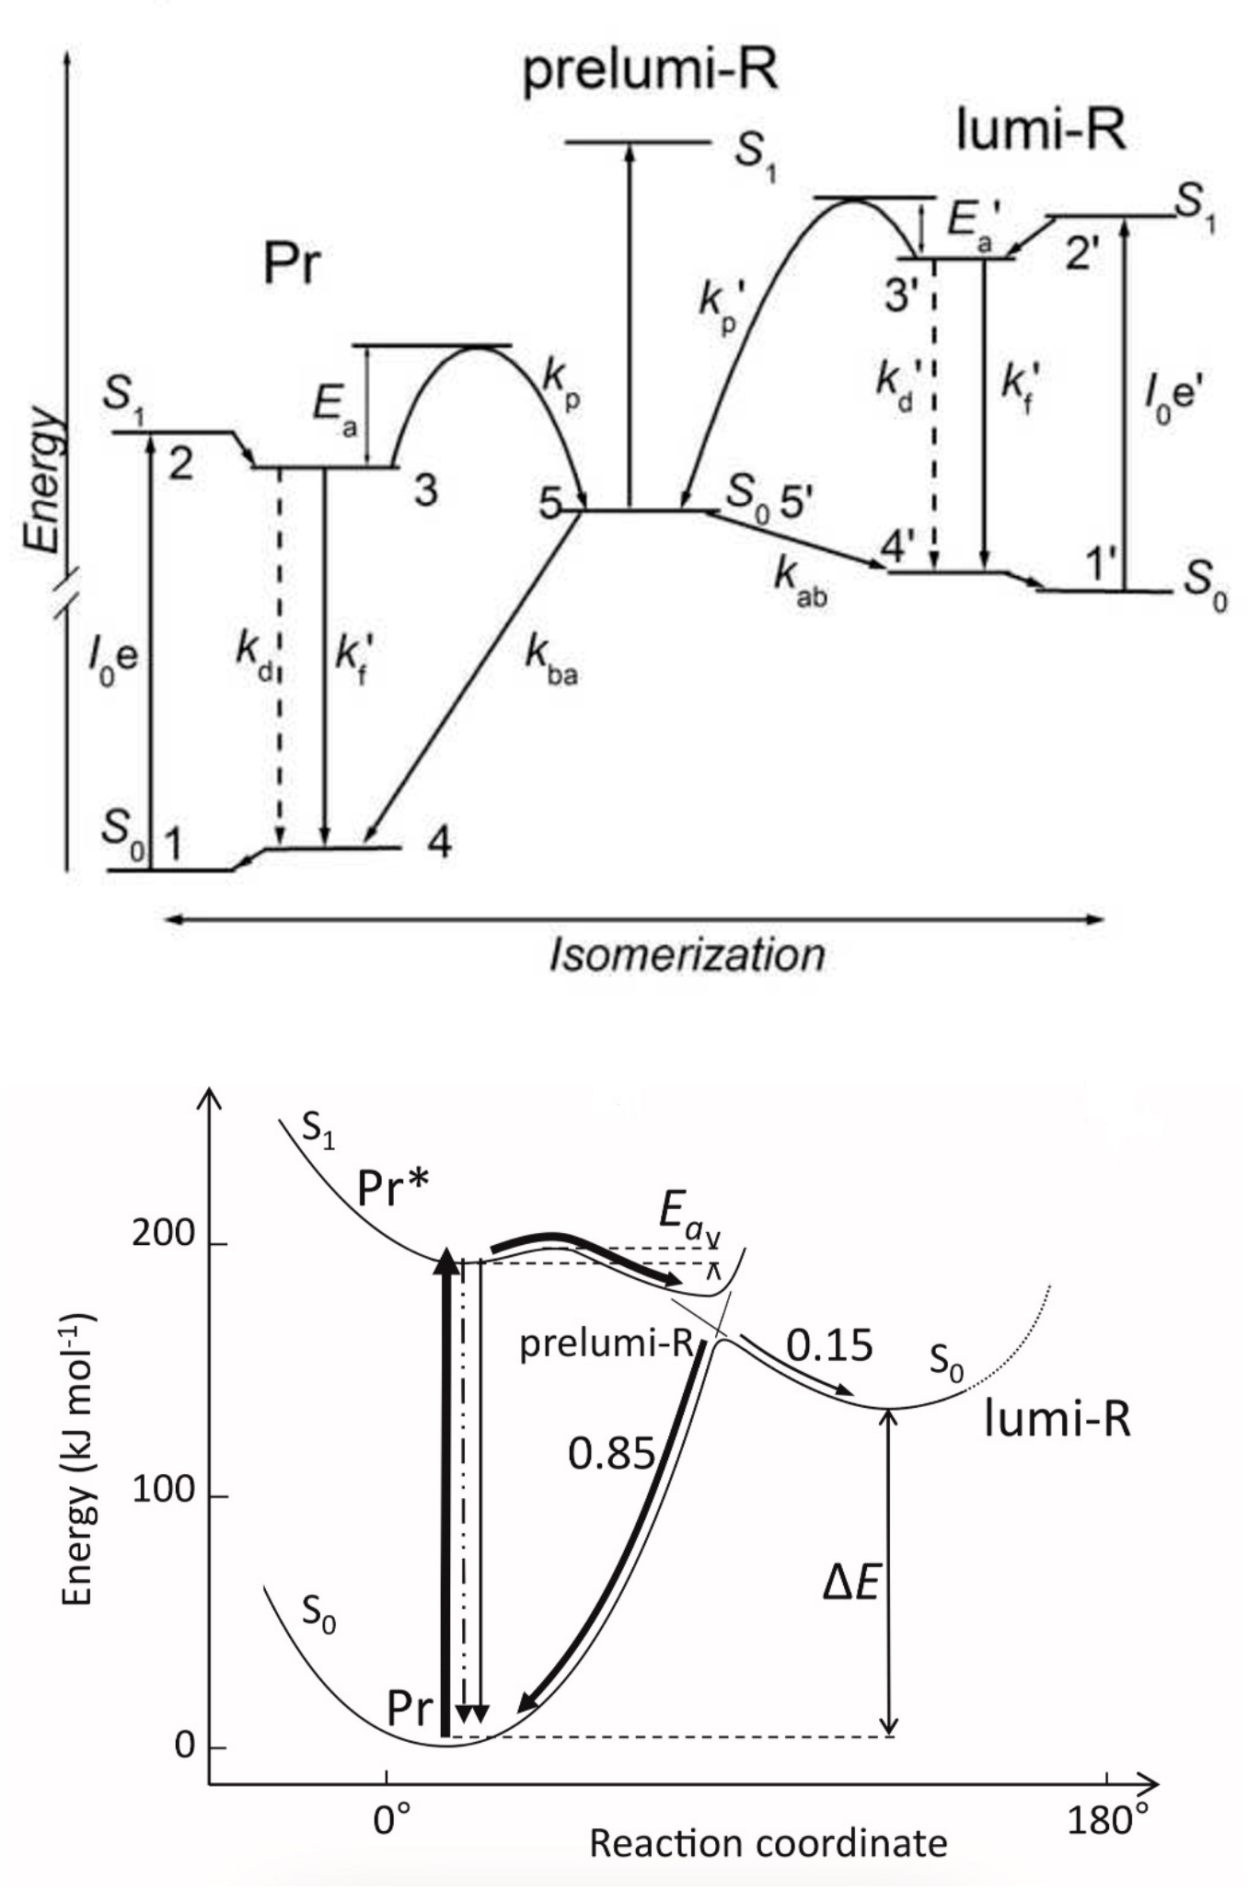
A hypothetical general photoreaction scheme can be proposed for rhodopsins and biliproteins based primarily on the data obtained on phytochrome. This scheme (Figure 9) is characterized by the assumption that the photoreaction and fluorescence arise from a single excited state, with the photoreaction (whether complete or incomplete) being the primary and possibly the only temperature-dependent pathway for excited state deactivation. It is also assumed that the photoreaction occurs by overcoming the energy barrier Ea in the excited state and that the initial state and photoproduct share a "hot" ground level. A key feature of the scheme is relaxation in the excited state, which can involve redistribution of electron density and conformational rearrangements. At low T (77–85 K), the activation barrier Ea blocks, completely or partially, depending on the phytochrome species (see below), the photochemical route of the excited state relaxation. This competition between the emission and photochemistry explains the low fluorescence yield of phytochrome at ambient T (Ta) (~0.005) and the high (~0.3) fluorescence yield of phytochrome at cryogenic T (Tc) [27,28].
Mechanistically, the activation barrier Ea can be connected (in phytochrome) with structural hindrances (breaking of hydrogen bonds) for the rotation of the 4th tetrapyrrole cycle in the chromophore pocket during the photoisomerization. Given that the photoreaction (either completed or uncompleted; see the scheme of the photoreaction in Figure 9) is the only temperature-dependent excitation deactivation pathway from the S1 state of Pr, the increase in the height of the activation barrier Ea can be thus achieved by the lowering of the flexibility of the chromophore via its firm fixation in the apoprotein pocket. Within the framework of the scheme, the low activation barriers in the case of (bacterio)rhodopsins apparently determine the high rate of deactivation of excited states along the isomerization coordinate of the primary photoreaction and the efficient quenching of their fluorescence, even at cryogenic temperatures. In contrast, light-harvesting biliproteins, unlike the related phytochrome, have long excited-state lifetimes and high fluorescence quantum yields, which are prerequisites for their effectiveness as energy donors and are ensured by the rigid fixation of the chromophore in the cyanobacterial matrix. For more detailed information on how the protein component influences the photophysical and photochemical properties of phytochromes and related phycobilins, refer to the fluorescence and structural studies of the cyanobacterial phytochrome (Cph1) discussed in review [12].
4. Conclusions
The results of the comparative investigations of the basic biological processes—photosynthesis, vision, photoregulation in plants—presented above illustrates, in my opinion, the advantages of the application of cryotechnology to the spectrofluorometric studies of complex pigment systems. Their analysis confirms that the physical basis for the technical advantages provided by cooling an object lies in the blocking of pathways for photochemical utilization of light energy and, consequently, an increase in the quantum yield of the emission. Together with the narrowing of fluorescence bands at lower temperatures, this significantly improves spectral resolution and deconvolution of complex spectra into a number of indiviual componens. The second aspect of cooling an object—the inhibition or cessation of photoconvesions at the very early their dark stages—provides the opportunity to study the mechanisms of initial photoreactions. Still another positive aspect of cooling was the use of liquid nitrogen-cooled photomultiplier light detectors, which significantly reduced dark noise and increased their sensitivity. These factors, together with mathematical analysis of the obtained data, made it possible to examine the processes of excitation energy generation and storage in a multicomponent system of interacting photosynthetic pigment centers. In the case of the photoreceptors—rhodopsins and phytochromes—the use of cryotechnology slowing down their photochemical quenching made it possible to detect fluorescence of the pigments and investigate with its use the mechanisms and dynamics of their primary photoprocesses. It can be thus assumed that cryotechnology will continue to be an effective research tool in the structural and functional investigations of photobiological processes.
Conflicts of Interests
The authors declares the absence of conflict of interests.
Funding
This study was conducted under the state assignment of the M.V. Lomonosov Moscow State University.
Institutional Review Board Statement
The were no studies conducted on animals.
References
- Litvin, F.F.; Sineshchekov, V.A. A setup for the spectral measurements of luminescence under monchromatic excitation. Biofizika (Russ.) 1963, 8, 516–518. [Google Scholar]
- Sineshchekov, V.A.; Sineshchekov, A.V. The method of complex absorption-fluorescence investigations of phytochrome in plant tissues. Fiziol. Rastenii (Russ.) 1987, 34, 832–836. [Google Scholar]
- Govindjee (Ed.) Biophysics of photosynthesis, 1st ed.; Academic Press: New York San Francisco London, 1975. [Google Scholar]
- Krasnovsky, A.A. The primary processes of photosynthesis in plants. Annu. Rev. Plant Physiol. 1960, 11, 363–410. [Google Scholar] [CrossRef]
- Litvin, F.F.; Sineshchekov, V.A.; Krasnovsky, A.A. On the longer-wavelength chlorophyll forms in photosynthetic organisms and aggregated structures. [CrossRef] [PubMed]
- Sineshchekov, V.A.; Shubin, V.V.; Litvin, F.F. The proof of the existence of a number of emitting and energy-interconnected chlorophyll forms by the method of selective excitation and measurements of fluorescence. Dokl. Acad. Sci. USSR (Russ.) 1973, 211, 1226–1230. [Google Scholar]
- Litvin, F.F.; Gulyaev, B.A.; Sineshchekov, V.A. Spectral characteristics, relative concentration and efficiency coefficients of energy migration of 10 native chlorophyll forms. Dokl. Acad. Sci. USSR (Russ.) 1971, 199, 1428–1431. [Google Scholar]
- Litvin, F.F.; Shubin, V.V.; Sineshchekov, V.A. Investigation of spectra with the method of derivative absoption and luminescence spectroscopy. Biofizika (Russ.) 1975, 20, 202–207. [Google Scholar]
- Litvin, F. F.; Sineshchekov, V. A. Molecular organization of chlorophyll and energetics of the initial stages in photosynthesis. In Biophysics of photosynthesis, 1st ed.; Govindjee, Ed.; Academic Press: New York San Francisco London, 1975; pp. 619–661. [Google Scholar]
- Sineshchekov, V.A. Excitation States of Pigments and Energy Migration in Photosynthesis and other Photobiological Processes. Doctor of Sciences Thesis (biophysics), M.V. Lomonosov Moscow State University, Moscow, 1983. [Google Scholar]
- Govindjee; Govindjee, R. Introduction to photosynthesis. In Biophysics of photosynthesis, 1st ed.; Govindjee, Ed.; Academic Press: New York San Francisco London, 1975; pp. 1–50. [Google Scholar]
- Sineshchekov, V.A.; Bekasova, O.D. Two distinct processes in cyanobacterial bilin pigments: energy migration in light-harvesting phycobilins vs. photoizomerisation in phytochromes. Photochem. Photobiol. 2020, 96, 750–767. [Google Scholar] [CrossRef] [PubMed]
- Sineshchekov, V.A.; Litvin, F.F.; Das, M. Chlorophyll a and carotenoid aggregates and energy migration in monolayers and thin films. Photochem. Photobiol. 1972, 15, 187–197. [Google Scholar] [CrossRef] [PubMed]
- Busch, G.E.; Applebury, M.L.; Lamola, A.A.; Rentzepis, P.M. Formation and decay of prelumirhodopsin at room temperatures. Proc. Natl. Acad. Sci. 1972, 69, 2802–2806. [Google Scholar] [CrossRef] [PubMed]
- Lewis, A.; Perreault, G.J. Emission spectroscopy of rhodopsin and bacteriorhodopsin. Methods Enzymol. 1982, 88, 217–229. [Google Scholar] [CrossRef]
- Sineshchekov, V.A.; Balashov, C.P.; Litvin, F.F. Fluorescence of rhodopsin in the outer rod segments of a frog at 77 K. Dokl. Acad. Sci. USSR (Russ.) 1983, 270, 1231–1235. [Google Scholar]
- Sineshchekov, V.A.; Litvin, F.F. Fluorescence of rhodopsin in the rods of bovine retina at –196 °C. Dokl. Acad. Sci. USSR (Russ.) 1985, 281, 1471–1474. [Google Scholar]
- Doukas, A.G.; Junnarkar, M.R.; Alfano, R.R.; Callender, R.H.; Kakitani, T.; Honig, B. Fluorescence quantum yield of visual pigments: evidence for subpicosecond isomerization rates. Proc. Natl. Acad. Sci. 1984, 81, 4790–4794. [Google Scholar] [CrossRef] [PubMed]
- Cronin, T.W.; Goldsmith, T.H. Fluorescence of crayfish metarhodopsin studied in single rhabdoms. Biophys. J. 1981, 35, 653–664. [Google Scholar] [CrossRef] [PubMed]
- Sineshchekov, V.A.; Litvin, F.F. Fluorescence of rhodopsins and its link with the primary processes of light energy transformation. Biophysics 1987, 32, 588–607. [Google Scholar]
- Oesterhelt, D.; Stoeckenius, W. Functions of a new photoreceptor membrane. Proc. Natl. Acad. Sci. 1973, 70, 2853–2857. [Google Scholar] [CrossRef] [PubMed]
- Sineshchekov, V.A.; Litvin, F.F. Luminescence of bacteriorhodopsis in the purple mebranes of the Halobaterium halobium cells. Biofizika (Russ.) 1976, 21, 313–320. [Google Scholar]
- Sineshchekov, V.A.; Litvin, F.F. Luminescence of bacteriorhodopsin from Halobacterium halobium and its connection with the photochemical conversions of the chromophore. Biochim. Et. Biophys. Acta (BBA) -Bioenergetics 1977, 462, 450–466. [Google Scholar] [CrossRef]
- Sineshchekov, V.A.; Balashov, C.P.; Litvin, F.F. Fluorescence of photoactive bacteriorhodopsin. Biofizika (Russ) 1981, 26, 964–972. [Google Scholar]
- Smith, H. Special issue on photomorphogenesis. Plant Cell Environ. 1997, 20, 4–1. [Google Scholar]
- Sineshchekov, V.A. Photobiophysica and photobiochemistry of the heterogeneous phytochrome system. Biochim. Biophys. Acta 1995, 1228, 125–164. [Google Scholar] [CrossRef]
- Sineshchekov, V.A.; Sineshchekov, A.V. Fluorescence of phytochrome in the cell. Dokl. Acad. Sci. USSR (Russ.) 1987, 292, 477–481. [Google Scholar]
- Sineshchekov, V.A.; Sineshchekov, A.V. Fluorescence of phytochrome in the cells of dark-grown plants and its connection with the phototransformations of the pigment. Photochem. Photobiol. 1989, 49, 325–330. [Google Scholar] [CrossRef]
- Sineshchekov, V.A. Applications of fluorescence spectroscopy in the investigation of plant phytochrome in vivo. Plant Physiol. Biochem. 2024, 208, 108434. [Google Scholar] [CrossRef] [PubMed]
- Sineshchekov, V.A. Phytochrome A: functional diversity and polymorphism. Photochem. Photobiol. Sci. 2004, 3, 596–607. [Google Scholar] [CrossRef] [PubMed]
- Sineshchekov, V.A. Two distinct molecular types of phytochrome A in plants: evidence of existence and implications for functioning. Int. J. Mol. Sci. 2023, 24, 8139. [Google Scholar] [CrossRef] [PubMed]
- Sineshchekov, V.; Mailliet, J.; Psakis, G.; Feilke, K.; Kopycki, J.; Zeidler, M.; Essen, L.-O.; Hughes, J. Tyrosine 263 in cyanobacterial phytochrome Cph1 optimizes photochemistry at the. Photochem. Photobiol. 2014, 90, 786–795. [Google Scholar] [CrossRef] [PubMed]
Figure 1.
Second derivative of the fluorescence excitation (a) and emssion (b) spectra at 77 K of the homogenates of bean leaves (1) and suspension of Chlorella (2). From [7].
Figure 1.
Second derivative of the fluorescence excitation (a) and emssion (b) spectra at 77 K of the homogenates of bean leaves (1) and suspension of Chlorella (2). From [7].
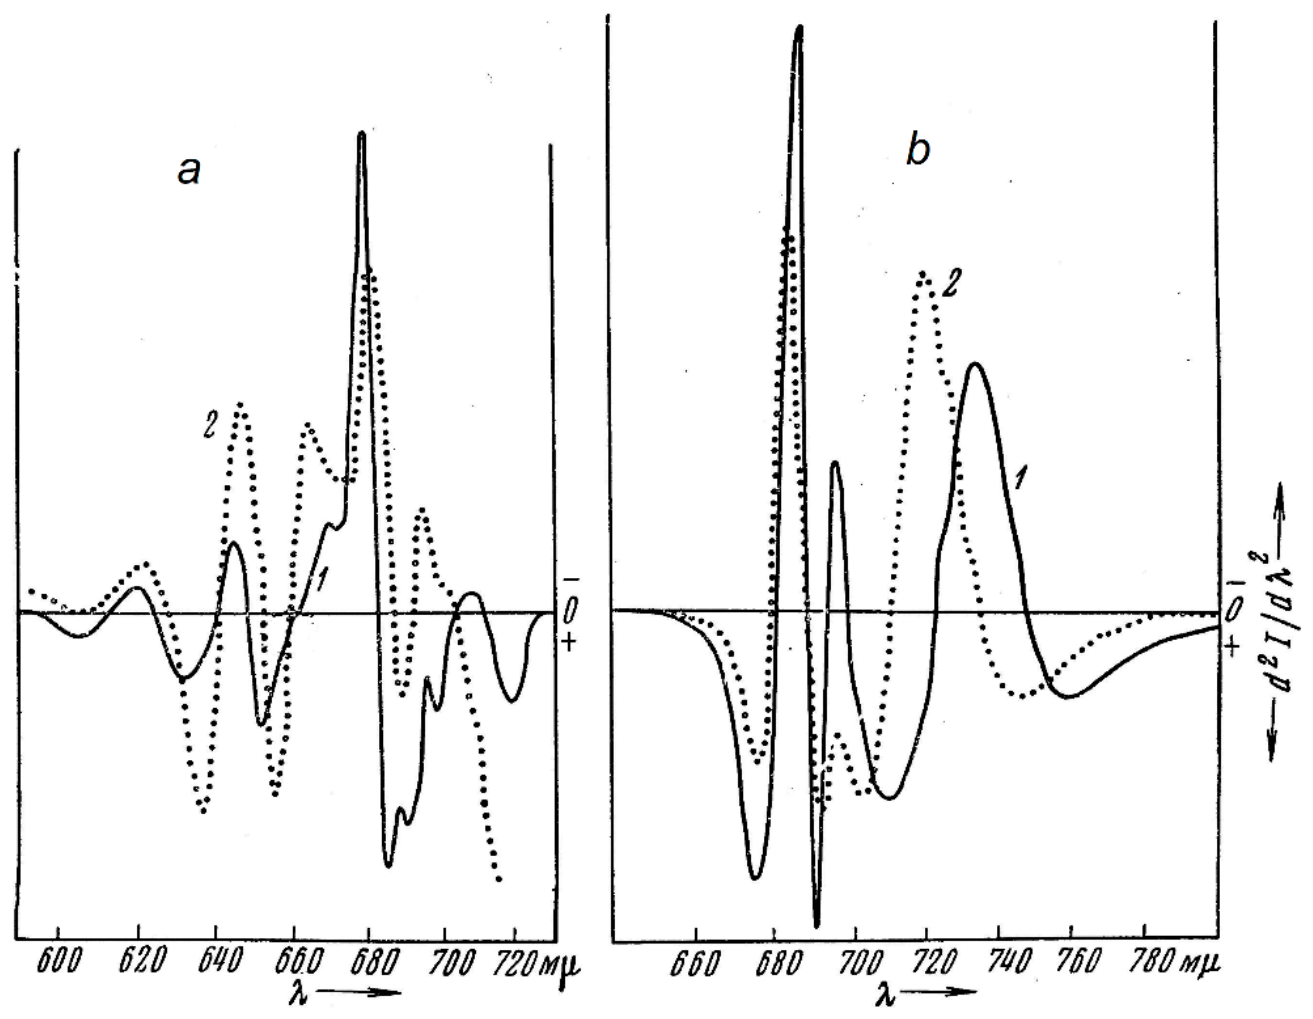
Figure 3.
Scheme of light absorption and emission by chlorophyll forms (designated by their maxima), and excitation energy transfer between them during photosynthesis and then to the reaction centers of the electron transport chain of the photosystems 1 and 2 (P700 and P680, respectively). The distribution of the pigment forms between the photosystems is expressed as a percentage (for bean chloroplasts). From [10].
Figure 3.
Scheme of light absorption and emission by chlorophyll forms (designated by their maxima), and excitation energy transfer between them during photosynthesis and then to the reaction centers of the electron transport chain of the photosystems 1 and 2 (P700 and P680, respectively). The distribution of the pigment forms between the photosystems is expressed as a percentage (for bean chloroplasts). From [10].
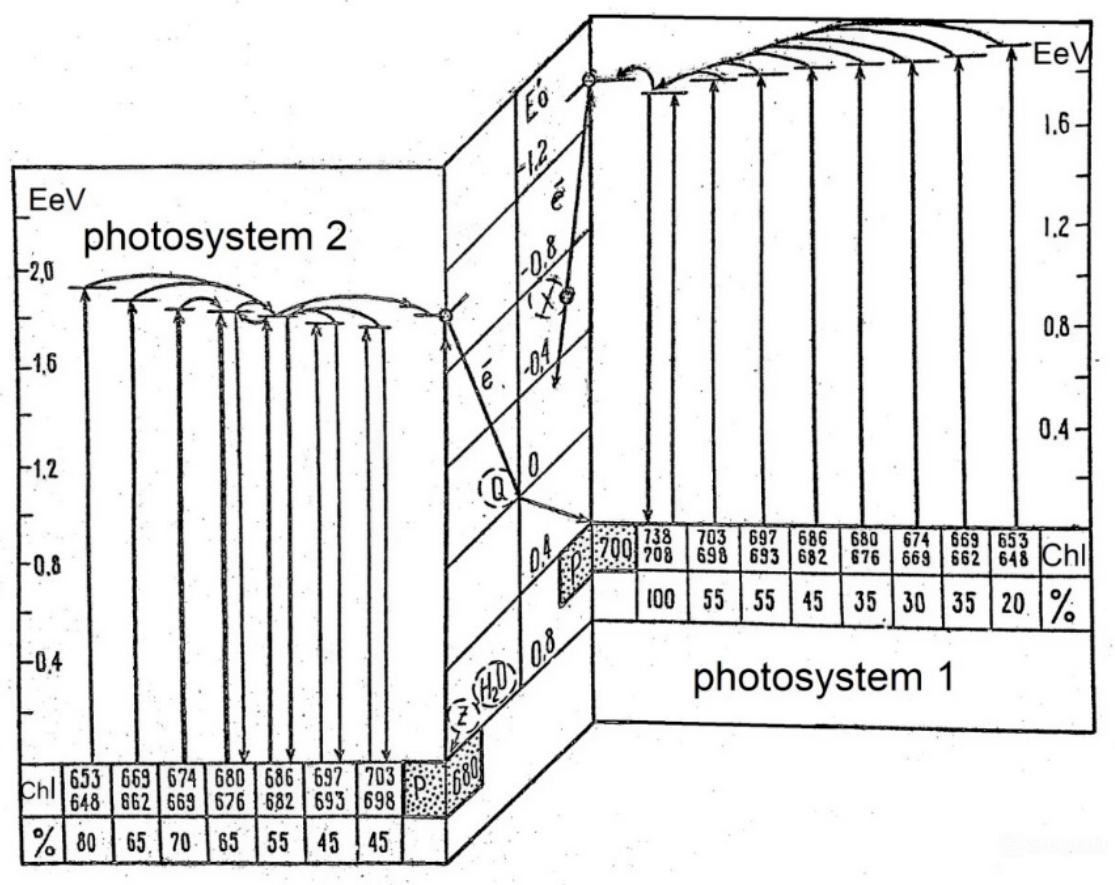
Figure 4.
Scheme of the excitation energy migration between the phycobilproteins (PBPs) in the phycobilisome of the cyanobacterium Nostoc muscorum (line WKM-16). Efficiencies of direct energy transfer (α ≥ 0.3) and average distances (Å) (R < 65 Å) for the donor–acceptor PBP pairs at 77 K were obtained assuming statistical orientation of the chromophores. The area of the circles reflects the numbers of chromophores of each pigment in a phycobilisome (in brackets). From [12].
Figure 4.
Scheme of the excitation energy migration between the phycobilproteins (PBPs) in the phycobilisome of the cyanobacterium Nostoc muscorum (line WKM-16). Efficiencies of direct energy transfer (α ≥ 0.3) and average distances (Å) (R < 65 Å) for the donor–acceptor PBP pairs at 77 K were obtained assuming statistical orientation of the chromophores. The area of the circles reflects the numbers of chromophores of each pigment in a phycobilisome (in brackets). From [12].
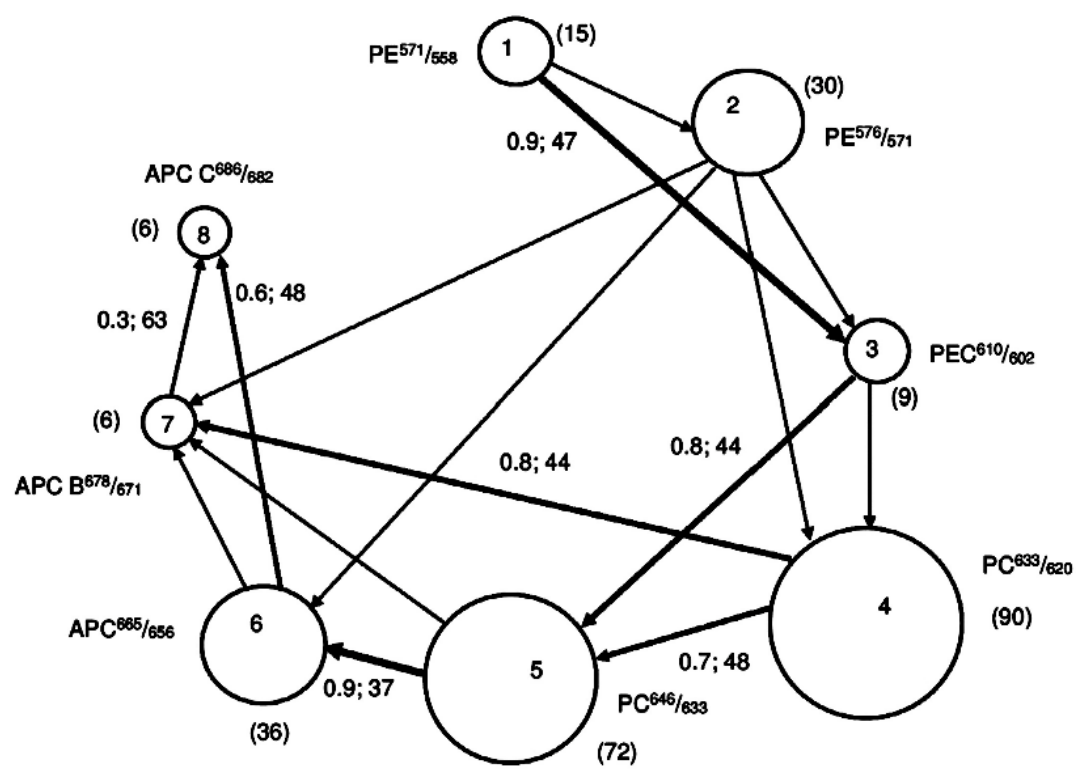
Figure 5.
Spectrum of variable fluorescence of the ourted segments of the rods of the bovine retina at 77 K (excitation at 436 nm) constructed with reference to the reabsorption effects (1): (points mean of 6-10 measurements); absroption spectrum (2) and fluorescence excitation spectrum (recording at 650 nm) (points in curve 2, mean of 3-6 mesurrements) [17].
Figure 5.
Spectrum of variable fluorescence of the ourted segments of the rods of the bovine retina at 77 K (excitation at 436 nm) constructed with reference to the reabsorption effects (1): (points mean of 6-10 measurements); absroption spectrum (2) and fluorescence excitation spectrum (recording at 650 nm) (points in curve 2, mean of 3-6 mesurrements) [17].
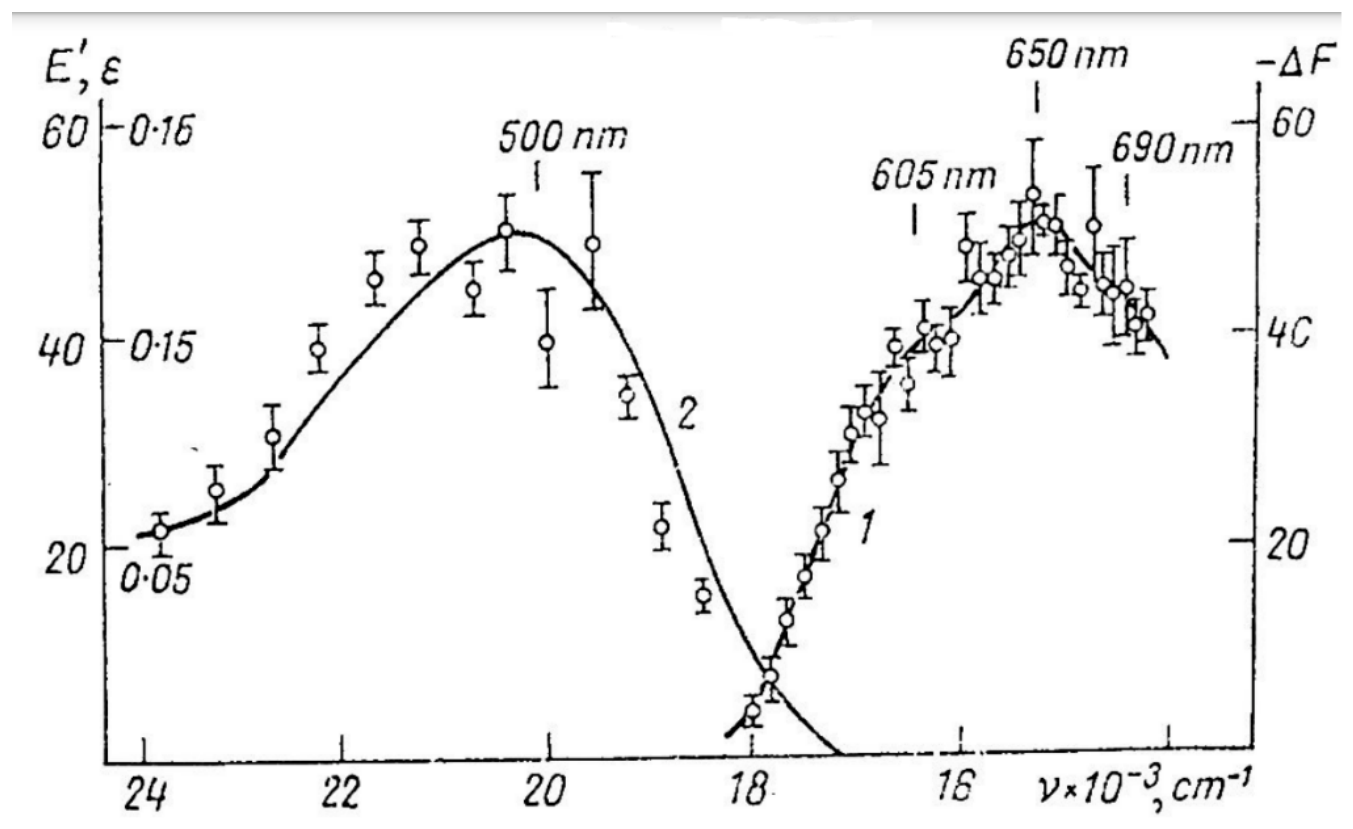
Figure 8.
The low-temperature fluorescence method for phytochrome in-situ assay. To characterize the pigment, three fluorescence spectra of phytochrome were measured at 85 K and excitation wavelength at 633 nm: (1) in etiolated tissues (of wheat) when all phytochrome is in its Pr form; (2) in the same sample after saturating red illumination at 85 K partially converting Pr into lumi-R, the first stable photoproduct lumi-R; and (3) in the same sample after thawing at 273 K, saturating red illumination converting Pr into Pfr and freezing again at 85 K. Four major parameters were obtained from these spectra: position of the emission spectrum (λmax); total phytochrome content proportional to the fluorescence intensity ([Ptot]=Fo); extent of the Pr lumi-R photoconversion, equal to the relative fluorescence decline (γ1 = ∆F1/Fo) and characterizing the initial photoreaction; and the extent of the Pr Pfr photoconversion (γ2= ∆F2/Fo), characterizing the whole phytochrome cycle. From [30].
Figure 8.
The low-temperature fluorescence method for phytochrome in-situ assay. To characterize the pigment, three fluorescence spectra of phytochrome were measured at 85 K and excitation wavelength at 633 nm: (1) in etiolated tissues (of wheat) when all phytochrome is in its Pr form; (2) in the same sample after saturating red illumination at 85 K partially converting Pr into lumi-R, the first stable photoproduct lumi-R; and (3) in the same sample after thawing at 273 K, saturating red illumination converting Pr into Pfr and freezing again at 85 K. Four major parameters were obtained from these spectra: position of the emission spectrum (λmax); total phytochrome content proportional to the fluorescence intensity ([Ptot]=Fo); extent of the Pr lumi-R photoconversion, equal to the relative fluorescence decline (γ1 = ∆F1/Fo) and characterizing the initial photoreaction; and the extent of the Pr Pfr photoconversion (γ2= ∆F2/Fo), characterizing the whole phytochrome cycle. From [30].
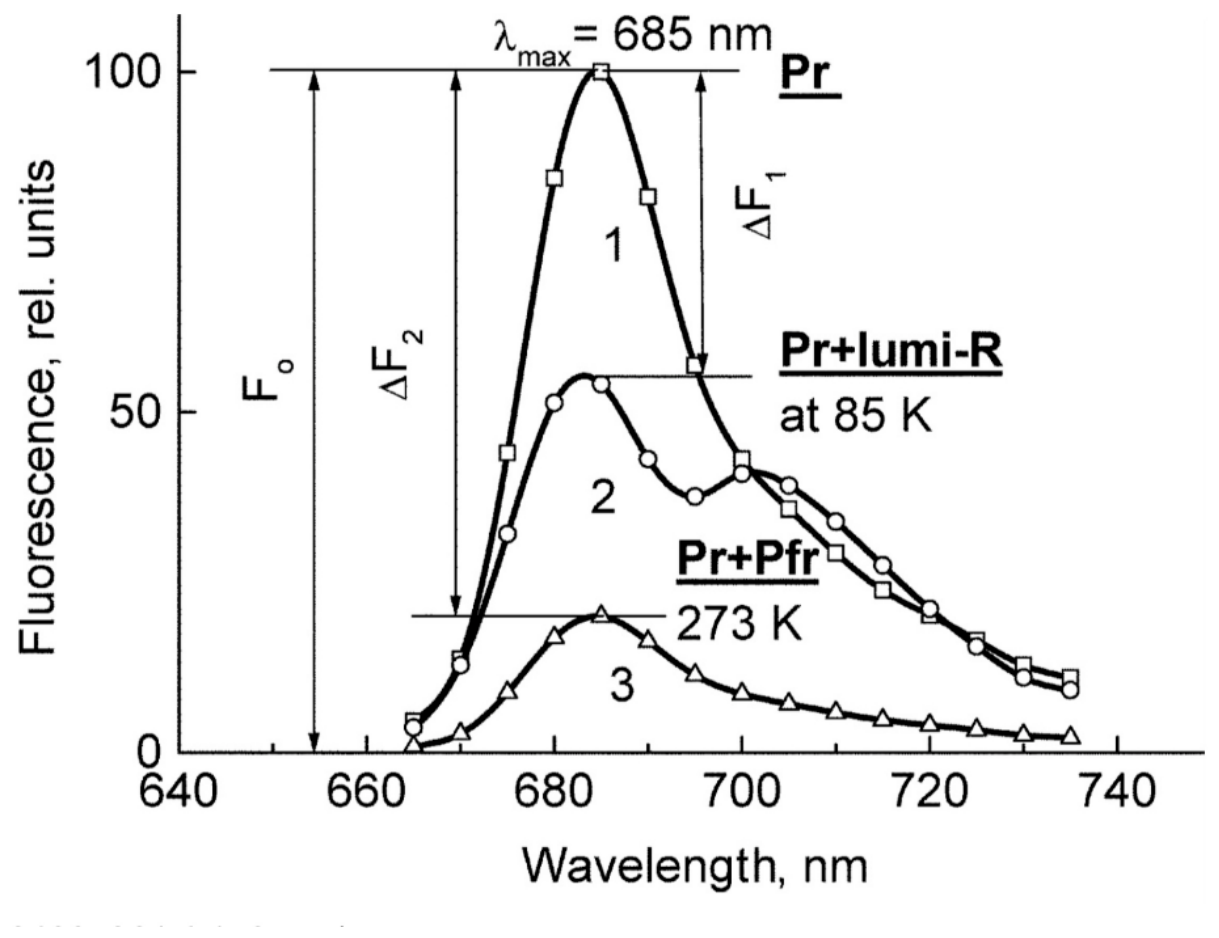
Figure 9.
Energy level schemes of the photoreaction of the initial red-absorbing form (Pr) into the first photoproduct (lumi-R) stable at low temperatures via a short-lived unstable orthogonal intermediate (prelumi-R) suggested for plant phytochrome (upper pannel) and, based on that, for the cyanobacterial phytochrome Cph1 (lower pannel). I0ε, I0ε′—absorption coefficients; k, k′—constants of: fluorescence (kf, kf′), temperature-independent degradation of excitation (kd, kd′), initial photoreaction (kp, kp′), phototransformation into photoproduct (kab), and return into the initial state (kba); Ea and Ea', activation energy barriers of the direct and reverse photoreactions. The prime sign (′) relates to lumi-R. In the scheme of the reaction in Cph1 (lower pannel), 0.85 and 0.15 stand for the efficiency of the reverse and direct processes of excitation state relaxation, respecitvely, ∆E, for the energy stored. From [26,32].
Figure 9.
Energy level schemes of the photoreaction of the initial red-absorbing form (Pr) into the first photoproduct (lumi-R) stable at low temperatures via a short-lived unstable orthogonal intermediate (prelumi-R) suggested for plant phytochrome (upper pannel) and, based on that, for the cyanobacterial phytochrome Cph1 (lower pannel). I0ε, I0ε′—absorption coefficients; k, k′—constants of: fluorescence (kf, kf′), temperature-independent degradation of excitation (kd, kd′), initial photoreaction (kp, kp′), phototransformation into photoproduct (kab), and return into the initial state (kba); Ea and Ea', activation energy barriers of the direct and reverse photoreactions. The prime sign (′) relates to lumi-R. In the scheme of the reaction in Cph1 (lower pannel), 0.85 and 0.15 stand for the efficiency of the reverse and direct processes of excitation state relaxation, respecitvely, ∆E, for the energy stored. From [26,32].
Disclaimer/Publisher’s Note: The statements, opinions and data contained in all publications are solely those of the individual author(s) and contributor(s) and not of MDPI and/or the editor(s). MDPI and/or the editor(s) disclaim responsibility for any injury to people or property resulting from any ideas, methods, instructions or products referred to in the content. |
© 2026 by the authors. Licensee MDPI, Basel, Switzerland. This article is an open access article distributed under the terms and conditions of the Creative Commons Attribution (CC BY) license (http://creativecommons.org/licenses/by/4.0/).
Copyright: This open access article is published under a Creative Commons CC BY 4.0 license, which permit the free download, distribution, and reuse, provided that the author and preprint are cited in any reuse.


