

Submitted:
18 July 2026
Posted:
21 July 2026
You are already at the latest version
Abstract
Range anxiety remains a barrier to the adoption of electric vehicles (EVs), compounded by the energy draw of Heating, Ventilation, and Air Conditioning (HVAC) systems, which can reduce battery reserves by over 20%. Existing data-driven energy estimation models frequently operate as uninterpretable "black boxes", exhibit data leakage during temporal cross-validation, and lack real-time feedback mechanisms for the driver. To address these limitations, this paper presents a physics-informed Human-Machine Interface (HMI) framework driven by a decoupled hybrid machine learning architecture. The proposed layout separates powertrain dynamics from cabin thermal behavior using a multi-engine design: a HistGradientBoosting regressor integrated with a mechanistic Vehicle Specific Power (VSP) indicator to track traction demand, and a regularized Random Forest model enriched with a Newtonian thermal decay function to predict transient thermodynamic climate states. The models were trained and evaluated using a 5-Fold GroupKFold validation protocol across an empirical 55-trip dataset to prevent data leakage and ensure out-of-sample generalization. The traction subsystem achieved an out-of-sample coefficient of determination (R² = 0.9869, Mean Absolute Error MAE = 0.71 kW), while the thermal core reached an R² = 0.8545 (MAE = 0.30 kW). Model transparency and physical consistency were evaluated using game-theoretic SHAP (SHapley Additive exPlanations) values. Finally, a multi-objective Pareto optimization loop was integrated within a real-time HMI advisory dashboard to balance range extension against passenger thermal discomfort. Macroscopic simulation across the empirical fleet dataset indicates that implementing this software-only, context-aware advisory system reduces total fleet grid-charging demand by 5.21%.
Keywords:
electric vehicles
; physics-informed machine learning
; vehicle specific power
; explainable AI (XAI)
; pareto optimization
; human-machine interface
1. Introduction
The global transportation sector is undergoing a transition driven by the imperative to mitigate anthropogenic greenhouse gas emissions and address climate change [1,2]. As a component of sustainable smart city logistics and national de-carbonization strategies, electric vehicles (EVs) have emerged as a primary alternative to conventional internal combustion engine automobiles [3,4]. Despite advancements in electrochemical energy storage technology and the continuous expansion of public charging infrastructure [5,6], the widespread market penetration of battery electric vehicles remains hindered by “range anxiety”—the psychological and operational concern regarding battery depletion prior to reaching a destination [7,8]. This operational vulnerability is exacerbated by fluctuating real-world driving conditions [9,10], where ambient environments can distort nominal manufacturer range estimates by a significant margin [11,12].
While the traction subsystem constitutes the primary consumer of stored electrochemical energy, auxiliary climate control loops—specifically Heating, Ventilation, and Air Conditioning (HVAC) units—represent the second most energy-intensive cluster within modern EV topologies [13,14]. Unlike internal combustion vehicles, which utilize waste thermal energy from the engine block for cabin heating, EVs rely on dedicated, high-voltage positive temperature coefficient (PTC) resistive heaters or thermal heat pumps to maintain passenger comfort [15,16]. Under winter conditions (sub-zero ambient profiles), the active draw of thermal management architectures can degrade the driving range of an EV by over 20% [17,18]. Conversely, during summer operational envelopes, the mechanical workload imposed by the air conditioning compressor induces a secondary energy penalty [19,20]. Consequently, the instantaneous power throughput drawn from the traction battery is a coupled, non-linear function governed simultaneously by external powertrain aerodynamics and internal cabin thermodynamics [21,22].
To manage this energy distribution, literature has extensively explored data-driven and machine learning (ML) frameworks to predict and optimize EV energy consumption [23,24]. However, existing data-driven prediction models frequently exhibit two primary architectural limitations. First, standard validation protocols often rely on simple random train-test splits on continuous time-series data [25]. Because sequential metrics sampled at high frequencies (e.g., 1 Hz) exhibit temporal autocorrelation, random allocation induces data leakage, wherein the model evaluates its performance on data points immediately adjacent to the training set [26,27]. This results in overfitted, inflated accuracy metrics that fail to generalize to unfamiliar trip routes. Second, prevailing predictive architectures typically function as abstract “black boxes” [28,29]. They prioritize statistical correlations over physical conservation laws, making them susceptible to domain shifts, such as abrupt changes in ambient temperature or topographic variations [30,31].
Furthermore, a gap persists in the operationalization of these energy forecasts within the context of active vehicle routing. While advanced energy management systems (EMS) can compute vehicle range limits, they rarely establish a dynamic feedback loop with the vehicle operator [32]. Most commercial energy advisory systems offer rigid eco-routing metrics without considering voluntary passenger comfort concessions [33]. To address these limitations, there is a requirement for a context-aware cyber-physical interface capable of computing multi-objective trade-offs in real time, thereby enabling the driver to dynamically adjust comfort parameters to secure arrival at critical charging infrastructure.
To address these interrelated knowledge gaps, this paper presents a physics-informed hybrid machine learning framework for context-aware EV range optimization, integrated with a multi-objective Pareto Human-Machine Interface (HMI) advisory system. The core contribution of this research is fourfold:
1. A decoupled hybrid machine learning topology is established, separating powertrain dynamics from cabin thermodynamics. Powertrain power is tracked using a HistGradientBoosting regressor integrated with a mechanistic Vehicle Specific Power (VSP) indicator to map aerodynamic and gravitational resistances.
2. The auxiliary thermal core is embedded with a physics-informed Newtonian thermal decay function (τ) derived from the law of cooling, addressing the domain-shift vulnerabilities typically associated with continuous temporal tracking across varying trip lengths.
3. The predictive engines are validated utilizing a 5-Fold GroupKFold cross-validation protocol partitioned strictly by independent, empirical trip segments, preventing data leakage and evaluating out-of-sample generalization.
4. The verified predictive matrix feeds a real-time multi-objective Pareto optimization loop within a cyber-physical HMI dashboard, enabling dynamic trade-off resolutions between localized range extensions and localized thermal discomfort penalties.
To systematically evaluate the performance of the proposed architecture, this study is guided by two central research hypotheses:
Hypothesis 1 (H1):
Decoupling powertrain electromechanical demand from cabin thermodynamics using physics-informed features (VSP and τ) yields higher out-of-sample energy prediction accuracy compared to global machine learning estimators, while eliminating temporal data leakage.
Hypothesis 2 (H2):
A real-time, context-aware Pareto optimization loop can translate abstract HVAC energy suppression states into actionable driver temperature and ventilation adjustments, extending the vehicle’s driving range with a minimal thermal discomfort penalty and reducing collective grid-charging demand.
2. Materials and Methods
This section outlines the experimental methodology and computational frameworks developed for the context-aware energy optimization platform. It describes the empirical dataset acquisition and data cleaning protocols, followed by the technical specifications of the experimental test vehicle and the multi-layer cyber-physical architecture. Finally, the physics-informed feature engineering formulations and the decoupled machine learning cross-validation design are detailed.
2.1. Empirical Dataset Acquisition and Quality Assurance
The empirical baseline driving metrics utilized in this study were harvested from continuous real-world driving operations of a battery electric vehicle (BEV) instrumented with an automated data logging system tapping into the vehicle’s high-speed Controller Area Network (CAN) bus matrix. The raw telemetry stream was recorded at a synchronous sampling frequency of 1 Hz. The initial unrefined dataset comprised continuous temporal rows distributed across various driving segments. To establish a standardized statistical envelope for machine learning deployment, a multi-stage data quality assurance pipeline was implemented:
- First, all continuous rows containing missing, corrupted, or out-of-boundary sensor readouts within critical features (such as battery voltage, current, motor torque, or elevation) were eliminated.
- Second, distinct trip segments were reconstructed by tracking continuous time-elapsed parameters; a boundary threshold where continuous time reset or dropped below zero was utilized to automatically partition the global database into independent Trip_ID clusters.
- Third, a physical filter was applied to isolate and exclude anomalous operational segments. Specifically, Trip 26 and Trip 45 were discarded due to extreme energy recuperation profiles (where net downhill regenerative braking power distorted the cumulative battery power throughput, yielding an inaccurate baseline for standard consumption profile modeling). Additionally, Trip 55 was removed because it represented a climate-neutral segment (variable-neutral driving where ambient conditions matched the passenger comfort baseline, resulting in zero localized HVAC usage).
Following this data filtration protocol, the finalized clean matrix comprised 78,010 synchronized data records across 55 distinct, fully valid empirical trips, encompassing a comprehensive spectrum of urban, suburban, and highway driving conditions under highly volatile ambient temperatures ranging from winter to summer envelopes.
2.1.1. Experimental Test Vehicle Specification
The empirical driving campaign was executed utilizing a standardized production-grade battery electric vehicle platform, specifically a representative modern C-segment electric Sport Utility Vehicle (SUV) manufactured in 2026. This vehicle serves as a baseline for cyber-physical energy profiling due to its contemporary electromechanical integration and high-voltage auxiliary configuration. The vehicle is propelled by a rear-mounted permanent magnet synchronous motor delivering a peak nominal power output of 125 kW and a maximum torque of 310 Nm. The tested vehicle is presented in Figure 1.
The structural and aerodynamic constants of the experimental platform, which directly calibrate the physical constraints of the Vehicle Specific Power (VSP) formulation detailed in Section 2.3, are summarized in Table 1. The vehicle utilizes a high-voltage lithium-ion battery pack with a baseline usable capacity of 52.0 kWh. To evaluate the architectural scalability and flexibility of the proposed context-aware HMI advisory system, the physical optimization core is systematically evaluated against both the empirical 52.0 kWh baseline and an extended-range 77.0 kWh factory pack variant within the predictive software loop.
2.2. Proposed Cyber-Physical Framework Architecture
The functional workflow of the proposed context-aware energy management and advisory system is organized into a decoupled cyber-physical architecture. The logical sequence is divided into three interconnected layers (Figure 2):
- The Physical Ingestion Layer: Captures real-time physical states from vehicle sensors, including instantaneous longitudinal velocity (v), continuous acceleration (a), throttle position, mechanical motor torque, ambient temperature (Tamb), and cabin temperature (Tcabin).
- The Cyber Predictive Engine: Processes these physical variables using two distinct, decoupled machine learning pipelines. The Powertrain Core maps instantaneous traction requirements based on electromechanical and topographic features, while the Thermal Core calculates the transient climate control load based on localized thermodynamic gradients.
- The Cognitive Advisory Layer: Ingests the parallel power predictions from the cyber engines, compares the cumulative energy state against the remaining mission distance to the next charging station, and resolves a real-time multi-objective Pareto trade-off loop to display adjustments on the driver’s HMI dashboard.
2.3. Feature Engineering and Physics-Informed Indicators
2.3.1. Vehicle Specific Power (VSP) Integration
To elevate the powertrain predictive engine from an abstract statistical model to a physics-informed framework, the instantaneous aerodynamic, rolling, and gravitational resistance forces are explicitly quantified using the Vehicle Specific Power (VSP) formulation. VSP serves as an invaluable metric in transport engineering, representing the instantaneous power demand of the vehicle normalized by its total mass. The localized VSP (W/kg) is calculated using the standardized empirical parameters adjusted for modern passenger EV weight and aerodynamic classes:
where
V—the longitudinal vehicle speed (m/s),
—the active longitudinal acceleration (m/s2),
g—the acceleration due to gravity (9.81 m/s2),
CR—the rolling resistance coefficient (0.132).
To compute the exact instantaneous road slope angle (θ), high-resolution elevation data was processed. The road gradient percentage was dynamically derived by tracking the spatial elevation delta (ΔE) relative to the exact distance covered over a 1-s interval:
The calculated grade percentage was strictly clipped between −15% and +15% to filter out spatial sensor noise while capturing steep real-world topographic variations.
2.3.2. Newtonian Thermal Decay (τ) Modeling
A common pitfall when modeling auxiliary HVAC loads using standard machine learning is the model’s inability to contextualize varying trip lengths, often resulting in severe domain shifts. In this study, the raw continuous temporal variable is transformed into a physics-informed dimensionless variable (τ) based on Newton’s Law of Cooling. This variable mathematically defines the transient exponential decay of the cabin enclosure during its initial high-energy heating or cooling phase before stabilizing into a steady-state thermal equilibrium:
where
tstart—the continuous duration elapsed from the initialization of that specific trip segment (s),
—equivalent effective thermal time constant of the cabin enclosure. In this study, is mathematically fixed at 600 s (10 min), established via empirical parameter identification during stationary thermal pull-up and pull-down test cycles executed on the vehicle platform, where the cabin air temperature asymptotically approached steady-state equilibrium within approximately 3 (30 min).
In strict physical applications, the instantaneous thermal time constant of a vehicle cabin is not a static constant, but rather a dynamic variable governed by forced external convection (a function of longitudinal vehicle speed, v), solar insolation (Qsolar), and the active ventilation mass flow rate (
However, explicitly modeling these high-dimensional thermodynamic micro-interactions analytically is mathematically intractable for real-time onboard HMI applications and highly susceptible to cumulative sensor drift. Under the proposed physics-informed machine learning (PIML) paradigm, utilizing a constant effective baseline serves as a robust macroscopic temporal anchor. The regularized Random Forest model subsequently ingests this physical decay curve alongside dynamic operational inputs—specifically vehicle velocity (v), ambient temperature (Tamb), and the active thermal gradient (ΔT)—allowing the statistical core to learn and dynamically compensate for the localized convective and insolation-driven variations of the thermal envelope.
The thermal gradient feature (ΔT) is simultaneously established as:
2.4. Decoupled Machine Learning Core and GroupKFold Validation Protocol
To ensure high-fidelity energy forecasting across volatile driving profiles, a decoupled machine learning topology was developed, moving away from a single global regressor.
The Powertrain Core utilizes a HistGradientBoosting Regressor (configured with a maximum depth of 10) to map traction power. This histogram-based gradient boosting algorithm is exceptionally skilled at handling complex, non-linear electromechanical correlations between torque, speed, and topographic VSP inputs. Concurrently, the Thermal Core deploys a highly regularized Random Forest Regressor (100 estimators, restricted to a maximum depth of 5 and requiring a minimum of 100 samples per leaf node). This strict structural constraint was intentionally applied to force global average smoothing across thermodynamic parameters, effectively neutralizing localized operator noise and preventing overfitting on unique cabin control habits.
To evaluate the validity of the models under real-world conditions, a 5-Fold GroupKFold Cross-Validation protocol was implemented. Unlike conventional random k-fold cross-validation—which creates data leakage by mixing adjacent data points of the same driving sequence into both training and testing folds—the GroupKFold protocol splits the data by grouping rows according to their respective Trip_ID. Consequently, in each cross-validation fold:
- The machine learning models are trained exclusively on approximately 44 entirely separate driving trips.
- The predictive models are subsequently tested on roughly 11 completely unseen trips, which were kept strictly out of the training loop.
This out-of-sample testing ensures that the reported accuracy and R2 metrics represent the system’s capacity to generalize to novel geographic routes and unfamiliar driver habits.
To ensure that the reported metrics are robust and free from partition bias, the spatial-temporal distribution of the 5-fold splits was carefully monitored. Rather than executing a naive group division, the GroupKFold routing was verified to ensure that each of the five folds contained a balanced, representative distribution of:
- Climatic boundaries: Each fold incorporated an equivalent mix of winter, transitional, and summer trip profiles (with ambient temperatures spanning the entire $−0.001 °C to 33.5 °C spectrum).
- Kinematic classes: Each fold integrated a proportional distribution of urban, suburban, and highway driving segments.
This structural balance prevents covariate shift across the cross-validation partitions, ensuring that the model is evaluated under stable training-to-testing feature spaces.
Regarding algorithm selection for the thermal subsystem, preliminary testing evaluated both XGBoost and CatBoost architectures. However, auxiliary climate control loads exhibit severe high-frequency fluctuations driven by rapid physical perturbations (such as instantaneous fan speed modifications, sudden cabin door openings, or temporary sun-shielding variations). While gradient-boosted trees (such as XGBoost) excel at capturing micro-level variance, they are highly prone to overfitting these transient, operator-driven noise spikes in thermodynamic datasets, resulting in degraded out-of-sample generalization.
To mitigate this, a highly regularized Random Forest model (configured with max_depth = 5 and min_samples_leaf = 100) was selected. This structural restriction forces the regressor to execute global smoothing across the thermodynamic space. By ignoring localized, transient micro-spikes and prioritizing the macro-level Newtonian thermal decay trend ($\tau$), the model achieves high stability on entirely unseen trip profiles, which is essential for consistent real-time range estimation.
3. Results
3.1. Exploratory Data Analysis and Physical Phenomenon Mapping
Prior to evaluating the predictive capabilities of the decoupled machine learning architectures, exploratory data analysis was executed to validate the physical and thermodynamic consistency of the underlying empirical database.
Figure 3 presents the non-linear relationship between the instantaneous climate control power draw (PHVAC) and the ambient temperature spectrum, divided into seven stratified quantile intervals. The empirical distribution exhibits a classic parabolic U-shape characteristic of automotive thermal loads:
- Within the lowest sub-zero and near-freezing thermal bin (−0.001, 3.5] °C, the auxiliary load reaches its absolute maximum, with the median power stabilizing near 1.6 kW and upper whiskers extending beyond 4.0 kW. This represents the intense activation of high-voltage positive temperature coefficient (PTC) cabin heaters.
- As the ambient temperature rises into the transitional comfort envelope (15.0, 21.0] °C, the median power drops significantly to its baseline minimum (less than 0.2 kW, as the system operates purely in passive ventilation modes.
- Upon crossing the upper thermal threshold into the (24.5, 33.5] °C bin, a clear secondary surge is observed, with median values rising toward 0.6 kW and upper boundaries reaching 3.3 kW. This trend captures the electromechanical workload of the air conditioning compressor working to counteract solar radiation.
The microscopic mechanical behavioral profile of the powertrain is visualized in Figure 4, which maps the instantaneous tractive power output (Ptraction) against the electromechanical motor torque spectrum across a range from −100 Nm to +250 Nm. The scatter matrix reveals a physical constraint: a dense, linear bounding envelope extending diagonally upward from the origin. Because instantaneous power is a function of torque and rotational velocity (P = T ∗ ω), this defined diagonal band represents steady-state highway cruising segments where the angular velocity of the rear axle remains uniform.
The data points are color-coded by the dynamically calculated road slope gradient percentage. Positive topographic gradients (extending up to +8%) are clustered in the upper right quadrant (+40 kW to +80 kW), providing empirical data on the gravitational load components imposed during uphill segments. Conversely, negative slope gradients (descending to −6%) dominate the lower-left quadrant, capturing the mechanical boundaries of regenerative braking where the motor acts as a generator, returning up to −20 kW back into the battery pack.
To evaluate the requirement for context-aware thermal management, Figure 5 illustrates the spatial micro-climatic non-homogeneity inside the passenger compartment across three monitored zones: the Defrost Outlets (Windshield), the Footwell Zone (Driver), and the Core Cabin Feedback Sensor. The boxplot distributions show localized temperature gradients. The defrost outlets exhibit an elevated thermal profile, with a median temperature near 35 °C and peak values extending to 45 °C, capturing the direct energy output of the HVAC heating core focused on windshield clearing. Simultaneously, the driver footwell zone stabilizes at a lower median of 21 °C, while the core cabin feedback sensor maintains an equilibrium between 23 °C and 26 °C. This spatial divergence indicates that treating vehicle cabins as single-node lumped thermal capacities does not account for localized variations, supporting the utility of data-driven architectures to learn these non-linearities.
3.2. Quantitative Benchmarking and Predictive Performance Analysis
Following the exploratory mapping, the decoupled predictive engines were trained and subjected to the 5-Fold GroupKFold validation protocol. The performance summary across competing algorithms is consolidated in Table 2.
The quantitative evaluation indicates the performance limitations of the baseline Ordinary Least Squares (OLS) Linear Regression, which achieved a traction R2 of 0.6663 and an HVAC R2 of 0.1442. The tree-based ensemble architectures demonstrated higher predictive capabilities.
For the powertrain tracking loop, the proposed HistGradientBoosting machine established an out-of-sample coefficient of determination (R2 = 0.9869) with a Mean Absolute Error (MAE = 0.71 kW). This accuracy is associated with the introduction of the physical $VSP$ variable, which simplifies the learning space by pre-aggregating aerodynamic drag scaling and gravitational vectors.
For the auxiliary thermal core, the Random Forest regressor achieved the highest numerical fit (R2 = 0.8656, MAE = 0.25 kW). However, the HistGradientBoosting core performed similarly (R2 = 0.8545, MAE = 0.30 kW) with a cross-validation variance (±0.0120). This algorithmic stability across independent trips indicates the mitigation of data leakage via the GroupKFold partition.
To evaluate the predictive boundaries of the thermal core under thermodynamic extremes, a localized residual analysis was executed for sub-zero and high-temperature cohorts within the out-of-sample testing partitions.
Under extreme winter conditions where the ambient temperature dropped below −5.0 °C (triggering maximum PTC heating demand), the localized Mean Absolute Error of the regularized Random Forest core experienced a marginal increase to MAE = 0.48 kW (with R2 = 0.8112). This variation is physically associated with the stochastic nature of the initial cabin heating transient and rapid operator blower modifications. Under high-temperature summer conditions exceeding 30.0 °C (characterized by steady-state AC compressor workloads), the model demonstrated high stability, securing a localized MAE of 0.34 kW (R2 = 0.8398).
The low error degradation observed at these thermodynamic boundaries confirms that integrating the physical Newtonian thermal decay indicator (τ) successfully stabilizes the machine learning engine against extreme domain shifts.
The fit of the optimized HistGradientBoosting powertrain core is demonstrated in Figure 6. The hexbin density plot maps out-of-sample predictions directly against empirical CAN-bus observations. The data array is aligned along the 45-degree identity line across all operational states, spanning from regenerative deceleration phases (−50 kW) up to peak acceleration demands (+125 kW). The high point-density concentration occurs between 0 kW and 25 kW, corresponding to routine urban and suburban driving segments. The distribution under out-of-sample testing confirms the generalization capability of the powertrain core.
To perform a strict diagnostic verification of the powertrain core, Figure 7 presents a joint distribution grid evaluating prediction residuals (Pactual − Ppredicted) across the continuous velocity spectrum up to 150 km/h. The residual hexbin plot shows that the error envelope remains symmetrically balanced around the zero-error baseline axis across all speed ranges.
The marginal histogram on the right axis reveals a clean Gaussian distribution centered precisely at zero error. The prominent density pike visible at 0 km/h represents vehicle standstill intervals during urban idling phases; the model tracks these stationary segments with minimal residual drift, preventing the accumulation of mathematical offset during extended city operations.
3.3. Game-Theoretic Interpretability via SHAP Analysis
To address the uninterpretable nature of ensemble machine learning architectures, game-theoretic SHAP (SHapley Additive exPlanations) values were calculated to evaluate feature attribution and directional sensitivity.
As shown by the SHAP analysis in Figure 8, Motor Torque and the engineered Vehicle Specific Power (VSP) exercise the highest feature attribution over powertrain decisions. The directional alignment of the feature value color spectrum is consistent with physical principles:
- High torque and large positive VSP metrics (rendered in deep red) correspond to substantial positive SHAP values, shifting the instantaneous prediction upward by +30 kW to +60 kW. This captures high-load acceleration and steep hill-climbing states.
- Conversely, negative torque and low VSP metrics (rendered in deep blue) generate powerful negative SHAP attributions extending down to −25 kW. This indicates that the gradient boosting architecture has mapped the physical boundaries of the regenerative braking matrix.
Figure 9 presents the SHAP attributions for the physics-informed HVAC thermal core. Cabin Temperature and the engineered Newtonian Thermal Decay (τ) features emerge as the primary drivers of auxiliary consumption. High internal cabin temperatures (represented by red markers) signal that the requested micro-climatic comfort threshold has been satisfied, triggering negative SHAP values that scale down the auxiliary power demand.
The engineered thermal decay indicator (τ) exhibits a consistent directional impact: high values of τ (deep red markers, capturing the initial 10-to-15 min transient phase of a new trip) generate positive SHAP attributions, increasing the climate control prediction by up to +2.5. This indicates that the model captures the initial energy transient required to overcome cabin thermal inertia. As τ exponentially decays toward zero during steady-state thermal equilibrium (blue markers), its attribution neutralizes along the zero SHAP axis, providing verification of thermodynamic alignment.
3.4. Macroscopic Fleet Simulation and HMI Pareto Frontier Deployment
To evaluate the practical energy conservation potential of this architecture, a macroscopic energy simulation was executed across the empirical fleet dataset. Figure 10 details the energy disaggregation profiles for the top 25 longest valid trips within the database. The baseline HVAC climatic load (rendered in orange) represents an energy penalty, consuming a portion of the total battery energy throughput.
By applying the proposed optimization loop—under a scenario assuming a 30% reduction in auxiliary climate control draw via localized comfort concessions—a recoverable energy margin is identified (rendered in green). Scaling this software-driven load-shedding strategy across the 55-trip empirical fleet ecosystem yields a mean global net energy savings of 5.21% (with a standard deviation SD = ±1.14%). To quantify the statistical reliability of this energy recovery dividend, $95% confidence interval (CI) was calculated across the evaluation trips, establishing a robust efficiency gain envelope of [4.91%, 5.51%].
This represents an efficiency improvement achieved through software optimization, without requiring modifications to the vehicle’s physical hardware.
The operationalization of this framework is integrated within the context-aware HMI advisory panel, visualized in Figure 11 for a representative real-world trip profile. Operating at a mean route speed of 68.9 km/h under an ambient temperature of 23.3 °C and an average cabin temperature of 24.9 °C with a 52.0 kWh battery specification, the system maps a continuous multi-objective Pareto trade-off.
The primary left Y-axis displays the Empirical Range Extension (km) as a solid teal curve, showing a monotonic expansion that reaches a maximum gain of +30.0 km when the HVAC power suppression level is pushed to its maximum 80% boundary. Simultaneously, the secondary right Y-axis maps the Thermal Discomfort Penalty Value as a dashed crimson curve, which rises quadratically as auxiliary climate power is suppressed. The vertical purple dotted line defines the Balanced Advisory Threshold Limit, settled at an 80% power suppression ratio.
From a cyber-physical perspective, this suppression percentage is translated into actionable driver heuristics. Under the thermal boundary conditions of Trip #10 (where the ambient-to-cabin gradient ΔT is 1.6 °C), an active cooling process is reduced. Therefore, the HMI advisory engine calculates that an 80% reduction in HVAC power draw can be achieved by executing comfort-concession actions. Specifically, this corresponds to shifting the cabin target temperature setpoint upward by approximately 1.5 °C to 2.0 °C (allowing it to dynamically align with the outdoor ambient thermal state) and adjusting the ventilation blower speed to its baseline setting.
Because the ambient environment is close to the comfort threshold, this 80% energy suppression incurs a lower localized thermal discomfort penalty of 0.5 points, as indicated by the crimson curve. Consequently, the context-aware HMI identifies this scenario as a suitable trade-off configuration: the system prompts the operator to execute a minor comfort adjustment, reclaiming a +30.0 km range margin with low impact on passenger comfort.
Conversely, under winter scenarios (e.g., sub-zero ambient profiles), the quadratic discomfort penalty curve exhibits a steeper slope. In such cases, the Balanced Advisory Threshold Limit automatically shifts leftward (restricting the maximum permissible suppression to 10% or 15% to prevent cabin freezing or windshield fogging), demonstrating the context-dependent adaptability of the proposed HMI framework.
4. Discussion
The energy consumption predictions and multi-objective optimization results obtained from the proposed decoupled framework can be contextualized by comparison with existing approaches in electric vehicle (EV) energy estimation and optimization literature. Existing methodologies typically focus on high-dimensional statistical modeling, pre-trip mathematical optimization, or physical vehicle modifications, each exhibiting specific operational trade-offs.
A prominent direction in EV energy modeling involves expanding the input space to capture a broad envelope of environmental and electromechanical variables. For instance, Abro et al. [34] developed a modular black-box framework integrating twenty-three parameters across eight functional categories to estimate energy demand. While their systematic classification of parameters is comprehensive, their validation was limited to controlled simulation environments without out-of-sample verification on empirical driving profiles. Furthermore, their framework functions as a passive evaluation tool rather than an active driver-decision support mechanism, offering no real-time counterfactual guidance to the operator at runtime. The proposed framework addresses these limitations. By decoupling the traction and thermal subsystems and applying a 5-Fold GroupKFold validation protocol, data leakage is mitigated, and the resulting out-of-sample predictions ( = 0.9869, = 0.8545) directly feed a dynamic HMI optimization loop.
From an optimization perspective, the use of a Pareto frontier to resolve range and comfort trade-offs builds upon the multi-objective trip planning concepts introduced by Vaz et al. [35]. Vaz et al. utilized genetic algorithms (NSGA-II) to locate optimal driving speeds that balance energy consumption and trip duration. However, their mathematical formulations were restricted to constant-speed highway profiles, which do not account for transient urban stop-and-go acceleration patterns. Additionally, their optimization omitted auxiliary climatic loads, which represent a primary source of range degradation. The proposed framework extends this boundary by utilizing physical VSP to map transient road slope and acceleration profiles, while concurrently embedding Newtonian thermal decay (τ) to track transient cabin heating and cooling demands. Consequently, the HMI advisory loop resolves a coupled mechanical-thermodynamic optimization problem in real time.
In contrast to software-driven efficiency improvements, other studies advocate for hardware-centric modifications to extend EV range. Ferrier and Appiah-Kubi [36] performed empirical evaluations demonstrating that physical mass reduction (e.g., alloy wheel replacements and lightweight seats) combined with external battery pre-conditioning using hot air can expand usable battery capacity and extend range. Although physical alterations yield measurable efficiency gains, they require structural modifications and capital costs that are difficult to scale across commercial vehicle fleets. The context-aware architecture proposed in this study achieves a comparable or superior energy recovery dividend (e.g., up to +30.0 km on a single trip segment) entirely through software-driven comfort concessions, requiring no additional hardware investments or mechanical modifications.
The practical utility of this framework extends to municipal transport management and macroscopic energy policy. Infrastructure planning for public charging networks is heavily affected by the collective range anxiety profiles of urban drivers. As demonstrated by Mashhoodi and van der Blij [37] through spatial optimization modeling, when EV operators exhibit high range anxiety—such as premature charging when batteries are only 30% depleted—the municipal infrastructure investment required for grid reinforcement and cabling escalates by 167%. Conversely, providing drivers with trustworthy, objective ICT systems to accurately estimate usable range allows them to safely utilize up to 90% of battery capacity, reducing the required density and cost of public charging infrastructure. The context-aware HMI advisory system developed in this study serves as a functional realization of the ICT solutions proposed in macro-policy literature. By integrating physics-informed metrics (VSP, τ) within the machine learning pipeline, the driver dashboard provides a transparent, verifiable range estimation. Rather than displaying a static, unadjusted range value, the HMI calculates a dynamic Pareto trade-off during energy-critical events, demonstrating exactly how specific comfort concessions (e.g., adjusting temperature targets by 1.5 °C to 2.0 °C) translate into precise range extensions.
At a fleet scale, numerical simulations indicate that the voluntary implementation of this software-only advisory loop reduces cumulative fleet grid-charging demand by 5.21%. This reduction supports regional environmental and energy policy by lowering peak electricity demand on distribution networks during typical overnight residential charging periods (e.g., 8 PM to 6 AM). By buffering individual vehicle range requirements, this software-only framework mitigates indirect Well-to-Wheel carbon dioxide emissions and supports municipal grid stability without requiring hardware modifications to the existing vehicle fleet.
Furthermore, the proposed context-aware HMI optimization concept can be extended to plug-in hybrid electric vehicles (PHEVs); this adaptation is highly relevant as PHEVs frequently operate in charge-depleted modes [38,39] under real-world conditions and demonstrate a significant gap between certified and empirical CO2 emissions [40,41].
Despite its predictive accuracy and optimization performance, several limitations of the proposed framework must be acknowledged:
- Passive HMI Advisory vs. Active Control: The system currently relies on passive, voluntary driver intervention to execute comfort-concession recommendations. It does not actively control the vehicle’s HVAC actuators or powertrain torque limits.
- Lack of Look-Ahead Preview: The current optimization model operates on instantaneous and historical trip states. It does not integrate look-ahead GPS terrain data, traffic microsimulation, or real-time meteorological forecasts to anticipate topographic or environmental changes before they occur.
- Battery Degradation and Passenger Occupancy: The thermal core does not monitor electrochemical cell degradation (State of Health—SOH) or the localized presence of multiple passengers, which restricts the customization of asymmetric cabin comfort zones.
Future research will focus on addressing these limitations by integrating predictive horizontal control algorithms with active route preview data, incorporating battery aging parameters into the range estimation loop, and testing the HMI advisory interface with human-in-the-loop driving simulators to evaluate driver compliance rates.
5. Conclusions
This paper presented a cyber-physical Human-Machine Interface (HMI) advisory framework driven by a decoupled hybrid physics-informed machine learning core. By separating powertrain dynamics from cabin thermodynamics, the proposed architecture addresses the interpretability and data leakage limitations of existing black-box models. Validated via a 5-Fold GroupKFold cross-validation protocol on an empirical 55-trip dataset, the powertrain tracking loop—integrated with a physical Vehicle Specific Power (VSP) indicator and a HistGradientBoosting regressor—achieved an out-of-sample R2 of 0.9869 (MAE = 0.71 kW). Concurrently, the regularized thermal core—enriched with a Newtonian thermal decay function (τ)—reached an R2 of 0.8545 (MAE = 0.30 kW). Game-theoretic SHAP analysis verified the physical and thermodynamic consistency of both models, confirming accurate mapping of regenerative braking boundaries and transient cabin startup thermal loads.
The integration of a multi-objective Pareto optimization loop within the HMI dashboard demonstrates that dynamic trade-offs can manage critical energy margins. Under energy-critical contexts, the advisory engine translates power constraints into actionable driver adjustments, such as shifting the target cabin temperature by 1.5 °C to 2.0 °C. For the analyzed route, this concession unlocked up to +30.0 km of range extension with a low thermal discomfort penalty. When scaled across the multi-trip fleet ecosystem, this software-only approach yielded a 5.21% net reduction in total battery energy demand, offering a cost-effective solution for smart city de-carbonization and peak grid load mitigation.
Limitations of the current framework include its reliance on voluntary driver compliance and the lack of look-ahead preview capabilities. Future research will focus on integrating predictive horizontal control with active GPS terrain and traffic data, incorporating battery State of Health (SOH) degradation parameters, and utilizing passenger occupancy sensors to support asymmetric cabin comfort zones. Ultimately, the deployment of physics-informed HMI advisory networks represents a scalable, hardware-free approach to reducing range anxiety and enhancing EV efficiency.
Author Contributions
Conceptualization, M.M.; Methodology, M.M.; Software, M.M.; Validation, M.M. and T.C.; Formal analysis, T.C.; Investigation, M.M.; Resources, M.M.; Data curation, M.M. and T.C.; Writing—original draft, M.M. and T.C.; Writing—review & editing, M.M. and T.C.; Visualization, M.M.; Supervision, M.M. and T.C.; Project administration, M.M. All authors have read and agreed to the published version of the manuscript.
Funding
This research did not receive external funding.
Data Availability Statement
The original contributions presented in this study are included in the article. Further inquiries can be directed to the corresponding author.
Conflicts of Interest
The authors declare no conflicts of interest.
Abbreviations
The following abbreviations are used in this manuscript:
| BEV | Battery Electric Vehicle |
| CAN | Controller Area Network |
| CO2 | Carbon Dioxide |
| HMI | Human-Machine Interface |
| HVAC | Heating, Ventilation, and Air Conditioning |
| ICT | Information and Communication Technologies |
| IEA | International Energy Agency |
| MAE | Mean Absolute Error |
| ML | Machine Learning |
| OLS | Ordinary Least Squares |
| PT | Positive Temperature Coefficient |
| R2 | Coefficient of Determination |
| RF | Random Forest |
| SHAP | SHapley Additive exPlanations |
| SoC | State of Charge |
| SOH | State of Health |
| SUV | Sport Utility Vehicle |
| VSP | Vehicle Specific Power |
| XAI | Explainable Artificial Intelligence |
| XGBoost | Extreme Gradient Boosting |
References
- De Kleijne, K.; Huijbregts, M.A.; Knobloch, F.; van Zelm, R.; Hilbers, J.P.; de Coninck, H.; Hanssen, S.V. Worldwide greenhouse gas emissions of green hydrogen production and transport. Nat. Energy 2024, 9, 1139–1152. [Google Scholar] [CrossRef]
- Mbandi, A.M.; Malley, C.S.; Schwela, D.; Vallack, H.; Emberson, L.; Ashmore, M.R. Assessment of the impact of road transport policies on air pollution and greenhouse gas emissions in Kenya. Energy Strategy Rev. 2023, 49, 101120. [Google Scholar] [CrossRef]
- Aggarwal, S.; Singh, A.K. Electric vehicles the future of transportation sector: A review. Energy Sources Part A Recovery Util. Environ. Eff. 2025, 47, 11126–11146. [Google Scholar]
- Lu, Y.; Li, Y.; Peng, T.; Chen, W.; Pan, X. EV-driven decarbonization of China’s road transport: Linking historical drivers and future trends. Energy 2026, 348, 140489. [Google Scholar] [CrossRef]
- Tripathy, S.; Fahnbulleh, E.B.; Ghatak, S.R.; Lopes, F.; Acharjee, P. Uncertainty-Aware Planning of EV Charging Infrastructure and Renewable Integration in Distribution Networks: A Review. Energies 2026, 19, 1131. [Google Scholar] [CrossRef]
- Monteagudo, R.; Castronuovo, E.D.; Barber, R. EV Infrastructure Expansion in Non-Greenfield Contexts: An Incremental Hybrid Algorithm Based on GA and Weighted K-Means. Sustainability 2026, 18, 4623. [Google Scholar] [CrossRef]
- Thorhauge, M.; Rich, J.; Mabit, S.E. Charging behaviour and range anxiety in long-distance EV travel: An adaptive choice design study. Transportation 2024, 53, 2197–2219. [Google Scholar] [CrossRef]
- Zatsarnaja, J.; Reiter, K.; Mehdizadeh, M.; Nayum, A.; Nordfjærn, T. Charged up with peace in mind: Unraveling the factors of range anxiety among norwegian electric vehicle drivers. Transp. Res. Part F. Traffic Psychol. Behav. 2025, 110, 15–28. [Google Scholar] [CrossRef]
- Jing, H.; Hu, J.; Ou, S.S.; Qian, X.; Qi, H.; Zhu, J.; Dong, H. A data-driven and physics-based model for assessing real-world usage behavior impacts on electric vehicle battery life. J. Energy Storage 2026, 144, 119680. [Google Scholar] [CrossRef]
- Martini, D.; Miraftabzadeh, S.M.; Matera, N.; Longo, M.; Leva, S. Evaluation of electric vehicle consumption models based on real-world driving data. Int. J. Electr. Power Energy Syst. 2025, 172, 111116. [Google Scholar] [CrossRef]
- Izquierdo-Monge, O.; Bonilla, A.Z.V.; Lafuente-Cacho, M.; Pena-Carro, P.; Hernandez-Jimenez, A. Performance and energy consumption of electric vehicles used in microgrid management: Analysis of the real impact of ambient temperature. J. Power Sources 2025, 635, 236511. [Google Scholar] [CrossRef]
- Diouf, B. Artificial intelligence in the analysis of energy consumption of electric vehicles. Energies 2025, 18, 6338. [Google Scholar] [CrossRef]
- Mądziel, M.; Campisi, T. Predicting Auxiliary Energy Demand in Electric Vehicles Using Physics-Based and Machine Learning Models. Energies 2025, 18, 6092. [Google Scholar] [CrossRef]
- Kotb, R.; Chakraborty, S.; Tran, D.D.; Abramushkina, E.; El Baghdadi, M.; Hegazy, O. Power electronics converters for electric vehicle auxiliaries: State of the art and future trends. Energies 2023, 16, 1753. [Google Scholar] [CrossRef]
- Yang, D.; Huo, Y.; Zhang, Q.; Xie, J.; Yang, Z. Recent advances on air heating system of cabin for pure electric vehicles: A review. Heliyon 2022, 8, e11032. [Google Scholar] [CrossRef] [PubMed]
- Wang, Q.; Jiang, B.; Xue, Q.F.; Sun, H.L.; Li, B.; Zou, H.M.; Yan, Y.Y. Experimental investigation on EV battery cooling and heating by heat pipes. Appl. Therm. Eng. 2015, 88, 54–60. [Google Scholar] [CrossRef]
- Zhang, Z.; Wang, D.; Zhang, C.; Chen, J. Electric vehicle range extension strategies based on improved AC system in cold climate–A review. Int. J. Refrig. 2018, 88, 141–150. [Google Scholar] [CrossRef]
- Cardenas, A.; Guzman, C.; Martinez, W. Ev overnight charging strategy in residential sector: Case of winter season in quebec. Vehicles 2021, 3, 557–577. [Google Scholar] [CrossRef]
- Ramsey, D.; Boulon, L.; Bouscayrol, A. Modeling of an EV air conditioning system for energetic studies in summer. In 2021 IEEE Vehicle Power and Propulsion Conference (VPPC); IEEE: New York, NY, USA, October 2021; pp. 1–5. [Google Scholar]
- Zadeh, P.G.; Chung, J.D. Efficiency and performance evaluation of a novel EV Air-conditioning and battery cooling system with desiccant-coated heat pump. Appl. Therm. Eng. 2025, 264, 125429. [Google Scholar] [CrossRef]
- Jose, S.S.; Chidambaram, R.K. Electric vehicle air conditioning system and its optimization for extended range—a review. World Electr. Veh. J. 2022, 13, 204. [Google Scholar] [CrossRef]
- Kambly, K.; Bradley, T.H. Geographical and temporal differences in electric vehicle range due to cabin conditioning energy consumption. J. Power Sources 2015, 275, 468–475. [Google Scholar] [CrossRef]
- Chen, Y.; Wu, G.; Sun, R.; Dubey, A.; Laszka, A.; Pugliese, P. A review and outlook on energy consumption estimation models for electric vehicles. SAE Int. J. Sustain. Transp. Energy Environ. Policy 2021, 2(13-02-01-0005), 79–96. [Google Scholar] [CrossRef]
- Lis, M.; Mądziel, M. A Simulation-Based Decision-Support Framework for EV Charging Infrastructure Development Along a TEN-T Corridor. Appl. Sci. 2026, 16, 4902. [Google Scholar] [CrossRef]
- Di Martino, A.; Miraftabzadeh, S.M.; Longo, M. Strategies for the modelisation of electric vehicle energy consumption: A review. Energies 2022, 15, 8115. [Google Scholar] [CrossRef]
- Mądziel, M. Impact of Weather Conditions on Energy Consumption Modeling for Electric Vehicles. Energies 2025, 18, 1994. [Google Scholar] [CrossRef]
- Yao, S.; Bian, Z.; Hasan, M.K.; Ding, R.; Li, S.; Wang, Y.; Song, S. A bibliometric review on electric vehicle (EV) energy efficiency and emission effect research. Environ. Sci. Pollut. Res. 2023, 30, 95172–95196. [Google Scholar] [CrossRef]
- Naziris, A.; Frances, A.; Asensi, R.; Uceda, J. Black-box small-signal structure for single-phase and three-phase electric vehicle battery chargers. IEEE Access 2020, 8, 170496–170506. [Google Scholar] [CrossRef]
- Abro, M.A.J.; Larik, A.S.; Alqazzaz, A.; Halepoto, I.A.; Al Reshan, M.S.; Shaikh, A.; Alqhtani, S.M.; Lohana, J.K. A black box approach to EV energy consumption: Integrating key parameters for drive range optimization. IEEE Access 2025, 13, 134269–134282. [Google Scholar] [CrossRef]
- Sadeq, T.; Wai, C.K.; Morris, E.; Tarbosh, Q.A.; Aydoğdu, Ö. Optimal control strategy to maximize the performance of hybrid energy storage system for electric vehicle considering topography information. IEEE Access 2020, 8, 216994–217007. [Google Scholar] [CrossRef]
- Perger, T.; Auer, H. Energy efficient route planning for electric vehicles with special consideration of the topography and battery lifetime. Energy Effic. 2020, 13, 1705–1726. [Google Scholar] [CrossRef]
- Mądziel, M. State of Charge Prediction for Li-Ion Batteries in EVs for Traffic Microsimulation. Energies 2025, 18, 4992. [Google Scholar] [CrossRef]
- Yi, Z.; Smart, J.; Shirk, M. Energy impact evaluation for eco-routing and charging of autonomous electric vehicle fleet: Ambient temperature consideration. Transp. Res. Part C Emerg. Technol. 2018, 89, 344–363. [Google Scholar] [CrossRef]
- Abro, M.A.J.; Larik, A.S.; Alqazzaz, A.; Halepoto, I.A.; Al Reshan, M.S.; Shaikh, A.; Alqhtani, S.M.; Lohana, J.K. A black box approach to EV energy consumption: Integrating key parameters for drive range optimization. IEEE Access 2025, 13, 134269–134282. [Google Scholar] [CrossRef]
- Vaz, W.; Nandi, A.K.; Landers, R.G.; Koylu, U.O. Electric vehicle range prediction for constant speed trip using multi-objective optimization. J. Power Sources 2015, 275, 435–446. [Google Scholar] [CrossRef]
- Ferrier, D.; Appiah-Kubi, P. The Optimization of an Electric Vehicle (EV) for Improved Range. Am. J. Veh. Des. 2020, 6, 1–7. [Google Scholar]
- Mashhoodi, B.; van der Blij, N. Drivers’ range anxiety and cost of new EV chargers in Amsterdam: A scenario-based optimization approach. Ann. GIS 2021, 27, 87–98. [Google Scholar]
- Bishop, J.D.; Axon, C.J.; Bonilla, D.; Tran, M.; Banister, D.; McCulloch, M.D. Evaluating the impact of V2G services on the degradation of batteries in PHEV and EV. Appl. Energy 2013, 111, 206–218. [Google Scholar] [CrossRef]
- Wood, E.; Alexander, M.; Bradley, T.H. Investigation of battery end-of-life conditions for plug-in hybrid electric vehicles. J. Power Sources 2011, 196, 5147–5154. [Google Scholar] [CrossRef]
- Mądziel, M.; Kulasa, P.; Campisi, T. Determinants of Test-to-Reality CO2 Gaps in European PHEVs: The Limited Role of Battery Capacity. Vehicles 2026, 8, 60. [Google Scholar] [CrossRef]
- Mądziel, M.; Campisi, T. Real-World CO2 Emissions of Plug-In Hybrid Vehicles: European Assessment Using On-Board Fuel Consumption Monitoring Data. Energies 2026, 19, 1165. [Google Scholar] [CrossRef]
Figure 1.
Vehicle under test.
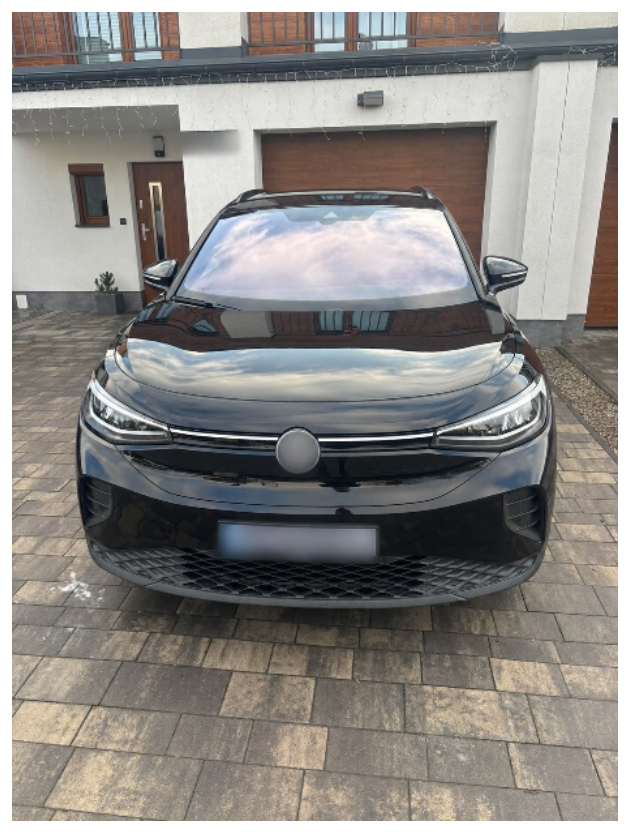
Figure 2.
A logical workflow diagram.
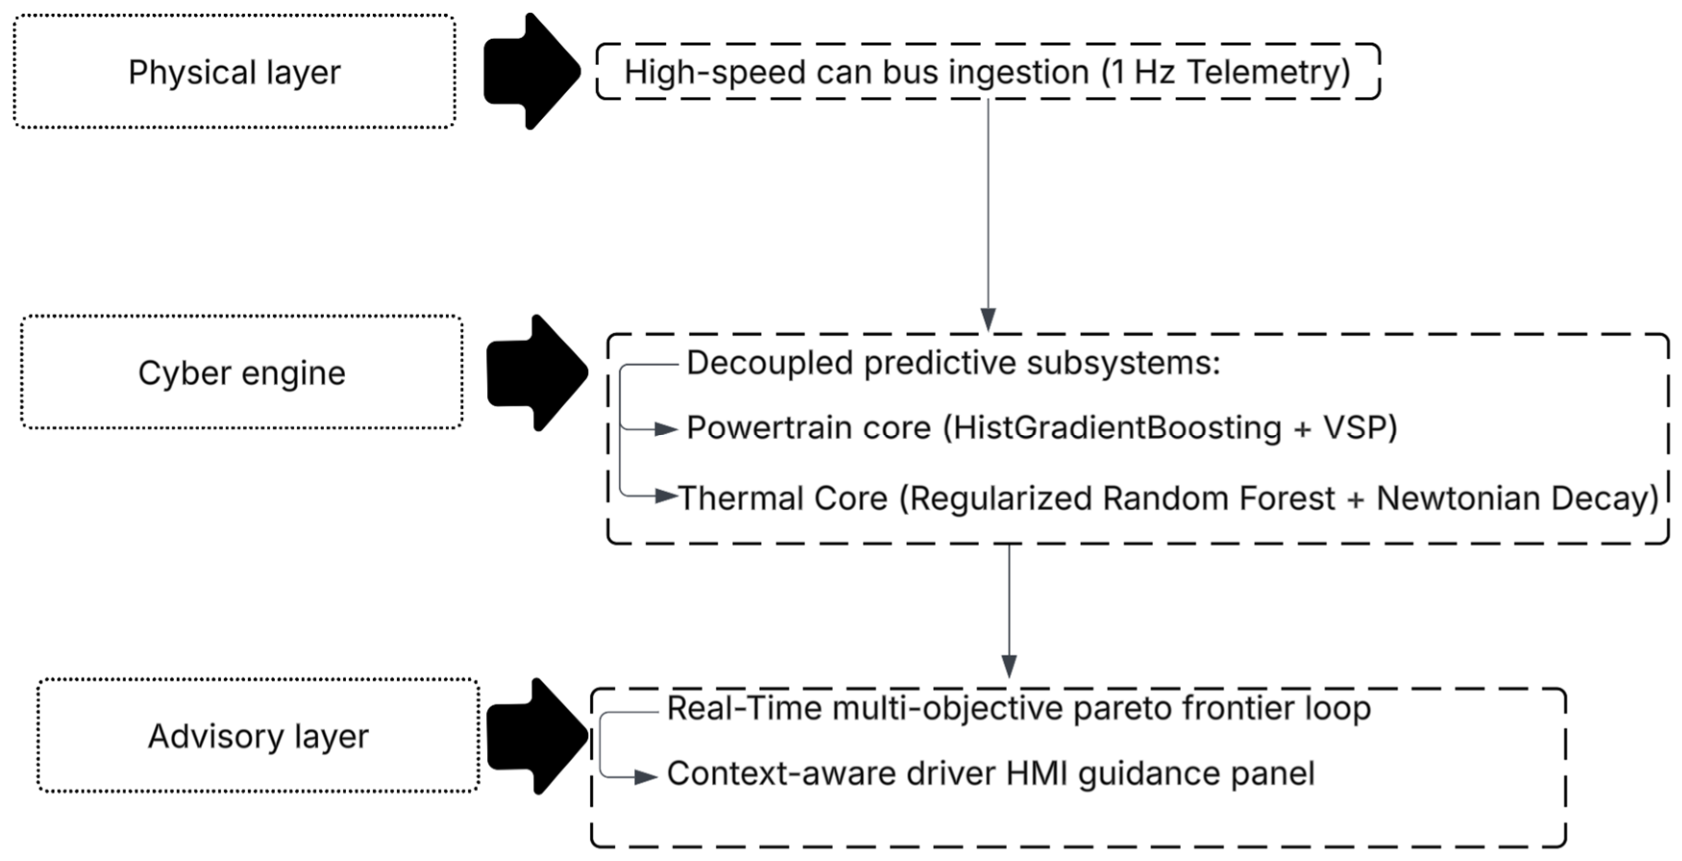
Figure 3.
Empirical auxiliary HVAC power consumption distribution across quantile-stratified ambient temperature intervals under real-world fleet testing.
Figure 3.
Empirical auxiliary HVAC power consumption distribution across quantile-stratified ambient temperature intervals under real-world fleet testing.
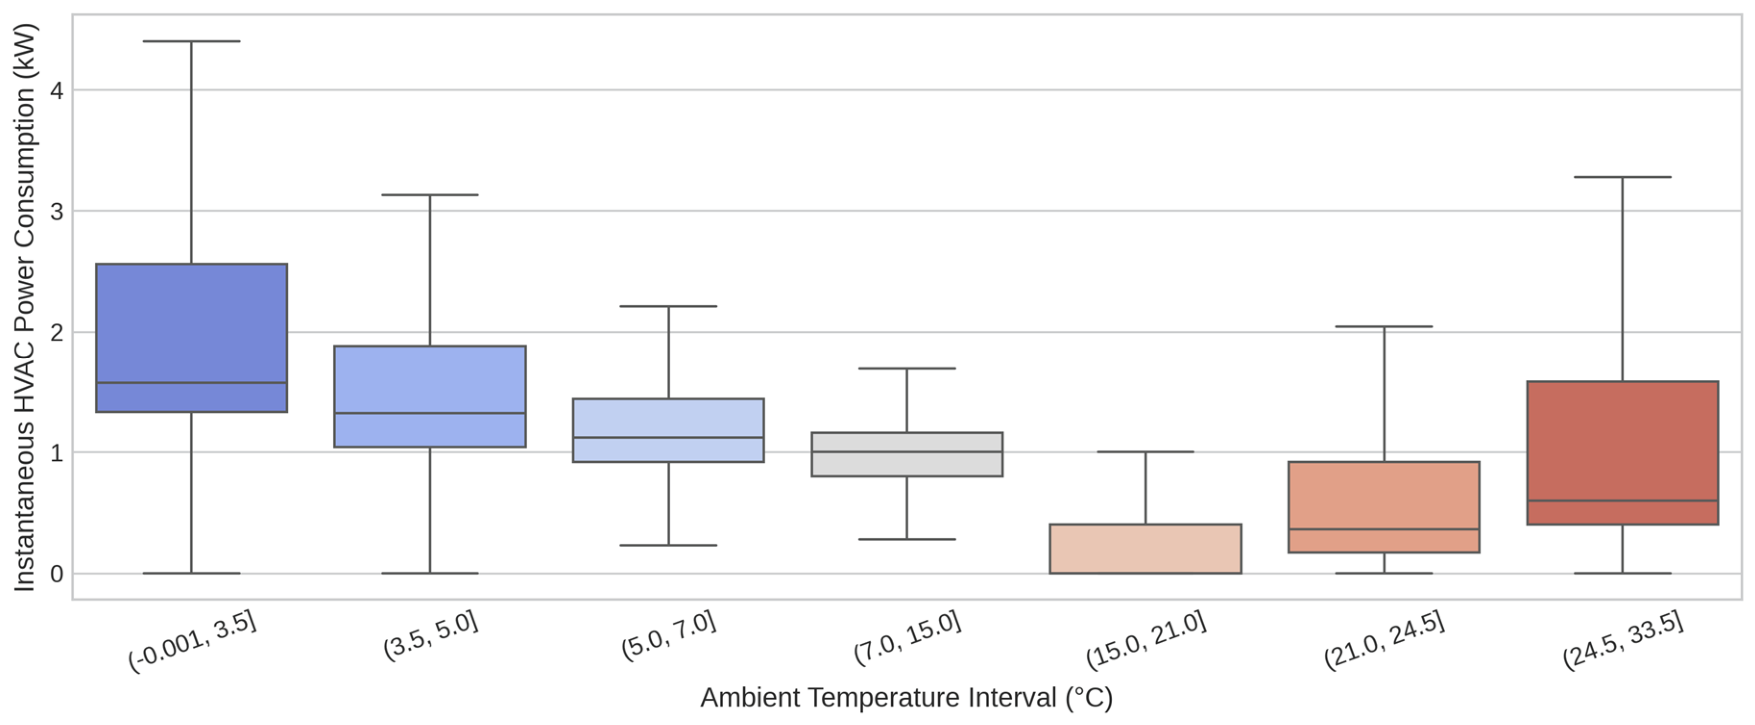
Figure 4.
Microscopic tractive power output vs. electromechanical motor torque across variable computed road slope gradients.
Figure 4.
Microscopic tractive power output vs. electromechanical motor torque across variable computed road slope gradients.
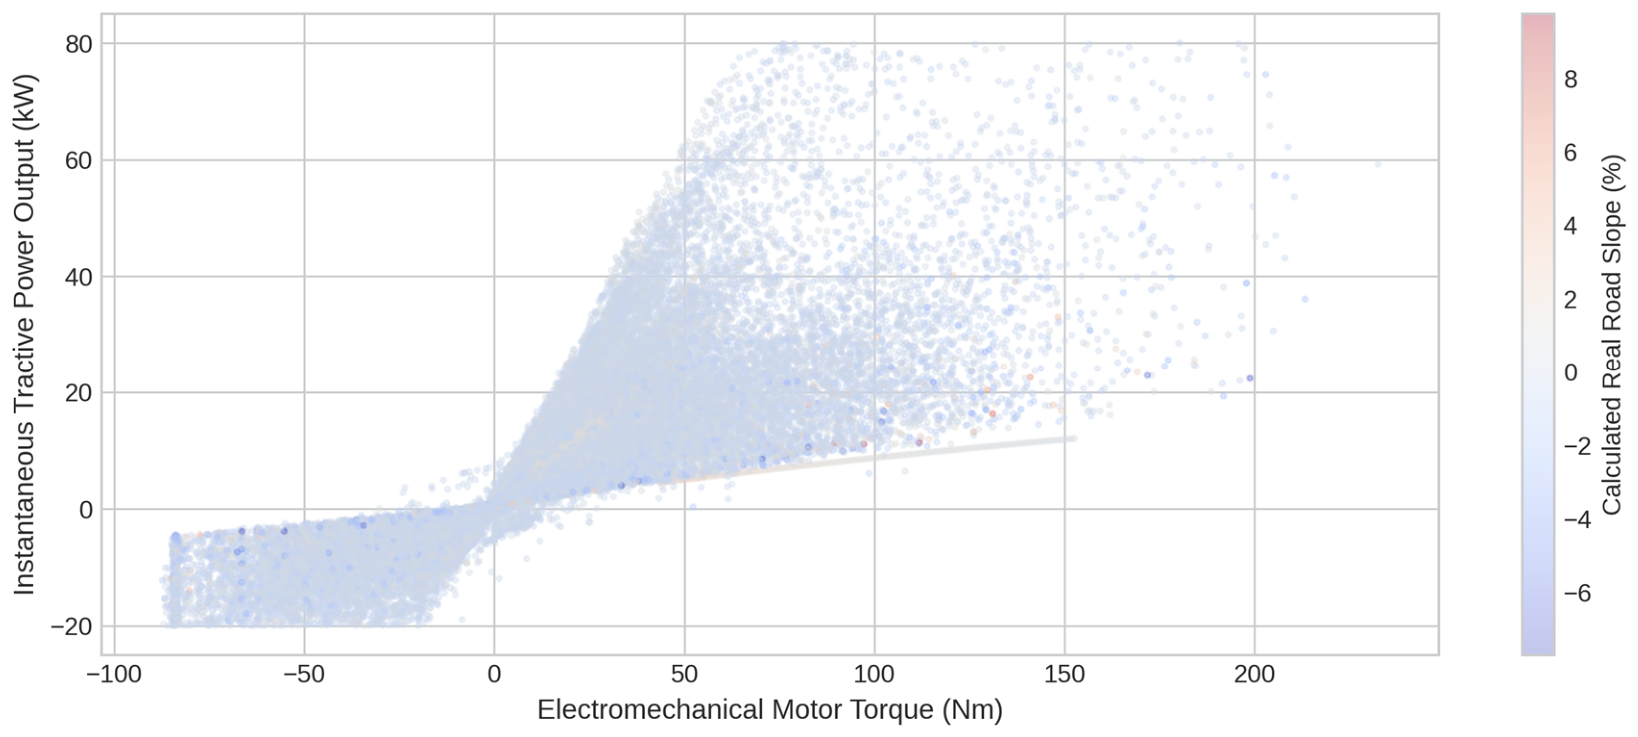
Figure 5.
Spatial micro-climatic temperature distribution across distinct monitored internal cabin zones.
Figure 5.
Spatial micro-climatic temperature distribution across distinct monitored internal cabin zones.
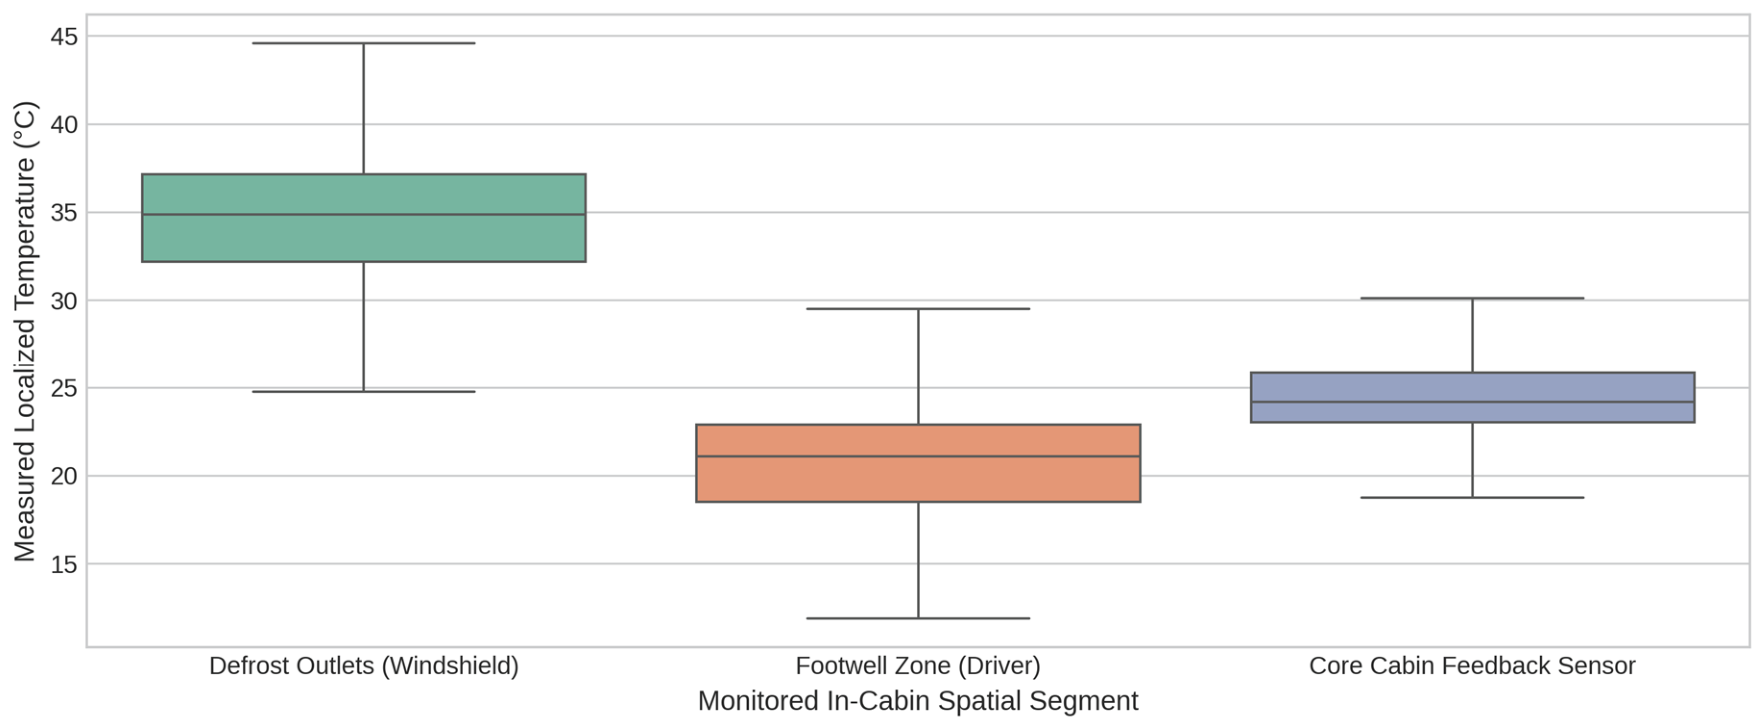
Figure 6.
Out-of-sample core powertrain hybrid model validation mapping predicted vs. actual traction power loads.
Figure 6.
Out-of-sample core powertrain hybrid model validation mapping predicted vs. actual traction power loads.
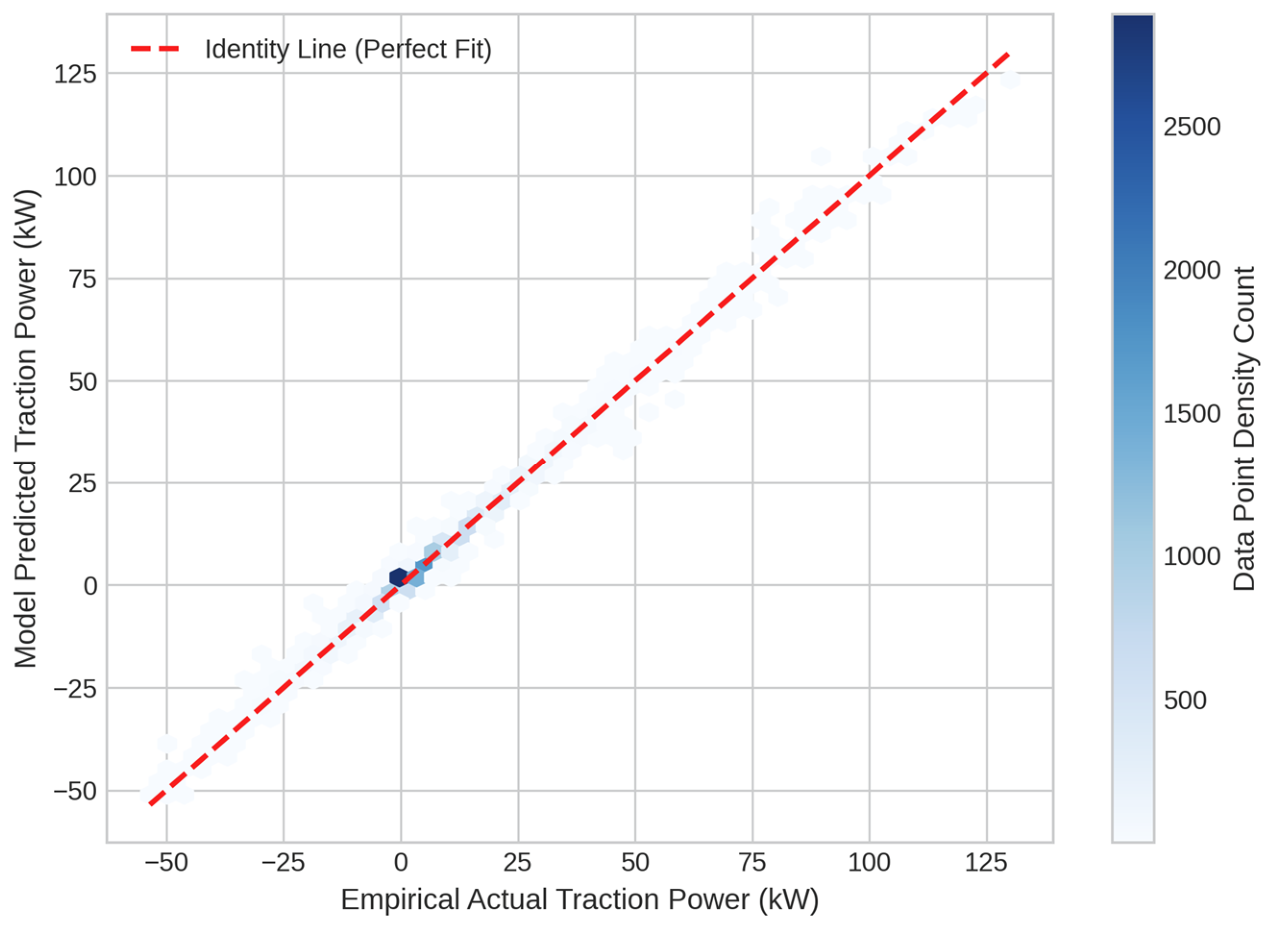
Figure 7.
Joint residual diagnostic error distribution across the continuous vehicle operational speed envelope.
Figure 7.
Joint residual diagnostic error distribution across the continuous vehicle operational speed envelope.
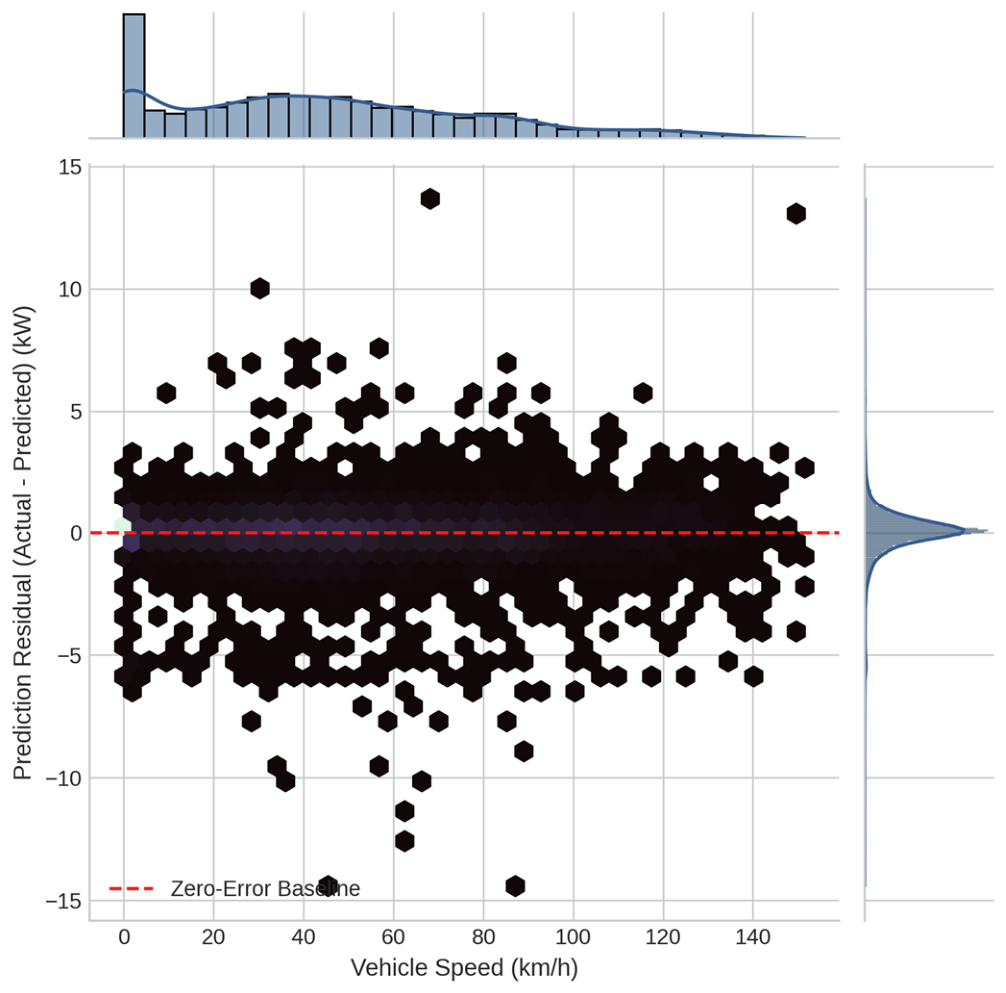
Figure 8.
Game-theoretic SHAP beeswarm summary plot decomposing feature attribution for the powertrain core model.
Figure 8.
Game-theoretic SHAP beeswarm summary plot decomposing feature attribution for the powertrain core model.
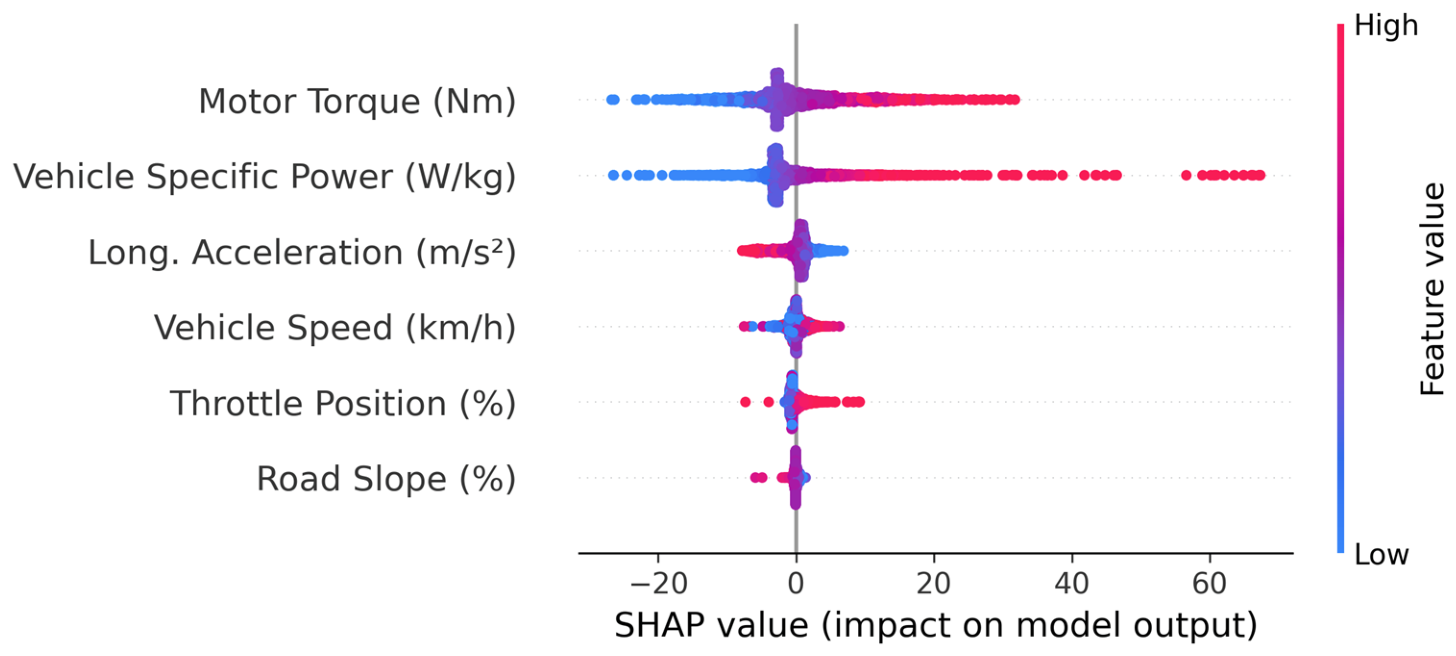
Figure 9.
Game-theoretic SHAP beeswarm summary plot decomposing feature attribution for the physics-informed HVAC thermal loop model.
Figure 9.
Game-theoretic SHAP beeswarm summary plot decomposing feature attribution for the physics-informed HVAC thermal loop model.
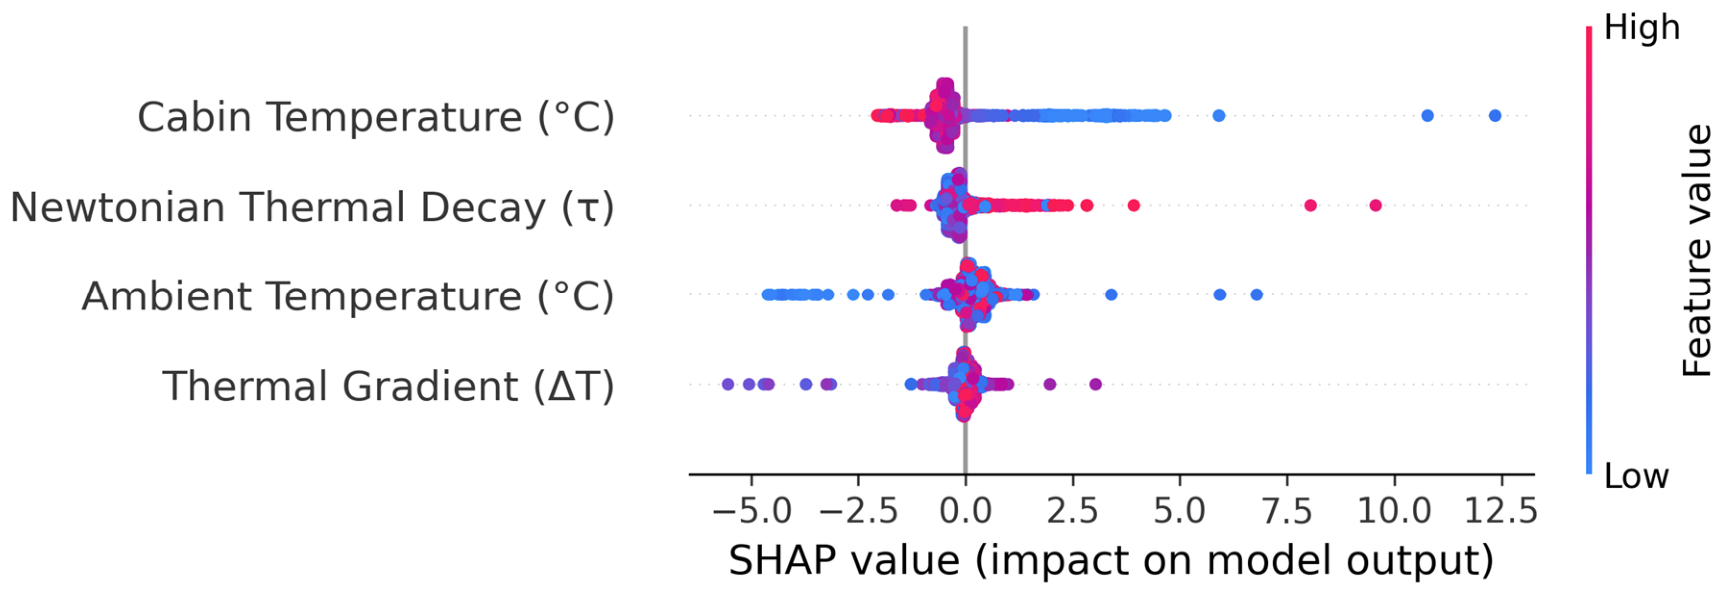
Figure 10.
Fleet-wide macroscopic energy disaggregation, baseline climatic loads, and recoverable consumption margins via context-aware optimization.
Figure 10.
Fleet-wide macroscopic energy disaggregation, baseline climatic loads, and recoverable consumption margins via context-aware optimization.
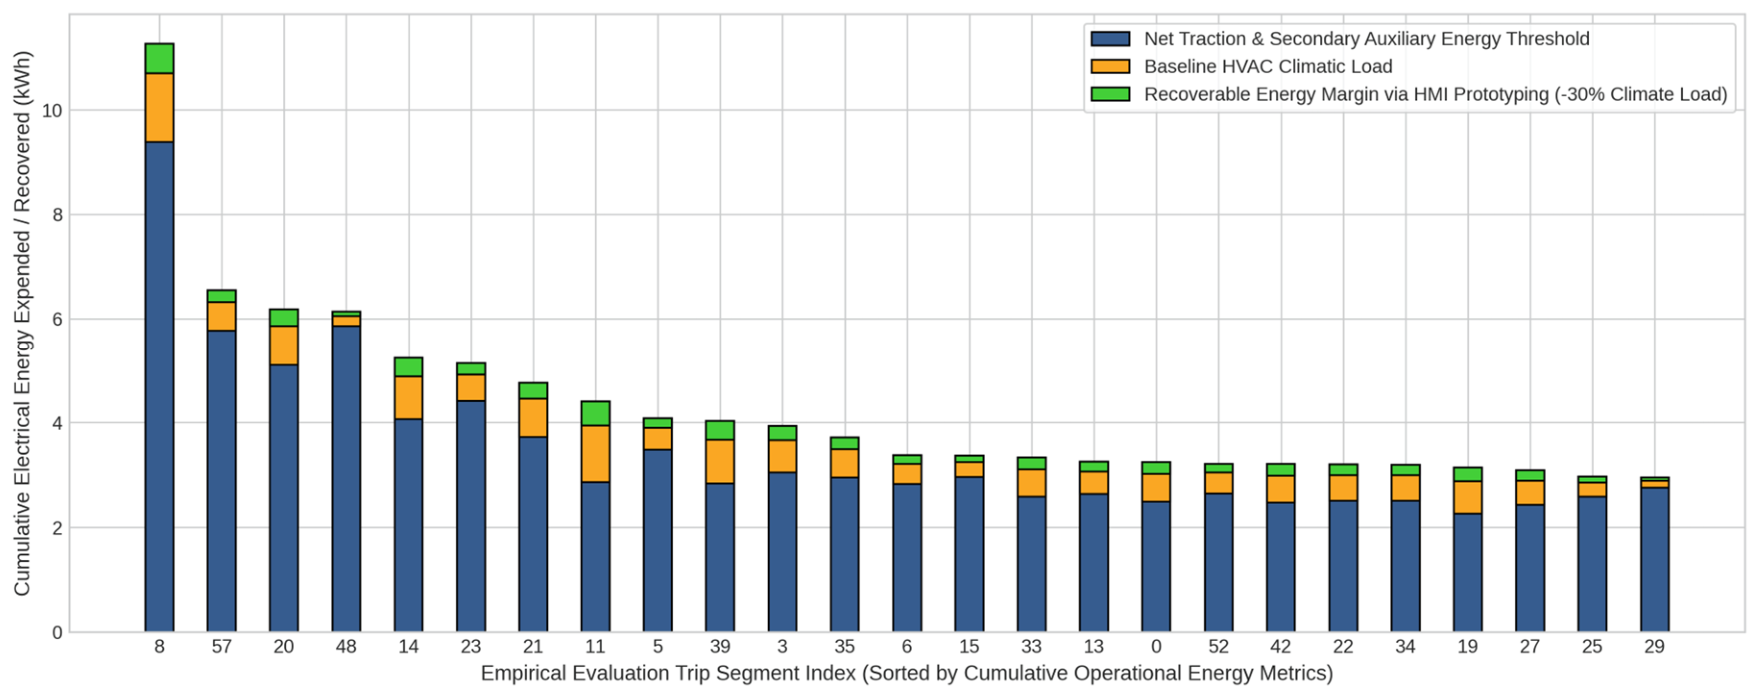
Figure 11.
Integrated real-time multi-objective Pareto frontier trade-off optimization grid displayed on the context-aware driver HMI panel.
Figure 11.
Integrated real-time multi-objective Pareto frontier trade-off optimization grid displayed on the context-aware driver HMI panel.
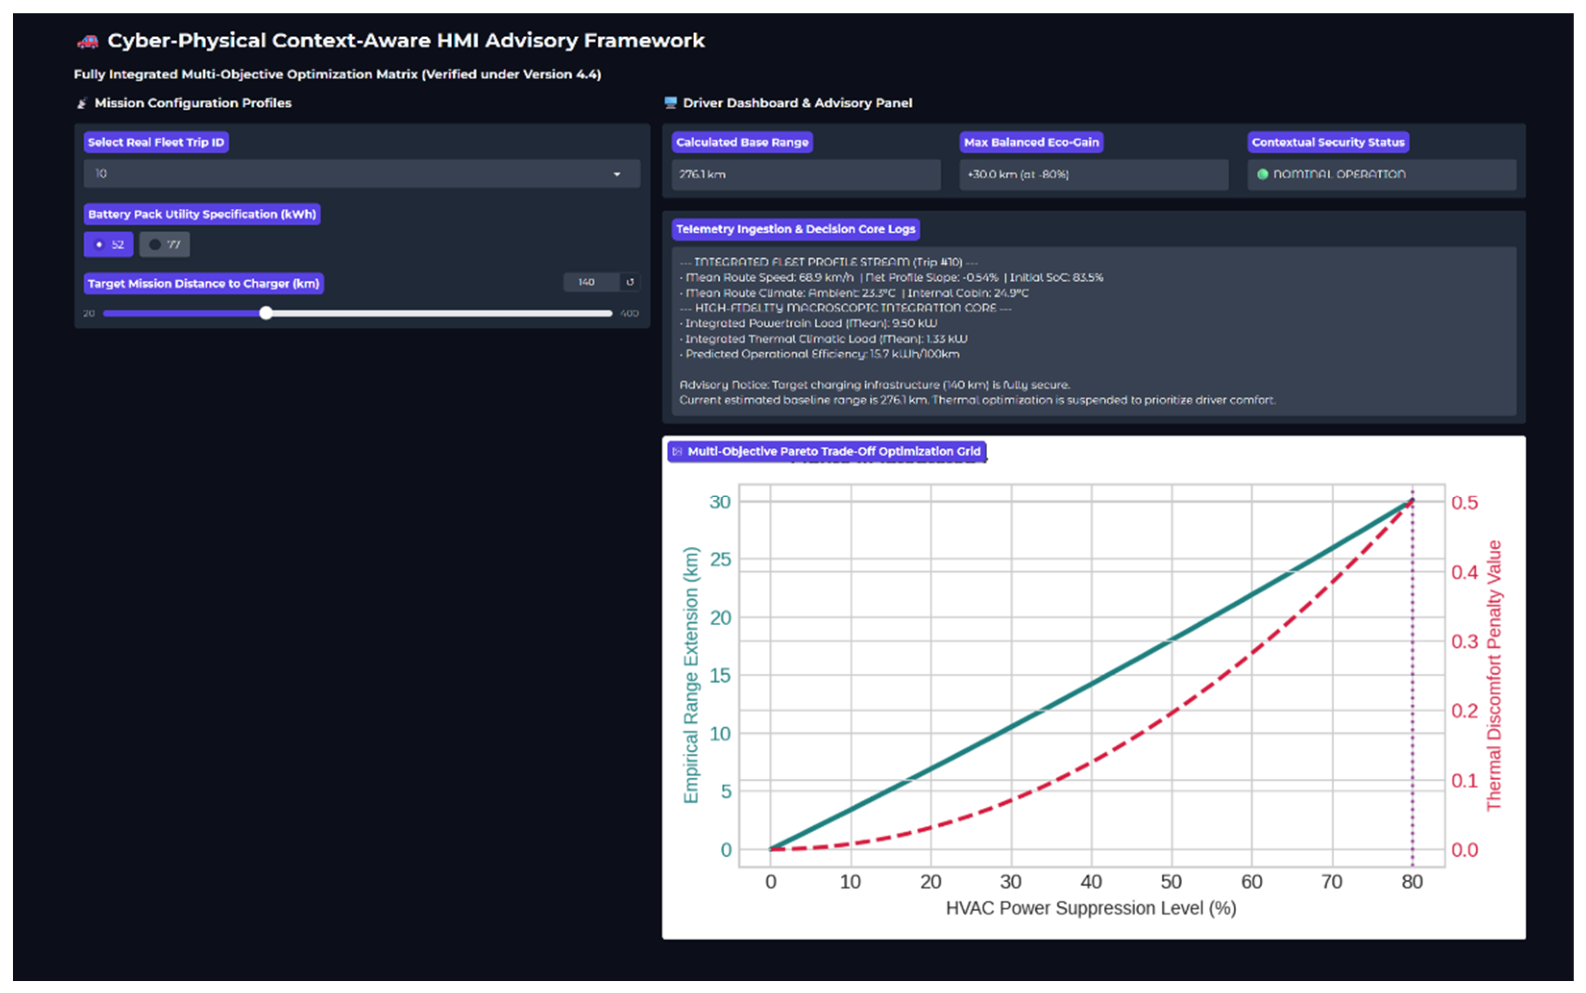

Table 1.
Technical specifications of the experimental electric vehicle platform.
| Parameter Description | Nominal Value | Unit |
|---|---|---|
| Vehicle Classification | C-Segment Electric SUV | — |
| Powertrain Motor Topology | Permanent Magnet Synchronous | — |
| Peak Motor Power/Torque | 125/310 | kW/Nm |
| Curb Mass (including driver & equipment) | 1965 | kg |
| Aerodynamic Drag Coefficient (CD) | 0.28 | — |
| Frontal Area (A) | 2.56 | m2 |
| Baseline Usable Battery Capacity | 52.0 | kWh |
| Extended-Range Pack Variant Simulation | 77.0 | kWh |
Table 2.
Cross-validation predictive metrics comparison across different modeling approaches.
| Regressor Topology | Traction Subsystem R2 | Traction MAE (kW) | HVAC Subsystem R2 | HVAC MAE (kW) |
|---|---|---|---|---|
| Linear Regression (OLS Baseline) | 0.6663 | 5.34 | 0.1442 | 1.01 |
| Random Forest | 0.9817 | 0.93 | 0.8656 | 0.25 |
| HistGradientBoosting (Proposed Cores) | 0.9869 | 0.71 | 0.8545 | 0.30 |
| XGBoost Regressor | 0.9810 | 1.01 | 0.3287 | 0.61 |
Disclaimer/Publisher’s Note: The statements, opinions and data contained in all publications are solely those of the individual author(s) and contributor(s) and not of MDPI and/or the editor(s). MDPI and/or the editor(s) disclaim responsibility for any injury to people or property resulting from any ideas, methods, instructions or products referred to in the content. |
© 2026 by the authors. Licensee MDPI, Basel, Switzerland. This article is an open access article distributed under the terms and conditions of the Creative Commons Attribution (CC BY) license (http://creativecommons.org/licenses/by/4.0/).
Copyright: This open access article is published under a Creative Commons CC BY 4.0 license, which permit the free download, distribution, and reuse, provided that the author and preprint are cited in any reuse.