

Submitted:
17 July 2026
Posted:
20 July 2026
You are already at the latest version
Abstract
Facial surface temperature can provide useful non-contact information for dairy-cow health, welfare, heat-stress, and reproductive-status monitoring. Infrared thermography can capture thermal information from facial regions such as the eyes, muzzle, nostrils, and ears, but infrared images alone often lack clear texture and anatomical boundaries, making reliable cow-head localisation difficult during mobile robotic inspection. Visible-light images provide richer structural cues but no temperature information. This study proposes YOLO11-AFE, a lightweight visible–thermal cow-head detection and heterogeneous-camera association framework for quadruped inspection robots. ADown was introduced for lightweight downsampling, C3k2_FE for adaptive feature enhancement, and SPPF_ECA for channel-aware multi-scale representation. An improved Hungarian matching algorithm was then used to establish one-to-one cow-head correspondence between synchronized visible-light and infrared pseudo-colour detections. YOLO11-AFE achieved Precision, mAP@0.5, and mAP@0.5:0.95 values of 97.51%, 96.26%, and 70.64% on the visible-light test subset, and 95.92%, 99.07%, and 91.41% on the infrared subset. Compared with YOLO11n, parameters and FLOPs were reduced by 17.37% and 18.17%. TensorRT deployment on Jetson Orin NX reached 36.71 FPS for the complete core pipeline. All 187 cow-head pairs were correctly associated, indicating that the framework provides an edge-deployable front end for future non-contact facial temperature monitoring.
Keywords:
precision livestock farming
; dairy-cow monitoring
; visible–thermal imaging
; cow-head detection
; heterogeneous-camera association
; facial thermography
; edge deployment
1. Introduction
Continuous and low-disturbance monitoring has become increasingly important for precision dairy-cow management. Body-temperature variation is closely related to thermoregulation, heat stress, inflammatory responses, disease risk, and reproductive activity, and therefore provides useful information for animal health and welfare assessment [1,2,3]. Rectal thermometry and wearable sensors can provide direct or continuous measurements, but they usually require animal contact, restraint, device attachment, or repeated close human–animal interaction. These procedures increase labour demand and may disturb normal behaviour, which is not ideal for frequent monitoring during routine barn inspection. Infrared thermography provides a non-contact alternative by recording surface thermal radiation. [4].
Several facial thermal regions have been investigated as potential physiological windows in cattle. Ear surface temperature measured using infrared thermography has been explored as a non-invasive variable for detecting postpartum hypocalcaemia in Holstein dairy cows [5]. Eye and muzzle temperatures of calves have been automatically extracted using infrared thermography and object-detection algorithms, indicating the potential of continuous facial temperature measurement for welfare-related monitoring [6]. In reproductive management, thermal infrared features from the eye and vulva have been used for non-contact oestrus monitoring in cows [7]. More broadly, automatic collection of facial temperatures from the eyes, muzzle, nostrils, ears, and horns has been reported in dairy cows, showing that multiple facial regions may provide useful thermal information for animal-health and welfare research [8].
Nevertheless, enabling an inspection robot to acquire such thermal information from multiple cows during routine barn patrol remains challenging. In multi-cow scenes, each thermal observation must be associated with the correct animal before it can support individual-level monitoring. This requirement is difficult to meet using a single infrared camera because infrared pseudo-colour images provide thermal information but often contain weak texture, blurred anatomical boundaries, and limited local structural details. These limitations make it difficult to localize cow heads and distinguish individual animals reliably, especially when cows overlap, fences occlude the head region, or the robot viewpoint changes. In contrast, visible-light images provide richer contours, textures, and structural information for cow-head localization, but they do not contain temperature information. Therefore, visible-light and thermal-infrared cameras have complementary roles: visible-light images are suitable for stable cow-head localization and target separation, whereas infrared images provide the thermal information needed for later facial-temperature extraction. The key prerequisite is then to establish target-level correspondence between cow heads detected in the two camera views, which provides a front-end basis for subsequent local registration, facial-region recognition, and radiometric temperature extraction.
For this complementary sensing strategy to be useful in robotic inspection, the same cow head must be correctly associated across synchronized visible-light and infrared image streams. If cross-camera correspondence is incorrect, the subsequent thermal information may be assigned to the wrong animal, especially in crowded scenes with occlusion, unequal target numbers, and different fields of view. A mobile robot equipped with visible-light and infrared sensors can provide a practical platform for such monitoring, but it also introduces additional challenges, including vibration, changing viewpoints, installation offsets between cameras, and limited edge-computing resources [9,10]. Therefore, an effective robotic monitoring framework requires both a lightweight cow-head detector and a target-level heterogeneous-camera association method.
Vision-based livestock perception has been widely studied for dairy-cow detection, identification, behaviour analysis, and health monitoring. Song et al. reviewed video-based methods for dairy-cow detection, individual identification, and behaviour recognition, highlighting their value for intelligent dairy management [11]. Tassinari et al. applied deep learning to detect dairy cows in free-stall barns, demonstrating the feasibility of automated perception in structured housing environments [12]. Tian et al. proposed a robot-assisted method for recognizing selective feeding behaviour in dairy cows, showing the potential of mobile robotic platforms in barn monitoring [13]. Bumbálek et al. integrated computer vision and infrared thermography for hoof-disease localization in dairy cattle, linking visual detection with thermal analysis in real farm scenes [14]. Wang et al. used computer vision to analyse multi-object cattle rumination through cow-head detection and tracking [15]. These studies provide important foundations, but many of them rely on fixed cameras, single imaging modalities, or separate visual and thermal analyses, rather than establishing target-level correspondence between visible-light and infrared images acquired by a moving robot.
Cross-modal image registration and visible–infrared association have also been investigated in broader computer-vision applications. Transformer-based feature matching has been used to reduce errors caused by local deformation [16], and cross-modality image generation has been introduced to simplify infrared–visible registration and fusion [17]. Spatial co-registration methods have also been developed for visible, multispectral, and thermal images acquired by unmanned platforms [18]. Although these approaches are effective in certain scenarios, they often depend on feature points, dense alignment, or image-level transformation. Their performance may deteriorate in dairy barns where infrared images have weak texture, animals move, fences cause occlusion, and the robot viewpoint changes continuously. In addition, dense registration and large matching models can introduce computational burdens that are unsuitable for embedded inspection platforms. Previous studies on cattle behaviour recognition and infrared–visible registration further indicate that model complexity, weak texture, and complex scenes remain important challenges for real-time livestock monitoring [19,20,21].In addition, RGB–thermal image analysis has shown that visible and thermal information can support robust object perception when their correspondence is properly handled [22]. These findings suggest that a deployable robotic monitoring system requires not only a compact cow-head detector but also a target-level cross-camera association method that can operate in real time on edge hardware.
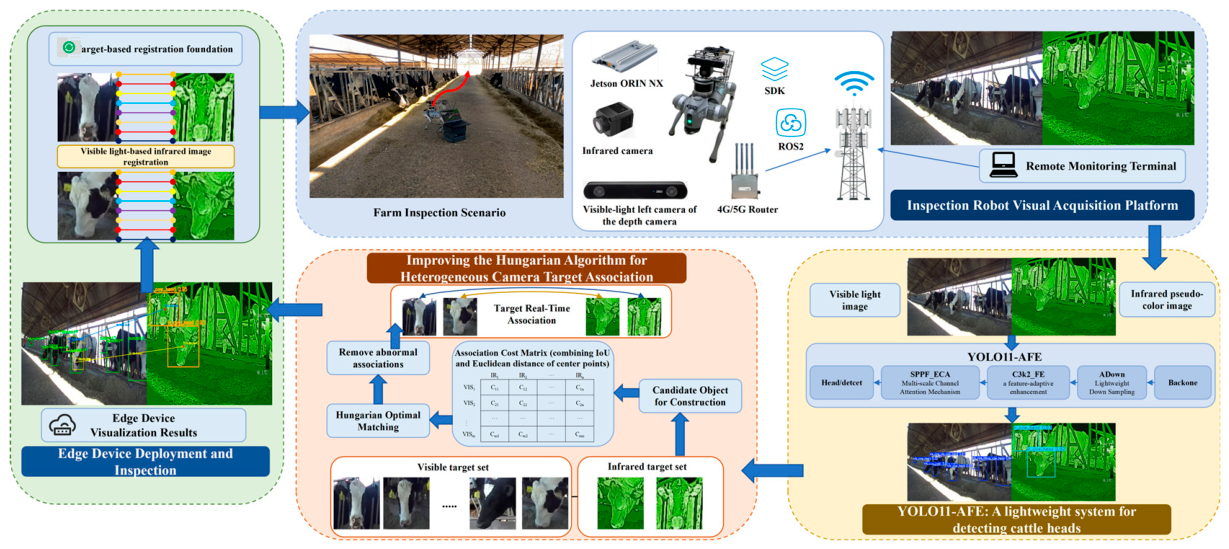
This study proposes YOLO11-AFE, a lightweight visible–thermal cow-head detection and heterogeneous-camera association framework for quadruped inspection robots.(Figure. 1) The framework does not perform visible–thermal image fusion or complete facial-temperature diagnosis. Instead, it focuses on two prerequisite perception tasks: detecting cow heads in both imaging modalities and establishing one-to-one target correspondence between synchronized visible-light and infrared pseudo-colour images. This target-level correspondence can provide an edge-deployable front-end basis for future local image registration, facial-region recognition, radiometric temperature mapping, and non-contact temperature extraction from regions such as the eyes, muzzle, nostrils, and ears.
The main contributions of this study are as follows. First, a lightweight cow-head detector was developed based on YOLO11n. ADown was introduced to reduce downsampling computation, SPPF_ECA was constructed by integrating efficient channel attention into SPPF, and C3k2_FE was designed to enhance adaptive feature representation in visible-light and infrared pseudo-colour images. Second, a robotic dual-camera cow-head dataset is constructed under normal illumination, weak illumination, local shadows, strong light, different viewpoints, fence occlusion, and single- and multi-cow scenes. Third, a heterogeneous-camera association strategy is proposed to handle unequal target numbers and different target positions across modalities by combining IoU and relative centre-distance cues in an improved Hungarian matching algorithm. Fourth, the complete detector–association pipeline is deployed on a Unitree Go2 quadruped robot equipped with an NVIDIA Jetson Orin NX platform, and TensorRT acceleration verifies its real-time feasibility for edge-based dairy-cow monitoring.
Figure 1.
System framework of dual-modal cow-head detection and target association for the inspection robot.
Figure 1.
System framework of dual-modal cow-head detection and target association for the inspection robot.
2. Materials and Methods
2.1. Data Acquisition and Processing
Data were acquired at a dairy farm of the agricultural machinery test station of the Chinese Academy of Agricultural Mechanization Sciences Group Co., Ltd., Changping District, Beijing, China. Ten barns were included. To approximate the conditions faced by an inspection robot, the collection covered different cow postures, single- and multi-animal views, fence occlusion, normal lighting, weak illumination, local shadow, and strong-light interference. The sensing system was fixed on a Unitree Go2 quadruped robot, as shown in Figure. 2, so the viewpoint was consistent with mobile inspection rather than a static camera setup.
Figure 2.
Visual Perception System of the Inspection Robot.
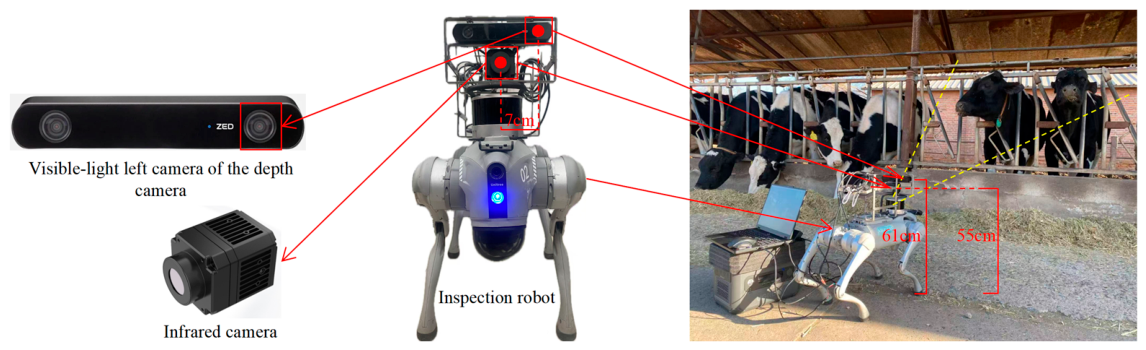
For each acquisition cycle, visible images were captured by the left camera of a ZED2i depth camera at 1,280 x 720 pixels, and infrared pseudo-colour images were captured by a Guide Sensmart IPN384 infrared camera at 512 x 384 pixels. The SDK was extended so that both cameras were triggered at the same time. The interval between triggers was 2 s. Each trigger therefore generated one synchronized pair consisting of a visible-light image and the corresponding infrared pseudo-colour image. A total of 6,973 raw image pairs were collected.
Redundant frames were removed with the structural similarity index measure (SSIM)[23]. For adjacent frames, luminance, contrast, and structural components were compared, and 0.75 was used as the similarity threshold. This filtering discarded nearly unchanged frames while retaining changes in animal behaviour and scene configuration. After this step, 1,222 aligned synchronized image pairs were kept for dataset construction.
An asymmetric annotation scheme was adopted because the two sensors differ in resolution, field of view, and imaging mechanism[24]. LabelImg was used to annotate the two modalities separately. The visible-light class was named vis_cow_head, and the infrared class was named ir_cow_head. For visible images, the annotation rule prioritized recall: all recognizable cow heads were labelled, including targets partly covered by fences, overlapping with other animals, or truncated at image borders. For infrared pseudo-colour images, the labels were designed to support subsequent facial-temperature monitoring. Only cow heads with clear anatomical structures, visible facial thermal cues, and no serious occlusion were retained, whereas irrelevant heat sources were excluded. The final annotations included 5,683 cow-head instances in visible images and 1,951 cow-head instances in infrared pseudo-colour images.
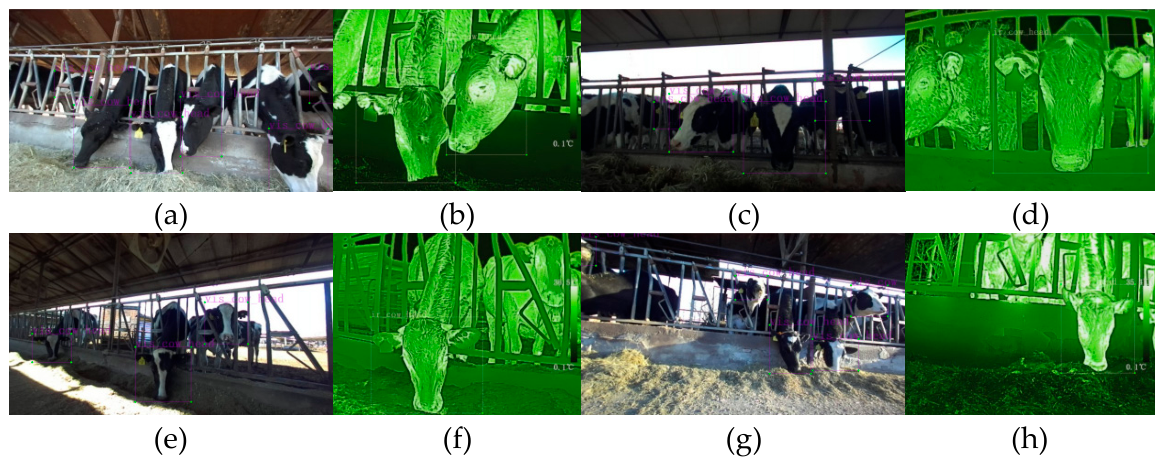
Figure. 3 shows representative labelled samples under several lighting conditions. The visible channel changes strongly with illumination, shadow, and reflection, whereas the infrared pseudo-colour channel is more stable to ambient visible light but provides much weaker texture information.
Figure 3.
Example of visible and infrared pseudo-colour images under different illumination conditions. (a) Visible-light image under normal illumination; (b) Infrared pseudo-colour image under normal illumination; (c) Visible-light image under low-illumination conditions; (d) Infrared pseudo-colour image under low-illumination conditions; (e) Visible-light image under local shadow interference; (f) Infrared pseudo-colour image under local shadow interference; (g) Visible-light image under strong-light interference; (h) Infrared pseudo-colour image under strong-light interference.
Figure 3.
Example of visible and infrared pseudo-colour images under different illumination conditions. (a) Visible-light image under normal illumination; (b) Infrared pseudo-colour image under normal illumination; (c) Visible-light image under low-illumination conditions; (d) Infrared pseudo-colour image under low-illumination conditions; (e) Visible-light image under local shadow interference; (f) Infrared pseudo-colour image under local shadow interference; (g) Visible-light image under strong-light interference; (h) Infrared pseudo-colour image under strong-light interference.
The data were divided into training, validation, and test subsets at about 8:1:1, while keeping samples independent for evaluation[25]. The images covered different herd densities, from one cow to crowded multi-cow scenes. Finally, 1,956 images were used for training, 244 for validation, and 244 for testing; Table 1 gives the detailed distribution.
2.2. Construction of the Lightweight YOLO11-AFE Model
2.2.1. Improvement of the YOLO11n Model
YOLO11n was chosen as the starting detector because the task requires fast cow-head perception from visible and infrared images in complex farm scenes. Its small parameter size and high inference speed make it practical for edge devices with limited resources[26]. Nevertheless, dual-light data introduce additional difficulties: visible images are disturbed by low light, shadows, and overexposure, whereas infrared pseudo-colour images often contain weak texture and simple colour patterns. The original YOLO11n therefore needs task-specific adaptation to represent both modalities effectively.
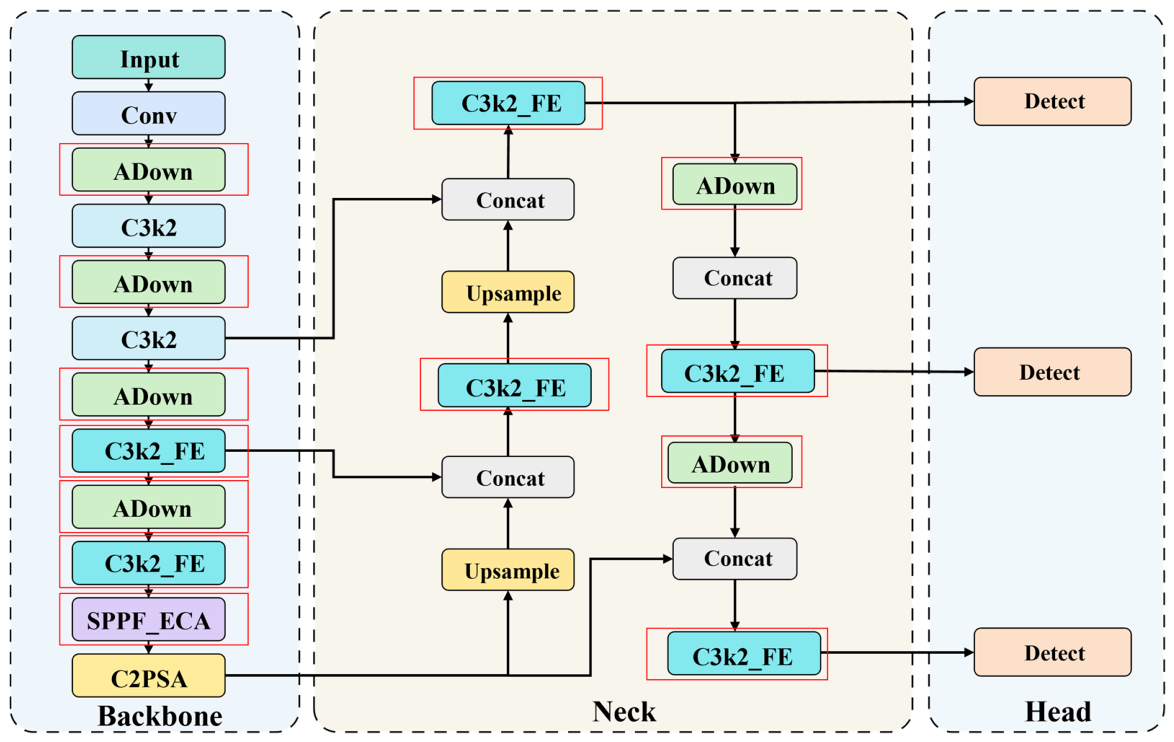
On this basis, the YOLO11-AFE detector was designed, where A, F, and E refer to ADown, FiLM Enhancement, and Efficient Channel Attention. The network in Figure. 4 is composed of a backbone, neck, and detection head. In the backbone, some standard downsampling layers are replaced by ADown to reduce computation while retaining useful spatial responses. C3k2_FE is inserted into both the high-level backbone and the multi-scale neck to adapt features from visible and infrared inputs. ECA is further attached to SPPF, producing SPPF_ECA to strengthen multi-scale semantics and important channel responses. The Detect head from YOLO11n is retained to predict cow-head boxes at different scales. These changes aim to improve robustness to complex illumination and dual-light appearance variation while keeping the network compact.
Figure 4.
Overall architecture and inference process of the YOLO11-AFE lightweight cow-head detection model. The image first enters the backbone, where multi-scale semantic features are extracted (Step 1). ADown lowers downsampling computation and retains spatial cues, C3k2_FE adjusts cow-head features for different modalities, and SPPF_ECA enlarges the receptive field while highlighting informative channels. The neck then integrates and reconstructs features at multiple scales through ADown and C3k2_FE (Step 2). The detection head predicts cow-head boxes on several feature levels (Step 3), and decoding plus NMS produces the final detections (Step 4).
Figure 4.
Overall architecture and inference process of the YOLO11-AFE lightweight cow-head detection model. The image first enters the backbone, where multi-scale semantic features are extracted (Step 1). ADown lowers downsampling computation and retains spatial cues, C3k2_FE adjusts cow-head features for different modalities, and SPPF_ECA enlarges the receptive field while highlighting informative channels. The neck then integrates and reconstructs features at multiple scales through ADown and C3k2_FE (Step 2). The detection head predicts cow-head boxes on several feature levels (Step 3), and decoding plus NMS produces the final detections (Step 4).
2.2.2. Introduction of the ADown Lightweight Downsampling Module
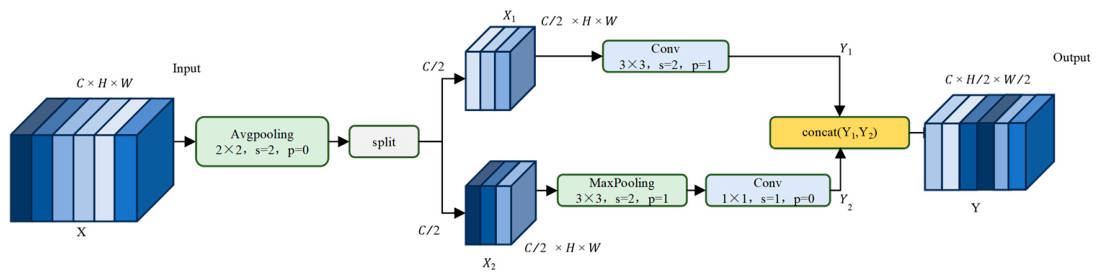
In detection networks, downsampling decreases feature-map size and enlarges the receptive field. However, stride convolution may remove boundary details and small-target cues during compression. Cow heads in inspection images have variable scales, may be partially hidden by fences, and can be affected by strong illumination. ADown is therefore placed at selected downsampling positions. As illustrated in Figure. 5, the input feature first passes through 2 x 2 average pooling and is then split by channel. One branch performs local extraction with 3 x 3 convolution, while the other applies 3 x 3 max pooling and 1 x 1 convolution for spatial compression and channel adjustment. Concatenating the two outputs retains spatial cues from different operations and reduces the computational burden for subsequent detection.
Figure 5.
Structure of the ADown lightweight downsampling module. is the input feature map, and are the two branch features obtained by channel-wise split, is the output of the upper branch convolution, is the output of the lower branch pooling and convolution, Y is the output feature of the module; C is the number of channels in the feature map, H and W are the height and width of the feature map, s denotes the stride of pooling, and p denotes the padding of convolution.
Figure 5.
Structure of the ADown lightweight downsampling module. is the input feature map, and are the two branch features obtained by channel-wise split, is the output of the upper branch convolution, is the output of the lower branch pooling and convolution, Y is the output feature of the module; C is the number of channels in the feature map, H and W are the height and width of the feature map, s denotes the stride of pooling, and p denotes the padding of convolution.
2.2.3. Construction of the C3k2_FE Feature-Adaptive Enhancement Module
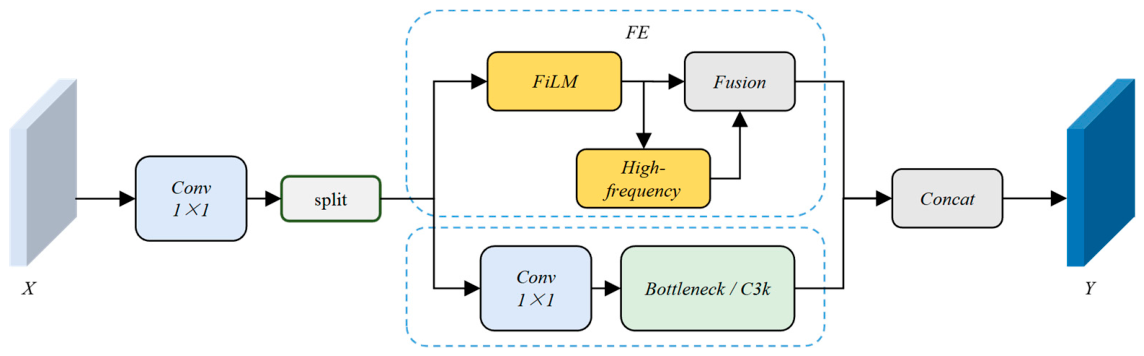
The two imaging modalities provide complementary but inconsistent information. Visible images contain rich edges and local textures, but their quality changes with illumination. Infrared pseudo-colour images encode thermal radiation and are less affected by visible light, yet they usually lack fine texture. Such modality differences can reduce the generalisation of a detector trained on mixed dual-light data. To address this issue, the C3k2_FE module, C3k2 with FiLM Enhancement, is inserted into the high-level feature-extraction part of the backbone and the multi-scale reconstruction part of the neck, as shown in Figure. 6.
Figure 6.
Structure of the FiLM-Enhanced C3k2_FE Module. represents the input feature of the C3k2_FE module, and represents the output feature. FE denotes the feature-adaptive enhancement module, FiLM denotes feature-wise linear modulation, and High-frequency denotes the high-frequency residual enhancement branch.
Figure 6.
Structure of the FiLM-Enhanced C3k2_FE Module. represents the input feature of the C3k2_FE module, and represents the output feature. FE denotes the feature-adaptive enhancement module, FiLM denotes feature-wise linear modulation, and High-frequency denotes the high-frequency residual enhancement branch.
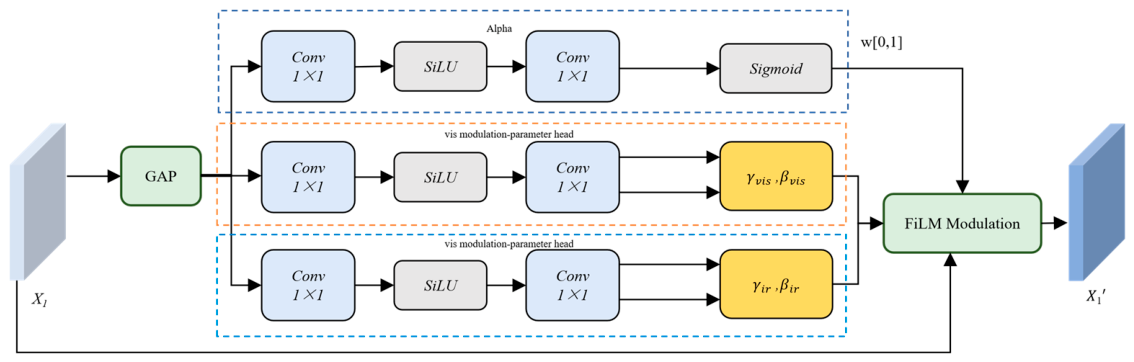
C3k2_FE augments the original C3k2 block with a FiLM branch (Figure. 7). A global descriptor is first obtained from the input feature by global average pooling. This descriptor is then fed into three lightweight branches: an Alpha branch that predicts interpolation weights and two FiLM branches that generate modality-related affine parameters. Each FiLM branch uses two consecutive 1 x 1 convolutions with SiLU activation. The first convolution compresses the channel dimension for inexpensive transformation, and the second outputs twice the input-channel number, which is separated into scale and shift terms. The Alpha branch uses 1 x 1 convolutions, SiLU, and Sigmoid to constrain the interpolation weights to [0, 1]. The two sets of affine parameters are blended with these weights and applied to the input feature along the channel dimension. Because the modulation is inferred from global feature statistics rather than explicit modality labels, the block can adjust channel responses adaptively and reduce fluctuations caused by cross-modal differences.
where G∈ℝC×1×1 represents the channel-wise context vector after global pooling, γvis,βvis,γir,βir denote the affine parameters generated by the visible-light and infrared branches,w is the learnable interpolation coefficient, is the channel-modulated output feature, and ⊙ represents channel-wise element-wise multiplication.
Figure 7.
Structure of the FiLM branch in the C3k2_FE module. is the input feature; GAP denotes global average pooling; Alpha, vis head, and ir head represent the branches generating the learnable interpolation weight, visible-light affine parameters, and infrared affine parameters, respectively; is the learnable interpolation weight; is the output feature after channel-wise FiLM modulation.
Figure 7.
Structure of the FiLM branch in the C3k2_FE module. is the input feature; GAP denotes global average pooling; Alpha, vis head, and ir head represent the branches generating the learnable interpolation weight, visible-light affine parameters, and infrared affine parameters, respectively; is the learnable interpolation weight; is the output feature after channel-wise FiLM modulation.
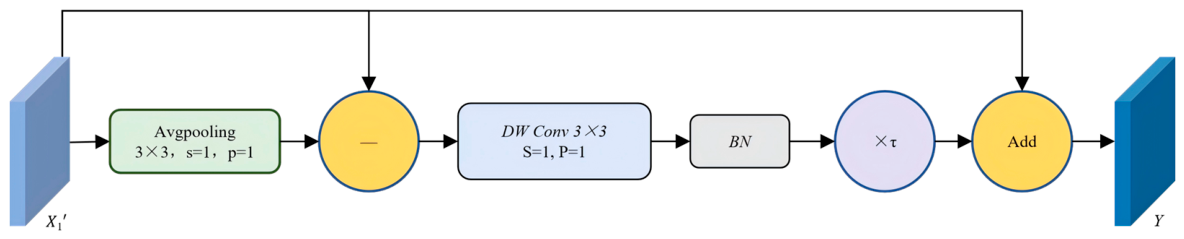
A high-frequency residual branch is also added to emphasize detailed cow-head structures (Figure. 8). This branch obtains a low-frequency component through local 3 x 3 average pooling and subtracts it from the FiLM-modulated feature to isolate high-frequency information. The residual is refined with 3 x 3 depthwise convolution and batch normalisation, and is then added back to the FiLM-modulated feature while preserving the output-channel number. A learnable scaling factor controls the contribution of the residual and is optimized during training through the detection loss. In this way, the model can selectively strengthen edges, contours, and local texture cues in scenes with harsh illumination, weak infrared texture, or occlusion.
where denotes the feature after FiLM modulation; denotes the low-frequency component extracted by 3×3 average pooling; denotes the high-frequency residual; denotes the 3×3 depthwise convolution; BN() denotes the batch normalization operation; denotes the high-frequency feature enhanced by depthwise convolution and batch normalization; denotes the learnable scaling coefficient; and Y denotes the output feature obtained by fusing the high-frequency residual enhancement branch with the FiLM-modulated feature.
Figure 8.
Structure of the high-frequency residual enhancement branch. is the input feature after FiLM modulation; Y is the output feature after high-frequency residual enhancement.
Figure 8.
Structure of the high-frequency residual enhancement branch. is the input feature after FiLM modulation; Y is the output feature after high-frequency residual enhancement.
2.2.4. SPPF_ECA Multi-Scale Channel Attention Enhancement Module
SPPF obtains multi-scale semantics by repeated max pooling and increases the receptive field with little extra computation. Its operation, however, mainly fuses information in the spatial domain and does not explicitly reweight channels. In dual-light cow-head detection, visible and infrared inputs activate different informative channels, so spatial pyramid pooling alone may not sufficiently emphasize cow-head-related responses. Therefore, ECA is appended after SPPF to produce the SPPF_ECA module shown in Figure. 9.
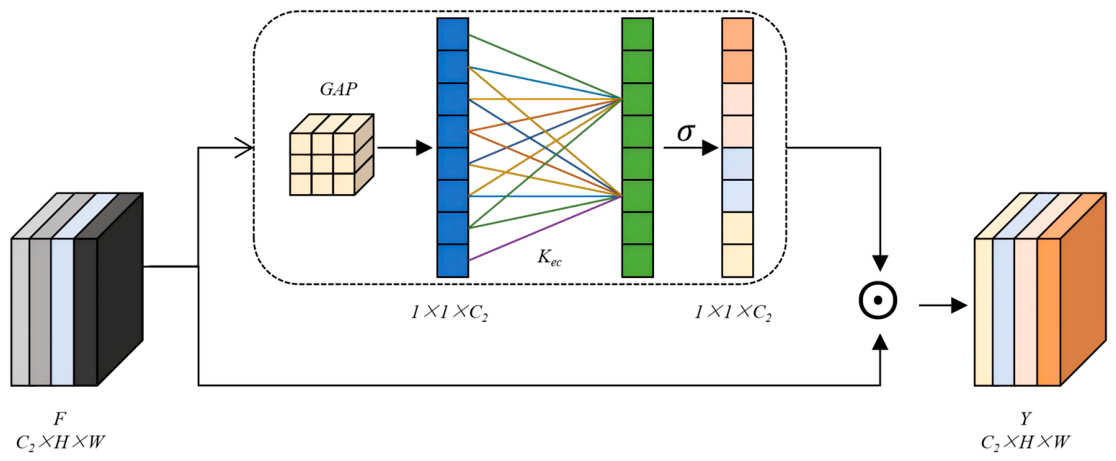
In ECA, each channel is first compressed to a scalar by adaptive global average pooling, yielding a compact descriptor:
where denotes the feature map of the channel.
Neighbouring-channel interactions are then modelled with a one-dimensional convolution whose kernel size is chosen from the channel number. Sigmoid activation converts the response into channel weights:
where and are the tuning factors, commonly set to 1 and 2[27]. The rounding operation ensures an odd kernel size for centre alignment, the Sigmoid function normalizes the response, and the resulting vector stores channel-wise weights.
The feature map is multiplied by these weights to obtain the recalibrated output:
where denotes channel-wise element-wise multiplication.
Unlike channel-attention designs that compress channels with fully connected layers, ECA keeps the channel dimension unchanged and adds little computation. It therefore improves important channel responses without compromising lightweight inference. In the proposed network, SPPF_ECA enhances high-level cow-head semantics and improves discrimination from complex backgrounds.
Figure 9.
Structure of the SPPF_ECA multi-scale channel attention module. denotes the input feature of the SPPF_ECA module; F0、F1、F2、F3 denote the multi-scale features obtained by 1×1 convolution and successive max-pooling operations; F denotes the SPPF output feature after feature concatenation and 1×1 convolution fusion; Y denotes the output feature recalibrated by ECA channel attention.
Figure 9.
Structure of the SPPF_ECA multi-scale channel attention module. denotes the input feature of the SPPF_ECA module; F0、F1、F2、F3 denote the multi-scale features obtained by 1×1 convolution and successive max-pooling operations; F denotes the SPPF output feature after feature concatenation and 1×1 convolution fusion; Y denotes the output feature recalibrated by ECA channel attention.
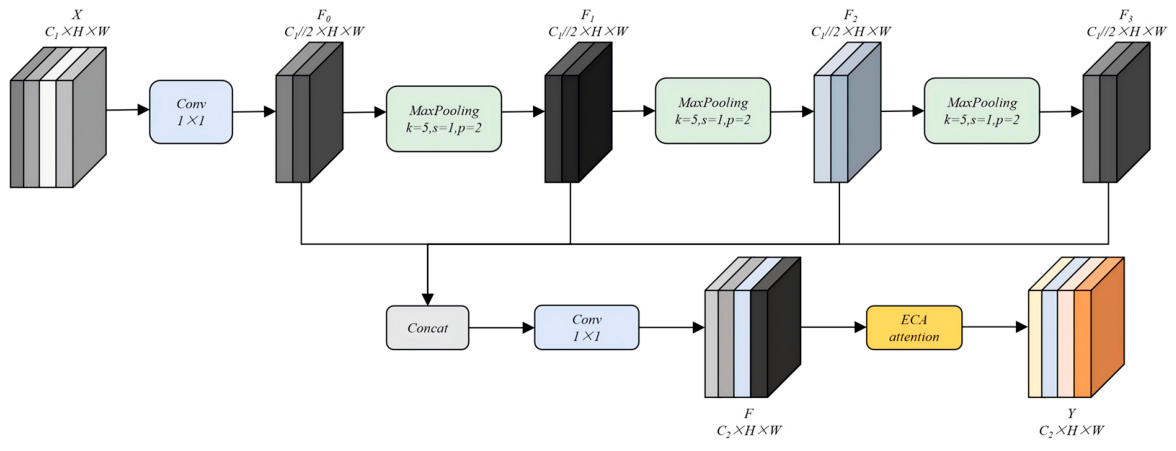
Figure 10.
Structure of the Efficient Channel Attention (ECA) module. GAP denotes global average pooling;Kec denotes the kernel size of the 1D convolution in ECA; denotes the Sigmoid activation function; denotes element-wise multiplication.
Figure 10.
Structure of the Efficient Channel Attention (ECA) module. GAP denotes global average pooling;Kec denotes the kernel size of the 1D convolution in ECA; denotes the Sigmoid activation function; denotes element-wise multiplication.
2.3. Improvement of the Heterogeneous-Camera Target Association Algorithm
In a moving robot system, the visible and infrared cameras are installed at different positions and differ in resolution and field of view. The same cow head may therefore appear at different scales, positions, and visual forms in the two modalities. Animal movement, occlusion by fences, pose changes, and missed detections can also make the target numbers inconsistent between synchronized image pairs. Pixel-level matching is unsuitable in this setting because it is sensitive to the appearance gap between texture images and thermal pseudo-colour images and because it introduces a large computational burden for edge processing.
The association module is built on the detection boxes produced by YOLO11-AFE. Visible-light boxes and infrared pseudo-colour boxes are first mapped into a normalized coordinate space, after which target-level matching is used to determine whether two boxes belong to the same cow head. Unlike dense registration or deep re-identification, the cost computation uses only box locations and overlap relations. This choice keeps the algorithm simple and makes it appropriate for deployment on embedded inspection platforms.
2.3.1. Problem Definition and Overall Workflow
YOLO11-AFE outputs two bounding-box sets from synchronized visible-light and infrared pseudo-colour frames. They are defined as follows:
where and denote the sets of cow-head bounding boxes in the visible-light and infrared pseudo-colour images, respectively; (m) and (n) denote the numbers of cow-head targets detected in the visible-light and infrared pseudo-colour images, respectively; and and denote the i-th visible-light cow-head bounding box and the j-th infrared pseudo-colour cow-head bounding box, respectively.
Because occlusion, missed detection, and camera field-of-view differences can make the two target counts unequal, the goal is not to pair every detection blindly. Instead, the task is to obtain the most plausible correspondence between the visible and infrared box sets:
where M denotes the set of matched cow-head targets between the visible-light and infrared pseudo-colour images.
If a pair is accepted, the two boxes are treated as observations of the same cow head; otherwise, the candidate is discarded as unmatched. The proposed workflow first builds a cost matrix from two spatial cues: box overlap and the relative distance of each box centre to the corresponding image centre. The Hungarian algorithm then searches for the minimum-cost assignment, and additional thresholds remove abnormal pairs. This procedure yields one-to-one correspondence for multi-cow dual-light scenes.
2.3.2. Construction of the Fused Cost Matrix
A cow head captured by the two cameras usually preserves approximate relative spatial consistency, but its absolute pixel coordinates differ because the sensors have different resolutions, views, and mounting positions. Directly measuring the pixel distance between two box centres can therefore be misleading. To reduce sensitivity to these factors, each box centre is compared with the centre of its own image, and the difference between the two centre-distance values is used as a spatial consistency term. The IoU of the two boxes is then incorporated to represent regional overlap, and the two measurements jointly form the fused cost matrix.
For a visible-light candidate and an infrared candidate, their box-centre coordinates are written as:
The centres of the corresponding visible-light and infrared pseudo-colour images are defined as:
The distance from the visible-light box centre to the visible-light image centre is calculated by:
The same calculation is performed for the infrared pseudo-colour box centre and its image centre:
The relative location discrepancy of the two candidates is then expressed by the normalized difference between these two distances:
where and denote the centre coordinates of the visible-light and infrared pseudo-colour detection boxes, respectively; and denote the centre coordinates of the visible-light and infrared pseudo-colour images, respectively; and denote the Euclidean distances from the detection-box centres to the corresponding image centres; denotes the normalized relative centre-distance difference; and is the normalization scale factor, which can be set as the diagonal length of the corresponding image or the maximum possible distance difference. A smaller indicates that the two targets have more similar relative spatial positions in their respective images.
IoU is used to measure how much the two candidate boxes overlap:
where denotes the intersection over union between the i-th visible-light detection box and the j-th infrared pseudo-colour detection box; denotes the intersection area of the two detection boxes; and denotes their union area. A larger indicates a higher degree of spatial overlap between the two detection boxes.
The matching cost for a visible-light target and an infrared pseudo-colour target is then defined by combining the normalized centre-distance difference and the IoU term:
where denotes the matching cost of the target pair (); is the weighting coefficient used to balance the effects of the relative centre-distance difference and IoU on the matching cost; and is the overlap penalty term. A smaller indicates a higher probability that the visible-light target and the infrared pseudo-colour target correspond to the same cow head.
After the pairwise costs are obtained, they are arranged into the heterogeneous-camera association matrix:
where denotes the heterogeneous-camera target association cost matrix with a dimension of m×n, and each element represents the matching cost between one visible-light target and one infrared pseudo-colour target.
2.3.3. Improved Hungarian Matching and Outlier Association Removal
Given the fused cost matrix, the Hungarian algorithm is adopted to find the minimum-cost one-to-one assignment between visible-light and infrared pseudo-colour detections. This global optimisation avoids the duplicated or incorrect matches that may occur with local nearest-neighbour rules[28]. The objective is:
where denotes the set of optimal matches, denotes all feasible match combinations, and represents the association cost between the i-th visible-light target and the j-th infrared pseudo-colour target.
In real inspection data, some detections should not be assigned because the two cameras may capture different target sets. If every Hungarian output were retained, boxes with large relative displacement or negligible overlap could be incorrectly forced into pairs. For this reason, threshold filtering is applied after assignment. A candidate match is kept only when:
with additional constraints on relative centre-distance difference and IoU:
where is the cost threshold, is the relative centre-distance threshold, and is the IoU threshold.
Candidates violating any threshold are discarded, giving the valid matching set:
where denotes the set of matches retained after outlier removal.
In summary, the association method uses YOLO11-AFE detections as its input and constructs a lightweight cost matrix from centre-distance discrepancy and IoU. The improved Hungarian matching then provides one-to-one correspondence between visible-light and infrared pseudo-colour cow-head targets. Because no pixel-level cross-modal registration is required, the method remains efficient and can handle occlusion, target overlap, and unequal target counts while supplying target-level correspondence for future non-contact facial-temperature monitoring in dairy cows.
2.4. Hardware Environment and Evaluation Metrics
The experiments were run on a server equipped with an NVIDIA RTX A6000 GPU. The software stack consisted of Ubuntu 20.04.6 LTS, Python 3.10.19, PyTorch 2.9.1, and CUDA 12.8.
For training, images were resized to 640 x 640 pixels, the batch size was 64, and 200 epochs were scheduled with 8 data-loading workers. Stochastic gradient descent was used for optimisation, and the random seed was fixed at 523. To stabilize training and reduce overfitting, early stopping was enabled with patience set to 50.
Model accuracy was reported with precision (P), mAP at an IoU threshold of 0.5, and mAP averaged over IoU thresholds from 0.5 to 0.95. Computational complexity was described using the number of trainable parameters and GFLOPs. The following equations define these metrics:
where denotes the number of true positive detections, denotes the number of false positive detections, represents the precision–recall curve, denotes the average precision for a single class, denotes the average precision of the i-th class, and is the total number of target classes.
3. Results
3.1. Comparison of Detection Models
Cow-head detection was evaluated separately for the visible-light and infrared pseudo-colour test subsets. YOLO11-AFE was benchmarked against RT-DETR_L, Faster-RCNN, YOLOv5n, YOLOv8n, YOLOv10n, YOLO11n, and YOLOv12n. To ensure an unbiased comparison, all models were trained again with the same data split, input resolution, and training configuration before being tested on both modalities. The results are given in Table 2.
As Table 2 indicates, YOLO11-AFE obtained the strongest overall performance for the two modalities. On the visible-light subset, Precision, mAP@0.5, and mAP@0.5:0.95 were 97.51%, 96.26%, and 70.64%, respectively, higher than those of the comparison models. This suggests improved tolerance to illumination changes, cluttered backgrounds, and multi-cow scenes. On the infrared pseudo-colour subset, the corresponding values reached 95.92%, 99.07%, and 91.41%, showing stable detection even when thermal texture is weak and object boundaries are unclear.
Relative to YOLO11n, the proposed network increased accuracy while remaining compact. For visible-light images, the gains in Precision, mAP@0.5, and mAP@0.5:0.95 were 4.40, 2.15, and 1.36 percentage points. For infrared pseudo-colour images, the gains were 1.65, 0.15, and 1.15 percentage points. The model size decreased from 2.59M to 2.14M parameters, and computation decreased from 6.44 to 5.27 GFLOPs, corresponding to reductions of 17.37% and 18.17%. These results show that ADown, C3k2_FE, and SPPF_ECA improve cross-modal cow-head representation while reducing complexity. Among all compared networks, YOLO11-AFE provided the smallest parameter and FLOP values together with the highest accuracy, indicating a favourable balance for edge deployment.
Figure 11.
Qualitative comparison of cow-head detection results between YOLO11n and YOLO11-AFE under different complex dairy-farm scenes. In each panel, the upper images show the results of YOLO11n, and the lower images show the results of YOLO11-AFE. (a) Strong-light interference scene; (b) normal illumination scene; (c) local shadow interference scene; (d) low-illumination scene.
Figure 11.
Qualitative comparison of cow-head detection results between YOLO11n and YOLO11-AFE under different complex dairy-farm scenes. In each panel, the upper images show the results of YOLO11n, and the lower images show the results of YOLO11-AFE. (a) Strong-light interference scene; (b) normal illumination scene; (c) local shadow interference scene; (d) low-illumination scene.
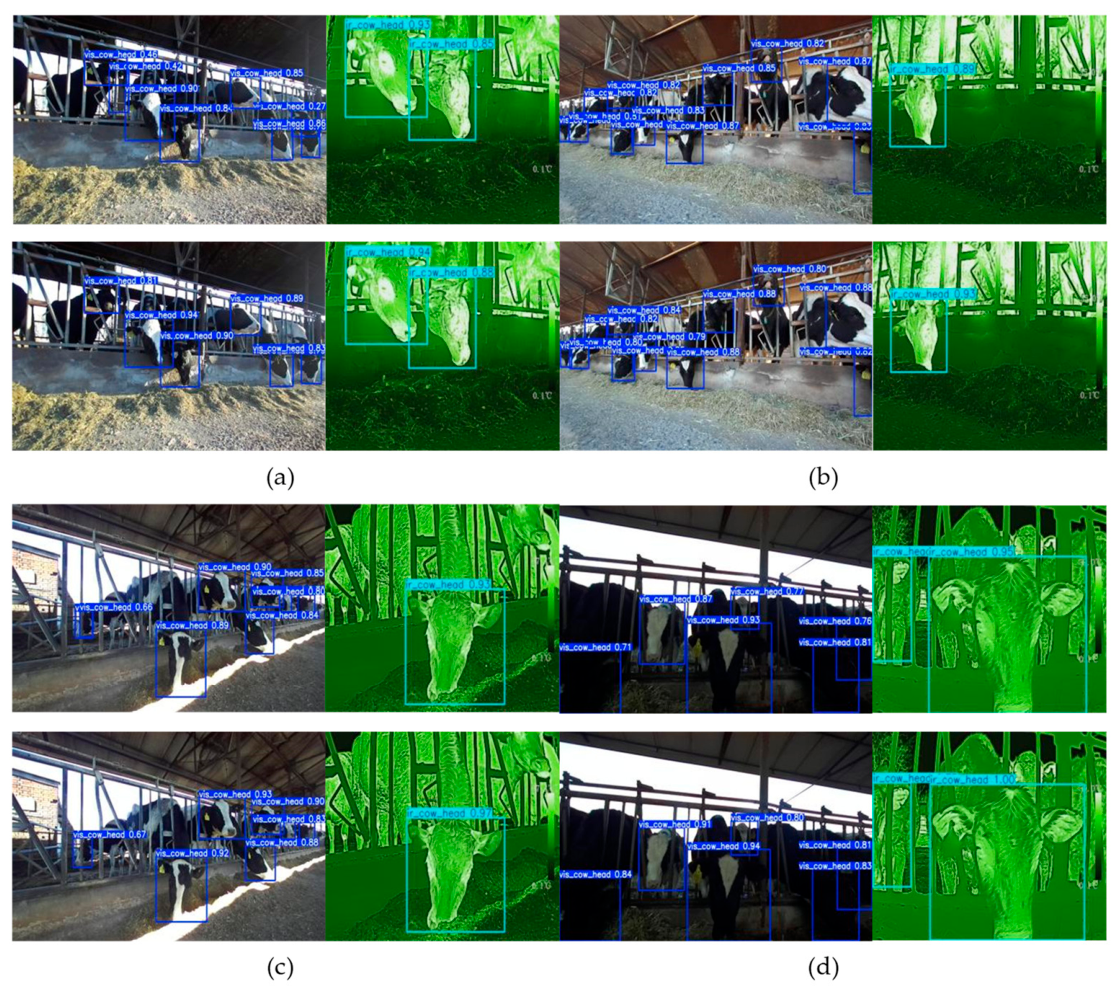
Four difficult farm conditions were selected for qualitative comparison with YOLO11n: strong-light interference, dense multi-cow distribution, local shadow, and low illumination. Figure. 11 shows that YOLO11-AFE gives more stable cow-head locations and higher confidence scores. The improvement is consistent with the roles of the three modules: ADown alleviates information loss in downsampling, C3k2_FE improves adaptation between visible and infrared appearances and enhances fine details, and SPPF_ECA reweights important high-level channels. These visual results support the quantitative finding that the model is more robust across challenging dual-light farm scenes.
3.2. Ablation Study Analysis
The influence of ADown, C3k2_FE, and SPPF_ECA was analysed through ablation experiments, with YOLO11n serving as the reference model. Table 3 lists the results. When only ADown was introduced, parameters decreased from 2.59M to 2.04M and FLOPs from 6.44 to 5.17, reductions of 21.24% and 19.72%. At the same time, visible-light Precision rose from 93.11% to 97.37%, and infrared mAP@0.5:0.95 rose from 90.26% to 91.01%, indicating that ADown preserves useful features while lowering computation. Adding only C3k2_FE raised visible-light mAP@0.5 and mAP@0.5:0.95 by 1.75 and 1.62 percentage points and raised infrared mAP@0.5:0.95 by 1.19 percentage points, showing stronger dual-modal representation. When only SPPF_ECA was used, visible-light Precision and mAP@0.5 increased by 3.15 and 1.55 percentage points, confirming the benefit of channel reweighting in high-level features.
The combined settings further reveal that the modules are complementary. ADown plus C3k2_FE kept parameters and FLOPs at 2.14M and 5.27 while maintaining good accuracy for both modalities. C3k2_FE together with SPPF_ECA raised visible-light Precision to 97.43%, implying that modality adaptation and channel attention reinforce each other. The complete YOLO11-AFE model used 2.14M parameters and 5.27 GFLOPs, which are 17.37% and 18.17% lower than the baseline. It achieved 97.51%, 96.26%, and 70.64% for visible-light Precision, mAP@0.5, and mAP@0.5:0.95, with gains of 4.40, 2.15, and 1.36 percentage points. For infrared pseudo-colour images, the metrics reached 95.92%, 99.07%, and 91.41%, with gains of 1.65, 0.15, and 1.15 percentage points. These ablations confirm that the three components jointly improve accuracy and efficiency, making the detector suitable for inspection-robot edge devices.
3.3. Heterogeneous-Camera Target Association Results Analysis
The synchronized dual-light test set was used to evaluate the heterogeneous-camera association module. YOLO11-AFE first produced cow-head boxes in the visible-light and infrared pseudo-colour images. These boxes were then matched by the improved Hungarian algorithm, whose cost integrates IoU and Euclidean distance between target-box centres. The overall association results are summarized in Table 4.
The target association accuracy is computed as:
where denotes the target association accuracy, represents the number of correctly matched cow-head target pairs, and is the total number of cow-head target pairs determined from manual annotation.
Table 4 reports 187 manually confirmed cow-head pairs from 122 synchronized dual-light test-image pairs. The algorithm associated all 187 pairs correctly, and neither mismatches nor missed matches occurred; the matching accuracy was therefore 100%. This result indicates that reliable correspondence can be established between visible-light and infrared pseudo-colour targets. The test set contains multi-cow scenes, partial occlusions, and inconsistent target numbers, where direct pairing can easily fail. By using IoU and relative centre-distance difference in a global assignment framework, the method satisfies the one-to-one association requirement for dual-light cow-head targets.
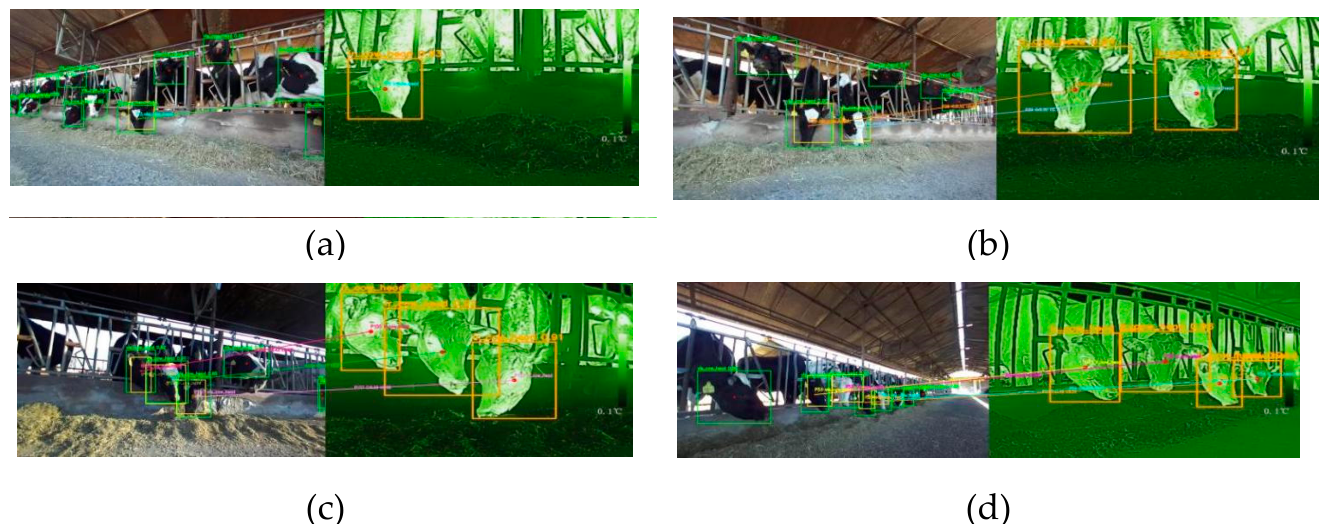
Figure. 12 shows examples of heterogeneous-camera association. Lines connect boxes that correspond to the same cow across the visible-light and infrared pseudo-colour views. The examples demonstrate that the algorithm can maintain cross-modal matching in multi-cow scenes and under spatial offset. Matches that do not pass the constraints are removed from the final set, which avoids erroneous forced associations. This provides a dependable basis for subsequent local registration, facial-region recognition, and radiometric temperature extraction at the same inspection moment.
Figure 12.
Visualization results of cow-head target association between heterogeneous cameras. (a) Association result in a single-target scene; (b) Association result in a two-target scene; (c) Association result in a three-target scene; (d) Association result in a four-target scene.
Figure 12.
Visualization results of cow-head target association between heterogeneous cameras. (a) Association result in a single-target scene; (b) Association result in a two-target scene; (c) Association result in a three-target scene; (d) Association result in a four-target scene.
3.4. Edge-Device Deployment Performance Analysis
The proposed system was deployed on a quadruped inspection robot to evaluate real-time edge performance. The robot carried an NVIDIA Jetson Orin NX 16GB computing module, and the runtime environment included Jetpack 5.1.1, CUDA 11.4, cuDNN 8.6.0, and TensorRT 8.6.0. The platform provides about 100 TOPS of AI computing capability with a maximum power consumption of 25 W. Native PyTorch and TensorRT-accelerated inference were both tested. Figure. 13 presents the deployment interface, and Table 5 summarizes average inference time, end-to-end processing time, and frame rate.
Figure 13.
Deployment results on the inspection robot edge computing platform.
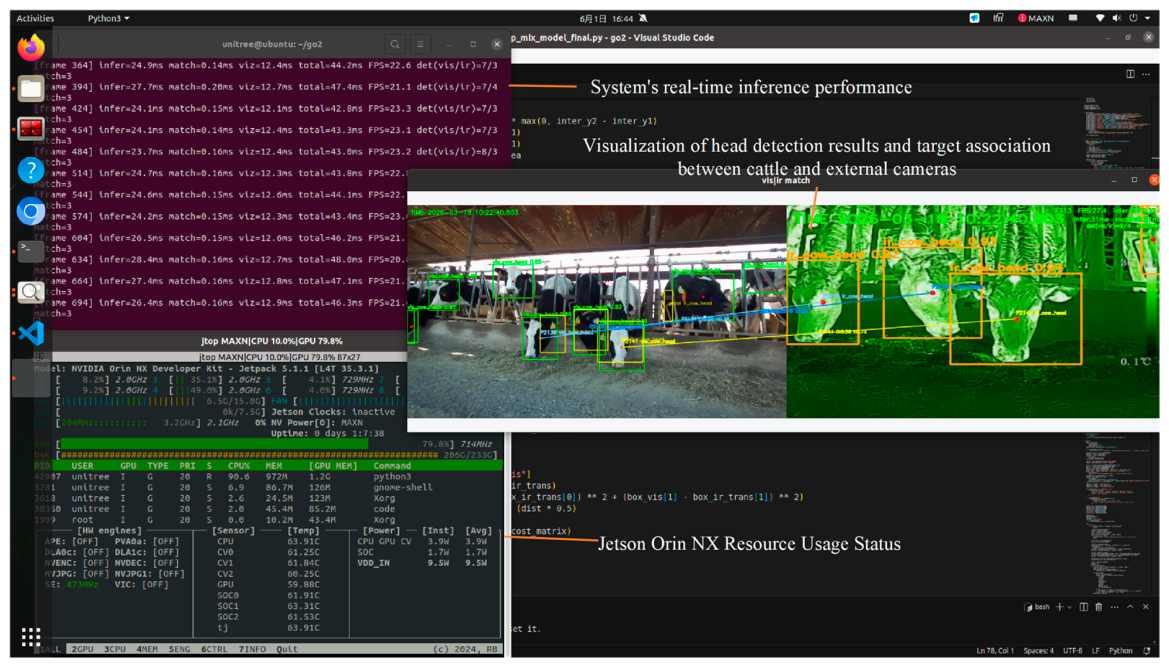
Under PyTorch, the average inference time was 38.14 ms, giving 26.22 FPS. Including inference, bounding-box parsing, and target association, the core process required 40.81 ms, equivalent to 24.50 FPS. With TensorRT, inference time fell to 24.23 ms and the inference speed increased to 41.26 FPS; the core-process time was shortened to 27.24 ms, or 36.71 FPS. Relative to PyTorch, TensorRT reduced inference time by 36.47%, raised inference FPS by 57.36%, reduced core-process time by 33.25%, and increased core-process FPS by 49.84%.
The Hungarian matching step required only 0.12 ms under both inference modes. Its proportions of the core-process time were 0.289% for PyTorch and 0.444% for TensorRT, showing that association is not the runtime bottleneck. These deployment results show that the pipeline can operate in real time on the inspection-robot edge platform, while TensorRT provides further acceleration. Thus, the system meets the practical requirements of cow-head detection and heterogeneous-camera association in complex farm environments.
4. Discussion
This study developed a compact cow-head detector and a heterogeneous-camera association method for robotic barn inspection. A visible–thermal acquisition and analysis platform was constructed on a quadruped robot with edge computing. In complex dairy-farm scenes, the platform achieved real-time cow-head detection and cross-camera association, providing target-level correspondence between visible-light and infrared pseudo-colour images. Recent studies have shown that facial thermal regions in cattle, including the eyes, muzzle, nostrils, ears, and horns, can be automatically located or analysed for non-contact temperature monitoring [29,30]. Therefore, the present framework can be regarded as a front-end perception module for future facial-temperature extraction in robotic dairy monitoring.
4.1. Innovation
Many existing cattle-perception studies use fixed cameras or a single visible-light stream for detection, tracking, or identity recognition. These works are useful for farm perception, but a mobile inspection robot must deal with additional factors, including crowded cows, fence occlusion, viewpoint variation, overexposure, weak illumination, and low-texture infrared images. Compared with those studies, the present work moves from single-modal cow detection to visible–thermal cow-head detection and target-level cross-camera association on a moving robot. The obtained correspondence between visible-light and infrared pseudo-colour images provides the first step toward later local registration, facial-region recognition, and radiometric temperature extraction.
The comparative experiments were carried out with representative detection models under the same conditions. All models used the same visible–thermal cow-head dataset, data split, input resolution, training epochs, and hardware platform. The results show that YOLO11-AFE maintained high accuracy and stable detection performance under complex illumination, weak infrared texture, and multi-cow scenes, while reducing parameters and computational cost. This balance between accuracy, robustness, and lightweight computation is important for practical deployment on inspection-robot edge hardware.
The target-association design is also different from image-level cross-modal registration. Instead of aligning whole visible-light and infrared images, it uses detected cow-head boxes as the association units. The cost matrix integrates IoU and centre-distance difference relative to the image centre, and the improved Hungarian matching algorithm selects the global assignment while removing abnormal pairs. Owing to this target-level formulation, the method has low computational cost and is suitable for real-time processing on embedded robot hardware.
4.2. Application Scenario
The proposed method can serve as the front-end perception module for non-contact facial-temperature monitoring during robotic dairy inspection. It detects cow heads in synchronized visible-light and infrared pseudo-colour images and associates detections belonging to the same animal across the two camera views. This target-level correspondence is important in multi-cow scenes, because thermal information must be assigned to the correct individual before it can support animal-level monitoring.
As shown in Figure 14, the potential workflow includes visible–thermal image acquisition, cow-head detection, heterogeneous-camera target association, local registration of matched head regions, facial-region recognition, and temperature extraction from the corresponding infrared temperature matrix. Visible-light images provide structural cues for stable localization, whereas infrared images provide thermal information. Therefore, the proposed framework can provide a practical basis for future robotic monitoring of facial thermal regions such as the eyes, muzzle, nostrils, ears, and horns [29,30,31,32,33].
4.3. Limitations and Future Work
Several limitations remain. First, the present study verified cow-head detection, cross-camera association, and edge deployment, but it did not complete the full facial-temperature extraction pipeline. Future work should combine the proposed framework with local visible–thermal registration, facial-region recognition, radiometric temperature extraction, and individual identification.
Second, the present system still depends partly on visible-light image quality. At night or under extremely weak illumination without auxiliary lighting, visible images may lose clear contours, texture details, and facial-region cues, which can affect head detection, target separation, and later visible-to-infrared local registration. Infrared pseudo-colour images are less affected by ambient visible light and can provide stable thermal radiation, but their limited texture is insufficient for independent fine localization of specific facial regions. Thus, the current system is best suited to daytime, indoor lighting, or scenarios with supplementary illumination. Future research should exploit the complementarity between visible structural information and infrared thermal information more deeply to improve night-time and low-light robustness.
5. Conclusions
This work investigated dual-light perception for inspection robots and focused on cow-head detection and cross-modal association in visible-light and infrared pseudo-colour images. A compact YOLO11-AFE detector and an improved Hungarian association algorithm were developed. The conclusions are as follows.
- By introducing ADown, C3k2_FE, and SPPF_ECA, YOLO11-AFE improved cow-head detection in both modalities. Compared with YOLO11n, the visible-light Precision, mAP@0.5, and mAP@0.5:0.95 increased by 4.40, 2.15, and 1.36 percentage points. The corresponding gains on the infrared pseudo-colour subset were 1.65, 0.15, and 1.15 percentage points.
- The detector contained 2.14M parameters and required 5.27 GFLOPs, which are 17.37% and 18.17% lower than YOLO11n. Therefore, the model reduces computational demand while improving accuracy, making it appropriate for real-time cow-head detection on inspection-robot edge hardware.
- The improved Hungarian association algorithm uses both target-box IoU and the Euclidean distance difference relative to the image centre. In the 122 synchronized dual-light test-image pairs, 187 corresponding cow-head pairs were present and all were associated without mismatches or missed matches. These results indicate that the method can provide reliable cross-modal target-level correspondence for subsequent facial-region localization and radiometric temperature extraction.
Author Contributions
Conceptualization, F.K. and W.S.; methodology, Z.Z.; software, C.X.Z.; validation, S.C.; formal analysis, C.X.Z. and C.Y.Z.; investigation, Z.Z.; resources, F.K.; data curation, C.Y.Z.; writing—original draft preparation, C.X.Z.; writing—review and editing, S.C.; supervision, F.K. and W.S.; project administration, W.S.; funding acquisition, F.K. All authors have read and agreed to the published version of the manuscript.
Funding
This study was funded by the National Key Research and Development Program of China (2024YFD2000305), the Science and Technology Innovation Project of the Chinese Academy of Agricultural Sciences (10-IAED-RC-09-2025), and the Key Research and Development Program of Jilin Province, China (20240303079NC).
Institutional Review Board Statement
In this study, ethical review and approval were not required due to the non-invasive and observational nature of the research. Our procedures ensured that there was no direct contact with the cattle, nor did our methods induce any stress or disrupt the normal activities of the animals. Therefore, the study adhered to ethical guidelines by maintaining a non-intrusive approach that safeguarded the welfare of the cattle involved.
Informed Consent Statement
Written informed consent has been obtained from the owner(s) of animals involved in this study.
Data Availability Statement
Data are available on request from the authors.
Conflicts of Interest
The authors declare that the dataset used in this study was collected at the dairy farm of the Agricultural Machinery Test Station of the Chinese Academy of Agricultural Mechanization Sciences Group Co., Ltd., Changping District, Beijing, China. The farm provided only the experimental site for data collection and had no role in the study design, model development, data analysis, interpretation of results, manuscript writing, or the decision to publish the findings. The authors declare no other conflicts of interest.
Abbreviations
The following abbreviations are used in this manuscript:
| ADown | Adaptive Downsampling |
| AFE | Adaptive Feature Enhancement |
| C3k2_FE | C3k2 with Feature-Adaptive Enhancement |
| ECA | Efficient Channel Attention |
| FiLM | Feature-wise Linear Modulation |
| FLOPs | Floating-Point Operations |
| FPS | Frames Per Second |
| GFLOPs | Giga Floating-Point Operations |
| IoU | Intersection over Union |
| IR | Infrared |
| IRT | Infrared Thermography |
| mAP | Mean Average Precision |
| NMS | Non-Maximum Suppression |
| RGB | Red–Green–Blue |
| SPPF | Spatial Pyramid Pooling-Fast |
| SPPF_ECA | Spatial Pyramid Pooling-Fast with Efficient Channel Attention |
| SSIM | Structural Similarity Index Measure |
| VIS | Visible-light Image |
| YOLO | You Only Look Once |
References
- Liu, Z.; Fan, W.; He, D. Research progress on body temperature detection of dairy cows. Heilongjiang Anim. Sci. Vet. Med. 2018, 2018, 41–44. [Google Scholar] [CrossRef]
- Zhang, L.; Dong, R.; Hou, Y.; et al. Research progress on evaluation indexes and measurement methods of body temperature in dairy cows. Chin. J. Anim. Nutr. 2020, 32, 548–557. [Google Scholar] [CrossRef]
- Mottram, T. Animal board invited review: Precision livestock farming for dairy cows with a focus on oestrus detection. Animal 2016, 10, 1575–1584. [Google Scholar] [CrossRef] [PubMed]
- He, J.; Zhang, X.; Li, S.; et al. Effects of environmental temperature/humidity and measurement location on infrared thermal imaging temperature measurements in dairy cows. J. Zhejiang Univ. (Agriculture and Life Sciences Edition) 2020, 46, 500–508. [Google Scholar] [CrossRef]
- Violin, G.; Giammarco, M.; Trentin, A.R.; et al. Evaluation of ear thermographic imaging as a potential variable for detecting hypocalcemia in postpartum Holstein dairy cows. Animals 2025, 15, 2055. [Google Scholar] [CrossRef] [PubMed]
- Kim, S.; Yamagishi, N.; Ishikawa, S.; Tsuchiaka, S. Unique temperature change patterns in calves’ eyes and muzzles: A non-invasive approach using infrared thermography and object detection. Front. Vet. Sci. 2025, 12, 1548906. [Google Scholar] [CrossRef] [PubMed]
- Wang, Z.; Wang, S.; Wang, C.; Zhang, Y.; Zong, Z.; Wang, H.; Su, L.; Du, Y. A non-contact cow oestrus monitoring method based on the thermal infrared images of cows. Agriculture 2023, 13, 385. [Google Scholar] [CrossRef]
- Shu, H.; Ma, M.; Tucker, C.B.; et al. Automated collection of facial temperatures in dairy cows via improved YOLOv8 object detection and pose estimation models. Comput. Electron. Agric. 2024, 219, 108614. [Google Scholar] [CrossRef]
- Guo, S.S.; Lee, K.H.; Chang, L.; et al. Development of an automated body temperature detection platform for face recognition in cattle with YOLO V3-Tiny deep learning and infrared thermal imaging. Appl. Sci. 2022, 12, 4036. [Google Scholar] [CrossRef]
- Michelena, A.; Fontenla-Romero, O.; Calvo-Rolle, J.L. A review and future trends of precision livestock over dairy and beef cow cattle with artificial intelligence. Log. J. IGPL 2025, jzae111. [Google Scholar] [CrossRef]
- Song, H.; Wang, Y.; Deng, H.; et al. Research progress of intelligent monitoring technology for large-scale dairy cows based on video analysis. J. South China Agric. Univ. 2024, 45, 649–660. [Google Scholar] [CrossRef]
- Tassinari, P.; Bovo, M.; Benni, S.; et al. A computer vision approach based on deep learning for the detection of dairy cows in free stall barn. Comput. Electron. Agric. 2021, 182, 106030. [Google Scholar] [CrossRef]
- Tian, F.; Zhang, L.; Zhang, S.; et al. Selective feeding behaviour recognition method for dairy cows based on inspection robot and improved RT-DETR. Trans. Chin. Soc. Agric. Mach. 2025, 56, 258–267. Available online: https://www.j-csam.org/jcsam/article/abstract/20250625.
- Bumbálek, R.; Stehlík, R.; Zoubek, T.; et al. Automated detection and localisation of hoof diseases in dairy cattle using an integrated computer vision and infrared thermography system. Comput. Electron. Agric. 2026, 243, 111404. [Google Scholar] [CrossRef]
- Wang, Y.; Chen, T.; Li, B.; et al. Automatic identification and analysis of multi-object cattle rumination based on computer vision. J. Anim. Sci. Technol. 2023, 65, 519–534. [Google Scholar] [CrossRef] [PubMed]
- Chen, Y.; Zhong, P. Research on cross-modal feature matching algorithm based on Transformer. Sci. Technol. Innov. 2025, 22, 114–117. [Google Scholar]
- Wang, D.; Liu, J.; Fan, X.; et al. Unsupervised misaligned infrared and visible image fusion via cross-modality image generation and registration. In Proceedings of the International Joint Conference on Artificial Intelligence, 2022. [Google Scholar] [CrossRef] [PubMed]
- Turner, D.; Lucieer, A.; Malenovský, Z.; et al. Spatial co-registration of ultra-high resolution visible, multispectral and thermal images acquired with a micro-UAV over Antarctic moss beds. Remote Sens. 2014, 6, 4003–4024. [Google Scholar] [CrossRef]
- Fu, C.; Ren, L.; Wang, F. Cattle behaviour recognition and tracking method based on improved YOLOv8. Trans. Chin. Soc. Agric. Mach. 2024, 55, 1–10. [Google Scholar] [CrossRef]
- Yang, S.; Sun, Y.; Han, M.; et al. Research progress on infrared and visible image registration technology. J. Detect. Control 2024, 46, 1–12. [Google Scholar] [CrossRef]
- Zhan, X. Research on infrared and visible image registration algorithms in complex scenes. Doctoral dissertation, University of Chinese Academy of Sciences, Chengdu, China, 2022. [Google Scholar] [CrossRef]
- Ben-Shoushan, R.; Brook, A. Fused thermal and RGB imagery for robust detection and classification of dynamic objects in mixed datasets via pre-trained high-level CNN. Remote Sens. 2023, 15, 723. [Google Scholar] [CrossRef]
- Ruifeng, Z.H.A.N.G.; Shanshan, C.A.O.; Fantao, K.O.N.G.; et al. Lightweight cattle face identity recognition method based on improved DenseNet121[J]. Trans. Chin. Soc. Agric. Eng. 2026, 42(3), 212–220. [Google Scholar] [CrossRef]
- NEKRASOV, V.; DHARMASIRI, T.; SPEK, A.; et al. Real-time joint semantic segmentation and depth estimation using asymmetric annotations[EB/OL]. arXiv. 2019. Available online: https://arxiv.org/abs/1809.04766.
- Zhiqiang, C.H.E.N.; Xiaohui, L.E.I.; Yang, L.I.U.; et al. Growth quality detection and binocular localization method for orchard pears based on improved YOLO v8n[J/OL]. Trans. Chin. Soc. Agric. Eng. 2026, 1–11. Available online: https://link.cnki.net/urlid/11.2047.S.20260514.1738.028. [CrossRef]
- Suiyan, T.A.N.; Lei, Z.H.O.N.G.; Changjiang, L.I.U.; et al. Design and experiment of sowing performance detection system for leafy vegetable plug seedlings based on YOLO11n[J]. Trans. Chin. Soc. Agric. Eng. 2026, 42(1), 25–36. [Google Scholar] [CrossRef]
- Wang, Q.; Wu, B.; Zhu, P.; Li, P.; Zuo, W.; Hu, Q. ECA-Net: Efficient Channel Attention for Deep Convolutional Neural Networks. Proc. IEEE/CVF Conf. Comput. Vis. Pattern Recognit. (CVPR), Seattle, WA, USA, 2020; pp. 11534–11542. [Google Scholar] [CrossRef]
- Jin, Z.H.A.N.G.; Hao, G.U.O.; Yulong, S.U.N.; et al. Dynamic Weapon-target Assignment based on Variable Time Domain Hungarian Algorithm[J]. Acta Armamentarii 2025, 46(S2), 395–401. [Google Scholar] [CrossRef]
- Shu, H.; Ma, M.; Tucker, C.B.; et al. Automated collection of facial temperatures in dairy cows via improved YOLOv8 object detection and pose estimation models. Comput. Electron. Agric. 2024, 219, 108614. [Google Scholar] [CrossRef]
- Kim, S.; Yamagishi, N.; Ishikawa, S.; Tsuchiaka, S. Unique temperature change patterns in calves’ eyes and muzzles: A non-invasive approach using infrared thermography and object detection. Front. Vet. Sci. 2025, 12, 1548906. [Google Scholar] [CrossRef] [PubMed]
- Violin, G.; Giammarco, M.; Trentin, A.R.; et al. Evaluation of ear thermographic imaging as a potential variable for detecting hypocalcemia in postpartum Holstein dairy cows. Animals 2025, 15, 2055. [Google Scholar] [CrossRef] [PubMed]
- Algra, M.; de Keijzer, L.; Arndt, S.S.; van Eerdenburg, F.J.C.M.; Goerlich, V.C. Evaluation of the thermal response of the horns in dairy cattle. Animals 2023, 13, 500. [Google Scholar] [CrossRef] [PubMed]
- Mongillo, P.; Giaretta, E.; Fiore, E.; Fabbri, G.; Stefanon, B.; Degano, L.; Vicario, D.; Gabai, G. Factors affecting the applicability of infrared thermography as a measure of temperament in cattle. Vet. Sci. 2025, 12, 913. [Google Scholar] [CrossRef] [PubMed]
Figure 14.
Workflow and application scenario of cow-head detection and heterogeneous-camera target association in the inspection robot vision system.
Figure 14.
Workflow and application scenario of cow-head detection and heterogeneous-camera target association in the inspection robot vision system.
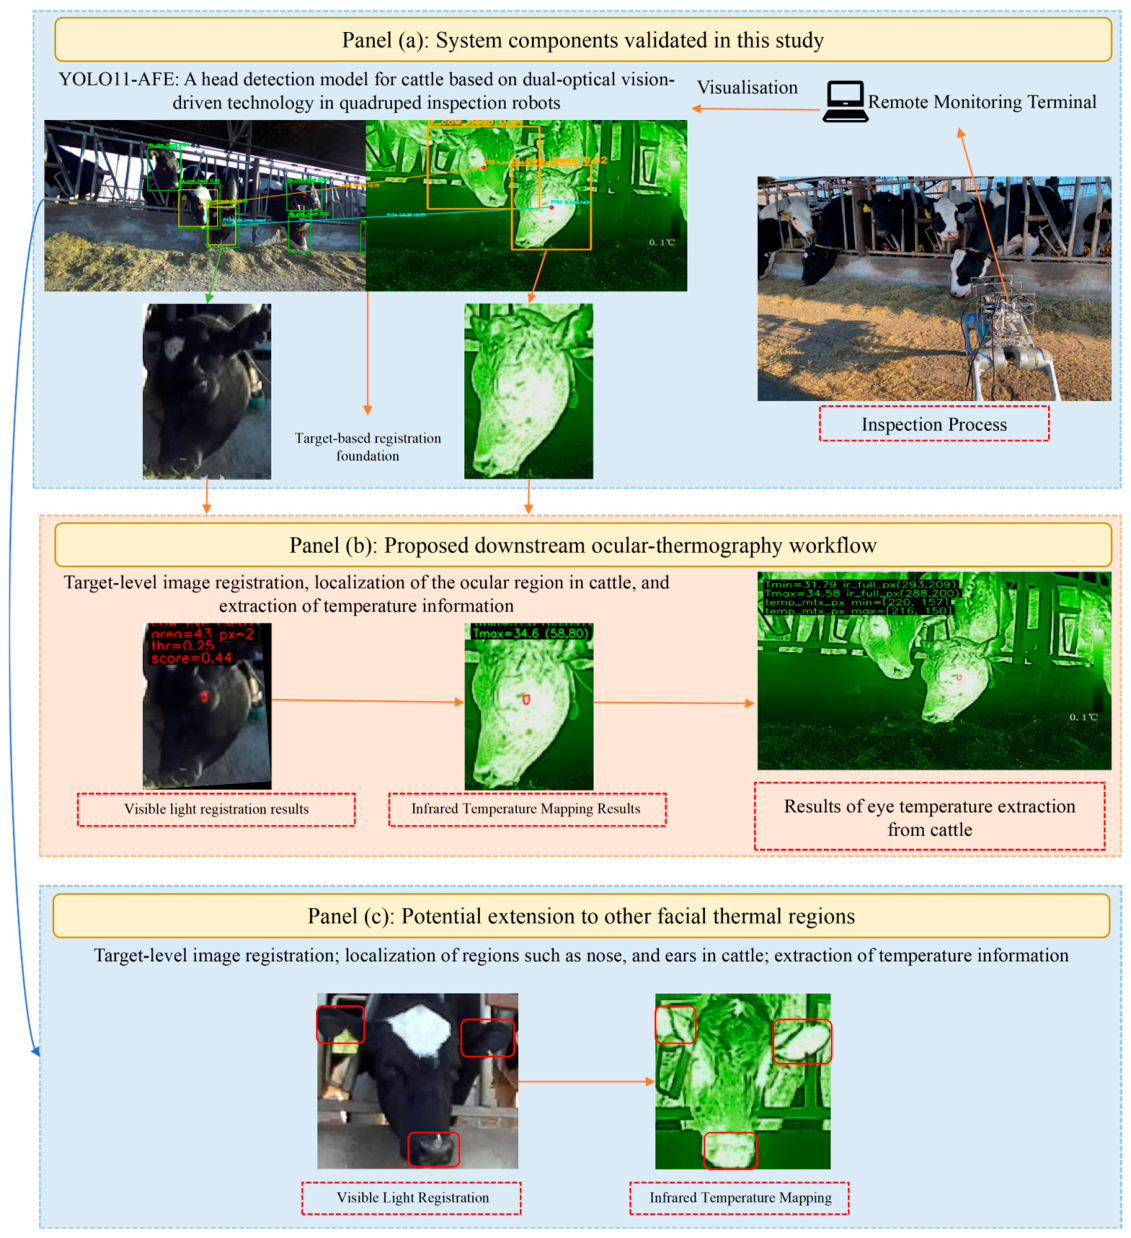

Table 1.
Statistical distribution of the dataset (Unit: sheets).
| Number of Cattle/Figure | Visible images(VIS) | Infrared pseudo-colour image(IR) | ||||
| Train | Val | Test | Train | Val | Test | |
| 1 | 3 | 1 | 1 | 544 | 74 | 72 |
| 2 | 7 | 1 | 1 | 297 | 38 | 39 |
| 3 | 73 | 4 | 4 | 113 | 7 | 8 |
| 4 | 104 | 17 | 18 | 19 | 2 | 2 |
| 5 | 222 | 27 | 23 | 5 | 1 | 1 |
| 6 | 202 | 24 | 26 | 0 | 0 | 0 |
| 7 | 174 | 20 | 22 | 0 | 0 | 0 |
| 8 | 81 | 6 | 8 | 0 | 0 | 0 |
| 9 | 40 | 9 | 5 | 0 | 0 | 0 |
| 10 | 35 | 2 | 4 | 0 | 0 | 0 |
| 11-16 | 37 | 11 | 10 | 0 | 0 | 0 |
| Total | 978 | 122 | 122 | 978 | 122 | 122 |
Table 2.
Detection results of different models on visible and infrared pseudo-colour thermal image test sets.
Table 2.
Detection results of different models on visible and infrared pseudo-colour thermal image test sets.
| Model | Modality | P/% | mAP0.5/% | mAP0.5:0.95/% | Params(M) | FLOPs(G) |
| RT-DETR_L | VIS | 92.98 | 92.84 | 68.04 | 32.81 | 108 |
| IR | 89.23 | 96.16 | 88.61 | 32.81 | 108 | |
| Faster-RCNN | VIS | 93.25 | 86.54 | 61.11 | 41.3 | 267.86 |
| IR | 95.34 | 92.20 | 82.98 | 41.3 | 267.86 | |
| YOLOV5n | VIS | 95.27 | 94.56 | 68.64 | 2.51 | 7.18 |
| IR | 95.79 | 98.56 | 89.64 | 2.51 | 7.18 | |
| YOLOV8n | VIS | 96.17 | 94.81 | 69.47 | 3.01 | 8.2 |
| IR | 93.01 | 98.31 | 90.11 | 3.01 | 8.2 | |
| YOLOV10n | VIS | 96.53 | 95.76 | 68.24 | 2.71 | 8.4 |
| IR | 94.51 | 97.15 | 90.33 | 2.71 | 8.4 | |
| YOLO11n | VIS | 93.11 | 94.11 | 69.28 | 2.59 | 6.44 |
| IR | 94.27 | 98.92 | 90.26 | 2.59 | 6.44 | |
| YOLO12n | VIS | 93.75 | 94.25 | 68.27 | 2.57 | 6.48 |
| IR | 94.84 | 97.96 | 90.20 | 2.57 | 6.48 | |
| YOLO11-AFE | VIS | 97.51 | 96.26 | 70.64 | 2.14 | 5.27 |
| IR | 95.92 | 99.07 | 91.41 | 2.14 | 5.27 |
Table 3.
Ablation experiment.
| ADown | C3k2_FE | SPPF_ECA | Modality | P/% | mAP0.5/% | mAP0.5:0.95/% | Params(M) | FLOPs(G) |
| - | - | - | VIS | 93.11 | 94.11 | 69.28 | 2.59 | 6.44 |
| IR | 94.27 | 98.92 | 90.26 | 2.59 | 6.44 | |||
| √ | - | - | VIS | 97.37 | 94.74 | 69.97 | 2.04 | 5.17 |
| IR | 95.85 | 98.83 | 91.01 | 2.04 | 5.17 | |||
| - | √ | - | VIS | 96.08 | 95.86 | 70.90 | 2.62 | 6.46 |
| IR | 96.08 | 98.74 | 91.45 | 2.62 | 6.46 | |||
| - | - | √ | VIS | 96.26 | 95.66 | 69.70 | 2.59 | 6.44 |
| IR | 94.23 | 98.9 | 91.01 | 2.59 | 6.44 | |||
| √ | √ | - | VIS | 96.88 | 94.73 | 69.15 | 2.14 | 5.27 |
| IR | 96.79 | 98.84 | 90.77 | 2.14 | 5.27 | |||
| √ | - | √ | VIS | 95.16 | 94.56 | 68.96 | 2.11 | 5.25 |
| IR | 94.26 | 98.62 | 90.43 | 2.11 | 5.25 | |||
| - | √ | √ | VIS | 97.43 | 95.61 | 70.69 | 2.62 | 6.46 |
| IR | 93.82 | 98.51 | 91.25 | 2.62 | 6.46 | |||
| √ | √ | √ | VIS | 97.51 | 96.26 | 70.64 | 2.14 | 5.27 |
| IR | 95.92 | 99.07 | 91.41 | 2.14 | 5.27 |
* “√” indicates that the module is used, while “-“ indicates that the module is not used.
Table 4.
Overall target association results of heterogeneous cameras.
| Number of synchronized image pairs in the test set | Number of ground-truth matched target pairs | Correct matches | Mismatches | Missed matches | Matching accuracy/% |
| 122 | 187 | 187 | 0 | 0 | 100% |
Table 5.
Deployment performance comparison of the YOLO11-AFE system on Jetson Orin NX using different inference methods.
Table 5.
Deployment performance comparison of the YOLO11-AFE system on Jetson Orin NX using different inference methods.
| Inference mode | Frame reading time / ms | Inference time / ms | Bounding-box parsing time / ms | Hungarian matching time / ms | Core-process time / ms | Inference FPS | Core-process FPS | Matching proportion / % |
| PyTorch | 2.95 | 38.14 | 2.55 | 0.12 | 40.81 | 26.22 | 24.50 | 0.289 |
| TensorRT | 3.21 | 24.23 | 2.89 | 0.12 | 27.24 | 41.26 | 36.71 | 0.444 |
Disclaimer/Publisher’s Note: The statements, opinions and data contained in all publications are solely those of the individual author(s) and contributor(s) and not of MDPI and/or the editor(s). MDPI and/or the editor(s) disclaim responsibility for any injury to people or property resulting from any ideas, methods, instructions or products referred to in the content. |
© 2026 by the authors. Licensee MDPI, Basel, Switzerland. This article is an open access article distributed under the terms and conditions of the Creative Commons Attribution (CC BY) license.
Copyright: This open access article is published under a Creative Commons CC BY 4.0 license, which permit the free download, distribution, and reuse, provided that the author and preprint are cited in any reuse.


