

Submitted:
18 July 2026
Posted:
20 July 2026
You are already at the latest version
Abstract
Direct pharmacological inhibition of KRAS remains constrained by mutation specificity, tumour heterogeneity and the emergence of resistance, motivating complementary strategies that target proteins associated with KRAS signalling. Here, we constructed a human KRAS-centred protein-association network and integrated network topology, functional enrichment, genomic-location analysis and target-level curation of approved drugs. The resulting network contained 21 proteins and 100 associations and comprised a canonical KRAS–RAF–ERK/PI3K signalling component together with a prominent calcium/calmodulin-associated module. Strict DrugBank curation identified 30 approved target–drug pairs involving six network proteins and 22 unique drugs. After excluding current or historical oncology agents and applying pharmacological-plausibility criteria, six conditional target–drug pairs involving four non-oncology drugs, fostamatinib, trifluoperazine, felodipine and nicardipine, were retained. A targeted literature review found supporting evidence for all four compounds in KRAS-relevant cancer settings. These compounds remain hypothesis-generating candidates rather than validated KRAS-directed therapies. This study provides a compact and reproducible strategy for translating a KRAS-associated protein network into a focused set of indirect target–drug hypotheses for subsequent computational and experimental evaluation.
Keywords:
KRAS
; protein-association network
; drug repurposing
; network pharmacology
Introduction
The human KRAS gene is located at chromosome 12p12.1 and encodes a small GTPase that cycles between GDP-bound and GTP-bound states1,2. In its GTP-bound state, KRAS engages several effector families, including RAF kinases, phosphoinositide 3-kinases and Ral guanine nucleotide dissociation stimulator (RalGDS) proteins3. Across four cancer-mutation databases analysed by Prior et al., KRAS accounted for 75% of RAS-mutant cancers4. In a separate genomic-profiling cohort of 426,706 adult cancer samples, the five most frequent KRAS mutant variants were G12D, G12V, G12C, G13D and G12R, and their distributions varied among tumour types5. Direct inhibition was historically constrained by the picomolar affinity of RAS proteins for guanine nucleotides and the absence of previously recognized allosteric sites6. Discovery of the switch-II pocket in KRAS G12C enabled mutant-selective inhibition6, and phase II studies demonstrated clinical activity of sotorasib and adagrasib in previously treated KRAS G12C-mutant non-small-cell lung cancer7,8. These studies addressed a defined G12C-mutant population rather than the full spectrum of KRAS alterations, and acquired resistance can involve secondary KRAS alterations, changes in other RAS–MAPK components, bypass signalling and histologic transformation9.
Protein-centred network analysis provides a complementary route to target discovery. Binary interaction maps identify pairwise physical associations, whereas affinity-purification mass spectrometry identifies proteins detected with affinity-purified baits and thereby maps co-complex associations10,11. Such maps can reveal functional modules and cell-specific organization of the proteome. Disease-associated proteins also tend to occupy shared neighbourhoods of the human interactome12. Genetic-interaction maps provide a distinct evidence layer: paired perturbation screens identify functional interdependencies between genes without implying direct binding between their protein products13. These evidence types are therefore complementary rather than interchangeable. Together, network topology, physical associations and genetic interactions can prioritize proteins or modules functionally connected to an oncogenic driver and suggest routes for indirect intervention.
Three related strategies illustrate how cancer dependencies may be exploited without requiring a drug to bind KRAS. Synthetic lethality describes a genetic relationship in which combined perturbation of two genes is lethal although either perturbation alone is tolerated14. Selective sensitivity of BRCA1- or BRCA2-deficient cells to PARP inhibition provides an early experimental example15. In KRAS studies, however, published synthetic-lethal hits have overlapped more strongly at the pathway than at the individual-gene level, and their phenotypes are modulated by cellular and genetic context14. Synthetic rescue describes an adaptive alteration in a second gene that restores fitness after perturbation of a therapeutic target; inhibiting the rescuer may therefore resensitize resistant cells16. Indirect pathway intervention instead targets a regulator or effector required to sustain oncogenic signalling. In KRAS-driven preclinical models, PTPN11/SHP2 deletion or inhibition delayed tumour progression without inducing regression, whereas combined SHP2 and MEK inhibition produced sustained tumour control17. The present analysis does not infer synthetic-lethal or synthetic-rescue interactions; these concepts serve as precedents for interrogating KRAS-associated proteins.
Drug repurposing seeks new therapeutic uses for approved or investigational drugs outside their original indications18. Because preclinical testing, safety assessment and, in some cases, formulation development may already have been completed, repurposing can reduce parts of the early development burden; it does not remove the need for mechanistic assessment and efficacy testing in the new indication18. The DrugBank statistics page listed 3,033 approved small-molecule drugs when accessed on 14 July 202619, providing a search space of thousands of approved compounds beyond those designed directly against KRAS. Historically, successful repurposing examples were often identified through pharmacological insight, serendipitous observation or retrospective clinical analysis. More recently, the field has increasingly adopted systematic computational and experimental approaches; however, a fully mature and standardized drug-repurposing pipeline has yet to be established18. Network-proximity analysis further shows that the associations of disease proteins and drug targets in the human interactome can generate testable drug–disease associations, although such predictions require independent validation20.
On this basis, we asked whether a compact KRAS-centred protein-association network could be translated into a tractable set of approved-drug hypotheses. We integrated network topology and functional enrichment with exact human target-level curation of approved drugs, while separating current or historical oncology agents from non-oncology compounds considered for repurposing. We then examined whether the prioritised compounds had literature support in KRAS-relevant cancer settings. The objective was to prioritise indirect target–drug associations for subsequent mechanistic and experimental evaluation.
Results
Construction and Topology of the KRAS-Centred Association Network
A human KRAS-centred protein-association network was constructed using Search Tool for the Retrieval of Interacting Genes/Proteins (STRING) v12.0 with ten first-shell and ten second-shell proteins21. The resulting network contained 21 nodes and 100 edges, with an average node degree of 9.52 and an average local clustering coefficient of 0.797 (Figure 1a). STRING estimated 34 edges for a random protein set of comparable size and reported a protein–protein interaction (PPI)-enrichment P<1×10⁻¹⁶, indicating that the selected proteins formed a densely connected network. Because the protein set was generated through STRING network expansion, this enrichment statistic was interpreted descriptively rather than as an independent enrichment test.
Degree analysis identified CALML3, CALML4, CALML5 and CALML6 as the most highly connected nodes, each with a degree of 18, followed by CALM3 with a degree of 17 (Figure 1c). KRAS had a degree of 11, whereas BRAF and RAF1 each had a degree of 10 and PIK3CA had a degree of 9. The network therefore contained a densely connected calmodulin-related component together with established RAS signalling proteins.
Network partitioning differed between clustering algorithms (Figure 1b). K-means clustering produced three groups, comprising one large cluster, a distinct RASGRF2 cluster and a phosphorylase-kinase cluster containing PHKA1, PHKB and PHKG2. By contrast, MCL with an inflation parameter of 3 produced two broader modules, separating the KRAS–RAF–PI3K signalling component from the calmodulin- and phosphorylase-kinase-associated component. These differences indicate that module assignment in this small, densely connected network is algorithm-dependent.
Phylogenetic co-occurrence and co-expression analyses further showed that the proteins were supported by heterogeneous evidence patterns (Figure 1d,e). Co-occurrence profiles varied across taxonomic groups, whereas co-expression support was concentrated among selected protein pairs. Thus, the combined network should be interpreted as an integrated functional association network rather than a collection of exclusively direct physical interactions.
Functional Enrichment Identifies Two Major Components of the KRAS-Centred Network
Functional enrichment analysis of the 21-node KRAS-centred network revealed both broad signalling functions and more specific calcium/calmodulin-associated activities (Figure 2). Gene Ontology biological-process analysis identified four significant terms, with false discovery rate (FDR) values ranging from 0.0313 to 0.0478 (Figure 2a). These terms included phosphorylation, intracellular signal transduction and regulation of catalytic activity, consistent with the signalling-dominated composition of the network. Associative learning was also enriched, although this term was supported by only four proteins—PDE1B, KRAS, NRGN and BRAF—and was therefore interpreted as a context-dependent annotation rather than a principal function of the network.
Gene Ontology molecular-function analysis produced ten significant terms, eight of which were displayed (Figure 2b). Calmodulin binding was the strongest enrichment, involving 9 of 203 background proteins and showing an FDR of 2.10×10⁻⁹. Additional terms included calmodulin-dependent protein kinase activity, calmodulin-activated cyclic-nucleotide phosphodiesterase activity, phosphorylase kinase activity and broader serine/threonine kinase functions. Collectively, these results identified a coherent functional component involving calmodulin-regulated kinases, PDE1 phosphodiesterases and phosphorylase-kinase subunits.
Kyoto encyclopedia of genes and genomes (KEGG) analysis returned 105 significant pathways, with the eight highest-ranking pathways by Signal displayed in Figure 2c. Insulin signalling was the highest-ranked pathway, involving 13 of 132 annotated background proteins and showing an FDR of 6.89×10⁻²¹. Other prominently enriched terms included glioma, neurotrophin signalling, long-term potentiation, alcoholism, GnRH signalling, oestrogen signalling and renin secretion. Inspection of the matching-protein assignments indicated extensive reuse of the same RAS–RAF–PI3K and calcium/calmodulin-associated proteins across these pathways. The pathway names should therefore not be interpreted as independent biological mechanisms, but rather as overlapping annotations generated by a shared signalling core.
Reactome analysis returned 114 significant pathways and provided a more mechanistically resolved separation of the network (Figure 2d). Glycogen breakdown was the highest-ranked displayed term, involving CALM3 and the phosphorylase-kinase subunits PHKA1, PHKB and PHKG2. Cam-PDE1 activation and calmodulin-induced events identified a second calcium-dependent component involving CALM3, PDE1B, PDE1C and CAMKK1. In parallel, RAF activation and signalling to ERKs represented the canonical KRAS effector branch, whereas the FGFR4- and PDGFRA-associated terms largely reflected reuse of KRAS, SOS1, PIK3CA and related downstream signalling proteins.
Together, the enrichment analyses support two major functional components within the selected network: a canonical KRAS–RAF–ERK/PI3K signalling component and a calcium/calmodulin-regulated component involving phosphodiesterase activity and glycogen metabolism. Because the protein set was obtained by expanding a STRING network around a single KRAS seed, these enrichments were interpreted as functional annotation of the selected interaction neighbourhood rather than as independent enrichment evidence for KRAS alone.
Genomic Distribution of the KRAS-Associated Network
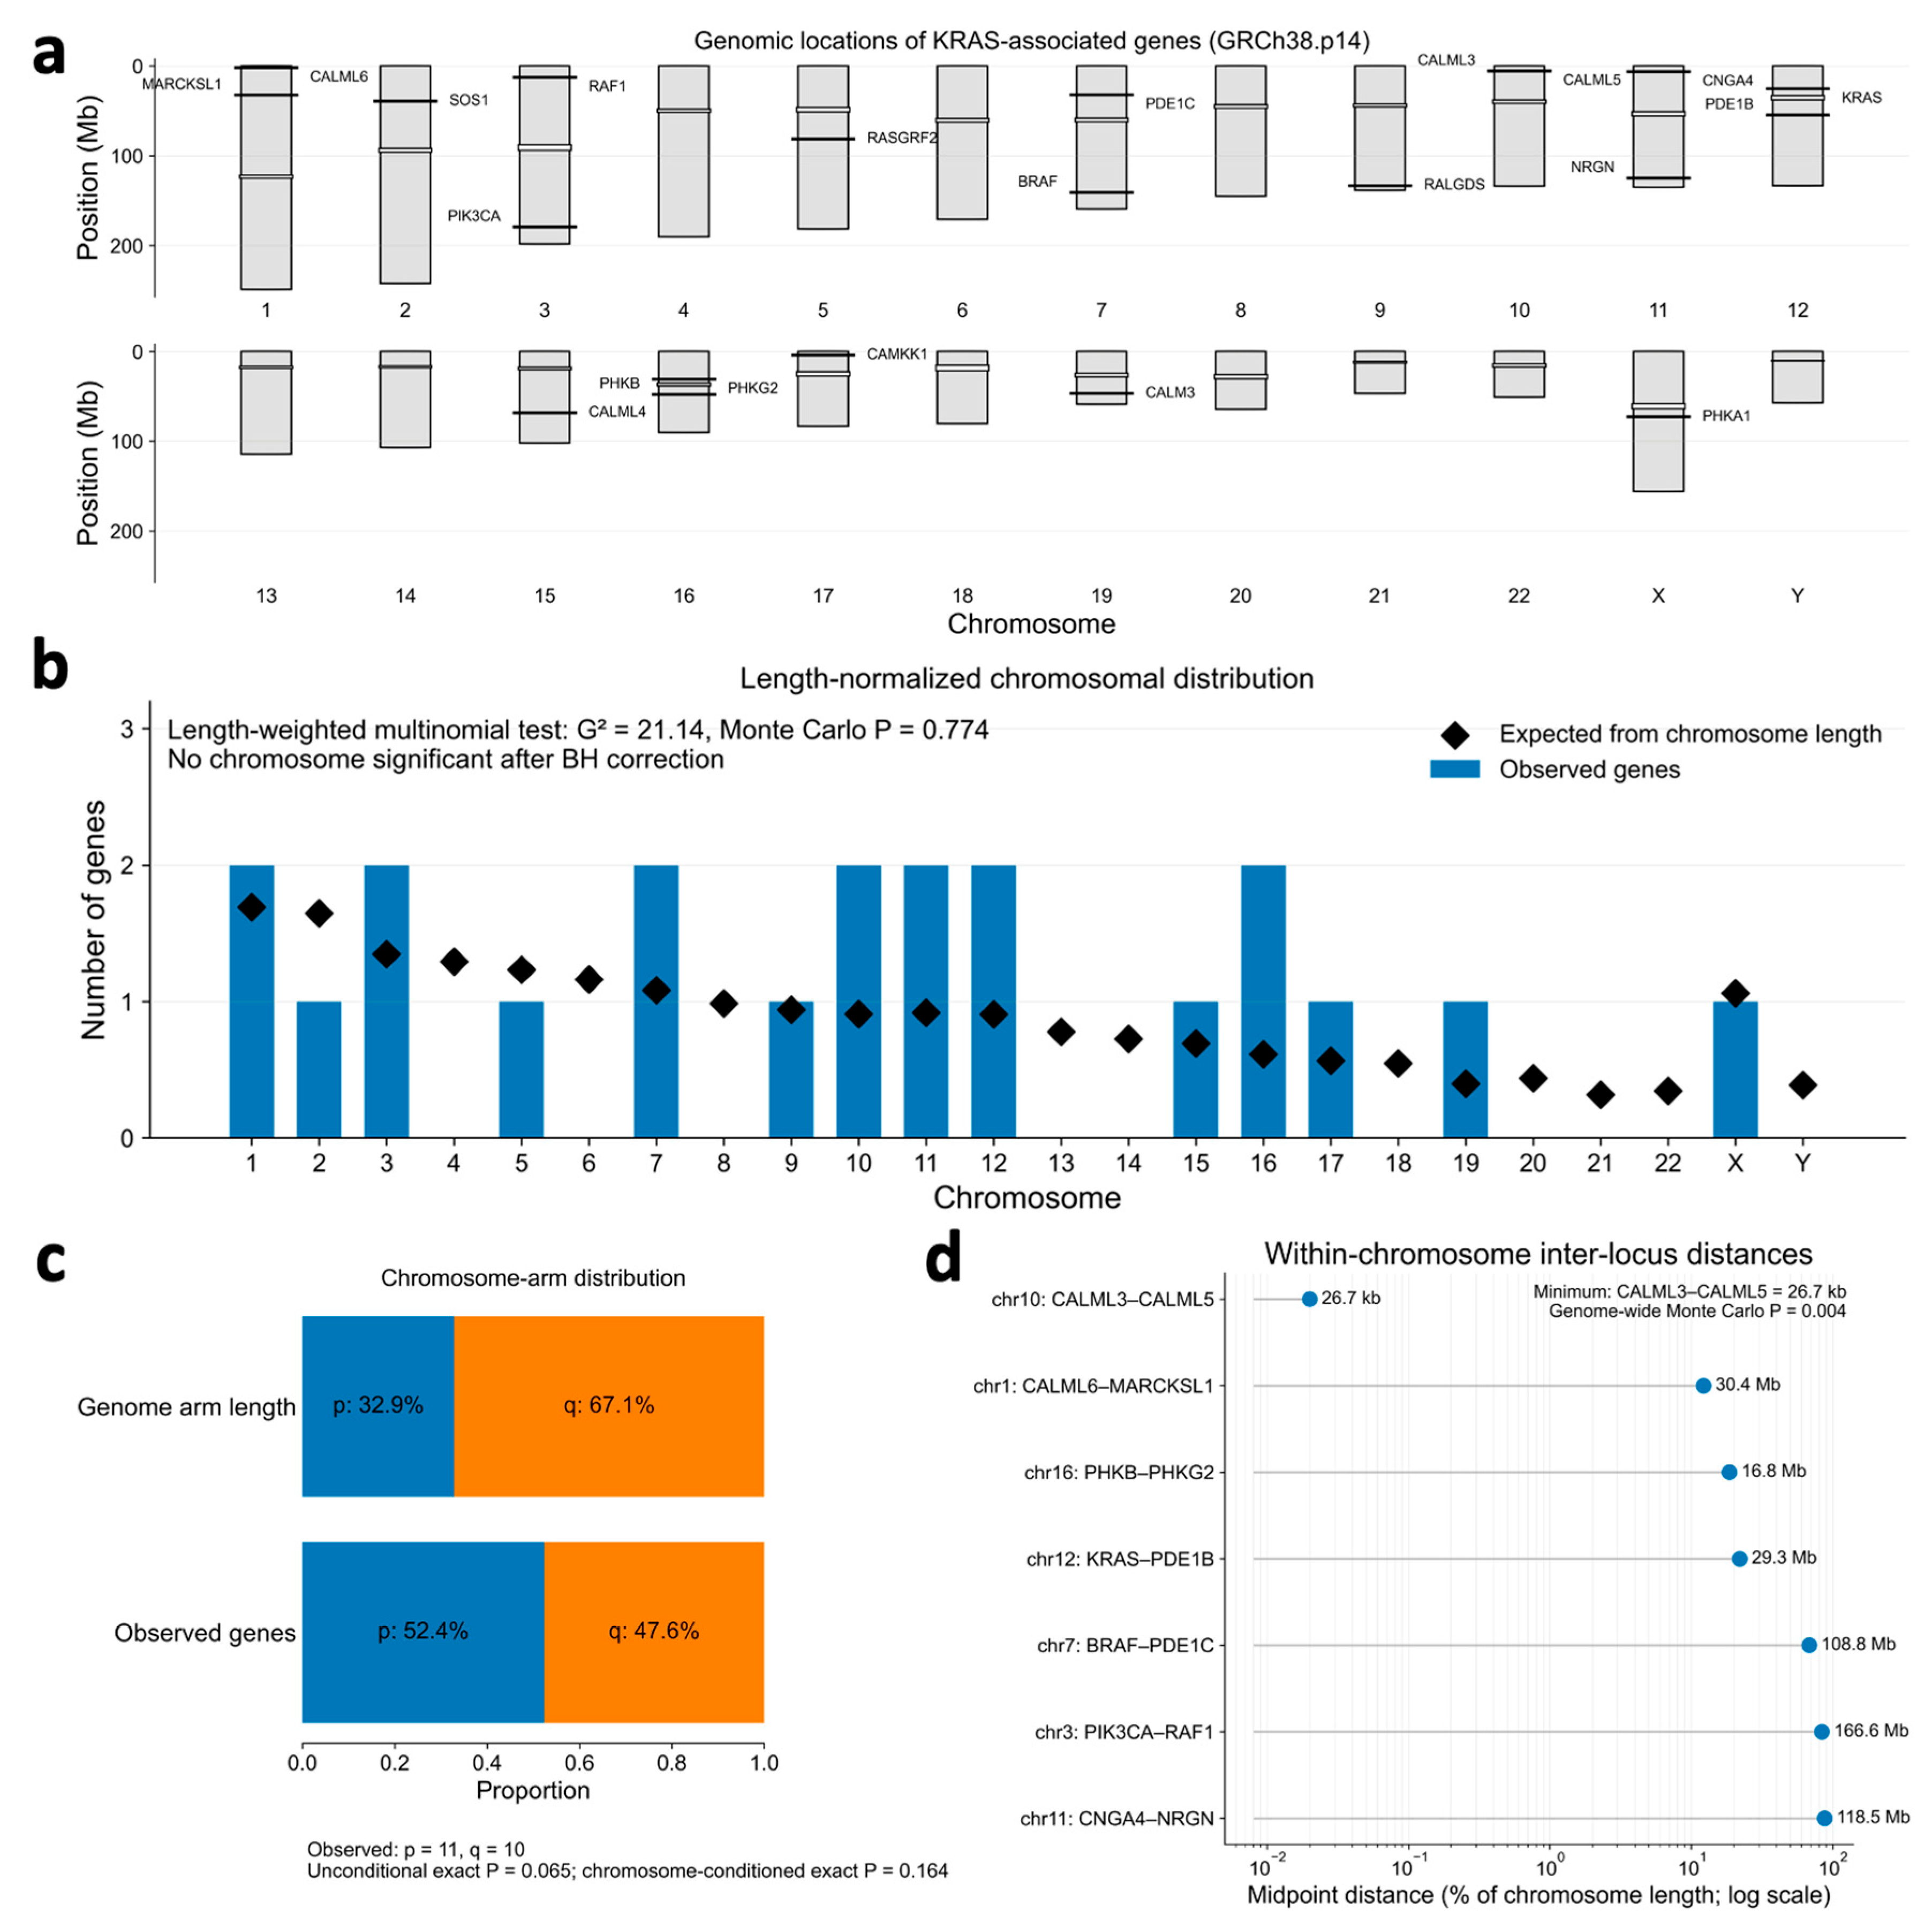
The 21 KRAS-associated genes were distributed across 14 of the 24 primary human chromosomes, with no chromosome containing more than two genes (Figure 3a). Chromosomes 1, 3, 7, 10, 11, 12 and 16 each contained two network members, whereas the remaining occupied chromosomes contained a single gene.
To determine whether this distribution reflected chromosome size, the observed counts were compared with expectations calculated from GRCh38.p14 chromosome lengths. The chromosome-level distribution was compatible with a chromosome-length-weighted multinomial model (G2=21.14, Monte Carlo P=0.774; Figure 3b). Although chromosome 16 had the largest observed-to-expected ratio, no chromosome showed significant over-representation after correction for testing across the 24 primary chromosomes. These results indicate that the selected KRAS-associated genes were broadly dispersed rather than preferentially concentrated on specific chromosomes.
Eleven genes were located on chromosome p arms and ten on q arms (Figure 3c). By comparison, p arms accounted for 32.9% of the total non-centromeric primary-chromosome length. The apparent excess of p-arm genes approached, but did not reach, significance under an unconditional length-based exact binomial test (P=0.0653). After conditioning on the chromosomes represented in the observed gene set, the expected number of p-arm genes was 7.60 and the exact Poisson-binomial test remained non-significant (P=0.164). Thus, the data did not provide sufficient evidence for preferential localization to either chromosome arm.
Seven chromosomes contained two network genes, enabling analysis of within-chromosome distances (Figure 3d). Six pairs were separated by 16.8–166.6 Mb, whereas CALML3 and CALML5 were separated by only 26.7 kb at chromosome 10p15.1, corresponding to 0.0200% of chromosome 10 length. A genome-wide length-weighted Monte Carlo analysis indicated that an equally or more closely spaced pair would occur among 21 random loci with probability P=0.00356. Although statistically unusual under the specified null model, this observation involved two members of the same CALML gene family and was therefore interpreted as localized family-associated genomic organization rather than evidence of broader KRAS-network-specific clustering.
Curated Mapping of Approved Drugs to KRAS-Associated Targets
Strict target-level curation identified 30 DrugBank target–drug pair records involving approved drugs, six KRAS-associated proteins and 22 unique drugs (Table 1). Most records involved small molecules (29 of 30, 96.7%), and inhibitors accounted for 25 of the 30 target–drug pairs (83.3%). Sixteen pairs involved drugs with current direct antitumor indications, one involved a historically approved antitumor drug whose approval was subsequently withdrawn, and 13 involved drugs without an approved cancer indication.
Drugs with current or historical oncology use were retained in Table 1 to show the existing pharmacological coverage of the KRAS-associated targets. However, they were not included in the primary repurposing candidate set because the main objective was to identify approved non-oncology drugs that could potentially be redirected toward KRAS-associated disease mechanisms. This scope-based exclusion should not be interpreted as evidence that these oncology drugs lack activity in other KRAS-driven cancer settings.
After indication-based and pharmacological-plausibility filtering, six conditional target–drug pairs were retained. These pairs involved five protein targets but only four unique drugs: fostamatinib, trifluoperazine, felodipine and nicardipine. The six conditional associations are shown in bold in Table 1. Pair-level target–drug mappings and repurposing classifications are reported in Table 1. The underlying DrugBank records remain accessible through DrugBank and are not redistributed in the project repository.
Thus, the screening identified six candidate associations rather than six distinct candidate drugs. The four unique drugs were taken forward for subsequent statistical summary and chemical-structure presentation in Figure 4. These compounds were considered hypothesis-generating candidates and not validated treatments, because the network and DrugBank analyses establish target mapping and repurposing plausibility but do not themselves demonstrate efficacy in KRAS-driven experimental models.
Prioritization of Four Approved Non-Oncology Drugs
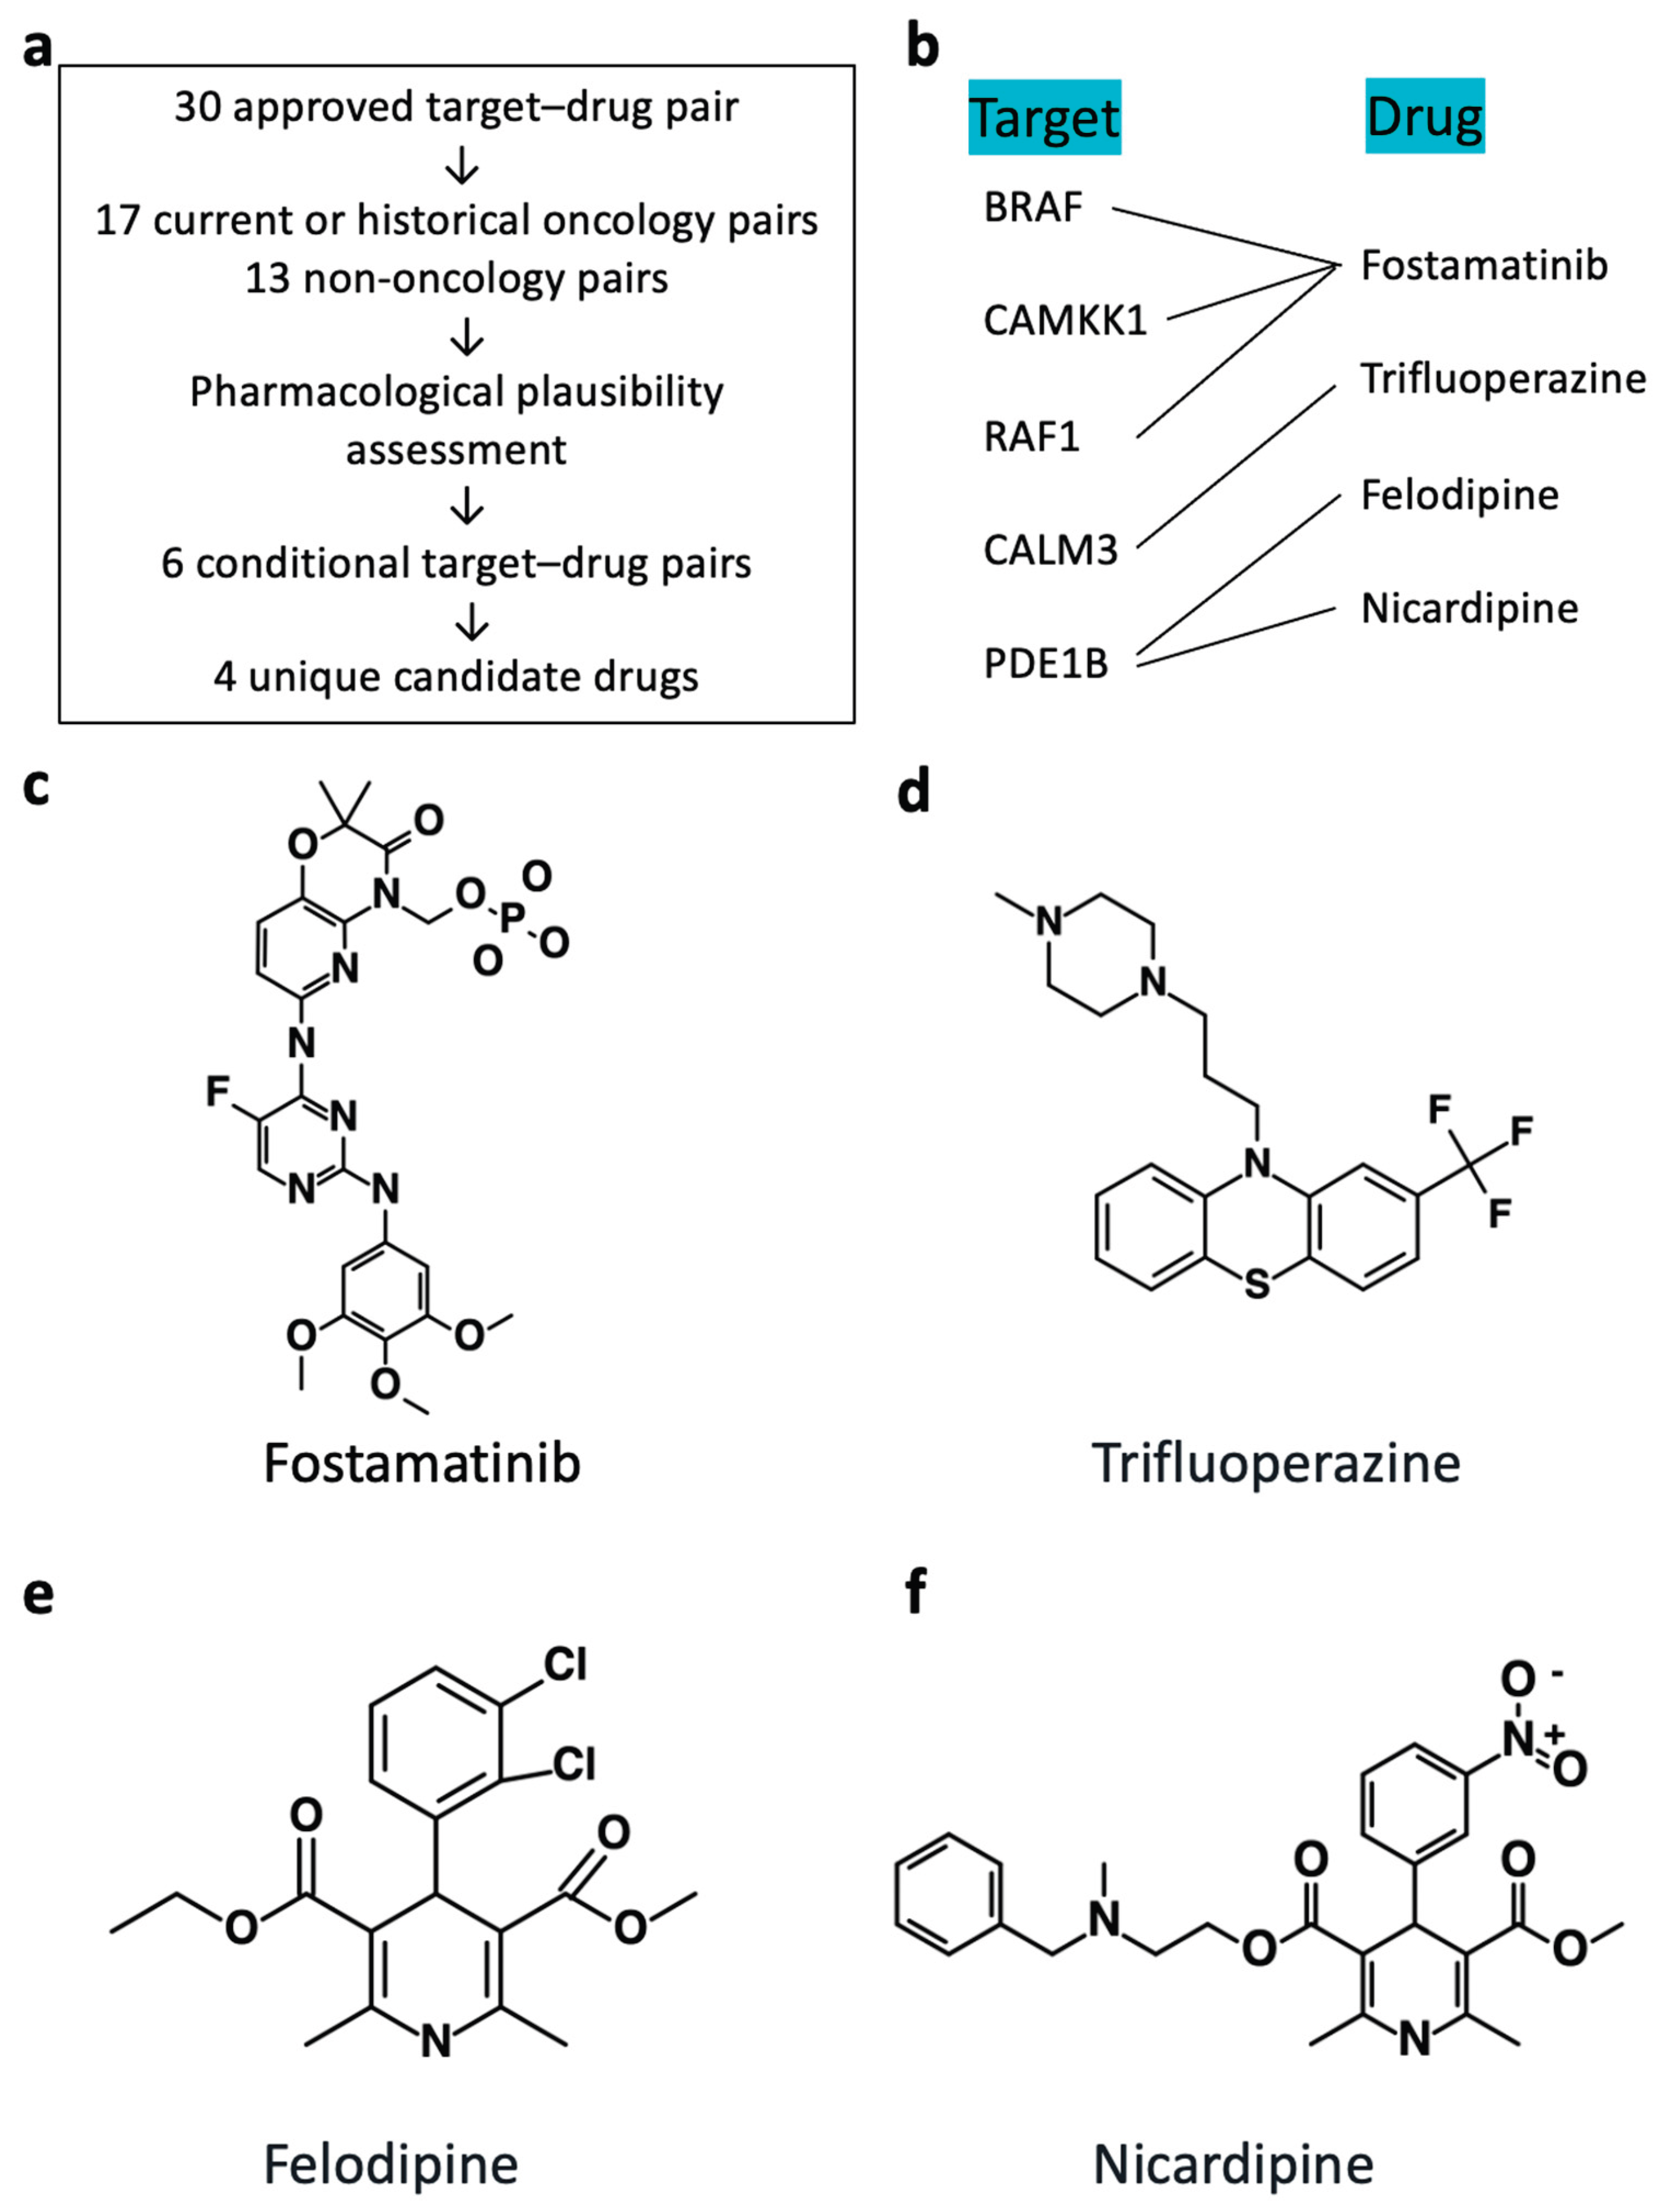
Drug screening identified 30 approved target–drug pairs associated with the selected KRAS-related proteins (Figure 4a). Of these, 17 pairs involved drugs with current or historical oncology use and were excluded from the primary non-oncology-to-oncology repurposing set. The remaining 13 non-oncology target–drug pairs were evaluated according to pharmacological plausibility, including the reported action on the mapped target, drug type, safety considerations and potential relevance to KRAS-associated signalling.
Figure 3.
Chromosomal distribution and local spatial organization of KRAS-associated genes. a, Genomic positions of the 21 KRAS-associated genes on the GRCh38.p14 primary chromosomes. Horizontal marks indicate gene midpoints, and white segments indicate centromeric regions. b, Observed gene counts per chromosome compared with counts expected under a chromosome-length-weighted multinomial model. Bars represent observed counts and diamonds represent expected counts. The global distribution did not differ from the length-based expectation (G2=21.14, Monte Carlo P=0.774); no individual chromosome was significantly over-represented after Benjamini–Hochberg (BH) correction. c, Comparison of the non-centromeric p- and q-arm length proportions with the observed gene proportions. Eleven genes were located on p arms and ten on q arms. Neither the unconditional length-based test (P=0.0653) nor the chromosome-conditioned Poisson-binomial test (P=0.164) supported significant arm preference. d, Midpoint distances between genes located on the same chromosome, expressed as a percentage of chromosome length on a logarithmic scale. CALML3 and CALML5 were separated by 26.7 kb on chromosome 10; the probability of observing an equally or more closely spaced pair among 21 length-weighted random genomic positions was P=0.00356. Statistical values were obtained from 2,000,000 Monte Carlo simulations in b and d.
Figure 3.
Chromosomal distribution and local spatial organization of KRAS-associated genes. a, Genomic positions of the 21 KRAS-associated genes on the GRCh38.p14 primary chromosomes. Horizontal marks indicate gene midpoints, and white segments indicate centromeric regions. b, Observed gene counts per chromosome compared with counts expected under a chromosome-length-weighted multinomial model. Bars represent observed counts and diamonds represent expected counts. The global distribution did not differ from the length-based expectation (G2=21.14, Monte Carlo P=0.774); no individual chromosome was significantly over-represented after Benjamini–Hochberg (BH) correction. c, Comparison of the non-centromeric p- and q-arm length proportions with the observed gene proportions. Eleven genes were located on p arms and ten on q arms. Neither the unconditional length-based test (P=0.0653) nor the chromosome-conditioned Poisson-binomial test (P=0.164) supported significant arm preference. d, Midpoint distances between genes located on the same chromosome, expressed as a percentage of chromosome length on a logarithmic scale. CALML3 and CALML5 were separated by 26.7 kb on chromosome 10; the probability of observing an equally or more closely spaced pair among 21 length-weighted random genomic positions was P=0.00356. Statistical values were obtained from 2,000,000 Monte Carlo simulations in b and d.
This filtering retained six conditional target–drug pairs involving four unique approved drugs: fostamatinib, trifluoperazine, felodipine and nicardipine. Fostamatinib was mapped to three KRAS-associated targets, BRAF, CAMKK1 and RAF1, whereas trifluoperazine was mapped to CALM3. Felodipine and nicardipine were both mapped to PDE1B (Figure 4b). Their chemical structures are shown in Figure 4c–f.
These four compounds were therefore prioritized for further discussion as hypothesis-generating repurposing candidates. Their inclusion indicates pharmacological and mechanistic plausibility based on the present screening criteria, rather than validated efficacy in KRAS-driven cancer models.
Figure 4.
Screening and characterization of prioritized repurposing candidates. a, Screening workflow from 30 approved target–drug pairs to six conditional target–drug pairs involving four unique drugs. b, Associations between the four candidate drugs and five KRAS-associated protein targets. c–f, Two-dimensional chemical structures of fostamatinib, trifluoperazine, felodipine and nicardipine, generated from PubChem SMILES records using PubChem Sketcher.
Figure 4.
Screening and characterization of prioritized repurposing candidates. a, Screening workflow from 30 approved target–drug pairs to six conditional target–drug pairs involving four unique drugs. b, Associations between the four candidate drugs and five KRAS-associated protein targets. c–f, Two-dimensional chemical structures of fostamatinib, trifluoperazine, felodipine and nicardipine, generated from PubChem SMILES records using PubChem Sketcher.
Literature Support for the Prioritised Drugs
To examine whether the prioritised compounds had independent support in KRAS-relevant cancer settings, their approved indications and previously reported experimental evidence were reviewed (Table 2). None of the four drugs had an approved cancer indication in DrugBank22. KRAS-dependent cancer cells were reported to be more sensitive to R40623, the active metabolite of fostamatinib24, while trifluoperazine showed inhibitory activity as a single agent in KRAS-dependent cell models25. Felodipine reduced filopodia formation26, whereas nicardipine reduced colony formation, migration and invasion in MDA-MB-231 cells27, which were independently characterised as KRAS-dependent25. These observations were consistent with the PPI-based prioritisation and provided independent support for the biological plausibility of the selected candidates.
Discussion
Direct pharmacological targeting of KRAS remains challenging despite recent progress in the development of mutation-selective inhibitors. The structural properties of KRAS, the diversity of oncogenic variants and tumour contexts, and the emergence of adaptive or acquired resistance continue to limit the general applicability of direct inhibition strategies. These challenges support the exploration of complementary approaches that do not require a compound to bind KRAS itself. In this study, we investigated whether proteins located within a KRAS-centred association network could provide alternative points of pharmacological intervention. By integrating protein-association analysis, functional annotation, target-level mapping of approved drugs and a targeted literature review, we established a compact and reproducible workflow for generating indirect KRAS-targeting and drug-repurposing hypotheses. The purpose of this analysis was not to identify validated treatments, but to reduce a broad pharmacological search space to a small set of candidates suitable for more focused evaluation.
The resulting network recovered established components of RAS signalling, including RAF1, BRAF and PIK3CA, together with a prominent calcium- and calmodulin-associated component. Functional annotation further separated these features into a canonical KRAS–RAF–ERK/PI3K signalling branch and a module containing calmodulin-related proteins, CAMKK1, PDE1 phosphodiesterases and phosphorylase-kinase subunits. The recovery of known RAS effectors supports the biological plausibility of the selected neighbourhood, whereas the calcium/calmodulin-associated component highlights a less direct route through which KRAS-related cellular functions might potentially be modulated. However, this component should not be interpreted as a newly demonstrated KRAS mechanism. STRING integrates physical and functional associations from heterogeneous evidence channels, and the selected proteins were generated through network expansion around KRAS. Accordingly, the enrichment results primarily describe the organization of the selected neighbourhood rather than provide independent evidence of KRAS-specific functional involvement. The different partitions produced by k-means and MCL clustering also indicate that module boundaries within this small and dense network are sensitive to algorithm choice. Genomic-location analysis showed that the genes were broadly dispersed, while the close proximity of CALML3 and CALML5 was more consistent with localized gene-family organization than with general KRAS-network-specific clustering.
Target-level drug curation identified four approved non-oncology drugs associated with five proteins in the KRAS-centred network. Fostamatinib was linked to BRAF, RAF1 and CAMKK1, making it the most broadly connected compound in the final candidate set. This multi-target mapping may provide several possible routes for pathway modulation, but it also complicates mechanistic interpretation because any cellular effect could arise from additional known or uncharacterized targets. Trifluoperazine was retained through its reported inhibitory association with CALM3. This mapping should not be interpreted as evidence that trifluoperazine is selective for CALM3, particularly because calmodulin proteins are highly related and the drug has multiple pharmacological activities. Felodipine and nicardipine were mapped to PDE1B, suggesting a possible connection between approved calcium-channel blockers and calcium- or cyclic-nucleotide-regulated signalling within the KRAS-associated network. These compounds should be regarded as conditional, hypothesis-generating candidates rather than proposed KRAS inhibitors or cancer treatments.
Targeted literature corroboration added an independent evidence layer to the prioritisation (Table 2). These findings support the biological plausibility of the selected compounds but do not establish KRAS-selective activity, validate the specific target–drug relationships used for prioritisation or demonstrate clinical efficacy.
A strength of this study is the transparent separation of network construction, functional annotation, manual drug curation and targeted literature corroboration. Drug associations were restricted to exact human protein targets, while broad protein-family annotations, experimental compounds and pharmacologically implausible associations were excluded. Current and historical oncology drugs were retained as reference mappings but separated from the primary non-oncology repurposing set. This distinction reduced overinterpretation and made the candidate-selection process auditable. The workflow is also computationally lightweight and can be extended to other difficult-to-target proteins without assuming that the original disease-driving protein must be directly druggable.
Several limitations remain. The network contained only 21 proteins and was dependent on the selected STRING confidence threshold and shell-size restrictions. STRING associations do not establish regulatory direction, causal dependence or direct physical binding. The analysis also did not distinguish among KRAS alleles, tumour types or molecular backgrounds, all of which may alter network dependencies. DrugBank target annotations alone do not establish target potency, selectivity, tumour exposure or therapeutic index. The targeted literature review was qualitative rather than systematic and did not validate the specific target–drug relationships or establish clinical efficacy. Most importantly, no new experimental or genetic-dependency validation was performed in this study. Future analyses could integrate DepMap or CRISPR-screening data, tumour-specific expression and proteomic profiles, clinically relevant drug exposure, and comparisons between KRAS-mutant and KRAS-wild-type models. Despite these limitations, the study demonstrates how a compact KRAS-centred network can be translated into a tractable set of indirect target–drug hypotheses and supported through targeted literature corroboration before further experimental investigation.
Methods
STRING Network Construction
The human KRAS-centred network was generated using STRING v12.0 with Homo sapiens selected as the organism21. The full STRING network was used, incorporating text-mining, experimental, curated-database, co-expression, gene-neighbourhood, gene-fusion and phylogenetic co-occurrence evidence. The minimum combined interaction score was set to 0.400, and network expansion was restricted to a maximum of ten first-shell and ten second-shell interactors. Edge thickness represented the STRING combined confidence score. STRING associations may represent either physical interactions or indirect functional relationships. Network statistics, including the numbers of nodes and edges, average degree, average local clustering coefficient, expected edge number and PPI-enrichment P value, were obtained directly from STRING.
Network Topology and Clustering
Node degree was defined as the number of retained associations connected to each protein within the displayed 21-node network. Clustering was performed using the algorithms implemented in STRING. K-means clustering was conducted with k=3, whereas MCL was conducted with an inflation parameter of 3. These settings produced three and two clusters, respectively. Cluster assignments were compared descriptively to assess the sensitivity of network partitioning to algorithm choice. STRING specifies the desired number of clusters directly for k-means, whereas the MCL inflation parameter indirectly controls clustering granularity.
Co-Occurrence and Co-Expression Analyses
Phylogenetic co-occurrence and co-expression evidence were visualized for KRAS and its ten first-shell associated proteins using the corresponding STRING evidence viewers. Co-occurrence profiles represented the distribution and conservation of homologous proteins across taxa, whereas the co-expression matrix represented pairwise STRING co-expression evidence. These panels were used to characterize the evidence structure of the network and were not treated as independent validation analyses.
Functional Enrichment Analysis
Functional enrichment analysis was performed using STRING v12.0 with the 21 proteins contained in the KRAS-centred network and Homo sapiens selected as the organism. The complete human genome background provided by STRING was used as the reference set. Four annotation categories were analysed: Gene Ontology biological process, Gene Ontology molecular function, KEGG28 pathways and Reactome29 pathways.
Terms were retained when they satisfied all of the following predefined criteria: FDR ≤0.05, enrichment Signal ≥0.01, enrichment strength ≥0.01, and at least two proteins from the input network assigned to the term. Rows representing similar terms were not merged. For visualization, terms were grouped using a gene-set Jaccard similarity threshold of 0.7 and ranked by STRING enrichment Signal. The STRING enrichment visualization places Signal on the horizontal axis, represents FDR by bubble colour and represents the number of assigned network proteins by bubble size. All four significant biological-process terms were displayed. For molecular function, KEGG and Reactome, the eight terms with the highest Signal values were displayed. The same mint-to-blue colour palette was used across all panels, and no terms were manually highlighted. Complete enrichment results, including term identifiers, observed and background protein counts, strength, Signal, FDR and matching protein labels, were downloaded as tab-separated files.
The exported enrichment plots were arranged vertically to form a four-panel figure. Summary text reporting the total number of significant terms, the number displayed and the FDR range among the displayed terms was added beside each panel. During quality control, the FDR exponent labels in the exported Gene Ontology biological-process and Reactome scalable vector graphics (SVG) legends were found to be one order of magnitude lower than the values reported independently in both the STRING web results table and the corresponding tab-separated values (TSV) exports. Only the exponent text in these two legends was corrected to match the tabulated FDR values; no enrichment term, Signal value, bubble position, bubble size, term ranking or statistical result was altered.
Because the analysed proteins were selected through STRING-based expansion of a single KRAS query rather than generated as an independent experimental gene set, the enrichment results were used to describe the functional organization of the resulting KRAS-associated neighbourhood and were not treated as independent validation of KRAS-specific biology.
Genomic-Location Analysis
Genomic coordinates, chromosome assignments, cytogenetic bands and strand orientations for the 21 genes were retrieved from NCBI Gene (https://www.ncbi.nlm.nih.gov/gene/) and standardized to the Homo sapiens GRCh38.p14 primary assembly. Only chromosomes 1–22, X and Y were included. GRCh38.p14 chromosome lengths were obtained from the NCBI Genome Reference Consortium data page (https://www.ncbi.nlm.nih.gov/grc/human/data), where chromosome length is calculated as the sum of placed scaffold lengths and estimated assembly gaps. The 24 primary chromosomes had a combined length of 3,088,269,832 bp.
Cytogenetic-Band and Chromosome-Arm Analysis
Cytogenetic-band annotations for the hg38 assembly were downloaded from the UCSC Genome Browser database (https://hgdownload.soe.ucsc.edu/goldenPath/hg38/database/) as cytoBandIdeo.txt.gz. The decompressed raw file and the analysis code were archived in the project GitHub repository. The UCSC download directory provides its database tables as compressed, tab-delimited files30.
Only records with chromosome identifiers matching ‘chr1–chr22’, ‘chrX’ or ‘chrY’ were retained. Mitochondrial, unplaced, random, alternative and fix-patch sequences were excluded. For each primary chromosome c, chromosome length was defined as the maximum ‘chromEnd’ coordinate:
Centromeric intervals were identified by ‘gieStain = acen’. The two adjacent acen records on each chromosome were merged by defining:
and
UCSC coordinates were treated as zero-based, half-open intervals. The non-centromeric p- and q-arm lengths were calculated as:
and
respectively. Merged centromeric intervals were excluded from the arm-length denominator. Across chromosomes 1–22, X and Y, the total non-centromeric p- and q-arm lengths accounted for 32.9% and 67.1%, respectively, of the non-centromeric primary-chromosome length.
For each gene g, the genomic midpoint was calculated from its GRCh38.p14 start and end coordinates as:
where and are the genomic start and end positions, respectively. Gene midpoints were used to display genomic locations and to calculate distances between genes located on the same chromosome.
Chromosome-Level Distribution
Under the chromosome-length-weighted null model, the probability that a randomly selected genomic position occurred on chromosome i was
where is the length of chromosome i. For n=21 genes, the expected number on chromosome i was
The departure of the observed chromosome counts from the expected counts was summarized using the multinomial likelihood-ratio statistic
Because the sample contained only 21 genes distributed among 24 chromosome categories and most expected counts were below five, the global P value was calculated using 2,000,000 Monte Carlo draws from:
The Monte Carlo P value was calculated using the add-one estimator:
where B is the number of simulations and b is the number of simulated statistics greater than or equal to the observed statistic.
Each chromosome was additionally tested for over-representation using a one-sided exact binomial test,
with alternative hypothesis . The resulting 24 P values were adjusted using the Benjamini–Hochberg procedure, with an adjusted q<0.05 considered significant.
Chromosome-Arm Distribution
Chromosome p- and q-arm lengths were calculated after excluding the centromeric intervals. The genome-wide probability of placement on a p arm was defined as
where and are the non-centromeric p- and q-arm lengths of chromosome i, respectively.
An unconditional two-sided exact binomial test compared the observed number of p-arm genes with
A chromosome-conditioned analysis was also performed to separate arm preference from the observed chromosome composition. For gene j, located on chromosome , the chromosome-specific probability of placement on the p arm was
The total number of p-arm genes was therefore modelled as a Poisson-binomial random variable,
and a two-sided exact P value was calculated from the resulting probability-mass function.
Within-Chromosome Distance Analysis
For every pair of genes g and h located on the same chromosome, the midpoint distance was calculated as
To permit comparison across chromosomes of different lengths, the plotted normalized distance was
where is the length of the chromosome containing the pair. Normalized distances were displayed on a logarithmic scale.
The statistical significance of the smallest observed same-chromosome distance was assessed using 2,000,000 Monte Carlo simulations. In each simulation, 21 positions were sampled uniformly from the concatenated lengths of chromosomes 1–22, X and Y, which is equivalent to assigning chromosomes in proportion to their physical lengths and then sampling uniformly within the selected chromosome. The minimum distance between any two simulated positions on the same chromosome was recorded. The reported Monte Carlo P value was the proportion of simulations in which the minimum distance was less than or equal to the observed CALML3–CALML5 midpoint distance, using the add-one correction above. The random-number seed was fixed at 20260713 to ensure reproducibility.
The length-weighted null model treats each base pair of the primary chromosomes as equally selectable and therefore does not adjust for chromosome-specific differences in protein-coding gene density. Consequently, the analysis tests spatial deviation from physical chromosome length rather than deviation from the empirical distribution of all human protein-coding genes.
Approved Drug Mapping and Candidate Classification
Approved drugs associated with the KRAS-related protein targets were manually collected from DrugBank in July 202622. Only drugs directly linked to the exact human protein target were included. When both a primary DrugBank bio-entity page and a UniProt polypeptide page were available, the primary bio-entity page was used. Drug associations assigned only to a broad protein family or a generic target entity were excluded. For example, drugs linked only to the general cyclic nucleotide phosphodiesterase entity were not treated as PDE1C-specific drugs.
Investigational and experimental compounds were excluded. Drugs annotated as both approved and investigational were retained because they had at least one approved indication. KRAS itself was excluded from this screening because the study focused on indirect pharmacological intervention through KRAS-associated proteins.
For each retained target–drug pair, we recorded the gene symbol, drug name, DrugBank accession number, drug type, reported drug action, cancer-use category, previous direct oncology use and repurposing classification. Drug actions were recorded as inhibitor, agonist, modulator or not specified according to the DrugBank target record.
Drugs with current direct anticancer indications were classified as ‘Direct_antitumor’. Drugs with a historical anticancer approval that had subsequently been withdrawn were classified as ‘Direct_antitumor_withdrawn’. Drugs without an approved cancer indication were classified as ‘No_approved_cancer_use’. Current or historical direct oncology drugs were retained in Table 1 as reference compounds but were not included in the primary non-oncology-to-oncology repurposing candidate set. Their classification as ‘No’ does not indicate that they lack activity in other cancer types.
Non-oncology drugs were further assessed for pharmacological plausibility. Non-selective mineral salts or nutrients, endogenous or diagnostic agents, drugs withdrawn because of major safety concerns, compounds without an appropriate target-directed action and associations unlikely to be relevant at clinically achievable exposure were not prioritized. Drugs with a plausible inhibitory or modulatory relationship to a KRAS-associated protein, but requiring further confirmation of target engagement, clinical exposure and activity in KRAS-driven cancer models, were classified as ‘Conditional’. In Table 1, Conditional indicates inclusion in the hypothesis-generating candidate set, whereas No indicates that the target–drug pair was not retained in this primary candidate set. The six conditional target–drug pairs were highlighted in bold.
Chemical-Structure Preparation
SMILES strings for the four prioritised compounds—fostamatinib, trifluoperazine, felodipine and nicardipine—were retrieved from PubChem31. Each SMILES string was imported into PubChem Sketcher and rendered as a two-dimensional chemical structure. The structures were adjusted where necessary to obtain a consistent visual presentation and exported in scalable vector graphics (SVG) format. The corresponding source files, named with the prefix chemical structure, were archived in the project GitHub repository. These structures were prepared solely for graphical presentation and were not used for molecular docking, conformational analysis or quantitative structure–activity analysis.
Targeted Literature Corroboration
Approved indications for the four prioritised drugs were retrieved from DrugBank22. A targeted search of PubMed and publisher websites was conducted through July 2026 using each drug name and available aliases, including R788 and R406 for fostamatinib, together with the terms “KRAS”, “cancer”, “tumour” and “dependency”. Primary studies were retained when the exact drug or active metabolite was experimentally evaluated in KRAS-dependent cancer cells, or when the tested cancer model had been independently reported as KRAS-dependent. The relevant finding, supporting quotation and location within the source article were recorded in Table 2. This analysis was performed as qualitative literature corroboration rather than a systematic review or an assessment of clinical efficacy.
Author Contributions
Peter X. Geng conceived the study, designed the methodology, curated and validated the data, developed and executed the computational workflow, performed the statistical analyses and literature review, interpreted the results, prepared all figures and tables, and wrote and revised the manuscript.
Code Availability
Custom code used for the genomic-location analyses, together with the corresponding non-restricted input data, processed results and figure-source files, is publicly available at https://github.com/Peneapple/2026-KRAS. The analysis materials are organised in the Data_Code directory. DrugBank-derived records are summarised in Table 1 and Table 2 but are not redistributed in the repository because they remain subject to DrugBank licensing terms.
Acknowledgments
This study was conducted independently by the author without external funding and using personal computing resources. The author was solely responsible for the study design, data curation, computational analyses, interpretation of the results and preparation of the manuscript, and takes full responsibility for its content. The author thanks the University of Pittsburgh for providing access to DrugBank.
Competing interests
The author declares no competing interests.
Use of AI-assisted tools
OpenAI ChatGPT (GPT-5.6 Thinking; accessed July 2026) was used to assist with code drafting, literature searching and English-language editing. The author independently verified the source data and cited literature, reviewed and executed all analytical code, examined the statistical outputs, interpreted the results and takes full responsibility for the final content of the manuscript.
References
- KRAS KRas proto-oncogene, GTPase [Homo sapiens (human)] - Gene - NCBI. Available online: https://www.ncbi.nlm.nih.gov/gene/3845.
- Cook, J.H.; Melloni, G.E.M.; Gulhan, D.C.; Park, P.J.; Haigis, K.M. The origins and genetic interactions of KRAS mutations are allele- and tissue-specific. Nat. Commun. 2021, 12, 1808. [Google Scholar] [CrossRef] [PubMed]
- Yuan, T.L.; et al. Differential effector engagement by oncogenic KRAS. Cell Rep. 2018, 22, 1889–1902. [Google Scholar] [CrossRef] [PubMed]
- Prior, I.A.; Hood, F.E.; Hartley, J.L. The Frequency of Ras mutations in cancer. Cancer Res. 2020, 80, 2969–2974. [Google Scholar] [CrossRef] [PubMed]
- Lee, J.K.; et al. Comprehensive pan-cancer genomic landscape of KRAS altered cancers and real-world outcomes in solid tumors. npj Precis. Oncol. 2022, 6, 91. [Google Scholar] [CrossRef] [PubMed]
- Ostrem, J.M.; Peters, U.; Sos, M.L.; Wells, J.A.; Shokat, K.M. K-Ras(G12C) inhibitors allosterically control GTP affinity and effector interactions. Nature 2013, 503, 548–551. [Google Scholar] [CrossRef] [PubMed]
- Skoulidis, F.; et al. Sotorasib for lung cancers with KRAS p.G12C mutation. N. Engl. J. Med. 2021, 384, 2371–2381. [Google Scholar] [CrossRef] [PubMed]
- Jänne, P.A.; et al. Adagrasib in non–small-cell lung cancer harboring a KRASG12C mutation. N. Engl. J. Med. 2022, 387, 120–131. [Google Scholar] [CrossRef] [PubMed]
- Awad, M.M.; et al. Acquired resistance to KRASG12C inhibition in cancer. N. Engl. J. Med. 2021, 384, 2382–2393. [Google Scholar] [CrossRef] [PubMed]
- Luck, K.; et al. A reference map of the human binary protein interactome. Nature 2020, 580, 402–408. [Google Scholar] [CrossRef] [PubMed]
- Huttlin, E.L.; et al. Dual proteome-scale networks reveal cell-specific remodeling of the human interactome. Cell 2021, 184, 3022–3040.e28. [Google Scholar] [CrossRef] [PubMed]
- Menche, J.; et al. Uncovering disease-disease relationships through the incomplete interactome. Science 2015, 347, 1257601. [Google Scholar] [CrossRef] [PubMed]
- Horlbeck, M.A.; et al. Mapping the genetic landscape of human cells. Cell 2018, 174, 953–967.e22. [Google Scholar] [CrossRef] [PubMed]
- Ku, A.A.; et al. Integration of multiple biological contexts reveals principles of synthetic lethality that affect reproducibility. Nat. Commun. 2020, 11, 2375. [Google Scholar] [CrossRef] [PubMed]
- Farmer, H.; et al. Targeting the DNA repair defect in BRCA mutant cells as a therapeutic strategy. Nature 2005, 434, 917–921. [Google Scholar] [CrossRef] [PubMed]
- Sahu, A.D.; et al. Genome-wide prediction of synthetic rescue mediators of resistance to targeted and immunotherapy. Mol. Syst. Biol. 2019, 15, e8323. [Google Scholar] [CrossRef] [PubMed]
- Ruess, D.A.; et al. Mutant KRAS-driven cancers depend on PTPN11/SHP2 phosphatase. Nat. Med. 2018, 24, 954–960. [Google Scholar] [CrossRef] [PubMed]
- Pushpakom, S.; et al. Drug repurposing: progress, challenges and recommendations. Nat. Rev. Drug Discov. 2019, 18, 41–58. [Google Scholar] [PubMed]
- Statistics | DrugBank. Available online: https://go.drugbank.com/stats.
- Cheng, F.; et al. Network-based approach to prediction and population-based validation of in silico drug repurposing. Nat. Commun. 2018, 9, 2691. [Google Scholar] [CrossRef] [PubMed]
- Szklarczyk, D.; et al. The STRING database in 2025: protein networks with directionality of regulation. Nucleic Acids Res. 2025, 53, D730–D737. [Google Scholar] [PubMed]
- Knox, C.; et al. Drugbank 6.0: the drugbank knowledgebase for 2024. Nucleic Acids Res. 2024, 52, D1265–D1275. [Google Scholar] [PubMed]
- Singh, A.; et al. A gene expression signature associated with “K-Ras addiction” reveals regulators of EMT and tumor cell survival. Cancer Cell 2009, 15, 489–500. [Google Scholar] [CrossRef] [PubMed]
- Baluom, M.; Grossbard, E. B.; Mant, T.; Lau, D. T. W. Pharmacokinetics of fostamatinib, a spleen tyrosine kinase (SYK) inhibitor, in healthy human subjects following single and multiple oral dosing in three phase I studies. Br. J. Clin. Pharmacol. 2013, 76, 78–88. [Google Scholar] [CrossRef] [PubMed]
- Manoharan, G.B.; Okutachi, S.; Abankwa, D. Potential of phenothiazines to synergistically block calmodulin and reactivate PP2A in cancer cells. PLoS ONE 2022, 17, e0268635. [Google Scholar] [CrossRef] [PubMed]
- Jacquemet, G.; et al. L-type calcium channels regulate filopodia stability and cancer cell invasion downstream of integrin signalling. Nat. Commun. 2016, 7, 13297. [Google Scholar] [CrossRef] [PubMed]
- Chen, Y.-C.; et al. Nicardipine inhibits breast cancer migration via Nrf2/HO-1 axis and matrix metalloproteinase-9 regulation. Front. Pharmacol. 2021, 12, 710978. [Google Scholar] [CrossRef] [PubMed]
- Kanehisa, M.; Furumichi, M.; Sato, Y.; Matsuura, Y.; Ishiguro-Watanabe, M. KEGG: biological systems database as a model of the real world. Nucleic Acids Res. 2025, 53, D672–D677. [Google Scholar] [PubMed]
- Milacic, M.; et al. The reactome pathway knowledgebase 2024. Nucleic Acids Res. 2024, 52, D672–D678. [Google Scholar] [PubMed]
- Casper, J.; et al. The UCSC genome browser database: 2026 update. Nucleic Acids Res. 2026, 54, D1331–D1335. [Google Scholar] [PubMed]
- Kim, S.; et al. PubChem 2023 update. Nucleic Acids Res. 2023, 51, D1373–D1380. [Google Scholar] [PubMed]
Figure 1.
Overview of the STRING-derived KRAS protein-association network. a, Human KRAS-centred network generated using STRING v12.0 with a minimum combined interaction score of 0.400 and a maximum of ten interactors in each of the first and second shells. The network contained 21 nodes and 100 edges. Edge width indicates the STRING combined confidence score. b, Comparison of network partitions generated using k-means clustering (k=3, three clusters) and Markov clustering (MCL; inflation parameter =3, two clusters). Node colours indicate cluster membership, and dashed lines represent inter-cluster associations. c, Degree of each protein within the displayed network. d, Phylogenetic co-occurrence profiles of KRAS and its first-shell associated proteins across representative taxa. e, Pairwise STRING co-expression evidence among KRAS and its first-shell associated proteins. Co-occurrence and co-expression represent individual STRING evidence channels rather than independent validation datasets.
Figure 1.
Overview of the STRING-derived KRAS protein-association network. a, Human KRAS-centred network generated using STRING v12.0 with a minimum combined interaction score of 0.400 and a maximum of ten interactors in each of the first and second shells. The network contained 21 nodes and 100 edges. Edge width indicates the STRING combined confidence score. b, Comparison of network partitions generated using k-means clustering (k=3, three clusters) and Markov clustering (MCL; inflation parameter =3, two clusters). Node colours indicate cluster membership, and dashed lines represent inter-cluster associations. c, Degree of each protein within the displayed network. d, Phylogenetic co-occurrence profiles of KRAS and its first-shell associated proteins across representative taxa. e, Pairwise STRING co-expression evidence among KRAS and its first-shell associated proteins. Co-occurrence and co-expression represent individual STRING evidence channels rather than independent validation datasets.
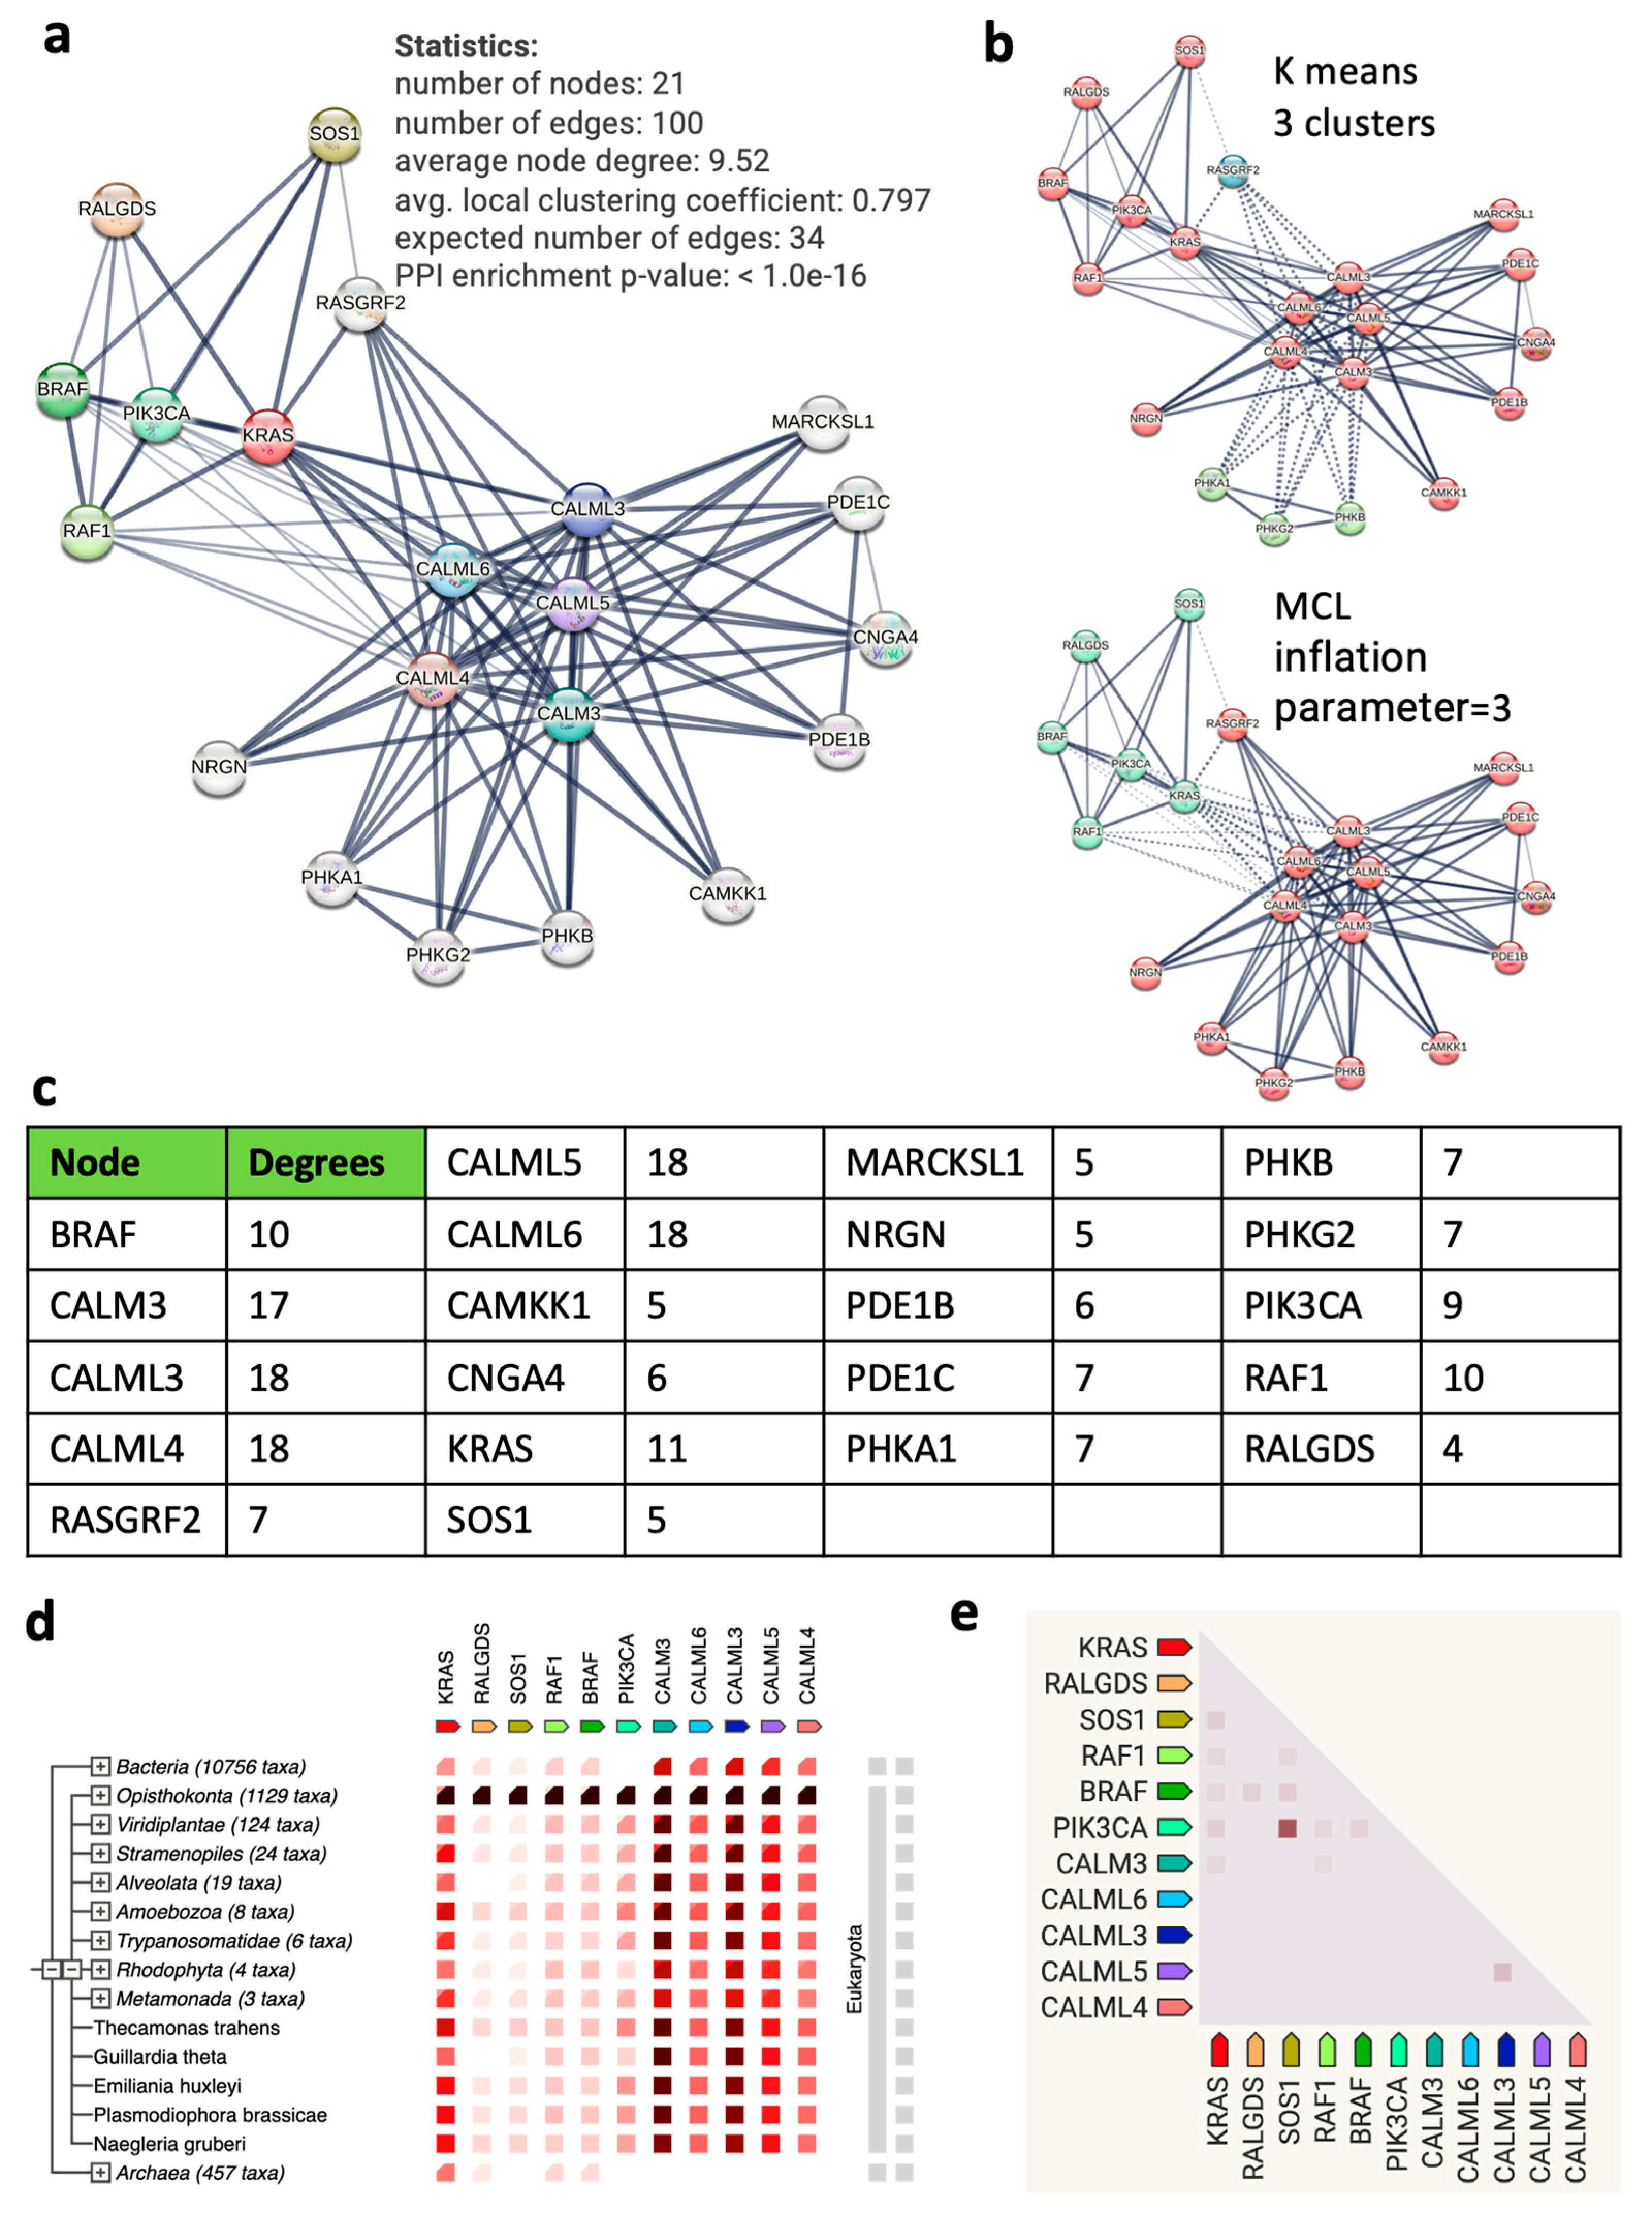
Figure 2.
Functional enrichment delineates canonical RAS signalling and calcium/calmodulin-associated functions in the KRAS-centred network. a, Gene Ontology biological-process enrichment. All four terms satisfying the predefined significance and filtering thresholds are shown. b, Gene Ontology molecular-function enrichment. The eight terms with the highest STRING enrichment Signal are shown from ten significant terms. c, KEGG pathway enrichment. The eight highest-ranking terms by Signal are shown from 105 significant pathways. d, Reactome pathway enrichment. The eight highest-ranking terms by Signal are shown from 114 significant pathways. In each panel, the horizontal position represents the STRING enrichment Signal, bubble size represents the number of network proteins assigned to the term, and bubble colour represents the false discovery rate (FDR). Related terms were visually grouped using a gene-set Jaccard similarity threshold of 0.7 without merging individual rows. Text summaries indicate the total number of significant terms, the number displayed and the FDR range among the displayed terms. STRING enrichment plots encode Signal, FDR and protein count in this manner, and use Jaccard similarity to group related terms.
Figure 2.
Functional enrichment delineates canonical RAS signalling and calcium/calmodulin-associated functions in the KRAS-centred network. a, Gene Ontology biological-process enrichment. All four terms satisfying the predefined significance and filtering thresholds are shown. b, Gene Ontology molecular-function enrichment. The eight terms with the highest STRING enrichment Signal are shown from ten significant terms. c, KEGG pathway enrichment. The eight highest-ranking terms by Signal are shown from 105 significant pathways. d, Reactome pathway enrichment. The eight highest-ranking terms by Signal are shown from 114 significant pathways. In each panel, the horizontal position represents the STRING enrichment Signal, bubble size represents the number of network proteins assigned to the term, and bubble colour represents the false discovery rate (FDR). Related terms were visually grouped using a gene-set Jaccard similarity threshold of 0.7 without merging individual rows. Text summaries indicate the total number of significant terms, the number displayed and the FDR range among the displayed terms. STRING enrichment plots encode Signal, FDR and protein count in this manner, and use Jaccard similarity to group related terms.
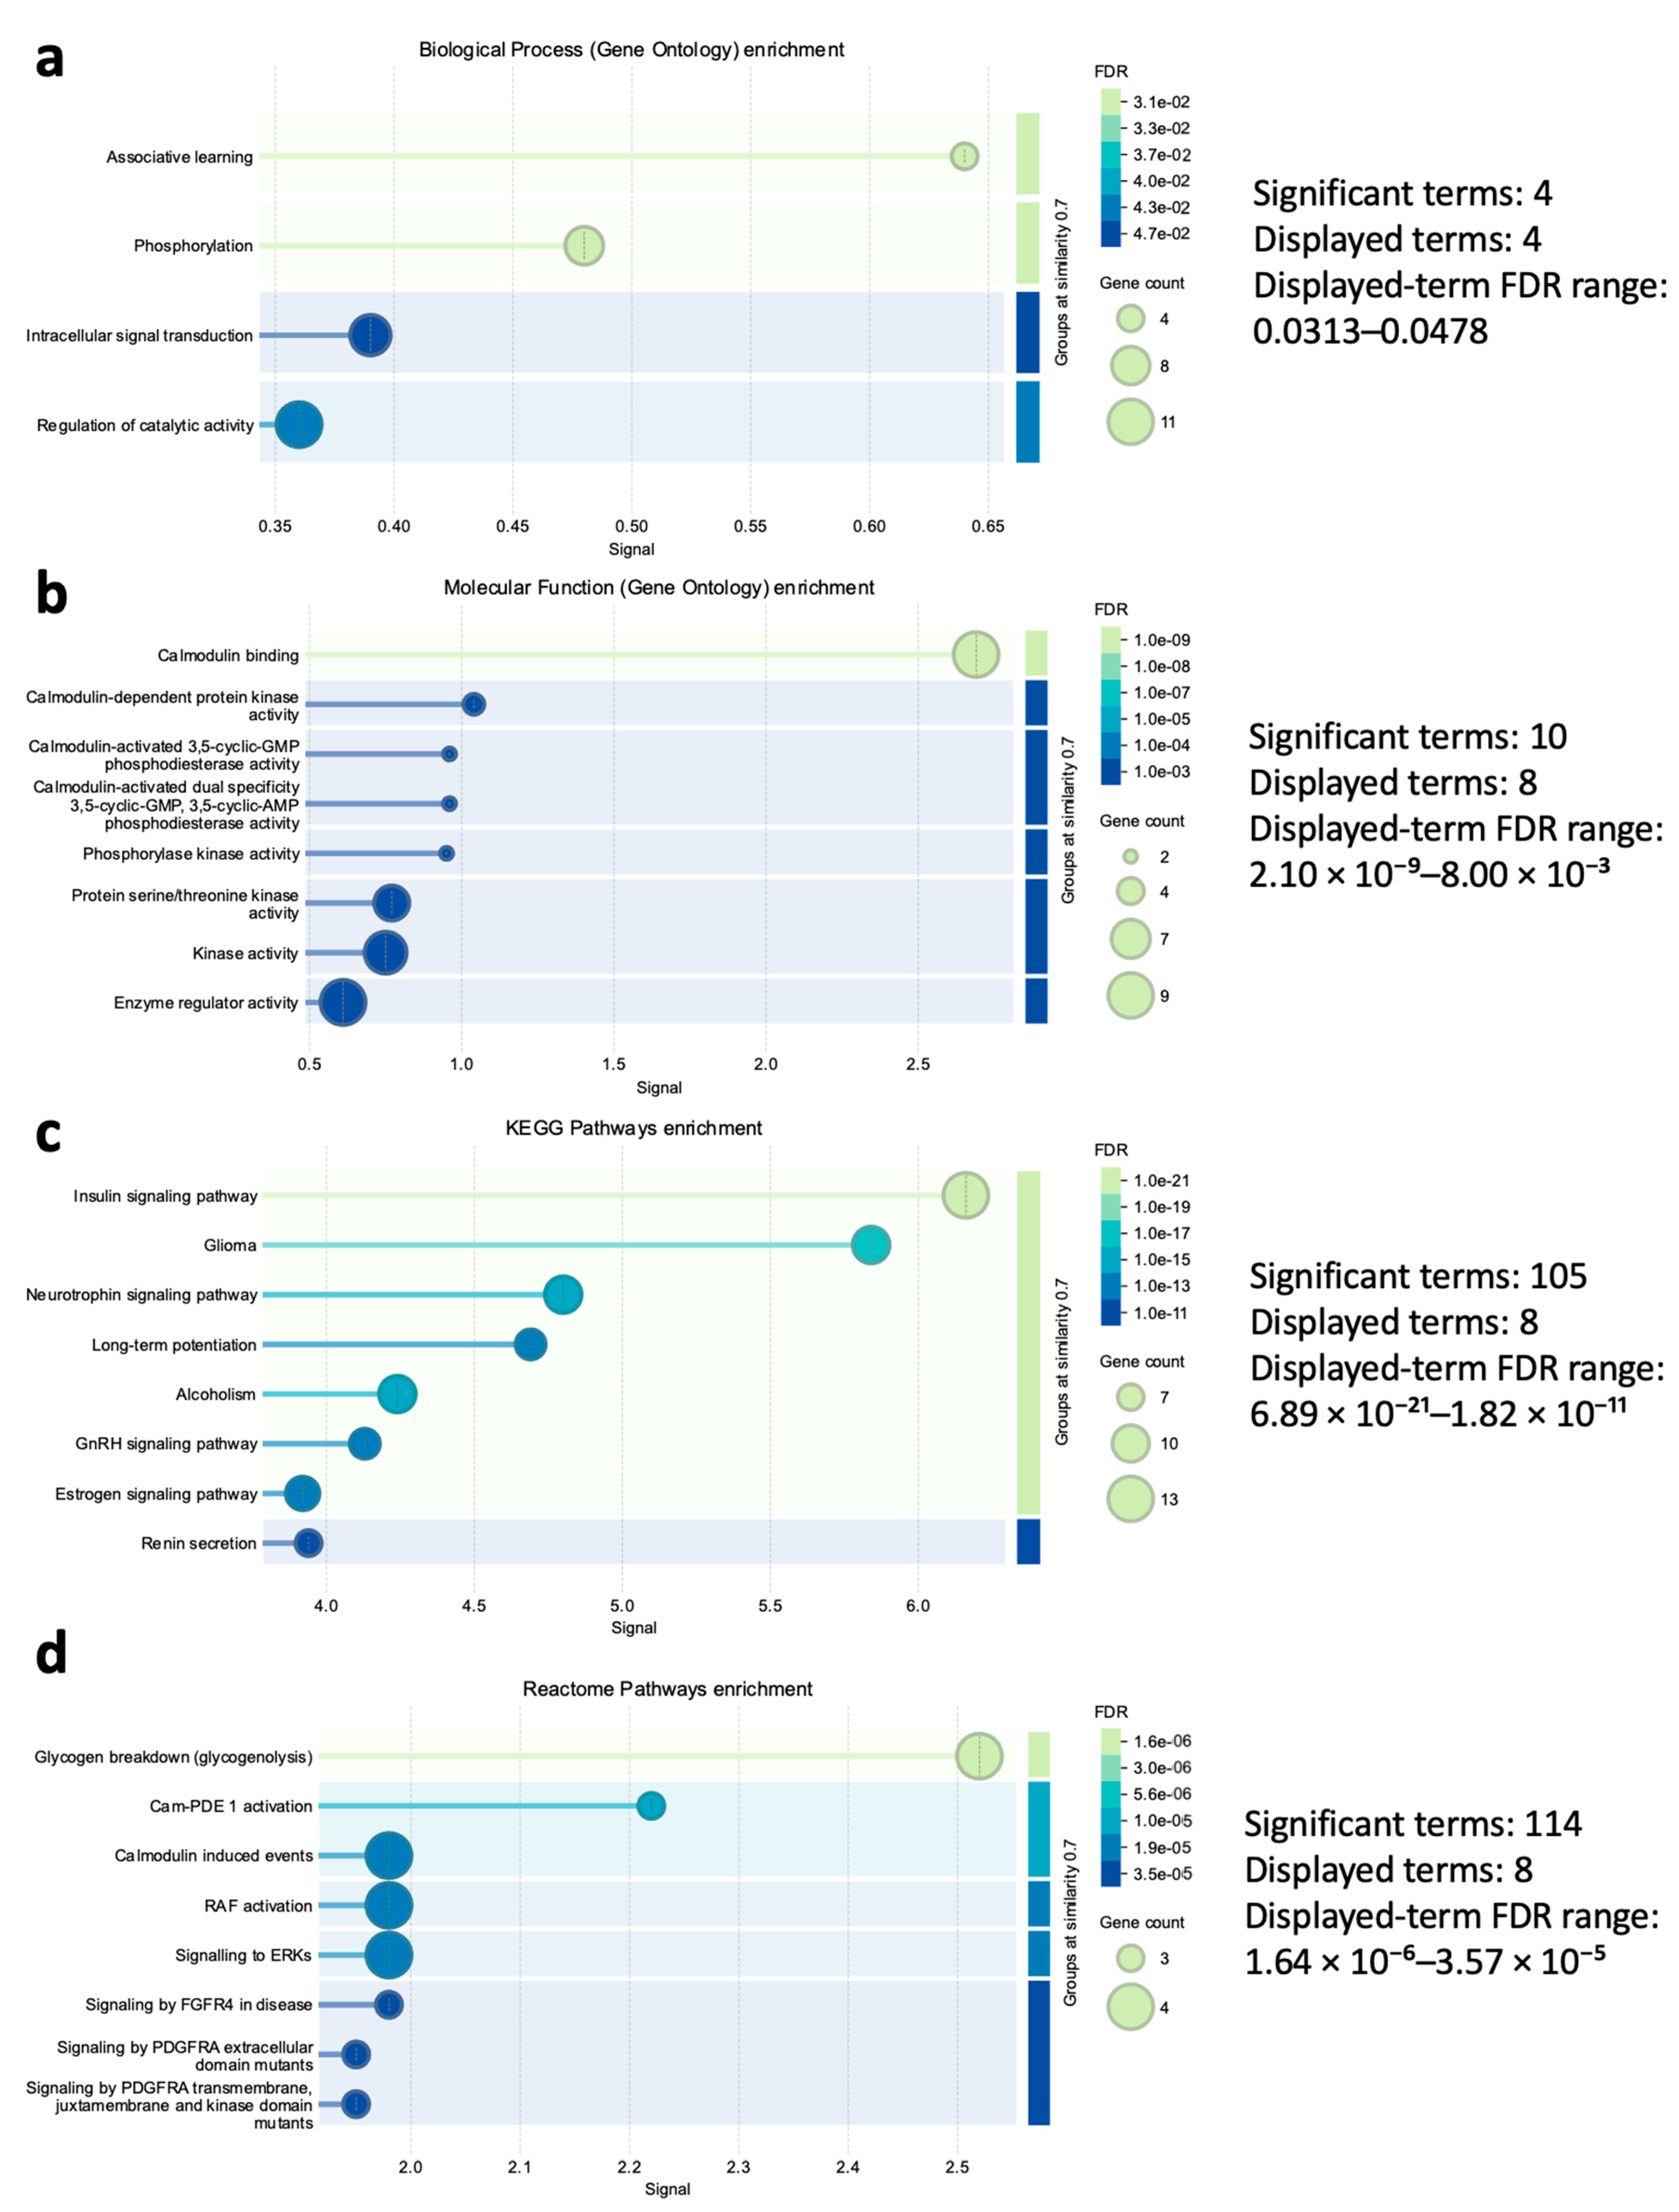

Table 1.
Curated approved drug–protein target mapping.
| Gene symbol | Drug Name | DrugBank ID |
Drug Type | Drug Action | Cancer Use | Already Directly Used for Cancer | Repurposing Candidate |
|---|---|---|---|---|---|---|---|
| BRAF | Avutometinib | DB15254 | Small molecule | Inhibitor | Direct_antitumor | Yes | No |
| BRAF | Dabrafenib | DB08912 | Small molecule | Inhibitor | Direct_antitumor | Yes | No |
| BRAF | Encorafenib | DB11718 | Small molecule | Inhibitor | Direct_antitumor | Yes | No |
| BRAF | Fostamatinib | DB12010 | Small molecule | Inhibitor | No_approved_cancer_use | No | Conditional |
| BRAF | Regorafenib | DB08896 | Small molecule | Inhibitor | Direct_antitumor | Yes | No |
| BRAF | Ripretinib | DB14840 | Small molecule | Inhibitor | Direct_antitumor | Yes | No |
| BRAF | Sorafenib | DB00398 | Small molecule | Inhibitor | Direct_antitumor | Yes | No |
| BRAF | Tovorafenib | DB15266 | Small molecule | Inhibitor | Direct_antitumor | Yes | No |
| BRAF | Vemurafenib | DB08881 | Small molecule | Inhibitor | Direct_antitumor | Yes | No |
| CALM3 | Calcium citrate | DB11093 | Small molecule | Agonist | No_approved_cancer_use | No | No |
| CALM3 | Calcium Phosphate | DB11348 | Small molecule | Agonist | No_approved_cancer_use | No | No |
| CALM3 | Calcium phosphate dihydrate | DB14481 | Small molecule | Not specified | No_approved_cancer_use | No | No |
| CALM3 | Halofantrine | DB01218 | Small molecule | Modulator | No_approved_cancer_use | No | No |
| CALM3 | Trifluoperazine | DB00831 | Small molecule | Inhibitor | No_approved_cancer_use | No | Conditional |
| CAMKK1 | Fostamatinib | DB12010 | Small molecule | Inhibitor | No_approved_cancer_use | No | Conditional |
| PDE1B | Bepridil | DB01244 | Small molecule | Inhibitor | No_approved_cancer_use | No | No |
| PDE1B | Felodipine | DB01023 | Small molecule | Inhibitor | No_approved_cancer_use | No | Conditional |
| PDE1B | Nicardipine | DB00622 | Small molecule | Inhibitor | No_approved_cancer_use | No | Conditional |
| PIK3CA | Alpelisib | DB12015 | Small molecule | Inhibitor | Direct_antitumor | Yes | No |
| PIK3CA | Caffeine | DB00201 | Small molecule | Inhibitor | No_approved_cancer_use | No | No |
| PIK3CA | Copanlisib | DB12483 | Small molecule | Inhibitor | Direct_antitumor_withdrawn | Yes | No |
| PIK3CA | Inavolisib | DB15275 | Small molecule | Inhibitor | Direct_antitumor | Yes | No |
| RAF1 | Avutometinib | DB15254 | Small molecule | Inhibitor | Direct_antitumor | Yes | No |
| RAF1 | Cholecystokinin | DB08862 | Biotech / peptide | Not specified | No_approved_cancer_use | No | No |
| RAF1 | Dabrafenib | DB08912 | Small molecule | Inhibitor | Direct_antitumor | Yes | No |
| RAF1 | Encorafenib | DB11718 | Small molecule | Inhibitor | Direct_antitumor | Yes | No |
| RAF1 | Fostamatinib | DB12010 | Small molecule | Inhibitor | No_approved_cancer_use | No | Conditional |
| RAF1 | Regorafenib | DB08896 | Small molecule | Inhibitor | Direct_antitumor | Yes | No |
| RAF1 | Sorafenib | DB00398 | Small molecule | Inhibitor | Direct_antitumor | Yes | No |
| RAF1 | Tovorafenib | DB15266 | Small molecule | Inhibitor | Direct_antitumor | Yes | No |
Table 2.
Current indications and literature support for the prioritised drugs.
| Candidate drug | Indication(s) recorded in DrugBank* | KRAS-relevant cancer evidence | Supporting original text and location in reference |
|---|---|---|---|
| Fostamatinib; R788; active metabolite R406 |
Chronic immune thrombocytopenia following an insufficient response to previous therapy | R406 showed greater activity in KRAS-dependent than in KRAS-independent cancer cells. | Singh et al.23: “Thus, overall, K-Ras-dependent cell lines demonstrated substantially greater sensitivity to pharmacologic Syk inhibition than K-Ras-independent cell lines.” Results; Figure 6E. Baluom et al.24: “Fostamatinib demonstrates rapid and extensive conversion to R406, an inhibitor of SYK.” Abstract, Conclusion. |
| Trifluoperazine | A phenothiazine used to treat depression, anxiety, and agitation. |
Trifluoperazine was tested as a single agent in KRAS-dependent cells. | Manoharan et al.25: “two KRAS dependent cell lines (NCI-H358 and MDA-MB-231)” and “a similar level of inhibition as with the combination was achieved using only the PTZ trifluoperazine.” Figure 1B. |
| Felodipine | To treat hypertension. | Felodipine reduced MYO10-induced filopodia in MDA-MB-231 cancer cells; this cell line was independently reported as KRAS-dependent25. |
Jacquemet et al.26: “four structurally distinct CCBs (amlodipine besylate, felodipine, manidipine dichloride and cilnidipine) were demonstrated to significantly reduce the number of MYO10-induced filopodia.” Results; Figure 1a. |
| Nicardipine | To treat high blood pressure and chest pain. |
Nicardipine reduced colony formation, migration and invasion in MDA-MB-231 breast cancer cells; this cell line was independently reported as KRAS-dependent25. | Chen et al.27: “Nicardipine dose dependently decreased colony formation, cell migration, and invasion on breast cancer cells.” Figure 2; MDA-MB-231 panels A, C, E, G, I and K. |
* Current approved indications were obtained from DrugBank entries DB12010, DB00831, DB01023 and DB0062222. * Abbreviations: CCBs, calcium-channel blockers; PTZ, phenothiazine; SYK, spleen tyrosine kinase.
Disclaimer/Publisher’s Note: The statements, opinions and data contained in all publications are solely those of the individual author(s) and contributor(s) and not of MDPI and/or the editor(s). MDPI and/or the editor(s) disclaim responsibility for any injury to people or property resulting from any ideas, methods, instructions or products referred to in the content. |
© 2026 by the authors. Licensee MDPI, Basel, Switzerland. This article is an open access article distributed under the terms and conditions of the Creative Commons Attribution (CC BY) license (http://creativecommons.org/licenses/by/4.0/).
Copyright: This open access article is published under a Creative Commons CC BY 4.0 license, which permit the free download, distribution, and reuse, provided that the author and preprint are cited in any reuse.


