
Submitted:
18 July 2026
Posted:
20 July 2026
You are already at the latest version
Abstract
To address the difficulty in accurately reproducing the acoustic boundary conditions of an aero-engine combustor, an equivalent simulation method using perforated plates is proposed.Equivalent perforated plates were designed based on the acoustic reflection characteristics of compressor and turbine guide vanes. Their reflection coefficients (0–1000 Hz) were measured under various combustion conditions using the two-microphone method and validated against numerical simulations.The combustor's dominant acoustic response is jointly driven by pressure, temperature, and combustion conditions. The perforated plates effectively modified the acoustic boundaries by shifting the dominant frequency and reducing peak sound pressure. Additionally, the reflection coefficient increased with frequency, with outlet values consistently higher than inlet values , showing strong agreement between experiments and simulations.This perforated-plate model accurately characterizes the acoustic properties of blade rows. It provides reliable technical support for thermoacoustic stability testing, boundary reconstruction, and combustion instability prediction.
Keywords:
aero-engine combustor
; combustion oscillations
; acoustic boundary conditions
; two-microphone method
; perforated plate
; acoustic reflection coefficient
1. Introduction
The combustion oscillation of gas turbines seriously affects the operational safety and performance of the entire engine. When the phenomenon of combustion oscillation occurs, it causes the combustor to emit massive noise and generate severe vibrations, which has a serious impact on the safe operation of the engine[1]. The stability of the thermoacoustic system depends on the balance between the acoustic energy gain from the unsteady heat release of the flame and the acoustic energy dissipation of the system[2,3]. Moreover, the geometry and acoustic boundary conditions of the combustor determine the acoustic modes of the system, while the upstream and downstream acoustic boundaries directly control acoustic reflection, transmission, and impedance distribution. Therefore, accurately characterizing the acoustic properties of the combustor and its boundary conditions is of great significance for the research and diagnosis of combustion oscillation characteristics[4].
The combustor is located between the compressor and the turbine, and its acoustic boundaries are directly determined by the characteristics of these components. The compressor acts as the upstream working fluid compression component for the combustor, and its impedance characteristics determine the upstream acoustic boundary, with its performance characterized by the inlet-to-outlet compression ratio. Under quasi-steady conditions, its acoustic reflection characteristics can be estimated by the slope of the compressor characteristic curve. Dowling[5] et al. found in their research that the longitudinal acoustics of the upstream plenum and the downstream combustor in the combustion system can be decoupled under certain conditions. Stow[6] et al. determined the effective range of asymptotic theory by studying the minute disturbances of choked flow in a thin annular nozzle. Lohse[7] applied 3D aeroacoustic numerical simulations to calculate the acoustic reflection and transmission characteristics of a single compressor stage. Silva et al.[8] further established a compressor boundary model suitable for thermoacoustic modal calculations, improving the accuracy of thermoacoustic predictions for combustors.
In a gas turbine, the downstream of the combustor is connected to the turbine, where the airflow is sharply accelerated. Due to the non-negligible indirect noise generated by the acceleration of entropy and vortex disturbances[9], the downstream acoustic boundary becomes more complex. The downstream acoustic boundary conditions can be approximated through analytical methods. Marble and Candel [10] proposed a quasi-1D, low-disturbance nozzle acoustic impedance prediction method, and later Cumpsty and Marble[11] extended this method to 2D and arbitrary frequencies. Leyko et al.[12] and Mishra et al.[13] compared actuator-disk theory with non-linear time-domain calculation results of 2D turbine stators; subsequently, Bauerheim et al.[14] extended this research validation to 2D turbine stage scenarios. However, due to non-compact effects, the actuator-disk method is inaccurate at higher frequencies. Kaji et al.[15,16] proposed the semi-actuator disk theory, treating the blade row equivalently as a finite-chord flat plate model, which improved the predictive capability of cascade sound propagation. Based on this, Brind et al.[17] expanded it into an annular semi-actuator disk model, achieving accurate predictions of acoustic propagation characteristics under the non-uniform flow fields of annular cascades.
Existing research on combustor acoustic boundaries mainly focuses on analytical impedance models and cascade sound propagation theories. For actual high-temperature and high-pressure combustion environments, direct measurement of real cascade boundaries and full-scale numerical simulations are highly costly due to complex blade geometries, strong flow non-uniformity, and significant unsteady combustion coupling effects; additionally, it is difficult to achieve independent parameter control in experiments. In contrast, perforated plates offer advantages such as structural simplicity, adjustable impedance, and ease of engineering implementation. Therefore, based on a piecewise fitting method, this paper designed a perforated plate boundary capable of equivalently simulating the acoustic reflection characteristics of cascades. By building a single-dome combustor multi-condition (281-864 kPa) combustion test system, this study mainly investigates the variation laws of inlet and outlet acoustic reflection coefficients within the 0-1000 Hz frequency band concerning pressure, temperature, and combustion status. Combined with numerical acoustic simulations of the blade row, the applicability and limitations of this perforated-plate equivalent model were evaluated. The research results aim to provide a low-cost equivalent simulation scheme and technical support for thermoacoustic stability testing, boundary condition construction, and combustion oscillation prediction of aero-engine combustors.
2. Methodology
2.1. Design of Perforated Plates
This paper focuses on the overall boundary reflection characteristics within the low-frequency thermoacoustic modal range of the combustor. In this frequency band, the primary influence of the blade row on sound wave propagation can be equivalent to an average acoustic impedance effect; thus, a perforated plate with adjustable impedance characteristics is utilized to perform equivalent simulations of the overall acoustic behavior of the blades. To ensure the perforated plates could achieve the effect of simulating real blades, this study selected fixed blade combinations, including the inlet (compressor outlet) and outlet (turbine inlet), as research objects, determining their perforated plate features through theoretical and simulation methods. The blade installation angle(γ) is 55°, the blade spacing(t) is 16.7 mm, and the blade blockage ratio(σb) is 0.77. The compressor and turbine blades share the same geometry, but the calculation cross-sections were taken at the compressor outlet and the turbine inlet, respectively.
The geometric structures adopted for the compressor and turbine blades are identical, but since the compressor blades are located upstream of the combustor and the turbine blades are located downstream, their research models also differ. That is, the compressor blade outlet serves as the calculation section, and the turbine blade inlet serves as the calculation section, as shown in Figure 1.
Based on a piecewise fitting method, the reflection coefficient curve of the blades before 1500 Hz was fitted. Based on the fitting results, and taking into account the requirement to minimize pressure loss, the geometric parameters of the perforated plates were determined: the diameters of the two circular perforated plates are 156 mm and 136 mm, respectively. To achieve a uniform distribution of small holes, an optimization algorithm was used for layout design, yielding 31 and 19 holes respectively, as shown in Figure 2. This corresponds to actual perforation rates of 0.14 and 0.201, hole diameters of 10.5 mm and 14 mm, and plate thicknesses of 10 mm and 15.9 mm, respectively.
Numerical simulation calculations were performed on the obtained perforated plates, and the acoustic impedance of the perforated plates was converted into reflection coefficients using the impedance method. The results obtained under standard temperature and pressure without flow were compared with the reflection coefficients of the blades, as shown in Figure 3.
Due to the rounding effect of the number of holes, a slight deviation exists between the actual perforation rate of the plates and the designed values, causing slight differences in the reflection coefficient curves; however, the overall trend remains consistent, and the error falls within an acceptable range. This deviation stems from the inherent acoustic characteristics of the perforated plates: under no-flow conditions, the imaginary part of their acoustic impedance changes linearly with frequency, and the slope of the reflection coefficient curve is higher than that of the blades. Only in the high-frequency band does the slope of the perforated plate approach zero, whereas the blade curve flattens out at lower frequencies. Therefore, the perforated plates show excellent fitting performance at low frequencies but a drop in accuracy at high frequencies; increasing the blade blockage ratio could improve high-frequency fitting performance. Since the research scope of this study is 0-1000 Hz, which is a lower frequency band, this has no impact on the results.
It should be pointed out that the fitting and comparison shown in Figure 3 are based on normal temperature and pressure under no-flow (cold-state) conditions. Although the geometric parameters of the perforated plate obtained through cold-state design cannot output absolute impedance values entirely consistent with the cold state when under hot states, this solidified physical boundary still retains a strong spatial geometric blockage effect. Under low-frequency thermoacoustic modes, the system’s acoustic boundaries are primarily controlled by macroscopic impedance step changes upstream and downstream. The core purpose of using this fixed-geometry cold-state designed perforated plate for multi-condition hot-state testing in this experiment is precisely to verify whether: in real high-temperature, high-pressure, and aeroacoustic flow coupling environments, the physical boundary based on cold-state equivalence still possesses the ability to modify the combustor’s overall acoustic response characteristics and maintain the primary impedance reflection trends.
2.2. Experimental Setup and Measurement Principles
The experimental setup is shown in Figure 4. It mainly consists of inlet and outlet transition sections, inlet and outlet perforated plates, inlet and outlet measurement sections, and a single-head combustor. The inner diameters of the inlet and outlet sections are defined by the perforated plates shown in Figure 4, with values of 156 mm and 136 mm, respectively.To ensure flow uniformity and reduce aerodynamic noise at the outlet of the flow path, an inlet transition section is installed upstream of the inlet perforated plate, and an outlet transition section is installed downstream of the outlet perforated plate. A high-temperature-rise combustor is located between the two perforated plates. The acoustic field is reconstructed by solving the system using multiple pressure sensors installed in the measurement sections.
The reflection coefficient of the perforated plates was measured using the two-microphone method [18]. This method is based on the plane wave assumption. When acoustic waves propagate only in the x-direction, the amplitude and phase of all particles in the yz-plane remain identical, and the wavefronts are parallel. Such waves are defined as plane waves. In this experiment, acoustic waves propagate within a circular duct, and the excitation frequency is below the first cut-off frequency of the duct (the calculation is given in Eq. (1)). Therefore, the measured acoustic field can be regarded as a plane wave field during the experiment.
where fc is the cut-off frequency (Hz),c is the speed of sound (m/s), and D is the inner diameter of the impedance tube (m).In this test, the cross-sectional diameters at standard temperature and pressure are 156 mm and 136 mm. The calculated first-order cut-off frequency at room temperature is 1290 Hz. Under actual combustion operating conditions (such as B4, B5 where the inlet temperature reaches 554 K, and the medium temperature inside the flame tube is even higher), the speed of sound within the duct significantly increases as the temperature rises. From Equation (1), it can be seen that its hot-state first-order cut-off frequency will be pushed further into higher frequencies (far greater than 1290 Hz). Therefore, within the selected low-frequency analysis range of 0-1000 Hz in this study, the 1D plane wave propagation assumption can be strictly satisfied across all conditions.
In the impedance tube test, the sound pressure measured by the microphones can be regarded as the superposition of two plane waves propagating in opposite directions along the tube axis, mathematically expressed as Equation 2.
where and denote the amplitudes of the incident and reflected waves, respectively, k is the wavenumber, and x is the axial coordinate. Based on the propagation characteristics of plane waves, the acoustic field can be decomposed using the pressure signals measured at different locations, thereby obtaining the parameters of the incident and reflected waves.
When multiple measurement points are used, the sound pressure at each location satisfies a system of linear equations. Equation (3) describes this relationship. For convenience of solution, the system of equations can be reformulated into a matrix form as follows:
In this formulation, and are unknown variables. When n=m=2 , the method corresponds to the two-microphone technique, whereas for m>2, it becomes a multi-microphone method. It should be noted that when ks=nπ , the coefficient matrix may become singular. In this experiment, the microphone spacing is 40 mm, and this condition is avoided.
After decomposing the plane wave field, the acoustic reflection coefficient can be calculated using the two-microphone method. Let the spacing between the two measurement points be sss, and the distances from the test surface to microphones 1 and 2 be x1 and x2, respectively, with x1>x2. A coordinate system is established with the test surface located at x=0.
In this study, when measuring the reflection coefficient of the upstream perforated plate, the mounting surface of the upstream plate is defined as the reference plane x=0, and the positive direction of the x-axis is taken to the right. Conversely, when measuring the downstream perforated plate, the mounting surface of the downstream plate is also taken as the reference plane x=0, but the positive direction of the x-axis in the downstream measurement section is defined to the left.
Based on the two-point transfer function of sound pressure H12=p2/p1, the reflection coefficient can be expressed as Eq. (4):
To ensure measurement accuracy, the microphone locations must satisfy s<c0/2fmax and x2>c0/fmax, where c0 is the speed of sound in air and fmax is the upper limit of the analysis frequency (1000 Hz in this study). These constraints are imposed to avoid strong interference effects caused by standing waves.
For the present experimental system, pressure signals were acquired at each measurement point under different operating conditions, and the reflection coefficients of the inlet and outlet perforated plates were evaluated separately. During the calculation, the perforated plate surface was taken as the reference plane. The frequency-domain amplitude and phase information at each measurement location were obtained via Fast Fourier Transform (FFT), and the reflection coefficients were subsequently determined.
To improve the signal-to-noise ratio, frequency points corresponding to spectral peaks or satisfying a predefined amplitude threshold were typically selected for the calculation.
2.3. Experimental Conditions
To investigate the influence of perforated plates on the acoustic boundary and to provide impedance boundary conditions for subsequent numerical simulations, the experiments were divided into two groups based on the presence or absence of perforated plates. Specifically, Case A corresponds to the configuration without perforated plates, while Case B corresponds to the configuration with perforated plates.
Case A was used to obtain the intrinsic acoustic response of the combustor, whereas Case B was used to measure the reflection coefficients of the perforated boundaries and to provide impedance boundary conditions for numerical simulations. The operating conditions covered an inlet pressure range of 281–856 kPa. The air and fuel flow rates were adjusted to ensure stable combustion, thereby reproducing different operating states of aero-engine combustors.
According to the inlet pressure levels, the operating conditions were categorized into three regimes: low-pressure, medium-pressure, and high-pressure conditions. The detailed parameters for each case are listed in Table 1.
3. Results
Since the calculation of the reflection coefficient is based on frequency-domain acoustic pressure signals, the spectral characteristics of the pressure directly affect the stability and reliability of the results. When the pressure amplitude at a certain frequency is too low, the signal-to-noise ratio becomes poor, which may lead to phase distortion and consequently introduce significant errors in the calculated reflection coefficient.
Therefore, prior to the reflection coefficient analysis, the spectral characteristics of the acoustic pressure signals under different operating conditions are first examined in order to identify the dominant frequency bands and principal spectral components of the system.
3.1. Frequency-Domain Analysis
During the data processing procedure, the raw acoustic pressure signals were affected by background noise from the experimental system. In particular, the frequency components around 50 Hz were significantly contaminated by electromagnetic interference originating from upstream electrical equipment operating at the power-line frequency, leading to an abnormal increase in local spectral amplitudes. Therefore, this frequency band was excluded from subsequent analysis.
Since this experiment employs a self-excited acoustic source, in which acoustic waves generated by the combustor are used to determine the reflection coefficients of the inlet and outlet perforated plates, frequency-domain analysis of the acoustic signals is essential. As shown in Figure 5, each operating condition exhibits one or several dominant frequency components with relatively high acoustic pressure amplitudes. These frequency regions are considered to have a higher signal-to-noise ratio, and the corresponding reflection coefficient results are therefore expected to be more reliable and are selected for detailed analysis.
Figure 6(a) presents the variation of dominant frequencies under different operating conditions. It can be observed that the dominant frequency does not increase monotonically with inlet pressure, but is instead influenced by multiple factors, including inlet pressure, temperature, air mass flow rate, and combustion conditions. Among them, the medium-pressure cases exhibit relatively higher dominant frequencies, while a decrease is observed under high-pressure conditions, indicating that the dominant acoustic modes of the combustor are adjusted with changing operating parameters.
Overall, the dominant frequencies change to some extent before and after the installation of the perforated plates, suggesting that modifications to the inlet and outlet acoustic boundary conditions have a measurable impact on the overall acoustic field of the combustor.
Figure 6(b) compares the peak acoustic pressure amplitudes corresponding to the dominant frequencies with and without perforated plates for all operating conditions. In general, the peak amplitudes decrease after the installation of the perforated plates, indicating that the modified inlet and outlet acoustic boundary conditions introduce additional acoustic energy dissipation during wave propagation, thereby attenuating the combustor acoustic response. This demonstrates that the perforated plates not only reproduce the impedance characteristics of blade-row boundaries but also provide a certain degree of acoustic damping, laying the foundation for subsequent reflection coefficient analysis.
3.2. Reflection Coefficients under Different Operating Conditions
After preprocessing to eliminate the 50 Hz power-line interference and low signal-to-noise-ratio frequency components, the acoustic reflection coefficients at the combustor inlet and outlet were determined over the frequency range of 0–1000 Hz using the two-microphone method and compared with the corresponding numerical results. The numerical reflection coefficients were obtained from three-dimensional acoustic simulations of the perforated plates with the corresponding geometries, in which the experimentally measured operating parameters under each test condition were prescribed as boundary conditions. Particular attention was paid to the reflection coefficients around the dominant frequencies associated with high sound pressure amplitudes. As shown, the reflection coefficients of the perforated plates increase with frequency under all operating conditions. This behavior is mainly attributed to the increase in acoustic inertial impedance with frequency. Moreover, low-frequency acoustic waves possess longer wavelengths and therefore exhibit stronger transmission through the perforated plates. As the frequency increases, the acoustic transmission capability gradually weakens, resulting in enhanced sound reflection and consequently higher reflection coefficients.
Figure 7 compares the experimental and numerical acoustic reflection coefficients at the combustor inlet and outlet under low-pressure operating conditions (281–309 kPa). Under condition B1, relatively high reflection coefficients are observed over the entire frequency range at both the inlet and outlet, and are consistently higher than those under condition B2, indicating that the acoustic response is more sensitive to variations in boundary impedance under low-pressure conditions. With a slight increase in inlet pressure, temperature, and excess air ratio, the overall reflection coefficients under condition B2 decrease while maintaining a frequency-dependent trend similar to that of B1, suggesting a reduction in the degree of boundary impedance mismatch.
A comparison between the two operating conditions further reveals that condition B1, with a lower excess air ratio of 3.74, exhibits stronger combustion heat-release fluctuations, resulting in noticeable discrepancies between the experimental and numerical reflection coefficients below 200 Hz. These deviations are mainly attributed to local acoustic disturbances induced by the coupling between unsteady vortex shedding and combustion oscillations under low-pressure and low-flow-velocity conditions. In contrast, condition B2, with a higher excess air ratio of 4.34, exhibits improved combustion stability and weaker heat-release fluctuations, leading to significantly better agreement between the experimental and numerical results. This indicates that, under low-pressure conditions, the acoustic boundary is highly sensitive to the excess air ratio, and even slight variations in the combustion state can be reflected in the experimentally measured reflection coefficients.
Furthermore, under low-flow-velocity conditions, the inertial effect of the jet flow inside the perforations remains relatively weak, resulting in a less pronounced acoustic added-mass effect of the perforated plate. Consequently, low-frequency acoustic waves can be transmitted more readily through the perforations, leading to experimentally measured reflection coefficients that are lower than the numerical predictions in the low-frequency range. In addition, the relatively small acoustic impedance discontinuity across the perforated plate under low-pressure conditions limits the reflection of mid- and high-frequency acoustic waves. As a result, the reflection coefficient increases only gradually with frequency, while the proportion of acoustic energy contained in the mid- and high-frequency range remains comparatively low.
As the operating condition enters the intermediate pressure range (546–596 kPa), the comparison between the experimental and numerical reflection coefficients is presented in Figure 8. Under condition B3 (546 kPa), the acoustic reflection coefficients at both the combustor inlet and outlet increase progressively with frequency, while the outlet reflection coefficients remain slightly higher than those at the inlet over the entire frequency range. This indicates that the acoustic boundary impedance represented by the outlet perforated plate is still greater than that of the inlet plate. Overall, good agreement is achieved between the experimental measurements and numerical predictions, with only minor discrepancies observed at a few discrete frequencies. Owing to the relatively high excess air ratio of 4.52, combustion remains stable under condition B3, resulting in smooth reflection-coefficient curves. This suggests that the acoustic field is still primarily governed by the boundary impedance, whereas the influence of unsteady combustion on the acoustic response remains limited.
Under condition B4 (596 kPa), the inlet pressure increases by approximately 9% relative to B3, while the inlet temperature rises from 455 K to 554 K. The combined effects of elevated pressure and temperature increase the acoustic impedance difference across the perforated plate, thereby enhancing the boundary impedance mismatch and leading to higher reflection coefficients, particularly in the mid- and high-frequency ranges. Compared with B3, the higher outlet reflection coefficients become more pronounced, indicating that the acoustic impedance discontinuity across the perforated plate is further strengthened under high-temperature and high-pressure conditions. Although the excess air ratio decreases to 3.65 under condition B4, the experimental results remain in good agreement with the numerical predictions, demonstrating that the perforated-plate boundary model can accurately represent the actual acoustic boundary characteristics within this pressure range.
A comparison of conditions B3 and B4 indicates that, within the intermediate pressure range, the variation in reflection coefficient is primarily governed by changes in the characteristic acoustic impedance of the working medium. As the pressure and temperature increase, the reflective capability of the perforated-plate boundary is gradually enhanced, as evidenced by the overall increase in reflection coefficient and the more rapid growth in the mid- and high-frequency regions. Furthermore, the close agreement between the experimental and numerical results throughout this pressure range indicates that the system response remains predominantly linear, allowing the equivalent perforated-plate boundary to accurately reproduce the acoustic characteristics at the combustor inlet and outlet. As the operating pressure increases further, the predictive accuracy of the numerical model exhibits a continuing improvement.
Figure 9 demonstrates that under high-pressure operating conditions (707–856 kPa), the acoustic reflection coefficients at both the combustor inlet and outlet remain elevated, with the outlet consistently exhibiting stronger boundary impedance than the inlet. While the reflection-coefficient curves exhibit an upward shift compared to low- and intermediate-pressure regimes, the variation among conditions B5–B7 is non-monotonic. This observation confirms that reflection characteristics are governed by the coupled effects of pressure, temperature, mass flow rate, and combustion state, rather than pressure alone.
The physical mechanisms underlying this behavior are evident in the comparison of conditions. Under condition B5, The system exhibits smooth, frequency-dependent reflection characteristics, with numerical predictions showing excellent agreement with experimental data, validating the perforated-plate model under stable combustion conditions (excess air ratio: 5.12; inlet temperature: 554 K). Under condition B6 (the local minimum), Despite higher nominal pressure than B5, the reflection coefficient decreases. This is attributed to more intense combustion (excess air ratio: 3.95), which significantly reduces local gas density and increases the through-flow velocity (Mach number). Consequently, enhanced flow separation, vortex shedding, and shear-layer dissipation at the perforations increase acoustic resistance, effectively weakening the acoustic impedance mismatch and offsetting the reflection increase typically associated with higher pressure. Under condition B7, As pressure reaches the study’s maximum, increased gas density re-establishes the dominance of the acoustic impedance mismatch, causing the reflection coefficient to rise again.
Overall, these findings reveal that while higher pressure generally enhances acoustic reflection by increasing characteristic acoustic impedance, high-flow-velocity effects and unsteady combustion interactions introduce significant flow–acoustic coupling. Despite localized fluctuations observed in high-pressure regimes, the sustained consistency between experimental measurements and numerical predictions confirms the robustness and continued engineering applicability of the equivalent perforated-plate boundary model.
4. Conclusions
In this study, perforated plates were employed to provide an equivalent representation of the acoustic blade-row boundaries at the inlet and outlet of an aero-engine combustor. Combined experimental investigations under multiple operating conditions and three-dimensional numerical simulations were conducted to examine the acoustic reflection characteristics of the combustor boundaries over the frequency range of 0–1000 Hz and to elucidate their dependence on operating conditions. The main conclusions are summarized as follows:
(1) The perforated-plate configurations, optimized through piecewise fitting combined with aerodynamic-loss constraints, successfully reproduced the frequency-dependent reflection characteristics of the blade rows. The proposed equivalent boundary method effectively represents the combustor inlet and outlet acoustic boundaries and provides a cost-effective approach for thermoacoustic experiments.
(2) The dominant acoustic response of the combustor is jointly governed by inlet pressure, temperature, mass flow rate, and combustion conditions, and the dominant frequency does not vary monotonically with pressure. The installation of the perforated plates shifts the dominant acoustic frequency and generally reduces the peak sound pressure amplitude, indicating that the equivalent boundaries modify the inlet and outlet acoustic boundary conditions and regulate the acoustic energy distribution within the combustor.
(3) Under all operating conditions, the acoustic reflection coefficients of the perforated plates generally increase with frequency, while the outlet reflection coefficients remain consistently higher than those at the inlet. The overall reflection level increases with operating pressure; however, under high-pressure conditions, the reflection characteristics are simultaneously influenced by flow parameters and combustion state, exhibiting pronounced flow–acoustic coupling. Good agreement between the experimental measurements and numerical predictions validates the effectiveness and engineering applicability of the proposed perforated-plate boundary model for representing combustor inlet and outlet acoustic boundaries.
The findings of this study provide both experimental data and a practical methodology for combustion instability prediction, acoustic damping design, and acoustic boundary modeling in gas-turbine combustors.
References
- Lin, F.; Wang, W.; Li, M. J.; Li, Y. J. Experimental study on oscillation combustion characteristics of gas turbine. J. Eng. Therm. Energy Power 2017, 32(S1), 62–68, 130. [Google Scholar]
- Chu, B. T. On the energy transfer to small disturbances in fluid flow (Part I). Acta Mech. 1965, 1(3), 215–234. [Google Scholar] [CrossRef]
- Dowling, A. P.; Morgans, A. S. Feedback control of combustion oscillations. Annu. Rev. Fluid Mech. 2005, 37(1), 151–182. [Google Scholar] [CrossRef]
- Poinsot, T.; Veynante, D. Theoretical and numerical combustion; RT Edwards, Inc, 2005. [Google Scholar]
- Dowling, A.P.; Stow, S.R. Acoustic analysis of gas turbine combustors[J]. Propuls. Power 2003, 19(5), 751–764. [Google Scholar] [CrossRef]
- Stow, S. R.; Dowling, A. P.; Hynes, T. P. Reflection of circumferential modes in a choked nozzle. J. Fluid Mech. 2002, 467, 215–239. [Google Scholar] [CrossRef]
- Lohse, S.; Koch, R.; Moreau, S.; Fischer, F.; Seume, J. R. Aeroacoustic numerical investigations of a scaled compressor cascade. Proceedings, Global Power and Propulsion Society Chania Conference, September; 2020, September; pp. 7–9. [Google Scholar]
- Silva, C. F.; Duran, I.; Nicoud, F.; Moreau, S. Boundary conditions for the computation of thermoacoustic modes in combustion chambers. AIAA J. 2014, 52(6), 1180–1193. [Google Scholar] [CrossRef]
- Rogers, D. E.; Marble, F. E. A mechanism for high-frequency oscillation in ramjet combustors and afterburners. J. Jet. Propuls. 1956, 26(6), 456–462. [Google Scholar] [CrossRef]
- Marble, F. E.; Candel, S. M. Acoustic disturbance from gas non-uniformities convected through a nozzle. J. Sound. Vib. 1977, 55(2), 225–243. [Google Scholar] [CrossRef]
- Cumpsty, N. A.; Marble, F. E. The interaction of entropy fluctuations with turbine blade rows; a mechanism of turbojet engine noise. Proc. R. Soc. London. A. Math. Phys. Sci. 1977, 357(1690), 323–344. [Google Scholar] [CrossRef]
- Leyko, M.; Duran, I.; Moreau, S.; Nicoud, F.; Poinsot, T. Simulation and modelling of the waves transmission and generation in a stator blade row in a combustion-noise framework. J. Sound. Vib. 2014, 333(23), 6090–6106. [Google Scholar] [CrossRef]
- Mishra, A.; Bodony, D. J. Evaluation of actuator disk theory for predicting indirect combustion noise. J. Sound. Vib. 2013, 332(4), 821–838. [Google Scholar] [CrossRef]
- Bauerheim, M.; Duran, I.; Livebardon, T.; Wang, G.; Moreau, S.; Poinsot, T. Transmission and reflection of acoustic and entropy waves through a stator–rotor stage. J. Sound. Vib. 2016, 374, 260–278. [Google Scholar] [CrossRef]
- Kaji, S.; Okazaki, T. Propagation of sound waves through a blade row: I. Analysis based on the semi-actuator disk theory. J. Sound. Vib. 1970, 11(3), 339–353. [Google Scholar] [CrossRef]
- Kaji, S.; Okazaki, T. Propagation of sound waves through a blade row: II. Analysis based on the acceleration potential method. J. Sound. Vib. 1970, 11(3), 355–IN1. [Google Scholar] [CrossRef]
- Brind, J.; Pullan, G. Modelling turbine acoustic impedance. Int. J. Turbomach. Propuls. Power 2021, 6(2), 18. [Google Scholar] [CrossRef]
- International Organization for Standardization. ISO Standard No. 10534-2:2023; Acoustics: Determination of acoustic properties in impedance tubes—Part 2: Two-microphone technique for normal sound absorption coefficient and normal surface impedance. Geneva, Switzerland, 2023.
Figure 1.
Two-dimensional computational domain of the turbine blade cascade
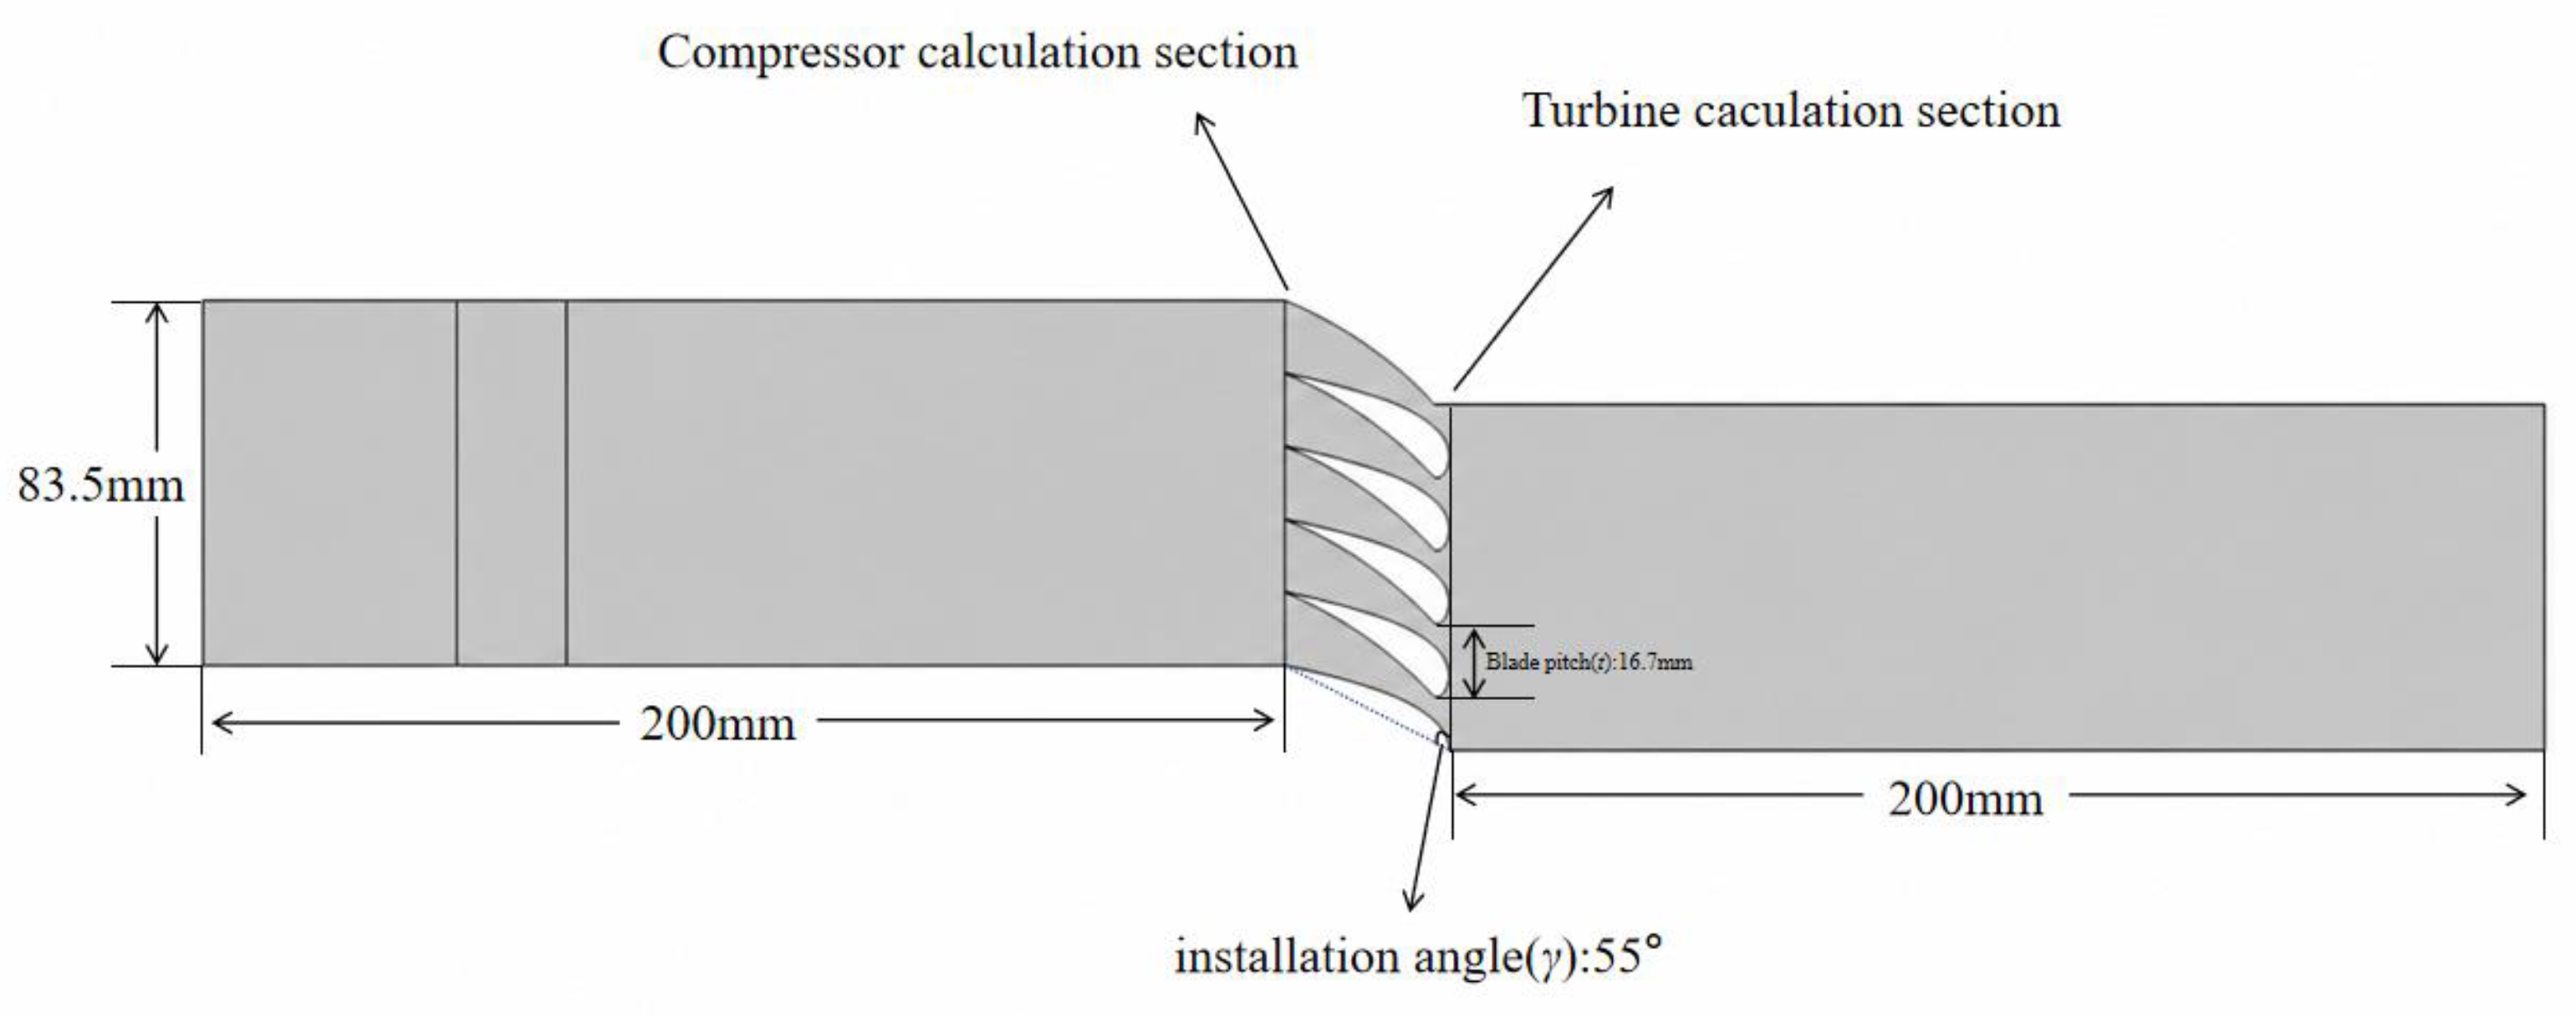
Figure 2.
Perforated plate structure.
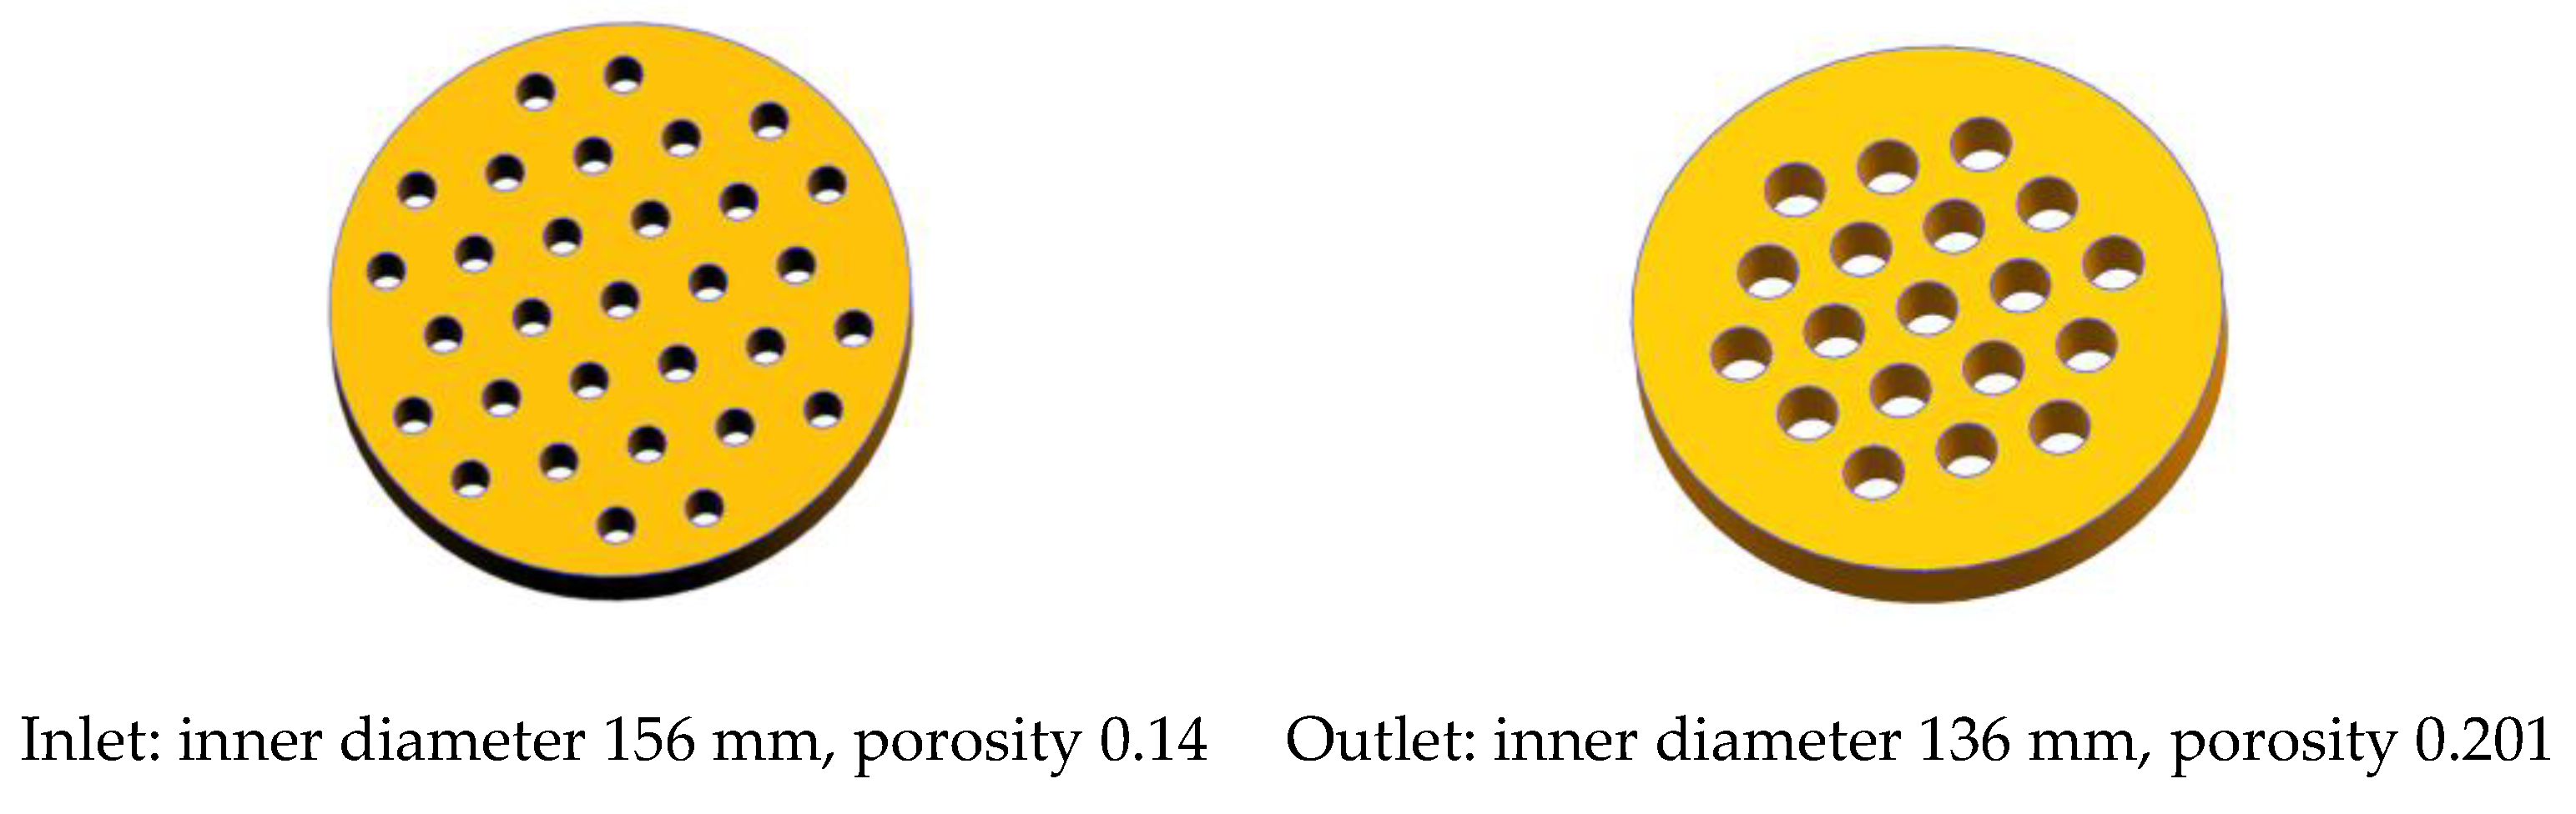
Figure 3.
Comparison curves of reflection coefficients between blades and perforated plates.
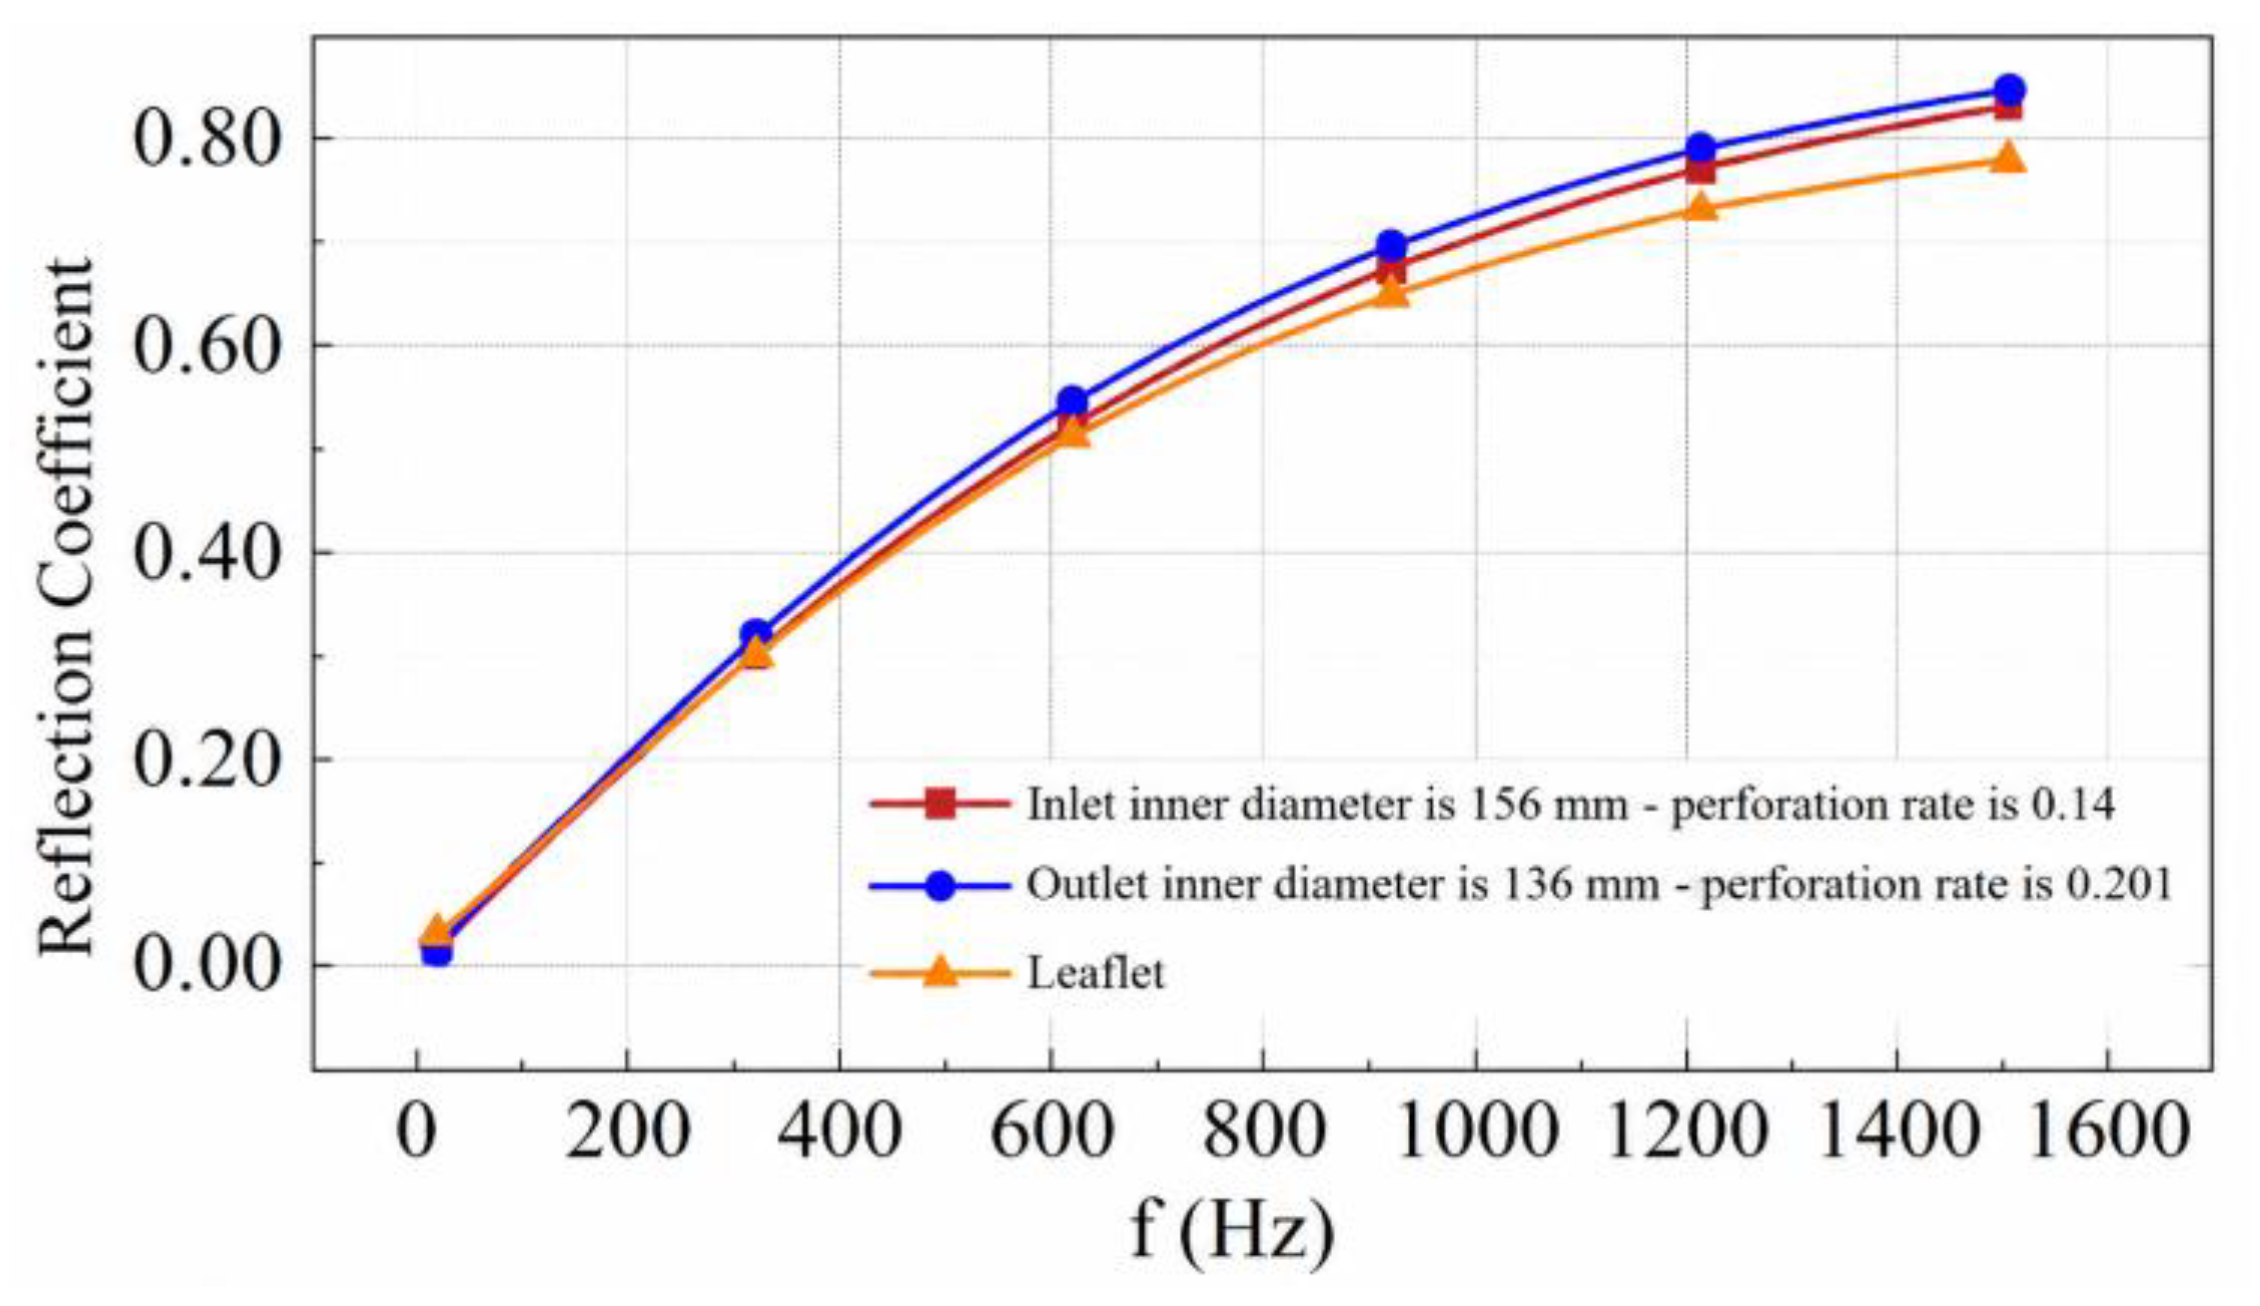
Figure 4.
Experimental setup.
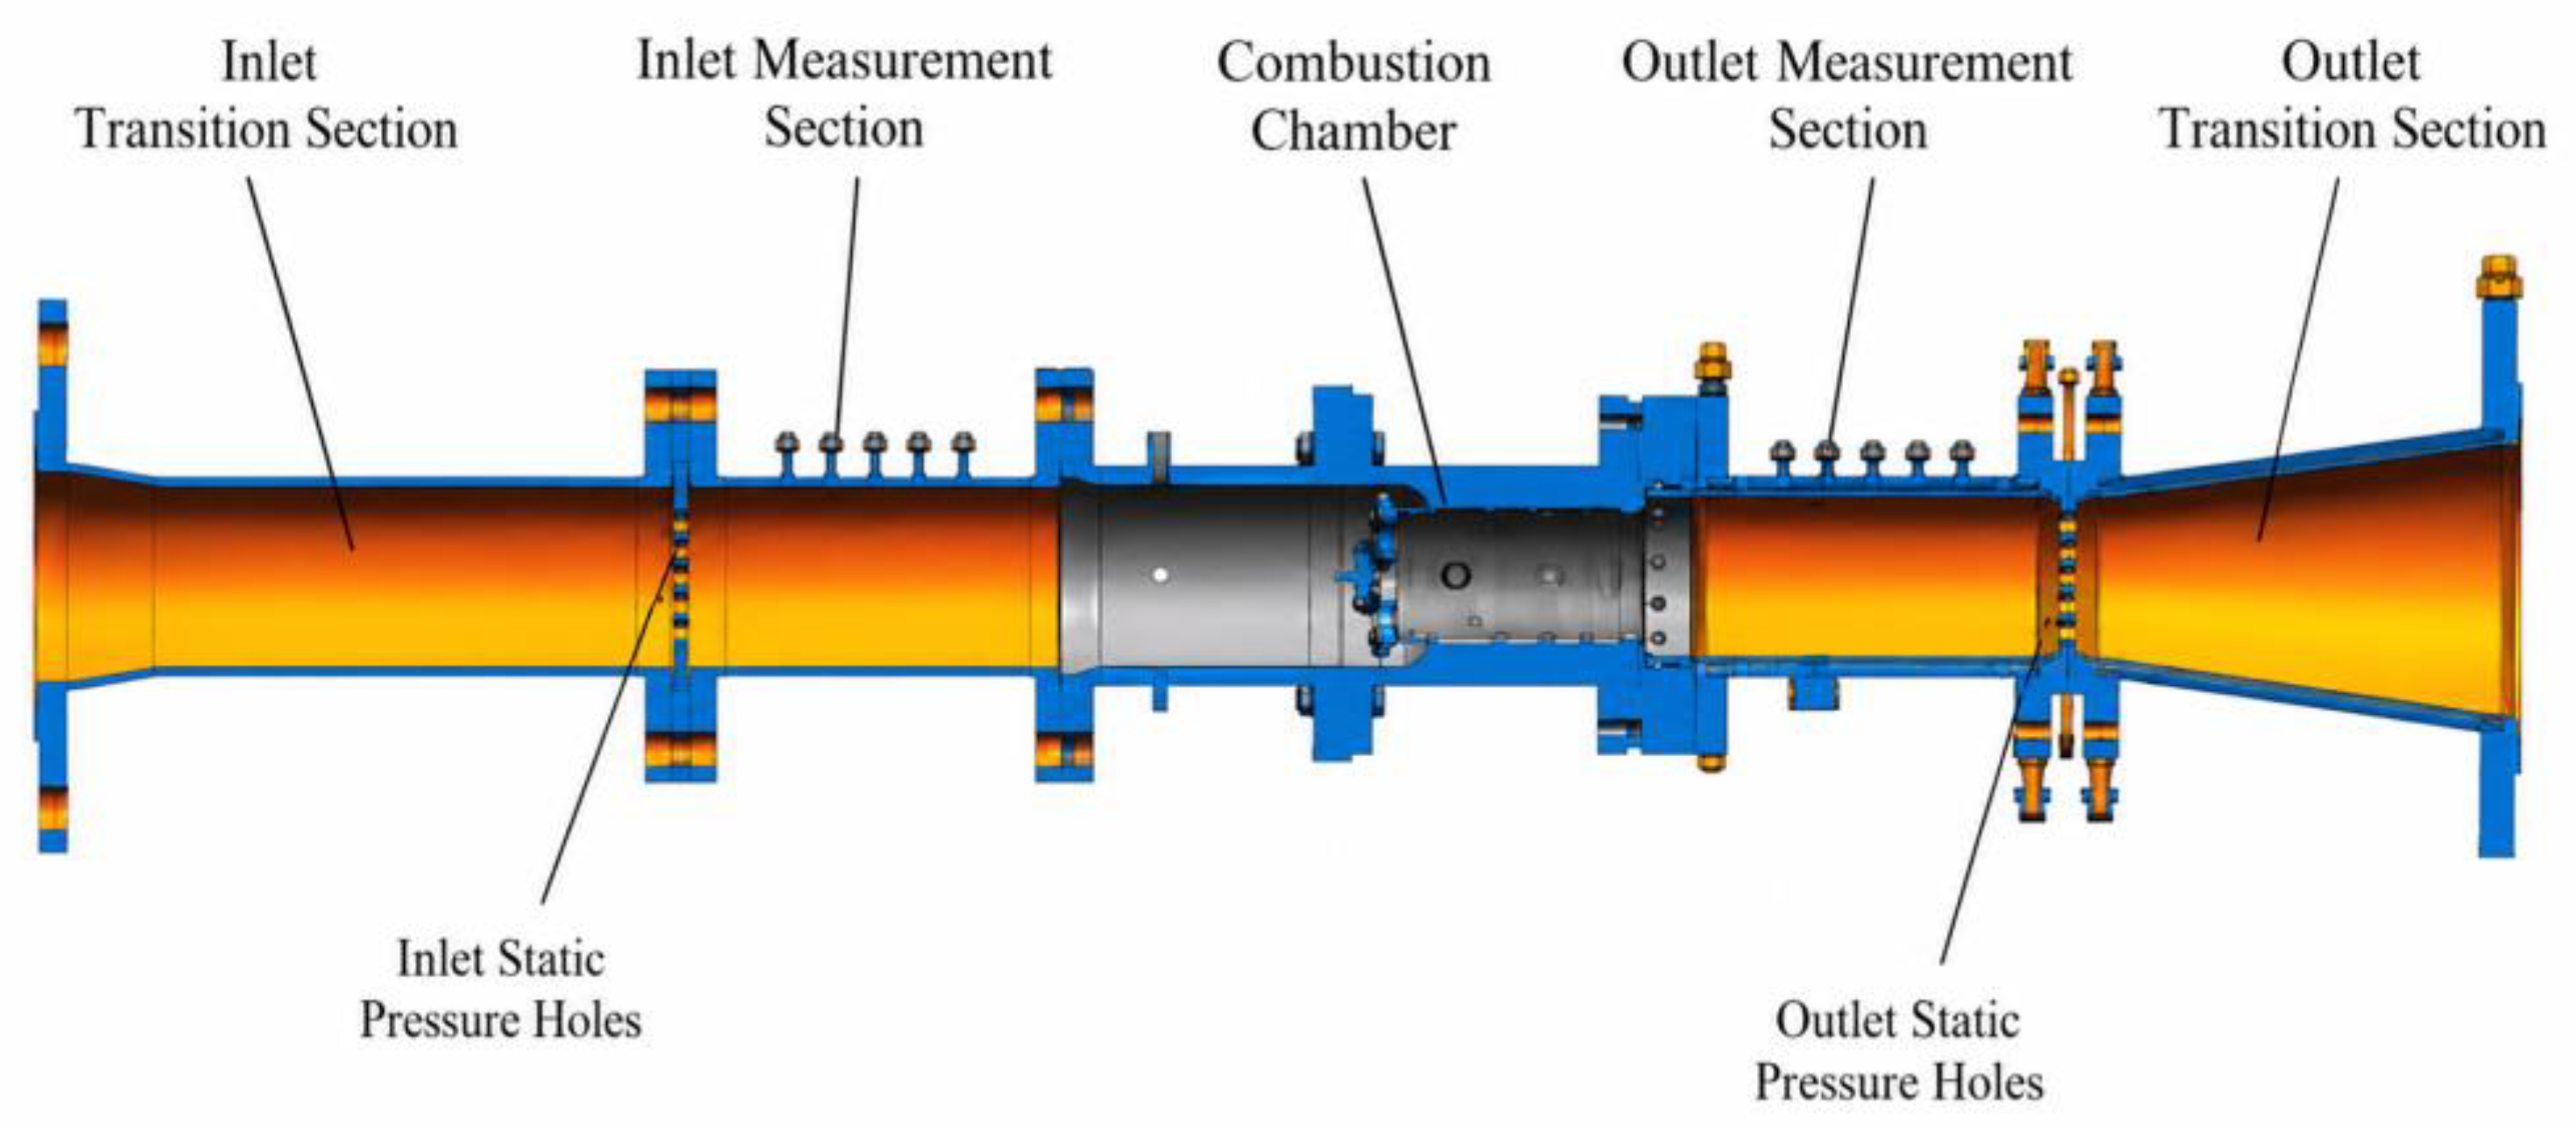
Figure 5.
Comparison of frequency-domain analysis results between Cases A and B.
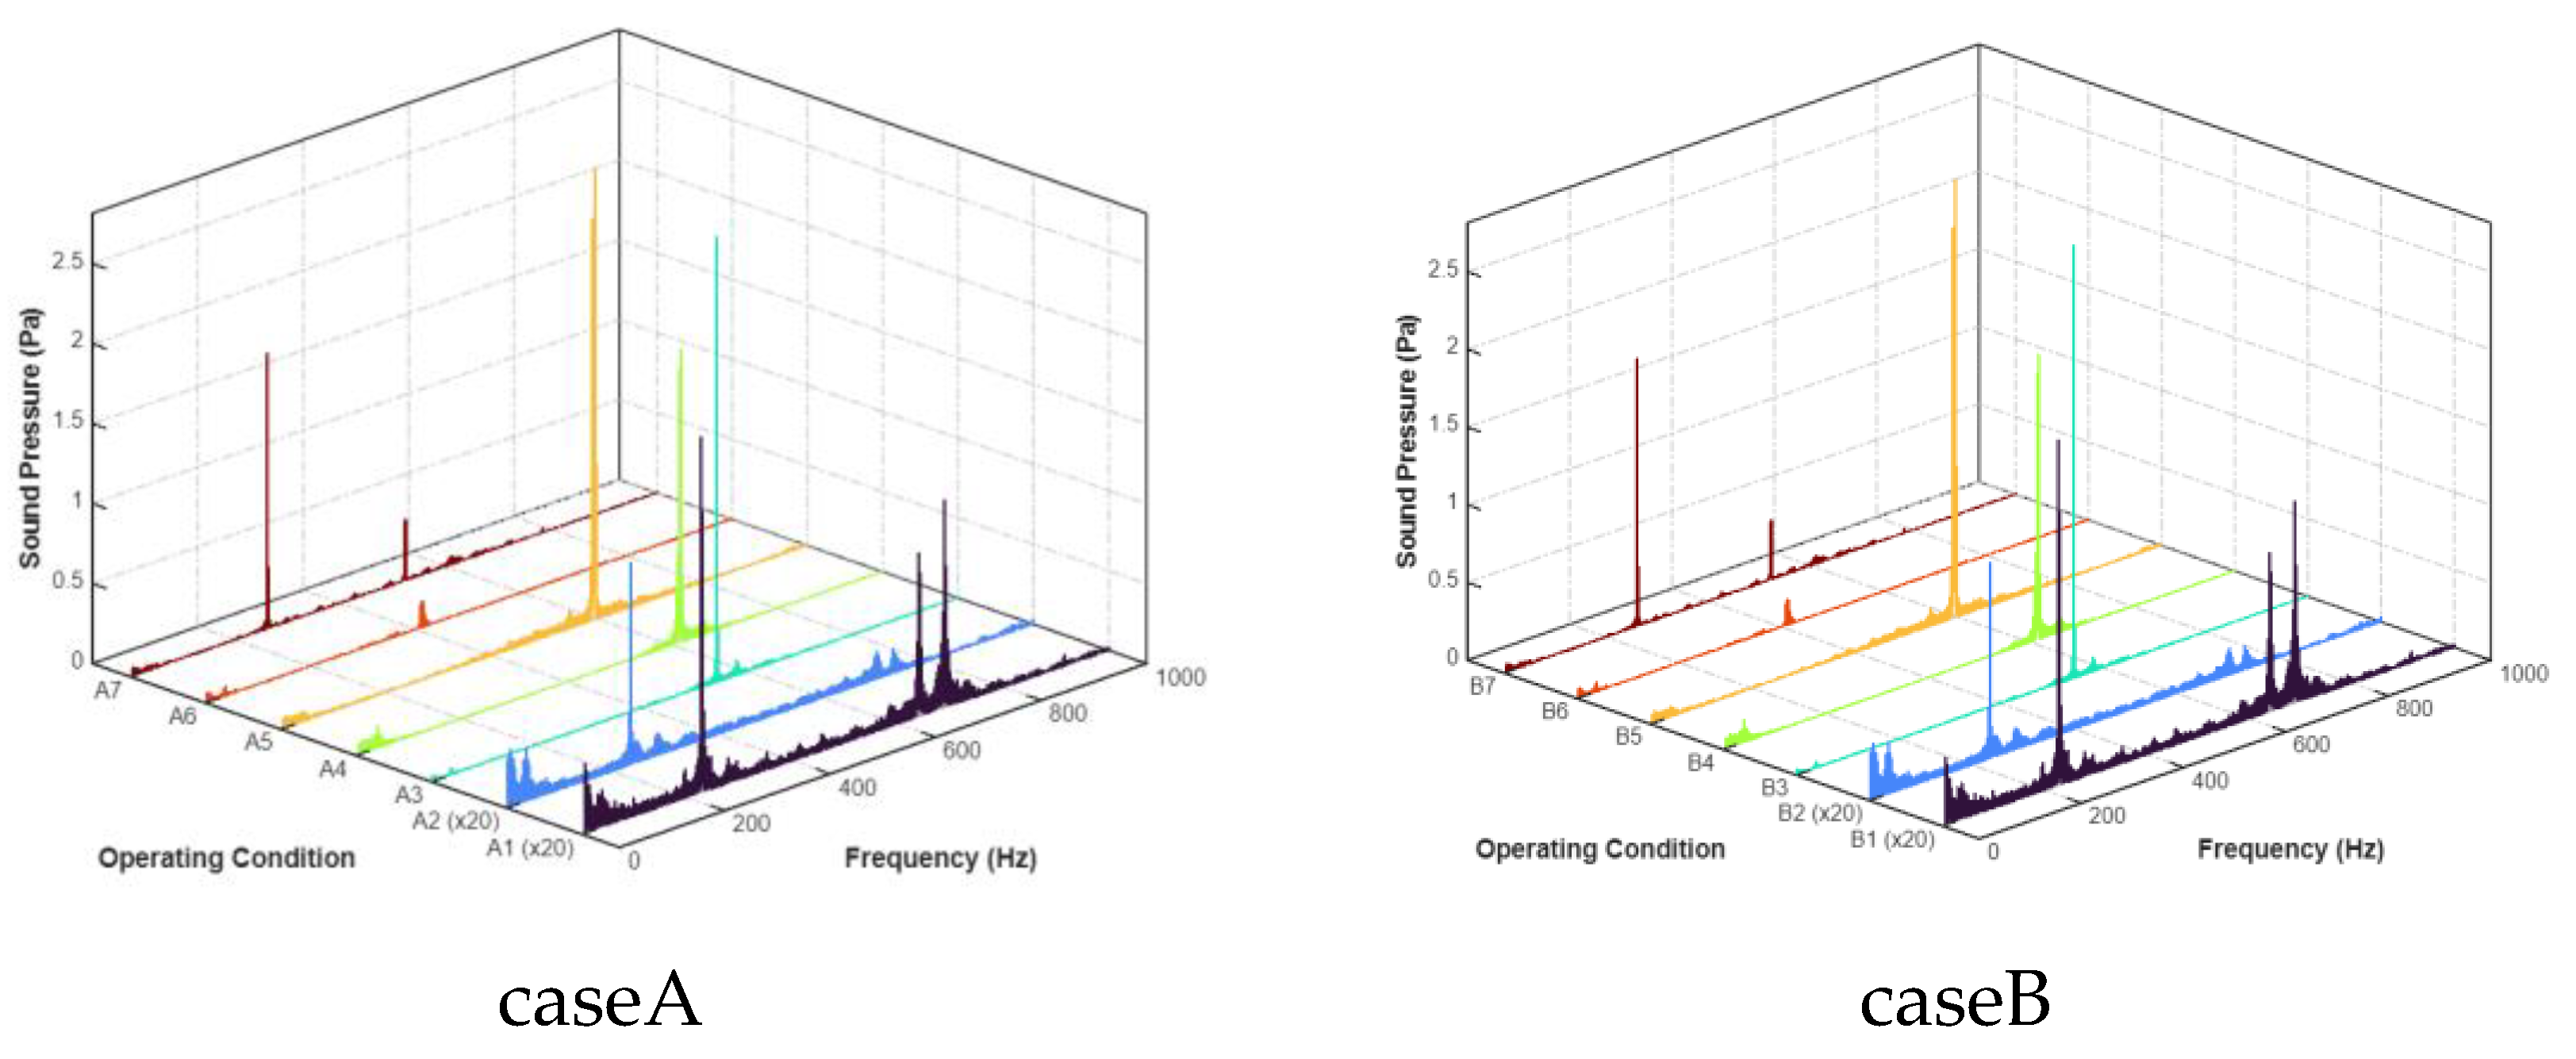
Figure 6.
Variation of dominant frequency with pressure.
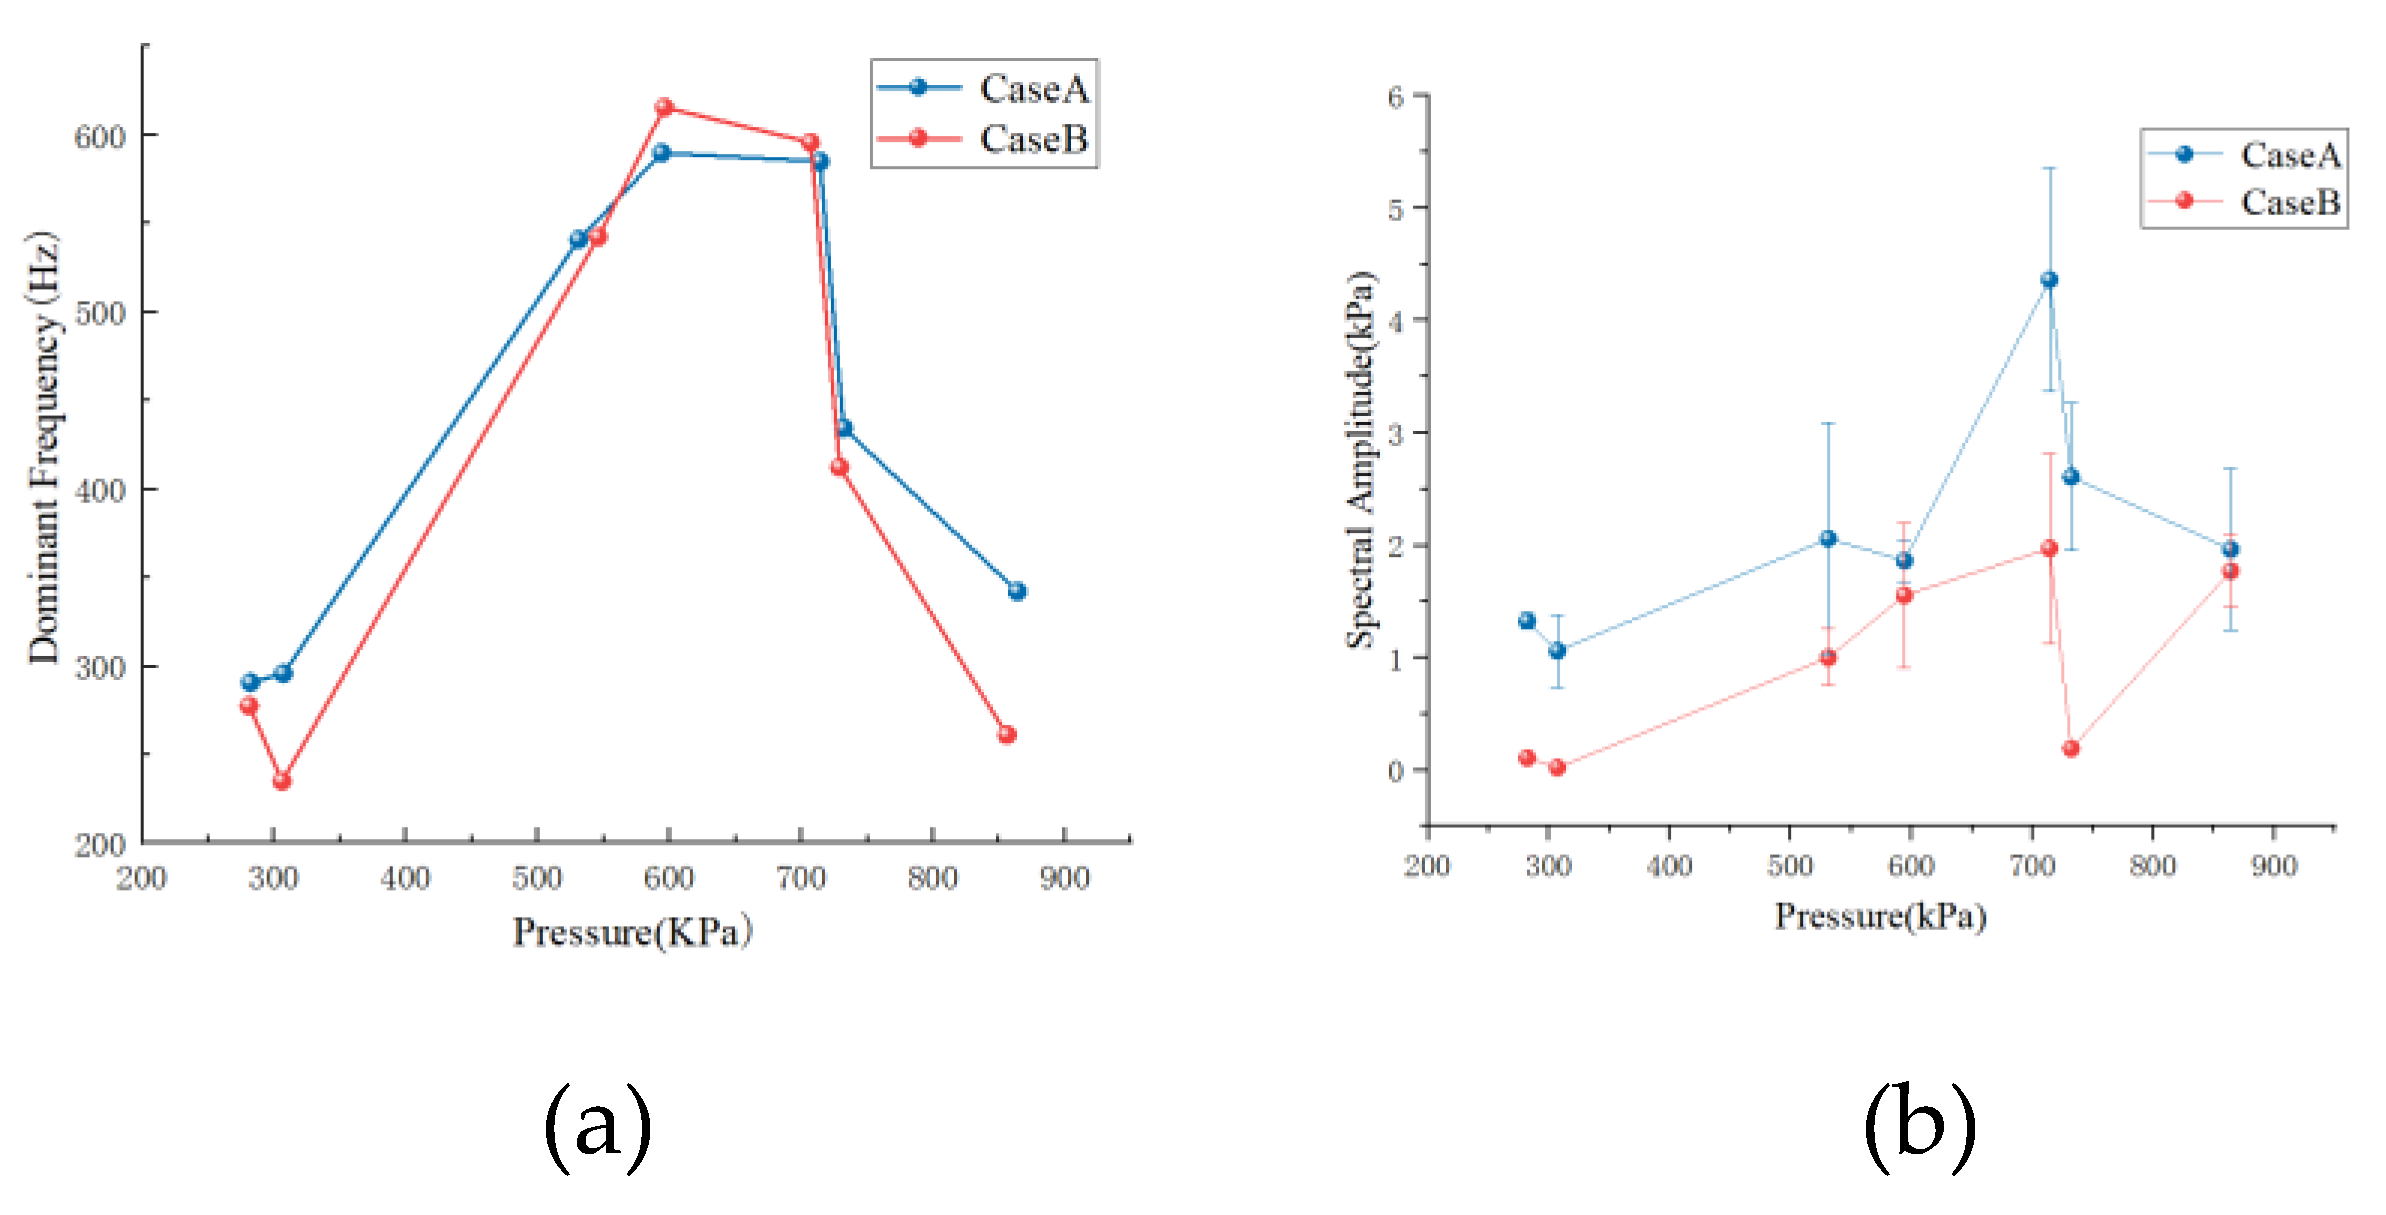
Figure 7.
Comparison of reflection coefficients between cases B1 and B2 (left: B1; right: B2).
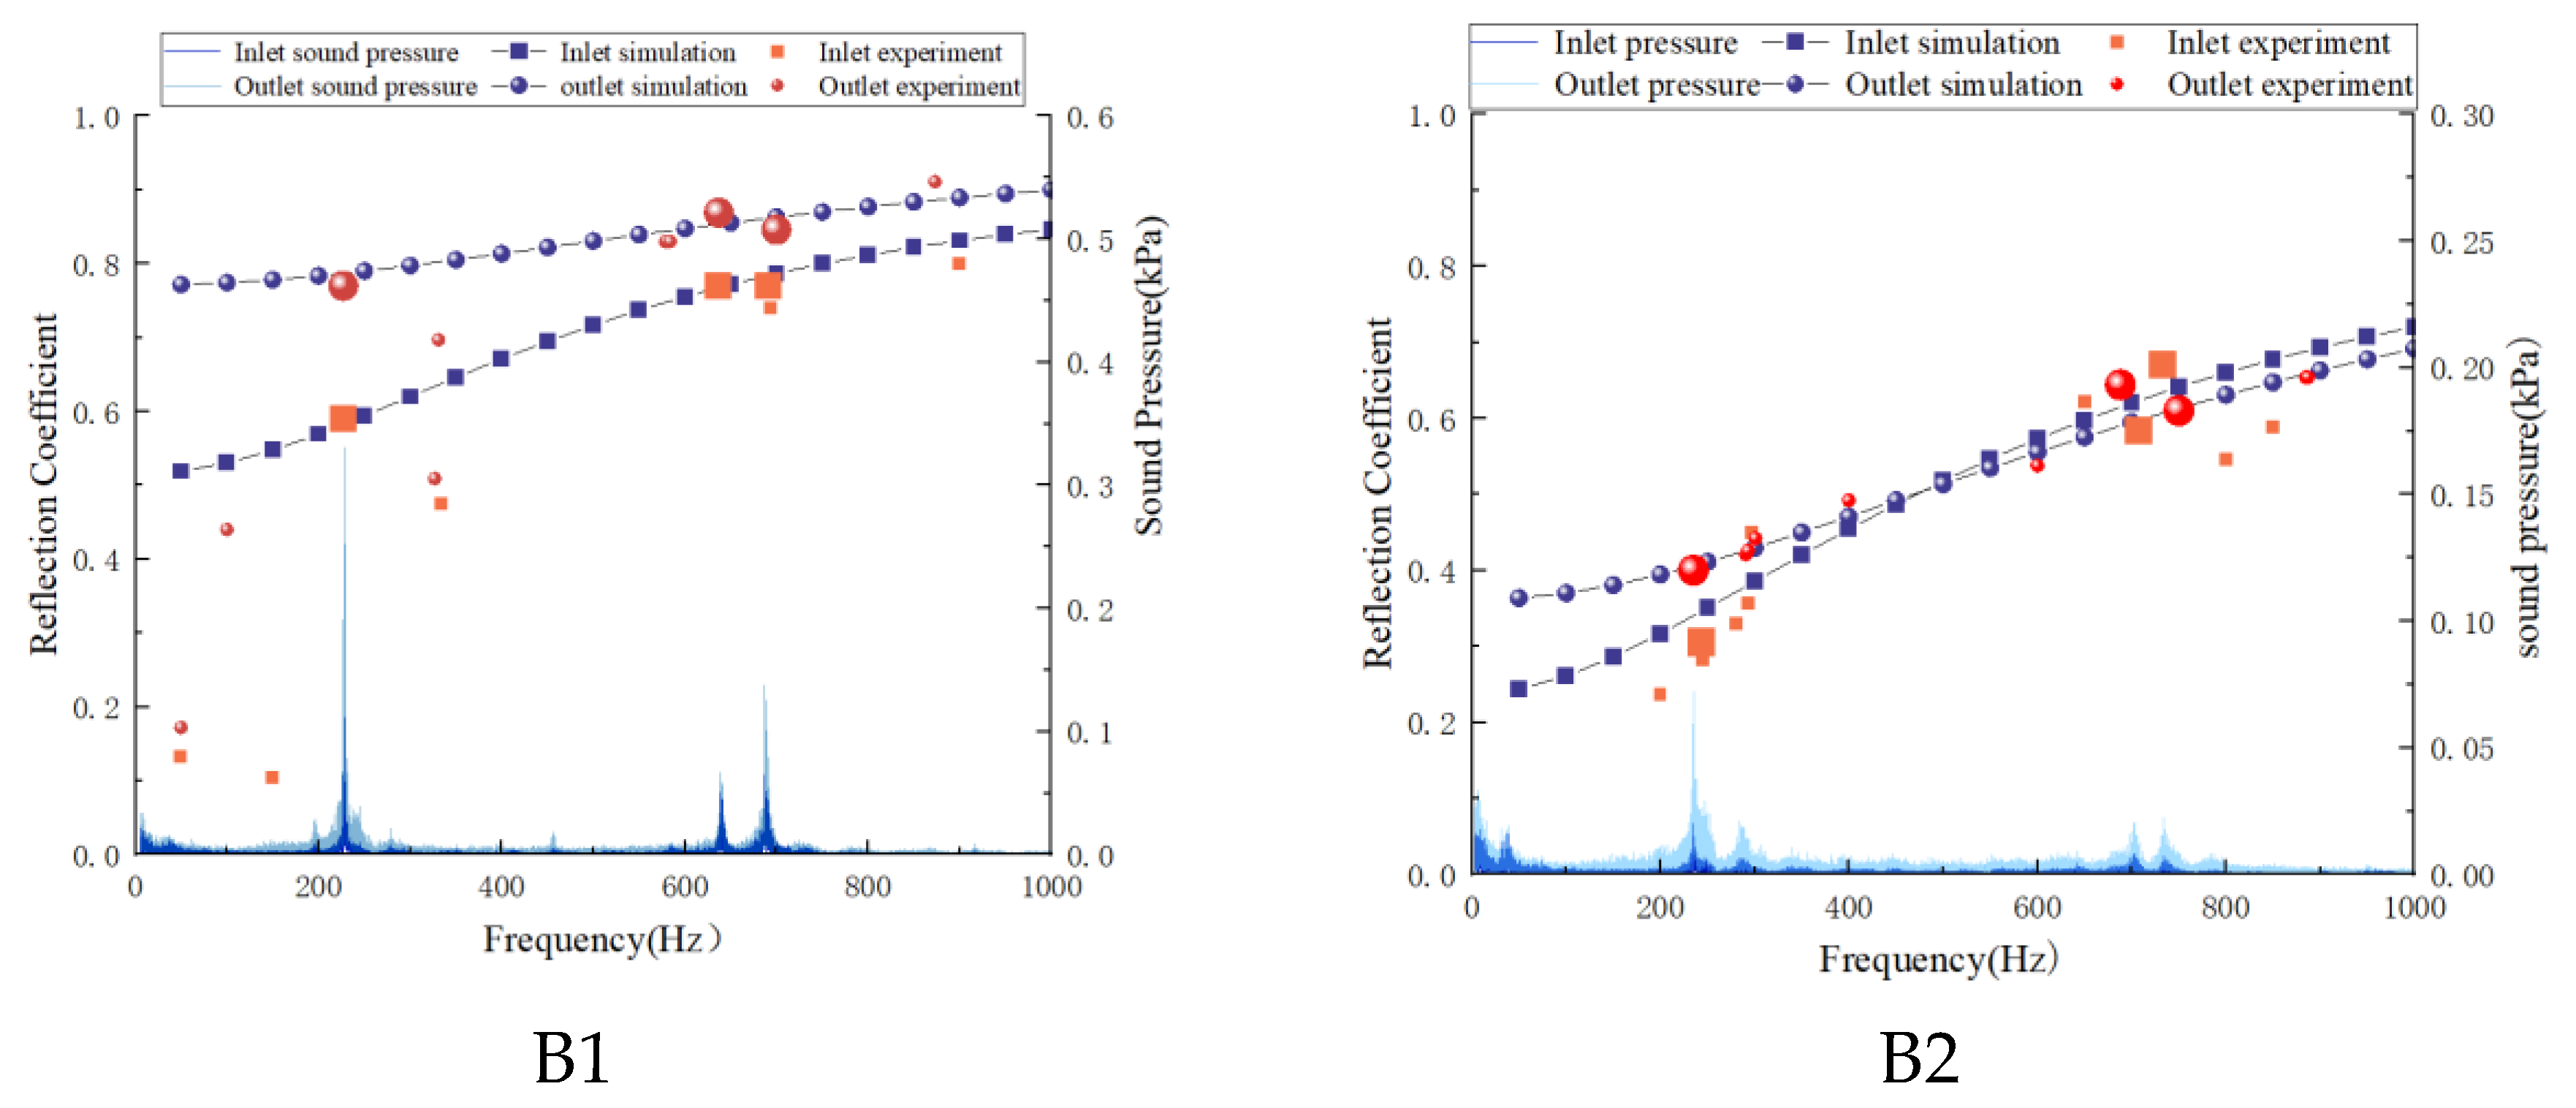
Figure 8.
Comparison of reflection coefficients for cases B3, and B4 (from left to right:B3,B4).
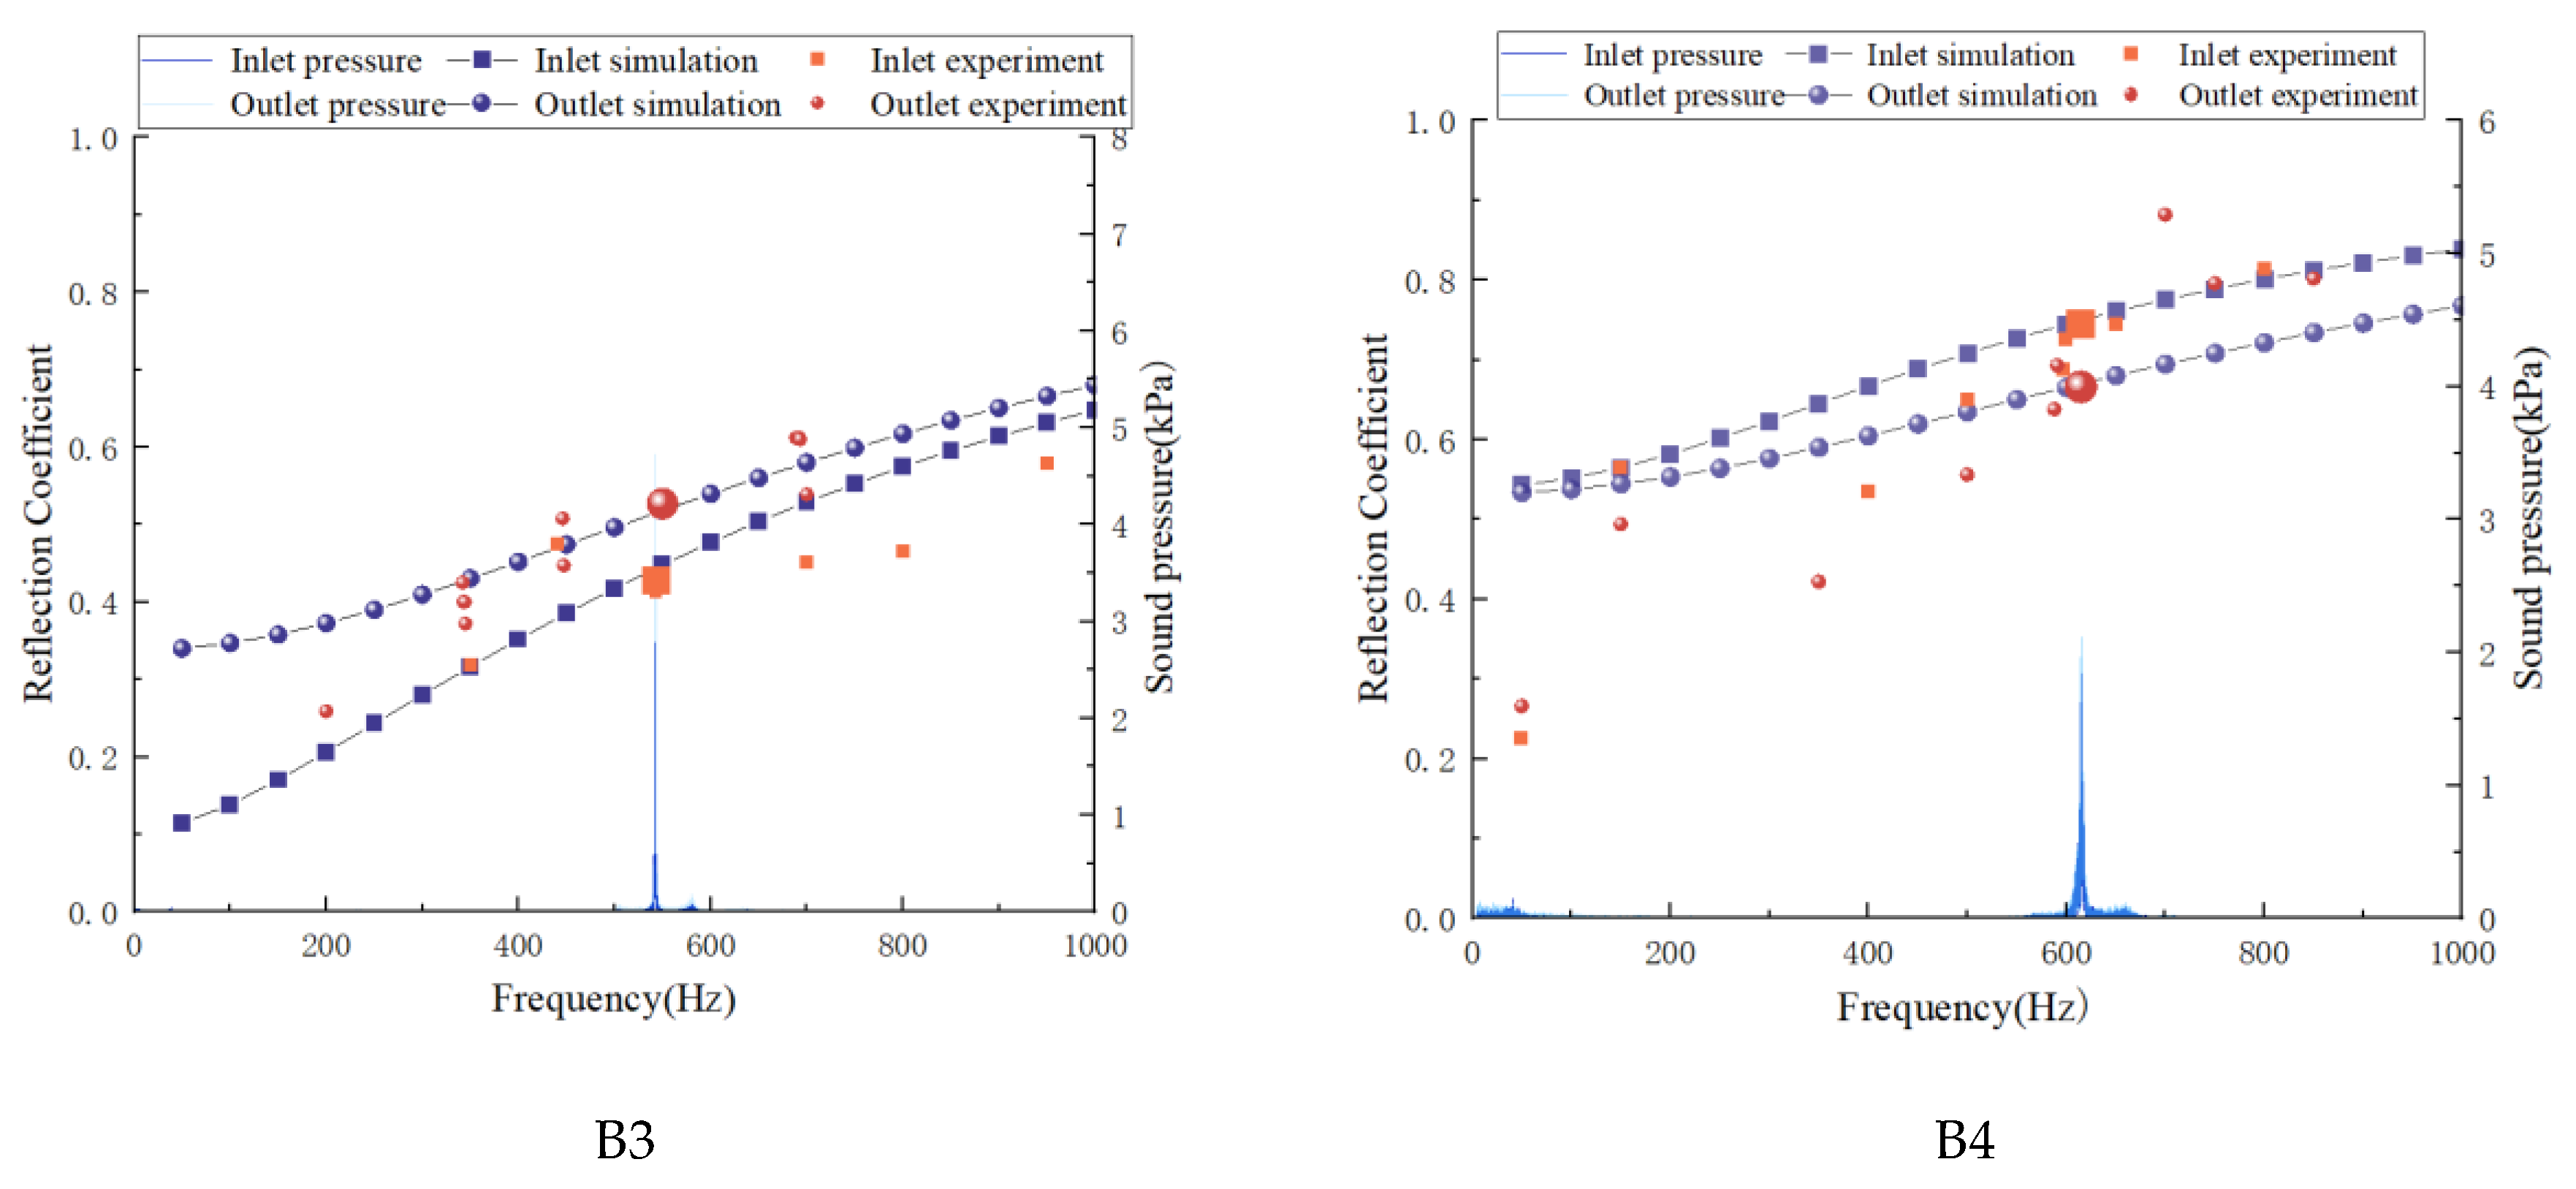
Figure 9.
Comparison of reflection coefficients for cases B5, B6, and B7 (from left to right: B5, B6, B7).
Figure 9.
Comparison of reflection coefficients for cases B5, B6, and B7 (from left to right: B5, B6, B7).
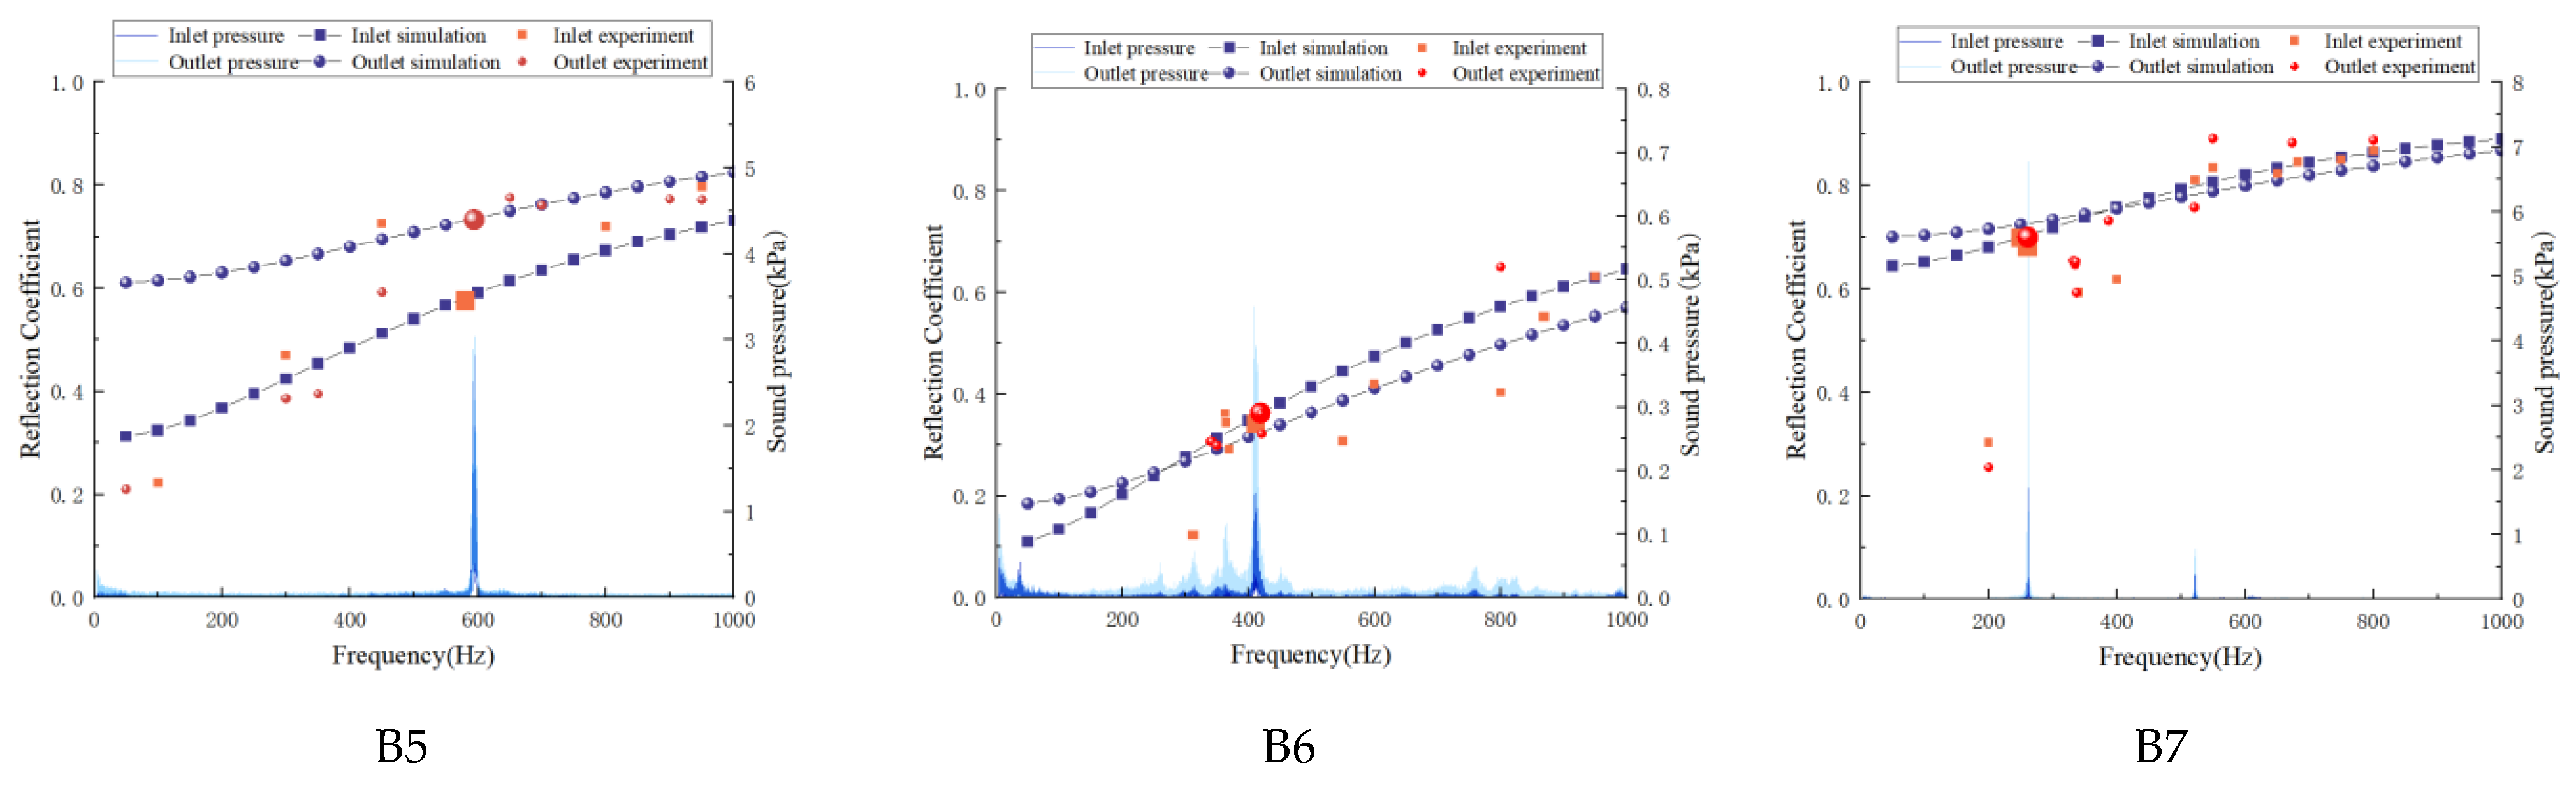

Table 1.
Operating condition data table.
| Case No. | Inlet Pressure,P3(kPa) | Inlet Temperature,T3(K) | Air Mass Flow Rate,W3(kg/s) | Combustor Pressure Drop ,Py |
Pilot Fuel Flow Rate(g/s) | Main Fuel Flow Rate,Wf1(g/s) | Overall Equivalence Ratio,α |
|---|---|---|---|---|---|---|---|
| A1 | 282 | 433 | 0.375 | 3% | 4.27 | 1.74 | 4.23 |
| A2 | 307 | 452 | 0.445 | 3.50% | 4.05 | 2.51 | 4.59 |
| A3 | 531 | 457 | 0.842 | 4.50% | 3.81 | 8.23 | 4.73 |
| A4 | 594 | 553 | 0.839 | 4.30% | 4.14 | 8.483 | 4.5 |
| A5 | 714 | 553 | 1.069 | 4.14% | 4.12 | 10.187 | 5.06 |
| A6 | 732 | 451 | 1.076 | 3.90% | 3.36 | 14.851 | 4 |
| A7 | 864 | 452 | 1.128 | 2.40% | 3.52 | 13.901 | 4.38 |
| B1 | 281 | 431 | 0.374 | 3.80% | 4.55 | 2.2~5.8 | 3.74 |
| B2 | 306 | 452 | 0.45 | 3.345% | 4.36 | 2.5~5.5 | 4.34 |
| B3 | 546 | 455 | 0.843 | 4.74% | 4.05 | 8.563 | 4.52 |
| B4 | 596 | 554 | 0.837 | 4.64% | 6.65 | 8.873 | 3.65 |
| B5 | 707 | 554 | 1.061 | 4.69% | 4.74 | 9.277 | 5.12 |
| B6 | 729 | 453 | 1.1 | 3.44% | 4.02 | 14.6~16.5 | 3.95 |
| B7 | 856 | 455 | 1.077 | 2.25% | 3.96 | 13.8~15.2 | 4.11 |
Disclaimer/Publisher’s Note: The statements, opinions and data contained in all publications are solely those of the individual author(s) and contributor(s) and not of MDPI and/or the editor(s). MDPI and/or the editor(s) disclaim responsibility for any injury to people or property resulting from any ideas, methods, instructions or products referred to in the content. |
© 2026 by the authors. Licensee MDPI, Basel, Switzerland. This article is an open access article distributed under the terms and conditions of the Creative Commons Attribution (CC BY) license (http://creativecommons.org/licenses/by/4.0/).
Copyright: This open access article is published under a Creative Commons CC BY 4.0 license, which permit the free download, distribution, and reuse, provided that the author and preprint are cited in any reuse.


