

Submitted:
18 July 2026
Posted:
20 July 2026
You are already at the latest version
Abstract
Background. AlphaGenome predicts regulatory consequences of non-coding variants from 1 Mb of DNA sequence and is widely used to prioritise candidate variants. It provides no calibrated effect-size threshold; its developers state that none exists and that calibration "might also differ for different classes of variants / predicted modalities". Users therefore apply ad hoc global thresholds to raw scores. Question. Are AlphaGenome's raw effect scores comparable across genomic loci - the minimum condition under which any single threshold is meaningful - and does the model's implied null distribution match the null measured experimentally? Methods. We scored every possible single-nucleotide variant of 15 regulatory elements (22 assays across cell lines; 20,549 distinct variants) whose effects were measured by saturation-mutagenesis reporter assays (Kircher et al. 2019), in GRCh38 coordinates, and compared the dispersion of AlphaGenome predictions to the dispersion of measured effects at each locus. We separately mapped AlphaGenome's own null dispersion across 12 genes and 8 distance bins (4,800 matched controls) and validated the coordinate/allele pipeline against Ensembl. Results. AlphaGenome's effect-score scale is miscalibrated relative to measured effects, and the miscalibration is systematically distance-dependent (Spearman rho = -0.80 between log-distance and MAD ratio, p = 3 x 10^-4, 15 loci). At promoters (<500 bp from the TSS) the model over-disperses, with a median null 2.3x wider than measured; at distal enhancers (>=10 kb) it collapses, with a median null 0.1x the measured width - a 177-fold span across loci. Because raw scores are therefore not comparable across loci, a single genome-wide threshold ranks variants at barely above chance when pooled (AUC ~ 0.56). Even at a single well-powered locus, AlphaGenome demotes the best-characterised causal non-coding cancer variant, TERT C228T, from measured rank 1/777 to model rank 14/777. Conclusion. AlphaGenome ranks variants well within a locus but its cross-locus scale is not physical: it must be calibrated locally before scores from different loci are compared or thresholded together. We release the procedure, the per-locus calibration factors, and the validation pipeline.
Keywords:
AlphaGenome
; variant effect prediction
; calibration
; saturation mutagenesis
; MPRA
; non-coding variants
; regulatory genomics
1. Introduction
Roughly 98% of the human genome does not encode protein; it encodes regulation. Most trait-associated variants fall in this fraction, and their interpretation is the central bottleneck of statistical and clinical genetics. Sequence-to-function models have narrowed the gap — Enformer1, Borzoi2 — and AlphaGenome now predicts multi-modal regulatory output at base resolution from 1 Mb of input, matching or exceeding the best external model on 24 of 26 variant-effect evaluations3,4.
A predictor becomes an instrument only when its output is calibrated. The missense field made this transition explicitly: computational predictors were calibrated against ClinVar to likelihood ratios and mapped to ACMG/AMP evidence strengths5–7, because a missense score has a fixed referent — the protein. No equivalent exists for AlphaGenome, and its developers have said so. Asked on the community forum for “a recommended cutoff ... to classify a variant as ‘pathogenic,’ or to use it as supporting evidence such as PP3”, a team member replied:
“We do not have a recommended cutoff. The calibration approach might also differ for different classes of variants / predicted modalities.”8
Absent a cutoff, every current analysis applies an ad hoc global threshold to the raw score. That is only meaningful if a raw score means the same thing everywhere in the genome. We test whether it does, using the strongest available external reference: saturation-mutagenesis reporter assays that measured the effect of every possible single-nucleotide change in a panel of regulatory elements9. This converts the calibration question from model-internal introspection into a direct empirical comparison: does the model’s spread of predicted effects match the spread that is actually measured?
2. Results
2.1. The Model’s Null Dispersion Does Not Match the Measured Null
For each of 15 regulatory elements with saturation-mutagenesis measurements (Kircher et al. 20199, GRCh38), we scored every single-nucleotide variant with AlphaGenome and compared the dispersion (median absolute deviation, MAD) of predicted effects to the dispersion of the laboratory-measured effects at the same locus. Under perfect calibration the ratio MAD(model)/MAD(measured) would be 1 everywhere.
It is not. The ratio ranges from 0.03 to 5.79 across loci — a 177-fold span (Figure 1, Figure 2; Table 1). The model over-disperses at some loci and collapses at others: it is too wide (ratio > 1) at 6 of 15 loci and too narrow at 9. No global rescaling can fix a discrepancy that changes direction between loci.
2.2. The Miscalibration Is Distance-Dependent
The ratio is not random across loci: it is a strong, monotone function of the element’s distance to the transcription start site (Figure 1). Spearman correlation between log-distance and the MAD ratio is ρ = −0.80 (p = 3.4 × 10⁻⁴, 15 loci). The pattern is mechanistically legible:
At promoters (<500 bp from the TSS) the model over-disperses — median MAD ratio 2.26, reaching 5.79 at the HBB promoter. It predicts a wider spread of consequences than the reporter assay measures.
At distal enhancers (≥10 kb) the model collapses — median MAD ratio 0.10, falling to 0.03 at the SORT1 enhancer 123 kb from its target. Here the model predicts almost no spread of effects at all, even though the assay measures a broad one.
This mirrors, against external truth, a decay we independently measured in the model’s own null: sampling 4,800 matched control variants across 12 genes and 8 distance bins, the internal null dispersion falls as a gene-specific power law in distance (MAD ∝ d−k, k = 0.27–0.62), and the decay is modality-specific — RNA-seq dispersion falls ~25-fold from promoter to 100 kb, whereas chromatin-accessibility dispersion falls only ~2-fold, consistent with a longer causal chain from a distal variant to a change in gene expression than to a local change in accessibility (Supplementary analysis). The saturation-mutagenesis data show that this decay is too steep: the model’s effect scale shrinks with distance faster than real regulatory effects do.
2.3. Raw Scores Are Not Comparable Across Loci
The direct consequence is that a raw AlphaGenome score cannot be thresholded genome-wide. A score of 0.1 is unremarkable at a promoter, where the model’s spread is large, but extreme at a distal enhancer, where the model’s spread is near zero. When we pool all 20,549 variants across the 15 loci and rank them by |raw score| against the experimental truth (whether the assay called the variant functional at p < 0.05), the ranking is barely better than chance: AUC ≈ 0.56. The information the model carries within each locus is largely destroyed when raw scores from different loci are placed on one axis.
Local calibration — expressing each score relative to its own locus’s null — is the natural remedy and points in the right direction (pooled AUC 0.59 vs 0.56), but on 15 independent loci this improvement is not statistically robust (95% bootstrap CI on the gain crosses zero: [−0.08, +0.14]). We therefore make the weaker, defensible claim: local calibration is necessary for cross-locus comparability in principle, and the data are consistent with a detection benefit, but this panel is underpowered to establish one. The strong, external result is the miscalibration itself (§2.1–2.2), not a specific correction for it.
2.4. The Best-Characterised Causal Variant Is Demoted
TERT C228T (rs1242535815) creates a de novo ETS/TCF binding site and is the most recurrent non-coding driver mutation in human cancer10,11. In the saturation-mutagenesis assay it is the strongest single variant in the entire TERT promoter: measured rank 1 of 777 in glioblastoma-derived cells, where TERT reactivation is a genuine driver (measured effect +2.86; p ≈ 0).
AlphaGenome predicts C228T in the correct direction (a gain of function) but demotes it to rank 14 of 777 (Figure 3). Thirteen variants the model scores at least as highly are, by measurement, weaker. A pipeline that took AlphaGenome’s ranking at face value would not place the single most important non-coding cancer mutation at the top of its own promoter. The model’s within-locus correlation with measured effects is moderate and cell-type-dependent (Spearman ρ from +0.31 in HEK to +0.52 in glioblastoma across the four TERT assays), which is a useful ranking signal — but not a substitute for measurement, and not a calibrated magnitude.
2.5. A Coordinate-Verification Guardrail, and a Caution It Exposed
Building the comparison pipeline surfaced a failure mode worth reporting because it is easy to hit and silent. Published coordinates for famous variants are frequently in GRCh37/hg19; C228T is chr5:1,295,228 in hg19 but chr5:1,295,113 in hg38, a 115 bp shift that moves the variant between distance bins. When we supplied the hg19 coordinate with its reference allele to the AlphaGenome API, the API accepted a variant whose reference base does not exist at that hg38 position and returned a score, with no error. We therefore verify every reference allele against the genome before scoring; the released pipeline rejects mismatches. All results here use GRCh38 coordinates with verified reference alleles (0 mismatches across 20,549 variants after verification).
3. Discussion
3.1. What Is Established
AlphaGenome’s effect-score scale is not physically calibrated across the genome. Measured against saturation-mutagenesis ground truth, its spread of predicted effects is too large at promoters and too small at distal enhancers, varying 177-fold across loci as a monotone function of distance to the TSS. This is not an artefact of the model’s internal null (which could be dismissed as “the biology really is more variable at promoters”): it is a mismatch between the model and directly measured effects, in both directions.
The practical corollary is immediate and consequential. Because raw scores are not cross-locus comparable, any genome-wide threshold — the operation every current user performs, since none is provided — pools incomparable quantities and ranks variants near chance. This is why the search for “the AlphaGenome cutoff” has not converged: the quantity a cutoff would act on is not on a stable scale.
3.2. Why the Missense Strategy Does Not Transfer
Missense calibration succeeded globally because a missense score refers to a fixed object, the protein. A regulatory effect has no position-invariant referent: the same nucleotide change means something different 50 bp and 50 kb from a promoter, and the model’s own scale reflects that — but reflects it wrongly, over-correcting with distance. Porting the ACMG-style single-threshold approach to regulatory scores will therefore assign evidence strengths that do not match the strength delivered. Calibration must be local.
3.3. Limitations
We state these plainly. Fifteen loci. The saturation-mutagenesis panel is small and promoter-heavy; the distance correlation is strong but rests on few distal points, and the enhancer arm would benefit from more elements. Underpowered on the fix. We show miscalibration robustly but cannot prove that local calibration improves detection on this panel (§2.3); that requires a larger element set. One modality, one variant class. RNA-seq / expression, SNVs, model FOLD_0. Reporter assays are not the endogenous locus: saturation-mutagenesis measures episomal or integrated reporter activity, which need not equal effect on the native gene; this bounds “ground truth” but is the best available external reference. Cell-type matching is imperfect: the assay cell line and the AlphaGenome track set are not identical, contributing to the moderate within-locus correlations. Provenance is time-bounded: all data were generated on 17 July 2026, after the 14 July 2026 indel-scoring fix12 and the 18 June 2026 quantile recalibration13; neither affects SNV raw scores, but scores from other dates are not comparable.
3.4. Outlook
The finding is not a criticism of AlphaGenome, which is a genuine advance on a problem that was intractable. It is a statement about what kind of instrument it is: within a locus it ranks variants informatively; across loci its scale is not a ruler. The constructive path is a published, genome-wide local-calibration resource — per-locus, per-distance, per-modality reference distributions, computed once, in the way gnomAD14 made allele frequencies a shared reference. Saturation-mutagenesis and lentiMPRA panels can anchor such a resource to measured effects where they exist. Our procedure, the per-locus factors reported here, and the coordinate-verification guardrail are released toward that end.
4. Methods
4.1. Model and Scoring
AlphaGenome was queried through the public API (client v0.6.1), model version FOLD_0, with the full 1,048,576 bp context window centred on the target gene’s canonical TSS. Signal is raw_score from the RNA_SEQ scorer (GeneMaskLFCScorer), a natural-log fold change of predicted expression for the target gene, aggregated across the ~400 returned tracks by abs-max (not mean, per developer guidance that averaging dilutes signal15).
4.2. Experimental Ground Truth
Saturation-mutagenesis measurements are from Kircher et al. 20199 (OSF 10.17605/OSF.IO/75B2M), using the GRCh38 release to avoid liftover error. We used all 22 element×cell-line assays with a resolvable target gene inside the 1 Mb window; for cross-locus pooling we reduced to 15 distinct loci (one assay per gene; for TERT, the glioblastoma line as the most physiological). A variant was called “functional” at the assay’s own significance threshold (p < 0.05). Only single-nucleotide variants were used (indels excluded).
4.3. Coordinate and Allele Verification
Gene coordinates and canonical TSS were taken from GENCODE v46 (the annotation AlphaGenome itself uses), reading the TSS from the Ensembl_canonical transcript rather than the gene boundary — the two differ by >100 bp for 32% of protein-coding genes and by 797 bp for MYC, enough to change distance bins. GENCODE Start is 0-based and was converted to 1-based (verified against Ensembl: TERT and MYC match to the base). Every variant’s reference allele was checked against the GRCh38 sequence before scoring (§2.5); mismatches were rejected.
4.4. Statistics
Dispersion is MAD scaled to Gaussian σ (1.4826 × MAD), chosen over the SD because both measured and predicted effect distributions are heavy-tailed. The distance–miscalibration relation was tested by Spearman correlation between log10(median element–TSS distance) and the per-locus MAD ratio. Cross-locus detection was assessed by the AUC (Mann–Whitney) of |score| against the binary functional call, pooled over the 15 distinct loci; the local-vs-global gain and its 95% CI were estimated by 2,000-replicate bootstrap resampling over loci, so that the interval reflects between-locus variability rather than pseudo-replication from correlated variants within an element. The model’s internal null (Supplementary) used 4,800 matched control SNVs across 12 genes × 8 log-spaced distance bins, sampled bilaterally around the TSS to control the model’s strand-dependent positional artefact16. All tests two-sided.
Funding
This research received no external funding.
Data and code availability
All raw AlphaGenome scores, the saturation-mutagenesis comparison (results_mpra.json), the internal-null experiment, analysis and figure scripts, and the coordinate-verification guardrail are released with the AGORA framework (test suite, 252 tests). Saturation-mutagenesis data: Kircher et al. 2019, OSF 10.17605/OSF.IO/75B2M. AlphaGenome is available for non-commercial use from Google DeepMind; model code and weights at github.com/google-deepmind/alphagenome_research.
Competing interests
None declared. The author has no affiliation with Google DeepMind.
References
- Avsec, Ž. et al. Effective gene expression prediction from sequence by integrating long-range interactions. Nat. Methods 18, 1196–1203 (2021). [CrossRef]
- Linder, J. et al. Predicting RNA-seq coverage from DNA sequence as a unifying model of gene regulation. Nat. Genet. (2025). [CrossRef]
- Avsec, Ž. et al. Advancing regulatory variant effect prediction with AlphaGenome. Nature (2025). doi:10.1038/s41586-025-10014-0. [CrossRef]
- Avsec, Ž. et al. AlphaGenome: advancing regulatory variant effect prediction with a unified DNA sequence model. bioRxiv 2025.06.25.661532 (2025).
- Pejaver, V. et al. Calibration of computational tools for missense variant pathogenicity classification and ClinGen recommendations for PP3/BP4 criteria. Am. J. Hum. Genet. 109, 2163–2177 (2022). [CrossRef]
- Cheng, J. et al. Accurate proteome-wide missense variant effect prediction with AlphaMissense. Science 381, eadg7492 (2023). [CrossRef]
- Richards, S. et al. Standards and guidelines for the interpretation of sequence variants (ACMG/AMP). Genet. Med. 17, 405–424 (2015).
- Scott, D. Reply to “Suggest pathogenic cutoff of quantile_score”. AlphaGenome Community Forum, thread 647 (8 Sep 2025).
- Kircher, M. et al. Saturation mutagenesis of twenty disease-associated regulatory elements at single base-pair resolution. Nat. Commun. 10, 3583 (2019). [CrossRef]
- Huang, F. W. et al. Highly recurrent TERT promoter mutations in human melanoma. Science 339, 957–959 (2013). [CrossRef]
- Horn, S. et al. TERT promoter mutations in familial and sporadic melanoma. Science 339, 959–961 (2013). [CrossRef]
- Taylor, K. Flagging issue with indel inference. AlphaGenome Community Forum, thread 910 (21 May – 14 Jul 2026).
- Ward, T. Updating variant score quantiles. AlphaGenome Community Forum, thread 929 (18 Jun 2026).
- Karczewski, K. J. et al. The mutational constraint spectrum quantified from variation in 141,456 humans. Nature 581, 434–443 (2020). [CrossRef]
- Makgatho, T. Guidance on aggregating scores across tracks. AlphaGenome Community Forum, threads 868, 883.
- Clark, L. & Makgatho, T. RNA-seq effects tend to be higher for variants to the left of the gene. AlphaGenome Community Forum, thread 872.
Figure 1.
AlphaGenome’s effect-score scale is miscalibrated as a function of distance to the TSS. Each point is one regulatory element (n = 15 distinct loci); y-axis is the ratio of AlphaGenome’s effect dispersion (MAD) to the laboratory-measured dispersion at that locus (log scale). Above the dashed 1:1 line the model over-disperses; below, it collapses. Promoters (teal, <1 kb) sit above unity; distal enhancers (amber, ≥1 kb) fall far below. Spearman ρ = −0.80, p = 3.4 × 10⁻⁴.
Figure 1.
AlphaGenome’s effect-score scale is miscalibrated as a function of distance to the TSS. Each point is one regulatory element (n = 15 distinct loci); y-axis is the ratio of AlphaGenome’s effect dispersion (MAD) to the laboratory-measured dispersion at that locus (log scale). Above the dashed 1:1 line the model over-disperses; below, it collapses. Promoters (teal, <1 kb) sit above unity; distal enhancers (amber, ≥1 kb) fall far below. Spearman ρ = −0.80, p = 3.4 × 10⁻⁴.
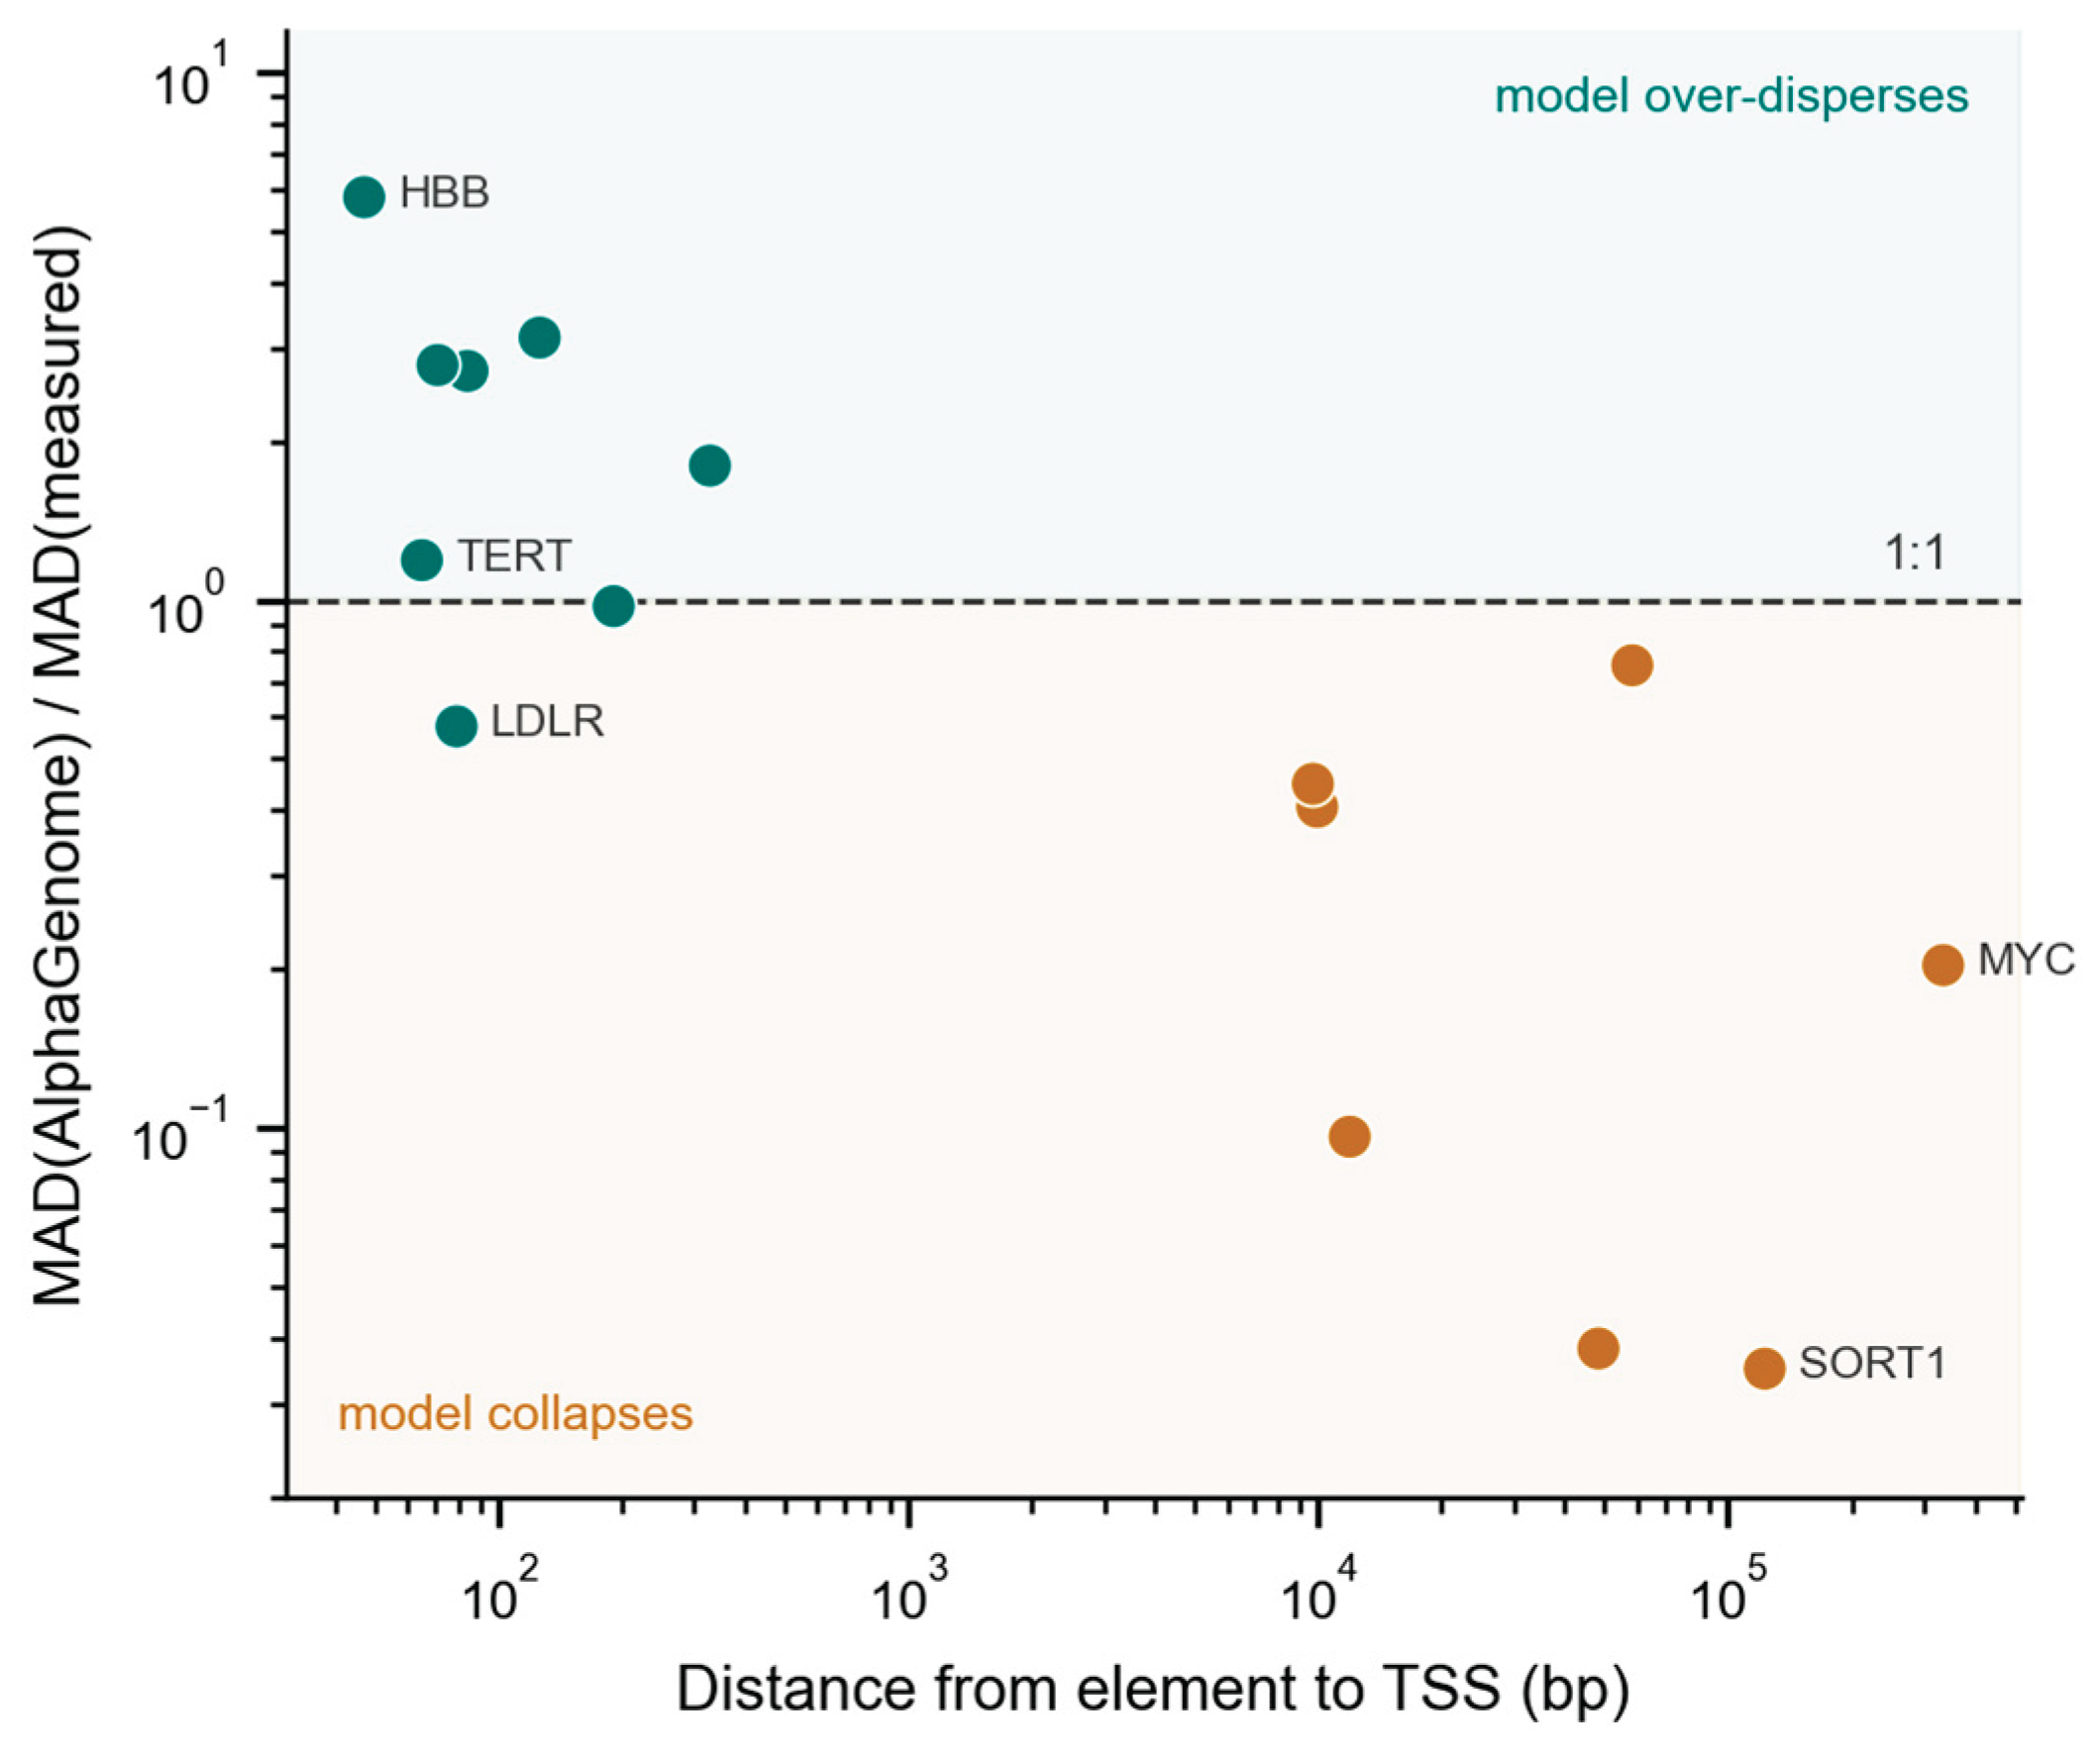
Figure 2.
Per-locus null dispersion, model vs measured. Each point is one locus; colour encodes distance to TSS (dark = near, yellow = far). Points above the diagonal: the model’s spread exceeds the measured spread (promoters). Below: the model’s spread is smaller than reality (distal enhancers). A single scale factor would shift all points equally and cannot bring them onto the diagonal.
Figure 2.
Per-locus null dispersion, model vs measured. Each point is one locus; colour encodes distance to TSS (dark = near, yellow = far). Points above the diagonal: the model’s spread exceeds the measured spread (promoters). Below: the model’s spread is smaller than reality (distal enhancers). A single scale factor would shift all points equally and cannot bring them onto the diagonal.
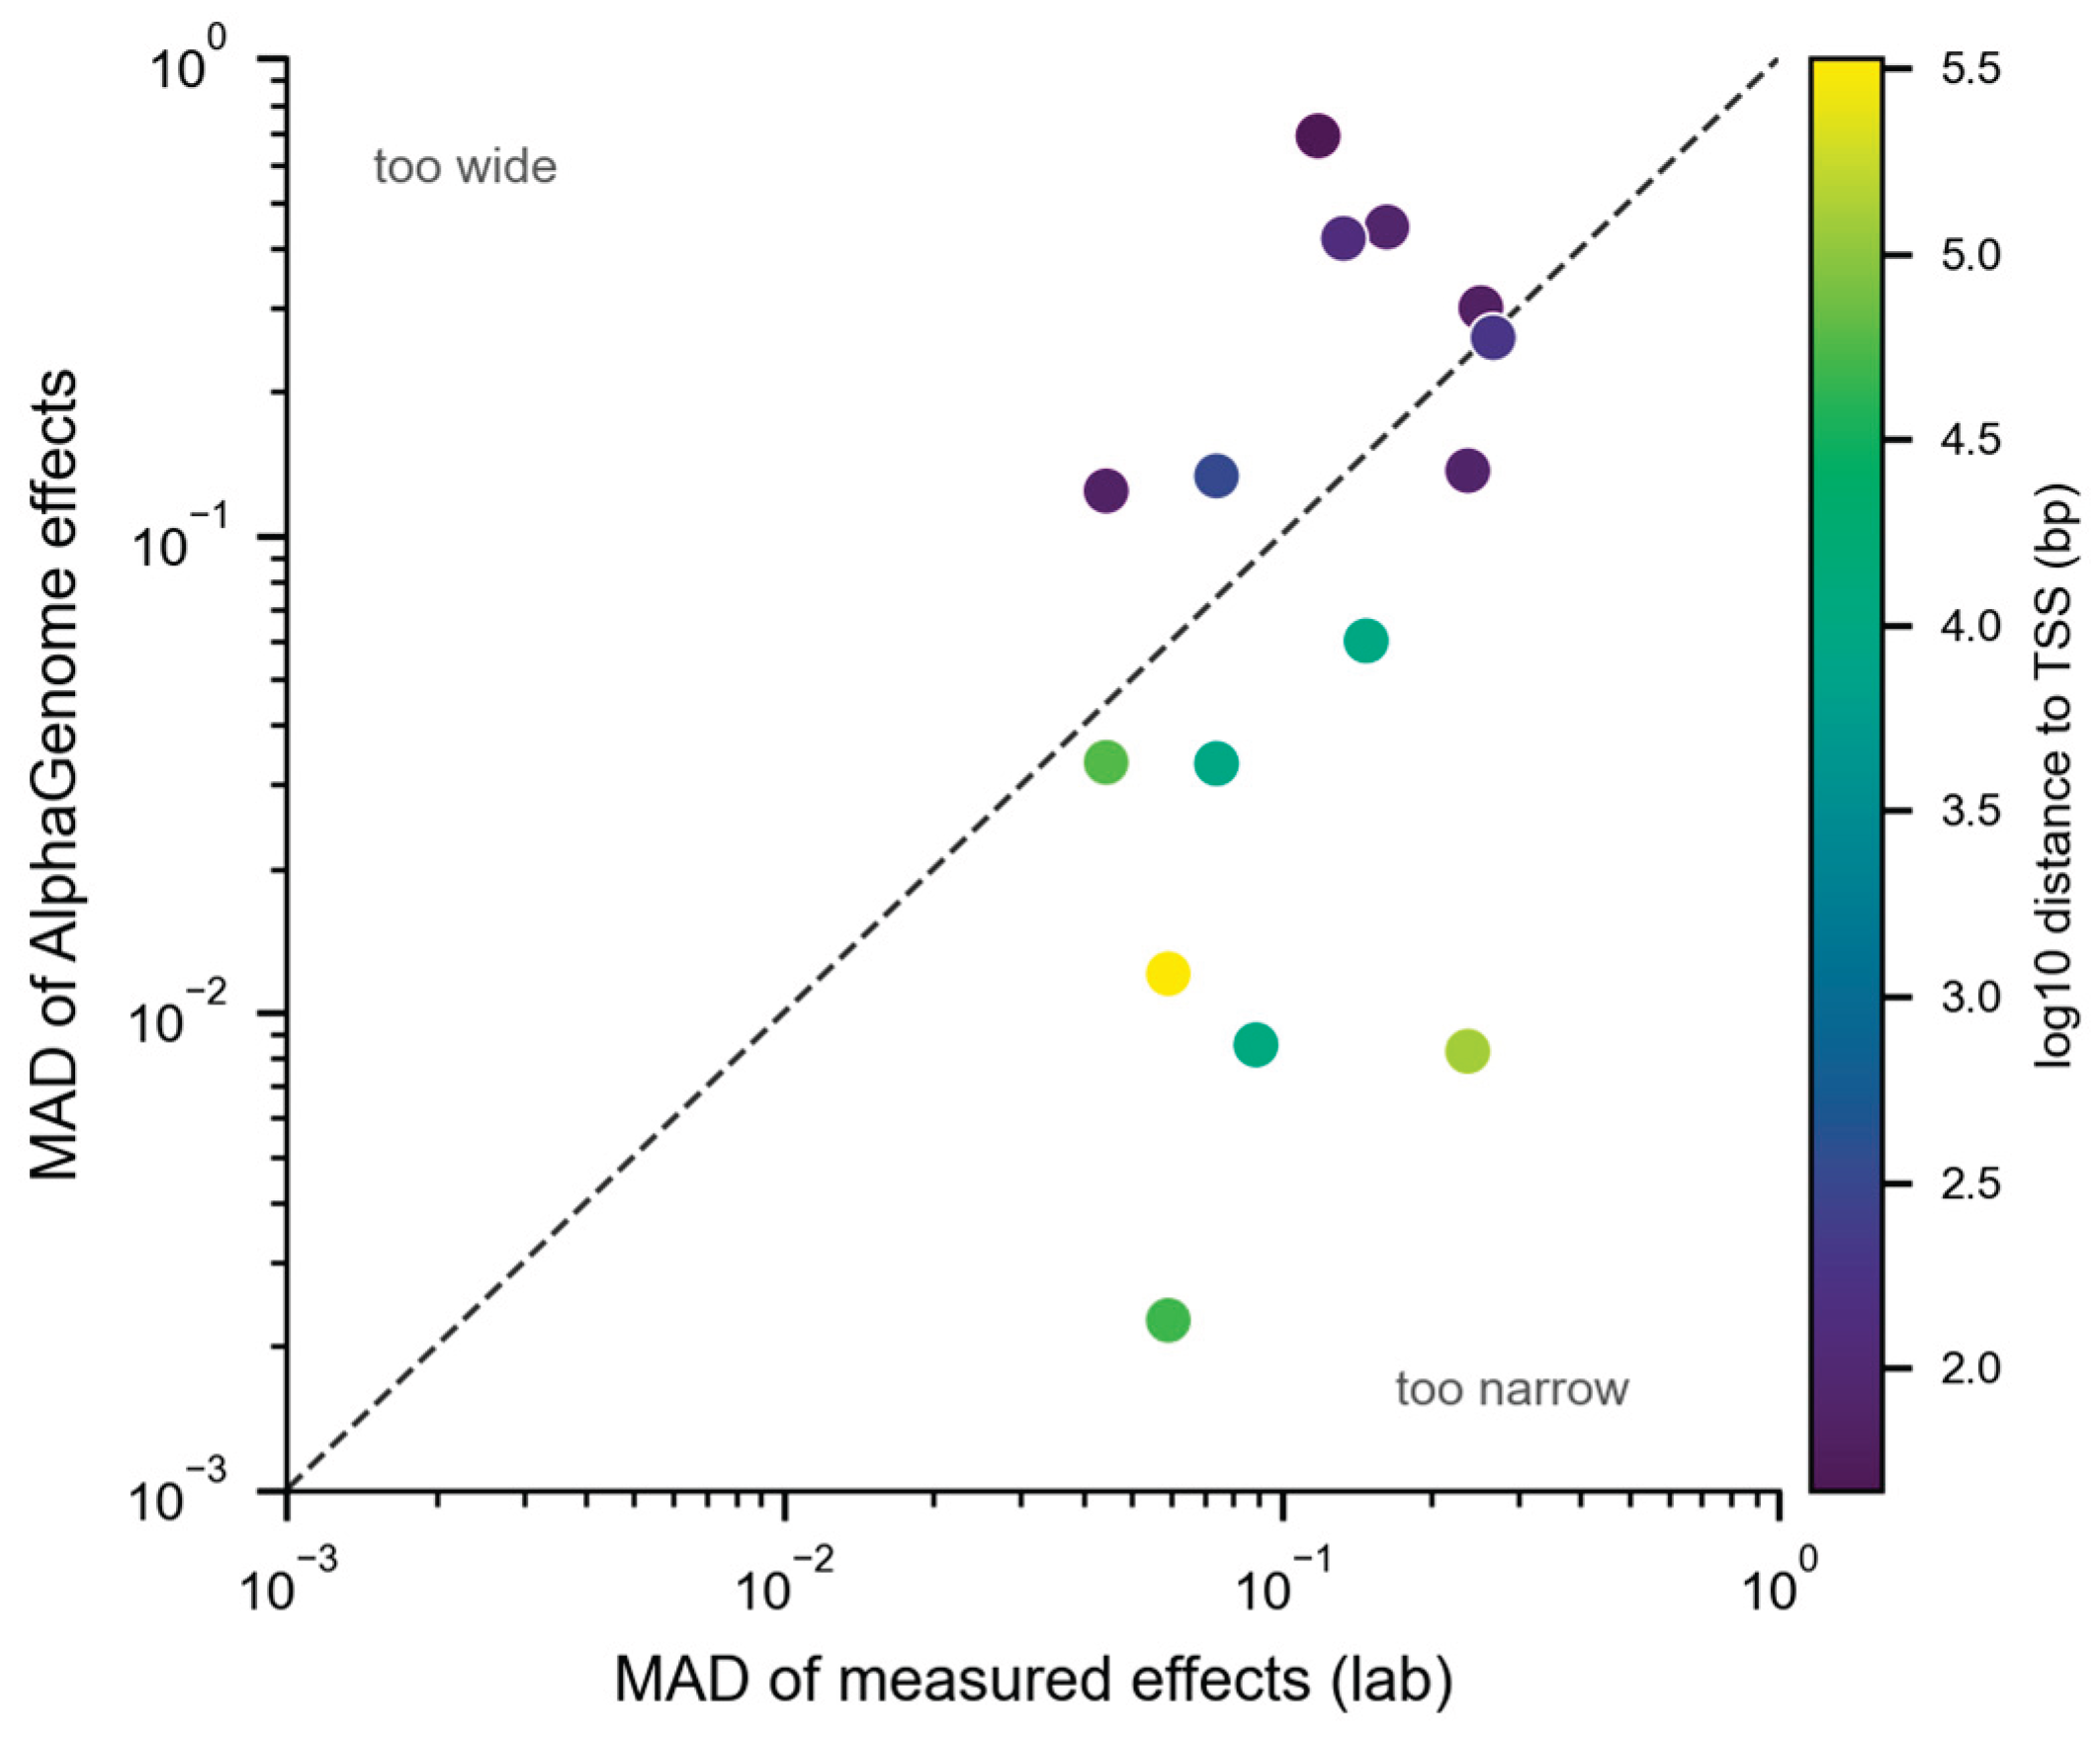
Figure 3.
TERT promoter, measured vs predicted effect for 777 variants. Each grey point is one variant; measured effect (y, glioblastoma line) against AlphaGenome prediction (x). C228T (red) is the strongest variant by measurement (rank 1/777) but only 14th by AlphaGenome. Spearman ρ = 0.52 overall: real ranking signal, but the causal variant is not at the top.
Figure 3.
TERT promoter, measured vs predicted effect for 777 variants. Each grey point is one variant; measured effect (y, glioblastoma line) against AlphaGenome prediction (x). C228T (red) is the strongest variant by measurement (rank 1/777) but only 14th by AlphaGenome. Spearman ρ = 0.52 overall: real ranking signal, but the causal variant is not at the top.
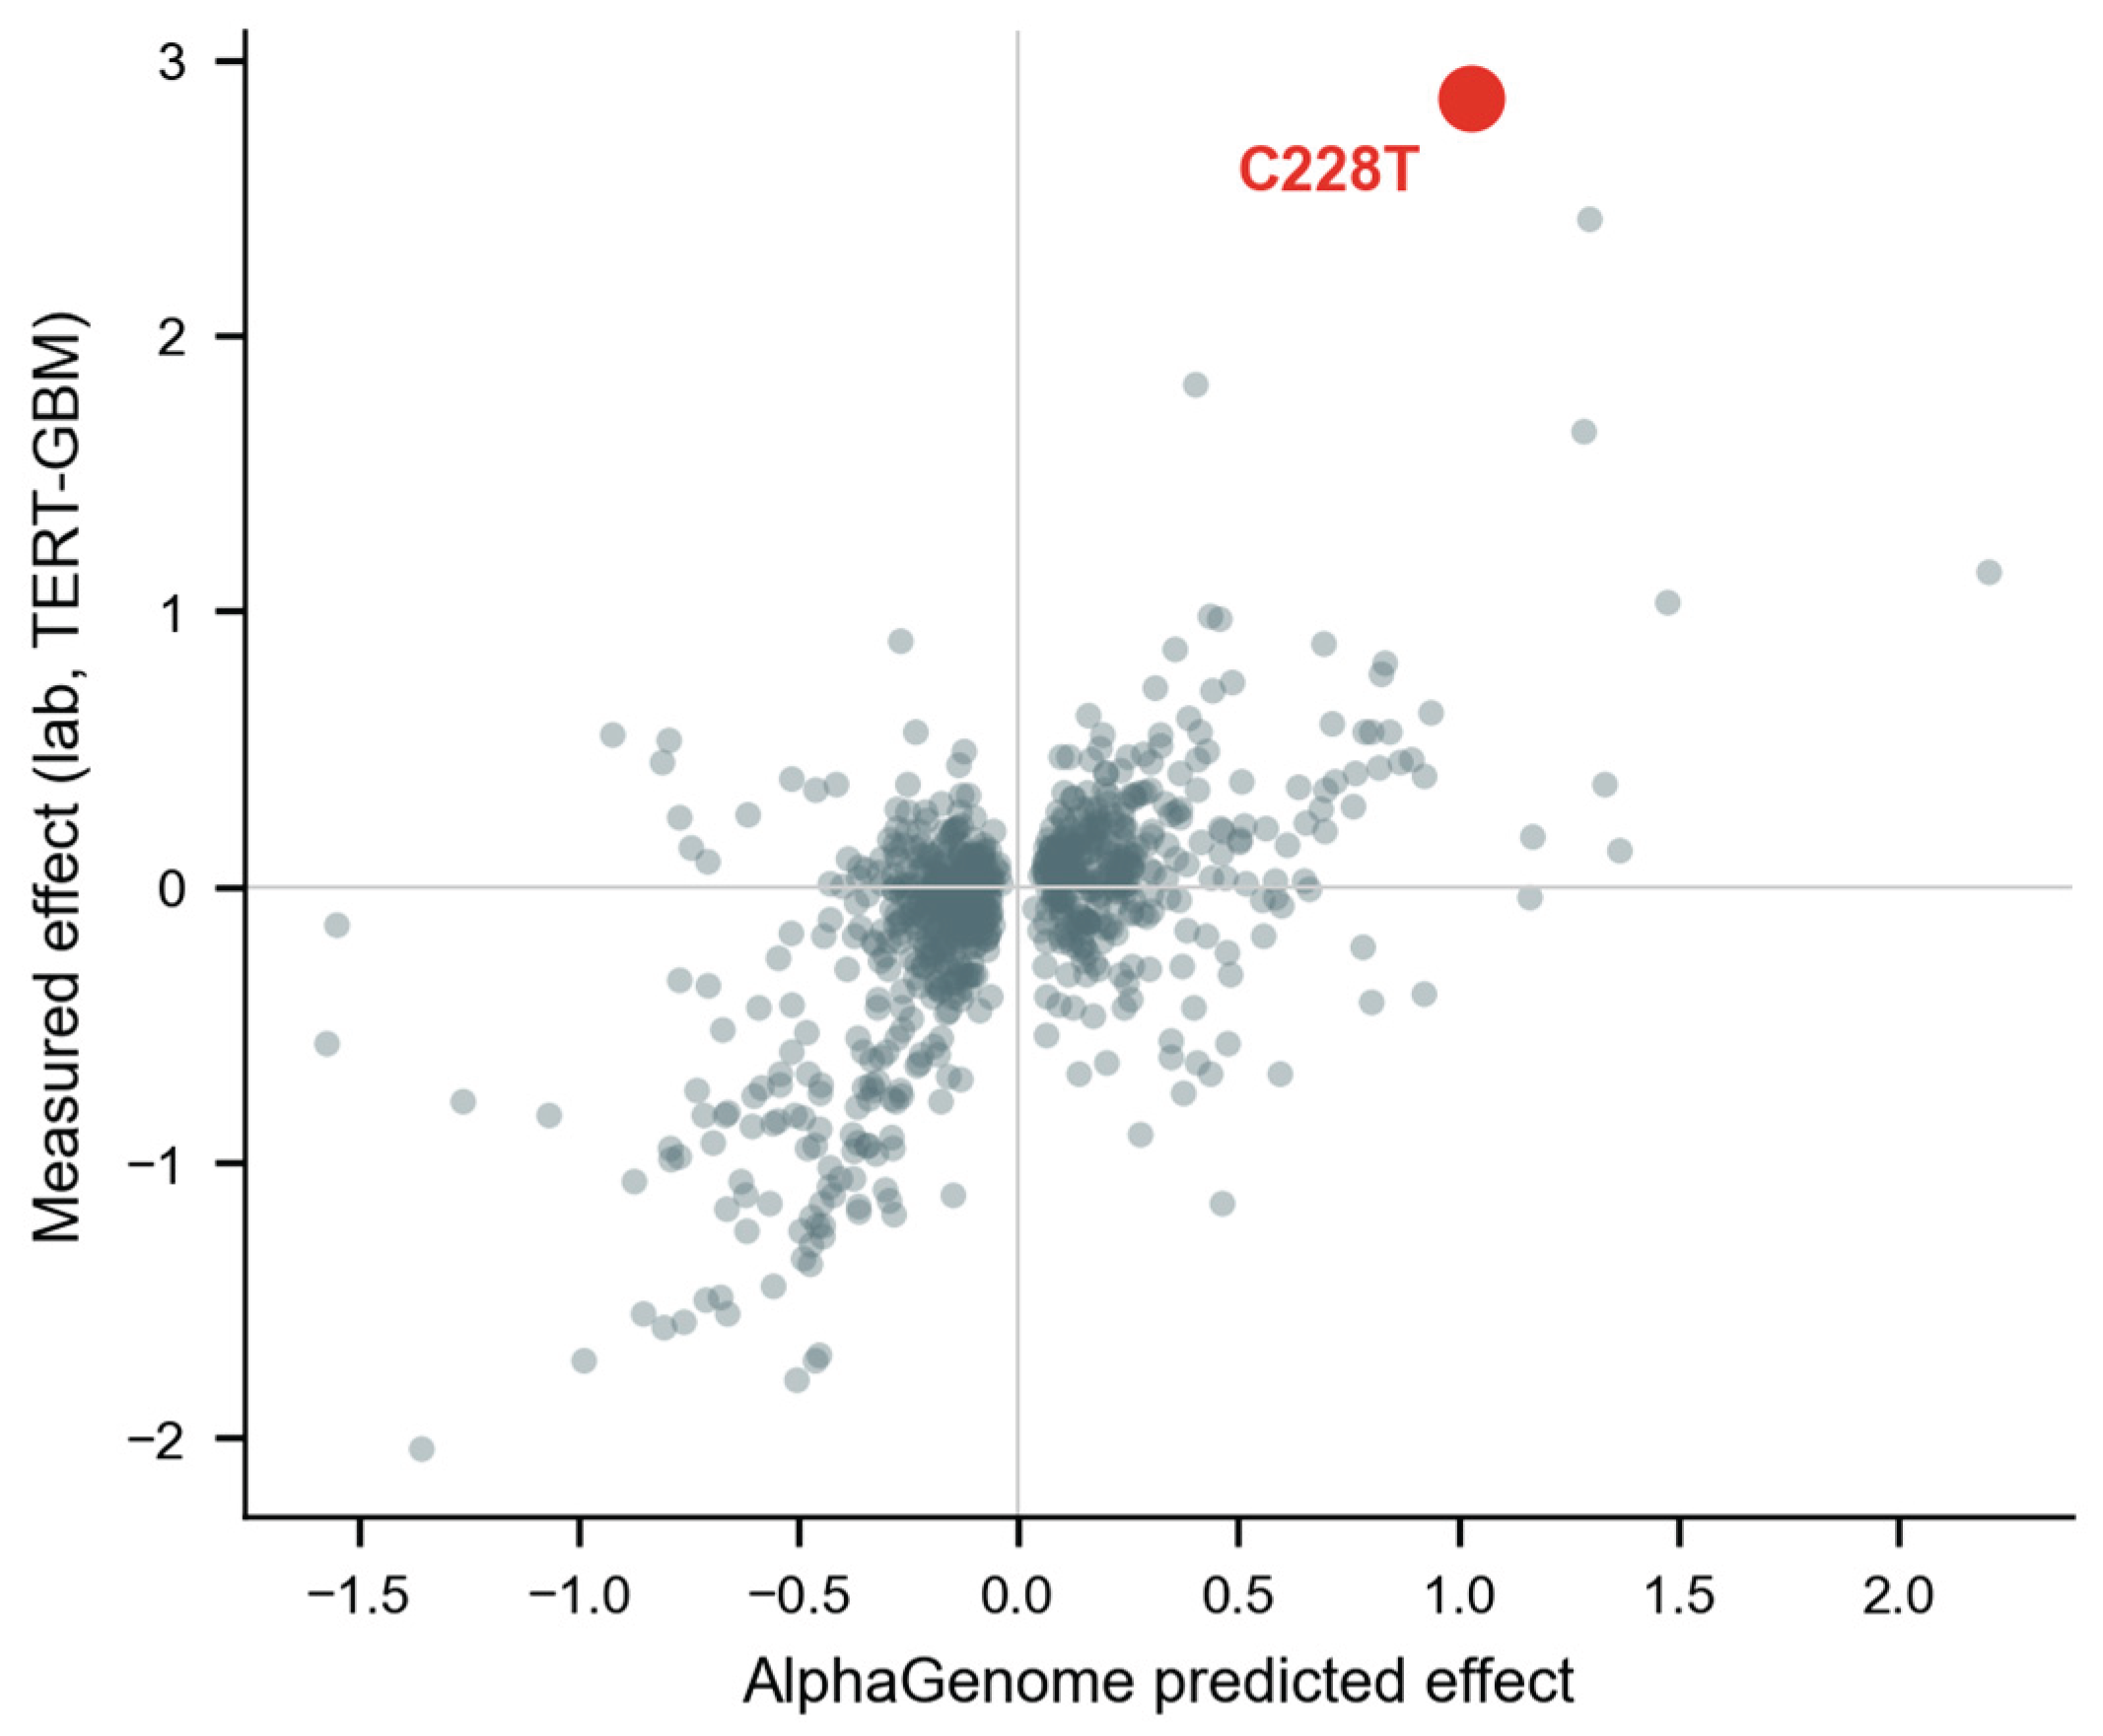

Table 1.
Per-locus miscalibration factors. The 15 distinct regulatory elements, ordered by distance from element to target-gene TSS. Ratio is MAD(AlphaGenome) / MAD(measured): >1 means the model over-disperses, <1 means it collapses. ρ is the within-locus Spearman correlation between predicted and measured effects. n = single-nucleotide variants scored.
Table 1.
Per-locus miscalibration factors. The 15 distinct regulatory elements, ordered by distance from element to target-gene TSS. Ratio is MAD(AlphaGenome) / MAD(measured): >1 means the model over-disperses, <1 means it collapses. ρ is the within-locus Spearman correlation between predicted and measured effects. n = single-nucleotide variants scored.
| Element | Gene | Dist (bp) | n | MAD meas. | MAD AG | Ratio | ρ |
| HBB | HBB | 47 | 561 | 0.119 | 0.687 | 5.79 | +0.46 |
| TERT-GBM | TERT | 65 | 777 | 0.252 | 0.300 | 1.19 | +0.52 |
| HNF4A | HNF4A | 71 | 855 | 0.044 | 0.124 | 2.79 | +0.16 |
| LDLR | LDLR | 79 | 954 | 0.237 | 0.137 | 0.58 | +0.23 |
| HBG1 | HBG1 | 84 | 822 | 0.163 | 0.443 | 2.72 | +0.44 |
| F9 | F9 | 126 | 904 | 0.133 | 0.419 | 3.14 | +0.37 |
| PKLR | PKLR | 191 | 1,407 | 0.267 | 0.260 | 0.97 | +0.48 |
| FOXE1 | FOXE1 | 328 | 1,800 | 0.074 | 0.133 | 1.80 | −0.02 |
| RET | RET | 9,710 | 1,797 | 0.074 | 0.033 | 0.45 | +0.13 |
| IRF6 | IRF6 | 9,947 | 1,785 | 0.148 | 0.060 | 0.41 | +0.26 |
| ZFAND3 | ZFAND3 | 11,939 | 1,736 | 0.089 | 0.009 | 0.10 | +0.14 |
| TCF7L2 | TCF7L2 | 48,297 | 1,770 | 0.059 | 0.002 | 0.04 | +0.02 |
| BCL11A | BCL11A | 58,414 | 1,799 | 0.044 | 0.033 | 0.75 | +0.12 |
| SORT1 | SORT1 | 122,967 | 1,790 | 0.237 | 0.008 | 0.03 | +0.19 |
| MYC | MYC | 335,101 | 1,792 | 0.059 | 0.012 | 0.20 | +0.13 |
Disclaimer/Publisher’s Note: The statements, opinions and data contained in all publications are solely those of the individual author(s) and contributor(s) and not of MDPI and/or the editor(s). MDPI and/or the editor(s) disclaim responsibility for any injury to people or property resulting from any ideas, methods, instructions or products referred to in the content. |
© 2026 by the authors. Licensee MDPI, Basel, Switzerland. This article is an open access article distributed under the terms and conditions of the Creative Commons Attribution (CC BY) license (http://creativecommons.org/licenses/by/4.0/).
Copyright: This open access article is published under a Creative Commons CC BY 4.0 license, which permit the free download, distribution, and reuse, provided that the author and preprint are cited in any reuse.


