

Submitted:
17 July 2026
Posted:
20 July 2026
You are already at the latest version
Abstract
Caffeine (1,3,7-trimethylxanthine) is a widely consumed psychoactive drug and neurostimulant, yet its molecular organization and permeation behavior in lipid membranes not fully understood. In the present study, we employ microseconds-long, united-atom Molecular Dynamics simulations to investigate caffeine interactions with a solvated DPPC (1,2-dipalmitoyl-sn-glycero-3-phosphocholine) bilayer at its fluid phase. Caffeine molecules initially aggregate in the aqueous phase to form ordered stackings, which successively permeate into the membrane. The stacked assemblies gradually dissolve, reaching a stable dispersed state where caffeine molecules preferentially reside near the headgroup–acyl chain interface and orient parallel to the lipid acyl chains, consistent with previous experimental and simulation studies. Simulations initiated with caffeine in the membrane core converge to the same equilibrium state, indicating a preferred localization at the interface region. Density profiles and caffeine distributions suggest that direct translocation across the membrane is unlikely. Caffeine partitioning transiently reduces slightly bilayer thickness and increases the membrane surface area, while enhancing acyl chain stiffness near the hydrophilic part of the membrane. These observed trends are reproducible over different system sizes and independent simulations. Overall, this study provides atomic-level insights into the caffeine permeation process, including its effect on the lipid bilayer structure.
Keywords:
caffeine
; drug-membrane interactions
; molecular dynamics
; DPPC
; permeation
; atomistic simulation
; molecular modelling
; lipid membrane
; bilayer
1. Introduction
A typical cell membrane is mainly composed of several types of lipids and proteins, and its semi permeable nature not only controls the selective transport of molecules across it but also protects the cell [1]. Drug-lipid interactions are pharmacologically relevant due to various factors, including drug partitioning to membranes occurring more frequently than non-specific protein binding, accumulation of nonpolar xenobiotics in lipid bilayers and passive transport contributing to drug disposition [2]. Several biophysical methods have paved the way to gain better insights on drug-membrane interactions focusing primarily on the pharmacokinetics, pharmacodynamics and toxicity of the drugs. Quantitative molecular and thermodynamic descriptions of these drug-lipid interactions are frequently obtained using molecular dynamics (MD) simulations, which can access time and length resolutions that are not simultaneously accessible by regular experimental techniques [3].
Caffeine exhibits hydrophobic behavior that enables it to permeate through cellular membranes and blood-brain barriers with ease [4]. This marked efficiency makes caffeine an essential central nervous system (CNS) stimulant which increases alertness and reduces sleepiness [5,6]. Consumption of caffeine mitigates liver related diseases like hepatic steatosis and fibrosis, ultimately lowering the risk of clinical progression to cirrhosis and hepatocellular carcinoma (HCC) [7]. Caffeine being soluble both in water and lipids can easily get absorbed from stomach and small intestine [7]. Caffeine acts as a non-selective antagonist for adenosine G-protein-coupled receptor subtypes particularly A1 and A2A thereby modulating neurobehavioral pathways linked to depression, drug reinforcement, and locomotor sensitization and offers critical therapeutic insights for Alzheimer, Parkinson and Huntington diseases, multiple sclerosis, heart failure, and cancer [8,9,10,11,12]. Caffeine was also proven to be a potential inhibitor for the 3-chymotrypsin-like protease of SARS-CoV-2, which paused the global pandemic in 2019-2023 [5,13]. Apart from being the most widely used psychoactive drug, caffeine exhibits anti-aging curableness, rendering it an essential part of modern medicine [14]. If used as an adjuvant with pain killers, caffeine enhances the analgesic drug properties. It further reduces risks of chronic kidney disease (CKD) and nephrolithiasis [15,16,17] and shows hepatoprotective effects [18].
In a past study, using spectroscopy, molecular docking and simulations it was found that caffeine could inhibit the glycoprotein bovine lactoferrin (BLF) digestion and improve its function[19]. Very recently Alao et al. [20] demonstrated the potential lifespan and health benefits of caffeine from studies on fission yeast. Apart from the health benefits, caffeine plays two primary ecological roles by acting as an allelopathic agent that inhibits the growth of competing vegetation and as a chemical defence mechanism protecting plant tissues from pathogens and animals [21].
At the same time, high doses of intake cause caffeine intoxication, resulting in adverse health effects [22,23]. It is thus clear that the wide possibilities of caffeine in field of medicine, pharmaceutics and general biology render it a prominent and intriguing subject for extensive research.
The active behavior of an amphiphilic compound such as caffeine with the cellular membrane plays a critical role in shaping its overall pharmacological efficacy[24]. Quasielastic neutron scattering (QENS) studies showed that caffeine improves the dynamics of dioctadecyldimethylammonium bromide (DODAB) lipid membrane, by acting as a plasticizing agent during the coagel phase; however, in the fluid phase it restricts the lipid dynamics by acting as a stiffening agent [25]. Numerous experimental studies have examined the permeation and dissolution of drugs, including caffeine, into membranes [26,27,28,29,30,31]. In parallel, invaluable insights on drug disposition in the human body and, consequently, on absorption, distribution, metabolism, and excretion (ADME) processes and on how pharmaceuticals interact with biomembranes can be provided by simulation and modeling [32]. Towards this, many computational studies, involving primarily MD, have focused on the caffeine dynamics in the membrane. The penetration properties of caffeine and its metabolites in 1-palmitoyl-2-oleoylphosphatidylglycerol (POPG) and 1,2-dioleoyl-sn-glycero-3-phosphocholine (DOPC) membrane are well described by considering the potential of mean force (PMF) [32]. The drug was found to be located deeper in the bilayer than the corresponding metabolites and was likely to concentrate more on the DOPC membrane compared to POPG. The preferred location of caffeine molecules in the membrane was found to be in the water-headgroup interface as established in past works [33,34]. The free energy profiles of caffeine and DOPC membrane not only showed a minimum at water headgroup interface but also a shallow local minimum to exist at the centre of the bilayer [32], suggesting a spontaneous partition of caffeine molecules inside the membrane. Combined X-ray diffraction experiments and MD simulations have investigated systematically the caffeine and 1-Palmitoyl-2-oleoyl-sn-glycero-3-phosphocholine (POPC) membrane interactions [34]. They concluded that water density in the hydrophilic to hydrophobic interface increases, resulting in overall dehydration and thickening of the membrane [34]. Additionally, they observed the spontaneous partition of caffeine from aqueous solution into the membrane. An experimental study employing quartz-crystal microbalance and neutron reflectometry techniques, determined that caffeine molecules lay parallel to the acyl chains in the hydrophobic region of a POPC bilayer and cannot spontaneously permeate from the aqueous environment into the bilayer [35]. This inability to permeate, exhibited by the caffeine, was supposedly due to omitting the influence of caffeine stacking on the nonspecific interactions with a lipid membrane [35]. MD simulations of caffeine molecules in aqueous solution showed tendency for the molecules to aggregate, with the mechanism of aggregation corresponding to stackings of the hydrophobic planar faces [36,37,38].
Previous caffeine-membrane simulation studies have primarily investigated various model membranes such as POPC, DODAB, and mixed lipid bilayers. In the present study, we concentrate on the interactions of caffeine with a DPPC lipid membrane employing microsecond-long MD simulations. DPPC was chosen due to its biological relevance, as phosphatidylcholines constitute nearly 40–50% of the phospholipids in mammalian cell membranes, making it a suitable model system for eukaryotic membranes. In addition, as a zwitterionic phospholipid, DPPC remains one of the most extensively studied membrane systems for experiment and simulation studies [39,40,41,42,43,44,45]. Thus, it provides a well-characterized and reliable, yet chemically simple, system for investigating the interaction of caffeine with biomembranes.
In a previous study we investigated the structural and phase behavior of DPPC membrane under lateral pressure, including extreme conditions of compression and stretching [39]. In the present contribution, we investigate the mechanisms governing caffeine–DPPC membrane interactions, with particular emphasis on caffeine clustering, permeation, and eventual dissolution within the lipid bilayer interior. Additionally, the orientation and positional preference of caffeine, along with the membrane structural alterations induced by caffeine, are systematically examined.
2. Methodology
All MD simulations are performed with the open-source software suite Gromacs (version 2021.4) [46] using the Berger lipid (L-B) force field [47], an interaction potential widely used in the last two decades for the simulation of lipid-based systems [32,39,48,49,50,51,52,53,54,55,56]. The L-B is a united-atom (UA) interaction potential based on the GROMOS 54a7 force field [57]. In the UA description the CH, CH2 and CH3 units are treated as single interaction sites, and the corresponding hydrogens are not explicitly present in the model description. Owing to this grouping, the UA representation is nearly three times faster, than the all-atom (AA) representation, as shown in a recent publication involving pure DPPC membrane [39], offering significant computational efficiency and enabling expanded simulation times. At the same time, it retains more explicit information compared to coarse grained models [58,59,60] allowing for a balance between accuracy and efficiency [39,61,62,63].
The Visual Molecular Dynamics (VMD) [64] software (version 1.9.3) is used for all visualisations of the computer-generated system configurations. A bilayer membrane comprising 128 DPPC in each leaflet is created by replicating an initially equilibrated 64-64 bilayer structure in the bilayer plane [65]. 30 water molecules per DPPC are added ensuring full hydration [66]. The simple point charge (SPC) model [67] is used for the water representation. All bonds are constrained to their equilibrium lengths with the linear constraint solver (LINCS) [68] algorithm. The plane of the bilayer membrane is set in the x-y plane, and consequently the bilayer normal aligns to the z axis. Periodic boundary conditions are applied on all dimensions and cut-off distance of 1.2 nm is implemented for the Lennard–Jones interactions and the real space part of electrostatic ones. The particle-mesh Ewald (PME) method [69] is used to compute long-range electrostatic interactions. For energy minimization, the steepest descent algorithm is implemented.
All production MD simulations are performed in the isothermal-isobaric (NPT) ensemble with the Nose-Hoover thermostat [70,71,72] coupling to 323K; Constant lateral pressure (along the x-y plane) is maintained using the semi-isotropic Parrinello-Rahman pressure [73,74] coupling to 1 bar. The integration time step is set to 2.0 fs and system configurations (frames) are saved every 100 ps. As an initial step we conduct NPT MD simulations with a total duration of 200 ns on the pure DPPC plus water system at the aforementioned conditions.
Caffeine representation and topology is performed by using the Automated Force Field Topology Builder (ATB), computing partial charges using quantum mechanical optimization at the B3LYP/6-31G* level of theory [75,76,77]. In the second step caffeine molecules are inserted into the corresponding DPPC + water system. It is well known that caffeine, when dispersed in aqueous solutions, forms stacks [37,38] . In the present study caffeine concentration is chosen as 20% mol ensuring molecular organization in the form of clustering and stacking as we demonstrate later. Practically, this corresponds to the insertion of 50 caffeine molecules. Accordingly, the final system is composed of fully hydrated 256 molecules of DDPC and 50 molecules of caffeine. Two different sets of simulations are conducted: in the first one the caffeine molecules are inserted into the water volume of the system while in the second they are directly inserted into the hydrophobic part of the lipid membrane. Figure 1 shows the DPPC (panel a) and caffeine (panel b) molecules in the employed UA representation, while a snapshot of the complete system is shown in panel (c).
Our manuscript primarily focuses on the results of the first scheme where the caffeine molecules are inserted in the aqueous solution while the second placement scheme is briefly discussed for comparison. After the caffeine molecules are inserted into the system an energy minimization is applied, followed by an NVT MD simulation of 1 ns (T = 323 K). The resulting configuration of the equilibration step is used as the initial one for the production NPT MD (T = 323 K and P = 1 bar), whose total duration reaches 2000 ns (2 microseconds). The significantly prolonged simulation time guarantees, as will be demonstrated in the continuation, capturing the whole permeation process of caffeine, including cluster formation and stacking, permeation and eventual dispersion into the DPPC bilayer.
3. Results and Discussion
3.1. Caffeine Location
The panels of Figure 2 show snapshots (system configurations) at specific time intervals during the production NPT MD simulation. The time instances have been selected to correspond to different phases of the caffeine permeation into the lipid bilayer. For example, panel (a) depicts the starting configuration (t = 0 ns), after the initial NVT MD equilibration, in which the caffeine molecules remain in the aqueous phase and begin to associate, forming small, spatially dispersed clusters. No caffeine molecule exists in the hydrophobic interior of the membrane. Thus, the simulation is initiated with all caffeine molecules placed in the water layer. As the simulation progresses, caffeine–caffeine interactions drive aggregation, leading to the formation of a larger cluster by approximately 40 ns, while a few individual molecules begin to penetrate the membrane, as illustrated in panel (b). Subsequently, the aggregated cluster transforms into a columnar stack with most of the caffeine molecules pointing towards a single direction as observed at t = 75 ns in panel (c). The stacked caffeine assembly starts to penetrate the water-lipid interface. The gradual permeation continues deeper into the bilayer and adopts a tilted orientation by t = 143 ns, with molecules aligned parallel to the lipid acyl chains (AC), as shown in panel (d). This time marks the transition where no caffeine molecules remain in the aqueous part of the system. At later time interval (200 ns ≤ t ≤ 400 ns), as seen in panels (e–g) transient aggregation occurs near the hydrophobic core of the membrane, without any visible stacking of the caffeine molecules. This aggregation begins to disperse, as evident in panel (h), at t = 600 ns where a significant number of caffeine molecules are detached from the main cluster. The dispersion continues and becomes nearly complete by t = 800 ns (panel (i)), where the molecules are primarily localized in a narrow region along the bilayer normal, very close to the lipid headgroup (HG) in both leaflets of the membrane. Beyond this stage, the spatial distribution remains unchanged until the end of the simulation (t = 2000 ns), as reflected in panel (j) of Figure 2, marking further the end of the permeation-dispersion process.
The mass density profile of caffeine, utilizing the center of mass of each molecule as reference, along the bilayer normal (z-axis) is calculated over different time intervals (panel (a) of Figure 3). To determine the spatial distribution of caffeine molecules relative to the membrane and the aqueous solution, in addition to the caffeine data the density profiles of HG, AC for DPPC and water are also present in panel (a). For visual clarity and to highlight the differences between the different permeation steps, panel (b) Figure 3 hosts the mass density profiles only for caffeine.
Focusing on the DPPC and water components, the following conclusions can be drawn from the corresponding density profiles: a) for coordinates z ≤ -2 nm and z ≥ +2 nm the corresponding domain is occupied solely by water molecules; b) the spatial intervals -2 nm ≤ z ≤ -0.5 nm and +0.5 nm ≤ z ≤ +2 nm correspond to the interface formed by water molecules and the hydrophilic head of the DPPC which comprises a mixture of headgroup (HG) and acyl chain (AC) segments and accounts for ~75% of the membrane; c) the interval -1 nm ≤ z ≤ +1 nm marks the hydrophobic core of the DPPC assembly where no water molecules reside, composed of AC tail carbons and constituting the remaining ~25% of the membrane. Additionally, by comparing the HG profiles of the system with (present work) and without [39] caffeine molecules in the water-membrane interface, the HG profile seems to be more extended and slightly penetrate the interior of the hydrophobic lipid core in the presence of caffeine. This is evidenced by the HG concentration in the intervals -1 nm ≤ z ≤ -0.5 nm and +0.5 nm ≤ z ≤ +1 nm being significantly higher in the case of caffeine-loaded system compared to the pure DPPC + water one. Based on the above, panel (c) of Figure 3 shows a schematic of the total system with horizontal planes identifying the limits of the three different domains (aqueous, interfacial and core).
During the equilibration phase, caffeine remains in the aqueous region with no molecules penetrating the interface and the membrane as demonstrated by the corresponding density curve in panel (b) of Figure 3.
During the initial time intervals of 0 – 40 ns, and 40 – 200 ns, of the main production simulation, gradual increase in caffeine density between the headgroup planes is observed, indicating partial penetration of caffeine into the membrane, while the main fraction of molecules remains in the solvent phase. This trend corresponds to the early stage of membrane permeation by caffeine molecules. The interval 200 – 400 ns shows that no caffeine exists in the aqueous domain and thus marks a transition where caffeine has successfully penetrated the water-membrane interface. In parallel, a significant fraction of caffeine molecules resides deep in the hydrophobic core of the DPPC molecular assembly as evidenced by the almost flat mass density profile in the range -1 nm ≤ z ≤ + 1nm. The permeation process of the caffeine molecules from the aqueous solution into the membrane is completed by 200 ns, as the mass density profiles of the caffeine molecules for the later instances (200 - 400, 400 - 800, and 800 - 2000 ns) show almost zero density in the region ( -2 nm). Caffeine molecules reside exclusively in the hydrophobic core of the membrane at later time intervals (400 – 800 ns and 800 – 2000 ns), and their mass density profile is significantly different compared to the earlier one (200 – 400 ns): in the latter two symmetrically placed peaks appear around −1.1 and +1.1 nm, becoming even more pronounced near the end of the simulation. In parallel, the caffeine population in the central volume of the membrane core (-0.5 nm ≤ z ≤ + 0.5 nm) progressively diminishes. This is in sharp contrast with the almost flat profile adopted by caffeine molecules once they permeate the membrane. The observed symmetric peaks, formed at approximately ± 1.1 nm, correspond to planes located between the lipid HG and AC, representing the headgroup–acyl chain interfacial region and indicating a preferential localization of caffeine at this interface. The decay of caffeine density at the bilayer center to nearly zero values further suggests that the penetrant molecules clearly avoid the highly hydrophobic core of the membrane and align with the lipid head groups.
The fraction of caffeine molecules in the three identified regions (aqueous, interfacial and core) of the total system is further calculated and monitored throughout the simulation, as seen in panel (d) of Figure 3. The final configuration of the NVT simulation, which serves as the initial configuration for the production MD, exhibits a caffeine fraction close to unity in the aqueous region, indicating that nearly all caffeine molecules remain initially solvated. This fraction decreases approximately linearly with time, dropping to zero by t ≈ 200 ns, consistent with the progressive penetration of caffeine into the membrane. Concurrently, the caffeine fraction in the (HG–AC-water) interface, increases in a complementary manner and reaches a plateau over a similar time scale, indicating substantial accumulation in this mixed region. In contrast, the fraction of caffeine in the hydrophobic core remains negligible until ≈ 50 ns, after which it increases gradually, reaching a transient plateau around ≈ 200 ns and persisting until ~400 ns, coexisting with the population plateau observed for the interfacial domain. Beyond this point, the caffeine fraction in the hydrophobic core (-0.5 nm ≤ z ≤ + 0.5 nm) of the membrane decreases steadily, approaching zero by ~ 800 ns, accompanied by a corresponding increase in the HG–AC mix region, approaching a value close to unity. This trend demonstrates that while a fraction of caffeine molecules reach the bilayer centre within the early permeation process (t ≈ 50 ns), they reside there only transiently, before redistributing to the HG-AC mix region.
Based on the above the central volume of the bilayer is not thermodynamically favorable for sustained caffeine localization; rather, the transient population reflects an early permeation step where the caffeine molecules self-assemble into a large cluster, as visualized in panels (d), (e) and (f) of Figure 2 and as will be demonstrated later in the cluster analysis. This caffeine aggregate temporarily reaches the hydrophobic core of DPPC before its eventual dissolution. At longer times, caffeine eventually redistributes toward the interfacial region, consistent with the density profile analysis, indicating preferential localization near the headgroup–acyl chain interface.
The conclusions described above, as drawn from both the density profile and the temporal evolution of caffeine fractions, consistently indicate that caffeine molecules first self-assemble, then penetrate and eventually disperse preferentially at the interface between the HG and AC regions. This interfacial preference is in excellent qualitative agreement with past studies. Previous MD simulations [33] in DOPC membrane demonstrated that the free energy minimum is beneath the HG region at a distance of 1.1-1.7 nm from the bilayer center. While Khondker et al. [34] reported caffeine localization near the head group–tail group interface of the POPC bilayers, at |z|-values of 1.5 and 1.7 nm from simulations and experiment, respectively. The experimental studies by Tavagnacco et al. [35] on supported POPC bilayers found caffeine molecules to orient parallel to the acyl chains, and accumulating at 0.78 nm from the bilayer centre just below the HG region, qualitatively matching with our results. However, they found that the caffeine could not permeate into the membrane from the aqueous solution. Although DPPC and POPC are both phosphatidylcholine (PC) lipids, and direct comparison between these systems should be done with care because of their differences in acyl chain composition, lipid ordering, membrane thickness and caffeine concentrations. Nevertheless, the present results reveal a comparable localization behaviour for the caffeine in DPPC membrane, with caffeine accumulating near the interface between the HG and AC segments. The preferred dispersion position along the z-axis occurs at approximately 1.1 nm from the center, as evidenced by the density profiles (panel (b) of Figure 3.
3.2. Cluster Analysis
It is apparent from the snapshots in Figure 2 that the caffeine aggregates in a stacked form while in the aqueous solution, penetrates, as a single stack into the membrane, and eventually disintegrates into smaller clusters or individual molecules, all localized in the HG and AC interface. To provide quantitative information about caffeine aggregation over time, we carry out cluster analysis focusing on caffeine molecules. Each caffeine molecule is represented here through its center of mass.
A cluster is defined as several inter-connected caffeine molecules, where connectivity is established if the distance between any pair of molecules is . The minimum cluster size is defined as one, i.e. a cluster can be composed of a single isolated caffeine molecule as in the cluster analysis presented in [78]. Figure 4 shows the cluster formation of the caffeine molecules as the simulation evolves where the caffeine molecules in the largest cluster are shown as green spheres whereas the rest are shown in yellow. A detailed representation of the same snapshots is provided in Figure S2 of supplementary information. Using this geometrical analysis, we calculate the number of distinct clusters, , and the caffeine fraction in the largest cluster, , shown in panels (a) and (b) of Figure 5. is defined as the number of caffeine molecules in the largest cluster divided by the total number of caffeine molecules, which is equivalent to the size of the cluster. This parameter is therefore bounded between 0.02 (corresponding to a single caffeine molecule) and 1 (corresponding to a cluster containing all 50 caffeine molecules).
Additionally, we calculate the probability of cluster size, as a function of caffeine cluster size, , and plot it in panels (c) and (d) of Figure 5. Here, is defined as the fraction of caffeine molecules in the clusters. Therefore, also ranges from 0.02 to 1.
Panel (a) of Figure 5, shows the time evolution of the number of distinct clusters, nclust, and the caffeine fraction in the largest cluster, fLC, during the MD simulation. Also shown in the same graph are the corresponding data after the energy minimization (filled asterisk) and the 1ns-long equilibration NVT simulation (filled square). With respect to the initial system configuration, the number of distinct clusters is elevated (nclust = 24) while the size of the largest cluster is rather limited (fLC = 0.18), as shown in panels (a) and (b) of Figure 5. In parallel, the cluster size distribution, as seen in panel (c), reveals further that the probability of having clusters with size larger than 1 is very low. This can be confirmed visually in panel (a) of Figure 4 which shows a rather uniform dispersion of caffeine molecules in the aqueous environment leading to very small, isolated clusters. The output of NVT simulation shows a drop in the number of distinct clusters, nclust = 11, while the caffeine fraction in the largest cluster, fLC increases to 0.32 which is almost double the size of the preceding configuration corresponding to energy minimization. This significant increase in the size of the largest cluster marks the onset of caffeine aggregation. As time progresses, the number of distinct clusters reduces to the smallest value of nclust = 7 at around t ≈ 40 ns, while the size of the largest cluster reaches its maximum value with, fLC = 0.86 associated with the maximum value of ρ ̴ 0.14, indicating that it incorporates almost all caffeine molecules which is also verified visually in panels (b) of Figure 2 and Figure 4.
As the simulation evolves, the number of distinct clusters increases gradually while the size of the largest cluster drops at a similar rate. For example, ρ drops from ̴ 0.14 (t = 40 ns) to approximately 0.066 at t = 200 ns, demonstrating significant size reduction for the caffeine cluster. In the interval 200 – 400 ns, nclust and fLC both exhibit stable behavior within relatively small fluctuations, indicative of a sustained overall cluster formation. This stable behavior can be correlated with the transient populated phase in the central part of the membrane, which occurs at the same time interval. For example, the size probability values which correspond to the largest cluster at t = 200 and 400 ns adopt nearly identical values: 0.066 and 0.062, respectively.
The time interval 400 - 800 ns shows significant drop of the size of the largest cluster, marking its gradual collapse, as fLC drops from 0.6 at 400 ns to 0.08 at 800 ns. Eventually, in the final phase of the simulation (800 – 2000 ns), a plateau is reached for both the nclust and fLC. This plateau corresponds to a limited cluster size (fLC < 0.15), which is further subjected to fluctuations as isolated molecules get linked and detached over time. As a final note the minimum cluster size does not drop below a specific value as the volume of the hydrophobic and interfacial core is not sufficiently large to accommodate full dispersion of the caffeine molecules. In significantly larger (along the x-y dimensions) system realizations the cluster size could be reduced to even lower values.
3.3. Caffeine Orientation
The orientation of caffeine molecules is evaluated by calculating the tilt angle relative to the bilayer normal (z-axis). For each caffeine molecule we define two vectors, connecting the carbon pairs C6 – C7 and C7 – C8, as seen in the sketch of panel (a) in Figure 6, and the vector normal to their plane is computed. The angle formed by this normal vector and the bilayer normal is defined as the caffeine tilt angle. Thus, the caffeine orientations parallel and perpendicular to membrane surface corresponds to a tilt angle of 0o and 90o, respectively. Its distribution at various time frames is plotted in panel (b) of Figure 6. The distribution at the beginning (t ≤ 5 ns) corresponds to caffeine dispersion in the aqueous environment and shows an increase trend for higher tilt angles, reaching a plateau beyond . This indicates a higher preference for caffeine molecules to adopt orientations parallel to the bilayer normal.
During the time frame of 37 - 42 ns, which corresponds to extensive clustering (see also panel (b) in Figure 2 and the cluster analysis data in panel (a) of Figure 5), the distribution remains quantitatively similar to the initial phase. The broad distribution observed for the tilt angles indicates that, despite significant aggregation, the caffeine molecules still do not adopt a preferential stacking conformation. However, a marked change is observed in the continuation as for the 65 –70 ns interval, the distribution shows a broad peak in the low angle range of 15 to 35°, which corresponds to columnar stacking in which the molecular normal is nearly parallel to the bilayer normal. Deviations from the observed peak and the corresponding stacking arrangements can be attributed primarily to individual caffeine molecules which have already penetrated the lipid membrane as clearly seen in panel (c) of Figure 2. During 143 – 148 ns, a significant increase in the population of angles near 90° is observed, arising from columnar stacks being aligned along the bilayer normal, such conformations being consistent with the snapshot in panel (d) of Figure 2.
During, 400 – 405 ns, the distribution shows again more uniform distribution which could be attributed to the transient aggregation near the hydrophobic core, as depicted in panel (h) of Figure 2. As discussed earlier, the system equilibrates around 800 ns as caffeine reaches the HG-AC interface. Accordingly, during the equilibrium phase (800 – 2000 ns), the tilt angle distribution also becomes stable, demonstrating a peak at around 90o for both the time windows, at 800 - 805 ns and 1995 - 2000 ns. The persistence of such a pronounced peak beyond 800 ns, further indicates that, in the equilibrated state, caffeine molecules preferentially orient with their molecular plane perpendicular to the bilayer normal, i.e., approximately parallel to the lipid acyl chains.
3.4. Nematic Correlation Function
Caffeine molecules are known to form stacked aggregates in aqueous solution, and previous experimental [79,80] and simulation studies [81] have characterized their interplanar separation and preferred stacking geometries. As shown in the snapshots of Figure 2, in the present simulation study the caffeine molecules exhibit pronounced stacked arrangements near the water–bilayer interface, which are particularly evident during the membrane entry phase. As the simulation progresses, the aggregate size gradually decreases, and the long-range stacking correlations diminish. To quantify the extent of orientational correlation between caffeine molecules as a function of intermolecular separation , we compute the nematic correlation function, defined as, , where, is the second-order Legendre polynomial, and and are the unit orientation vectors of caffeine molecules i and j, respectively [82]. The orientation vector of the caffeine molecule is essentially the same vector which is used for measuring the tilt angle. The cosine term corresponds to the angle, θ, between the two molecular orientation vectors. The nematic correlation function, following a similar approach for orientational correlation function as presented in [83], is evaluated by averaging over all molecular pairs whose center-of-mass (C.o.M.) separation lies within the interval , followed by ensemble averaging over all configurations for a given time window. Here, is set as 0.1 nm. Thus, measures how strongly two caffeine molecules are orientationally aligned to each other as a function of their separation distance, reflecting the degree of stacking present in the system. is calculated only for the caffeine molecules composing the largest cluster of each configuration.
The nematic correlation function is calculated over time intervals of 5 ns (practically 50 successive frames) at different segments of the trajectory and the results are reported in panel (c) of Figure 6. Owing to the limited number of configurations per window, the resulting profiles exhibit noticeable statistical noise. Therefore, a smoothing procedure is applied to reduce fluctuations and improve clarity in the representation of the data.
At the initial stage of the simulation (0 – 5 ns), displays four to five successive peaks, indicative of multiple interplanar stacked aggregates in the aqueous solution and marking the onset of aggregation. The pronounced yet gradually decaying peaks suggest strong interplanar packing within small aggregates, as shown in panel (a) of Figure 2. By 37 – 42 ns, both the peak intensity and periodicity are significantly reduced, with oscillations nearly vanishing beyond the third peak, suggesting disruption of extended stacked arrangements within the largest cluster. This trend is consistent with the broader tilt-angle distribution observed over the same interval, reflecting diminished orientational order.
In contrast, during 65 –70 ns, exhibits persistent oscillations extending over six to seven peaks with smaller decay, indicating long range correlations and signifying well-defined larger multilayer stacking. This behavior agrees with the stacking conformation of the largest caffeine cluster (panel (c) in Figure 2), which shows pronounced interplanar organization. At 140 – 145 ns, sustained correlations remain, albeit slightly attenuated compared to 65 – 70 ns, consistent with the conformation of the largest caffeine aggregate being embedded within the membrane and adopting multilayer stacked layers predominantly in a parallel-to-AC orientation, as supported by the prominent peak near 90° in the tilt angle distribution (panel (b) of Figure 6). In the later intervals (300 – 305, 800 – 805, and 1995 – 2000 ns), shows markedly reduced ordering, characterized by weaker oscillations and fluctuations around low values, signaling the absence of extended stacking caffeine conformations.
The interplanar separation between two stacked caffeine molecules is estimated from the position of the first peak in the correlation function. For all time intervals examined, this peak is located at around 0.39 - 0.41 nm. The interplanar distances obtained in the present study are in good agreement with previous reports. In a previous experimental study, the interplanar distances of the caffeine dimers calculated for anhydrous caffeine crystals were found to vary from 0.322 nm to 0.347 nm [81]. Furthermore, Density Functional Theory (DFT) simulations of caffeine in aqueous solution, reported an average interplanar distance of 0.39 nm [79]. Another MD simulation work for caffeine in aqueous NaCl salt solution, reported the formation of higher order caffeine cluster with a spacing of 0.37 nm [84]. The values obtained here, in the range of 0.37– 0.45 nm, fall within the experimentally and computationally reported range.
3.5. Effect of Caffeine on the Membrane Bilayer
Small amphiphilic molecules are known to modulate the physicochemical properties of lipid bilayers, which can influence membrane protein function [85]. These molecules perturb key membrane characteristics, such as elasticity, curvature, and thickness, thereby altering the energetic landscape associated with protein conformational changes and potentially modulating their activity. Consequently, understanding drug–membrane interactions is essential for evaluating both toxicity and therapeutic efficacy [86]. In this context, the present study examines the effect of caffeine on membrane structure by quantifying changes in membrane surface area, lipid chain ordering, and bilayer thickness.
3.5.1. Surface Area and Bilayer Thickness
The surface area of the membrane is calculated as and its time evolution is shown in Figure 7. and are the simulation box lengths in the x-y membrane surface. Also reported as the corresponding data for the caffeine-free (pure) DPPC membrane in water [39]. The surface area increases nearly linearly with time, from an initial value of Sxy ≈ 78 nm² to approximately 84 nm² by t ≈ 300 ns, corresponding to an increase of about 8 %. After this transient increase the membrane surface area stabilizes for the remainder of the simulation.
Cluster analysis indicates that maximum caffeine aggregation occurs by t ≈ 40 ns, which evolves into a stacked configuration by t ≈ 65 ns, as evident in the snapshots in panels (b) and (c) in Figure 2. Due to the stacked organization, fewer caffeine molecules are exposed to the membrane surface, resulting in an almost constant , during the early stages of the simulation (t ≤ 90 ns), indicating the surface area is only weakly affected. As the stacked aggregates begin to disperse during the membrane entry, a larger number of caffeine molecules become exposed to the membrane surface, contributing to the overall expansion of the membrane surface.
The bilayer thickness (dpp), presented as a function of time in Figure 7 is calculated as the distance between the average z-coordinate of the phosphorus (P) atoms of the headgroups in the top and bottom leaflets. The membrane thickness exhibits a gradual decrease of nearly 6%, from an initial value of 3.8 to 3.6 nm by ≈ 600 ns, corresponding to the stage during which caffeine molecules penetrate the membrane and the stacking gradually disperses. Subsequently, the bilayer thickness increases and eventually reaches a plateau value of ≈ 3.8 nm, which is comparable to the thickness for a caffeine-free DPPC system under the same thermodynamic conditions and molecular model as reported in our previous study [39]. The reduction in bilayer thickness can be attributed to the transient phase of the simulation, during which caffeine aggregates, penetrates and subsequently disperses in the membrane. In an incompressible bilayer, lateral area expansion is usually accommodated by a decrease in thickness so that the overall membrane volume remains effectively constant, however, in the present system the bilayer thickness is almost unaffected after complete dispersion of caffeine in the membrane, indicating that caffeine permeation has only a subtle effect on the overall bilayer thickness.
A previous study combining XRD and MD simulations[34] reported an increase of ≈ 2.6% in the bilayer thickness of a POPC membrane upon caffeine penetration. This increase was attributed to a reduction in the gauche fraction of the lipid tails caused by the formation of water pockets near the headgroup region, as demonstrated through combined computational and experimental approaches. It is worth noting, however, that the study in [34] involved a different lipid composition, albeit of the PC class, and a much lower caffeine molar fraction (≈ 3%), complicating the direct comparison with the present system. In addition, there are a few reports where amphiphilic helical peptides elicit the opposite behavior, resulting in a net increase in bilayer thickness [87]. In parallel, a membrane-thinning effect was reported in the experimental study of a preloaded supported POPC bilayer [35]. Their methodology differs from that of the present simulations, as an equilibrated bilayer was subsequently exposed to caffeine in bulk water, allowing the system to relax toward an interfacial partitioning state over time.
To further quantify the Area per lipid (APL) we use the Voronoi tessellation method to handle the non-uniform packing of lipids due to the presence of caffeine molecules. It is further employed to calculate the area per caffeine (APC). The phosphorus atoms of the lipid headgroups positions (shown as black circles) and centers of mass (C.o.M.) of caffeine molecules (shown as green asterisks) are projected in each leaflet onto the x–y plane under periodic boundary conditions following a similar approach to Shinoda et al. [88]. Effectively, a 2D Voronoi diagram is constructed using the Voronoi routine from SciPy (scipy.spatial.Voronoi) through the MD-Analysis modelling tool [89,90]. For a given configuration, all P atoms and the C.o.M. of caffeine molecules are assigned to the top or bottom leaflet based on the closest proximity of their z-coordinate. For each leaflet, the Voronoi construction yields one polygon (cell) and associated area for every DPPC molecule (blue for top leaflet and red for bottom leaflet respectively) and caffeine molecule (yellow). Each of the cells corresponds to the area of the corresponding molecule. The images are produced using Matplotlib [91] and Python [92].
The snapshots in Figure 8 show the Voronoi cell distribution for both leaflets at selected time steps. The darker the colour of a Voronoi polygon around the lipid, the denser is the local environment and the lower is the APL. The colour scale is provided showing the APL variation with the colour shades. The snapshot in top left panel of Figure 8 corresponding to the energy minimized structure, shows the initial caffeine dispersion across the surface of the membrane. While the phase separated caffeine population at 40 ns as shown in top right panel of Figure 8 is in correlation with the caffeine aggregation, as shown in panels (a) and (b) of Figure 4, respectively. The caffeine stack forming around 70 ns, the phase separated domain of the caffeine shrinks slightly due to the columnar stack at 75 ns, as shown in panel (c) Figure 4. In contrast, the snapshot at Figure 8 (bottom right) at 2000 ns, shows a dispersed caffeine distribution correlating with the dispersed caffeine distribution in the equilibrium phase, as shown in panel (d) of Figure 4.
For each configuration, the average APL, calculated separately for the top and bottom leaflets, and the average APC are calculated as seen in panels (a) and (b) of Figure 9, respectively. The APC shows a slight drop at early times (t ≤ 70 ns), followed by an appreciable increase up to t ≈ 200 ns succeeded by a more gradual raise until 700 – 800 ns. This behavior is closely correlated with initial aggregation, stacking and the progressive dispersion of the caffeine clusters, indicating that the breakup of the aggregates contributes to the increase in membrane surface area.
The APL in the top leaflet remains stable, within thermal fluctuations, throughout the simulation, whereas the lower leaflet shows sharp increase during the first 100 ns, followed by a gradual decrease to a plateau value of ~ 0.55 nm² by ~ 600 ns. This asymmetric behaviour arises from the non-uniform caffeine distribution in both leaflets as shown in panel (c) of Figure 9. This trend can be understood if we consider that the caffeine self-organization (clustering followed by stacking) and eventual permeation take place in just one of the two (the top) leaflets of the bilayer, as clearly seen in panels (b) and (c) of Figure 2. As a result, the lower leaflet contains fewer caffeine molecules, allowing lipids to occupy a larger effective surface area and causing the observed initial increase in APL. As the caffeine aggregates disperse and the caffeine population becomes more symmetrically distributed between the two leaflets, by 400 ns, the area per lipid in both leaflets gradually converges to similar values.
3.5.2. Deuterium Order Parameter
Phospholipids with two distinct acyl chains, labeled as sn-1 and sn-2, are bonded to a glycerol backbone as seen in panel (a) of Figure 1. Typically, the acyl chain at the sn-1 position is saturated, while the chain at the sn-2 position is unsaturated and contains a different number of carbon atoms than the sn-1 segment [93,94]. Interaction of foreign molecules with a lipid bilayer can alter acyl chain alignment and thereby perturb membrane structure. To quantify the effect of the caffeine on the chain ordering, the Deuterium order parameter [95], is calculated using the formula, where is defined as the angle between the C–H bond vector and the bilayer normal (aligned with the z-axis in the present simulations).
The changes in the order parameter for sn-2, to be discussed below, are evaluated relative to a caffeine-free membrane as reported in [39]. During the 37 - 42ns ns interval, near the headgroup (low atom indices) exhibits deviations with respect to the caffeine-free system, while no change is detected near the terminal tail region (high atom indices). In this interval, caffeine initiates the permeation process into the membrane, through the clustering and stacking phases. Accordingly, some molecules lie adjacent to the headgroup region leading to this pattern in the SCD order parameter. For 140 - 145 ns, caffeine molecules, forming a large aggregate in the upper leaflet, have already penetrated the interface lying in the hydrophobic region, as indicated by the cluster analysis and the representative snapshots in the earlier sections. The corresponding effect on the order parameter is therefore prominent in both the headgroup and acyl chain region. The same pattern is also observed for 600 – 605 ns, where the caffeine cluster seems to expand to both leaflets and starts to disperse as indicated by panel (f) of Figure 2.
Figure 10.
Deuterium order parameter, | SCD|, for the sn-2 chain of the DPPC membrane at various time intervals. Also shown are the corresponding data for the caffeine-free (pure) DPPC system.
Figure 10.
Deuterium order parameter, | SCD|, for the sn-2 chain of the DPPC membrane at various time intervals. Also shown are the corresponding data for the caffeine-free (pure) DPPC system.
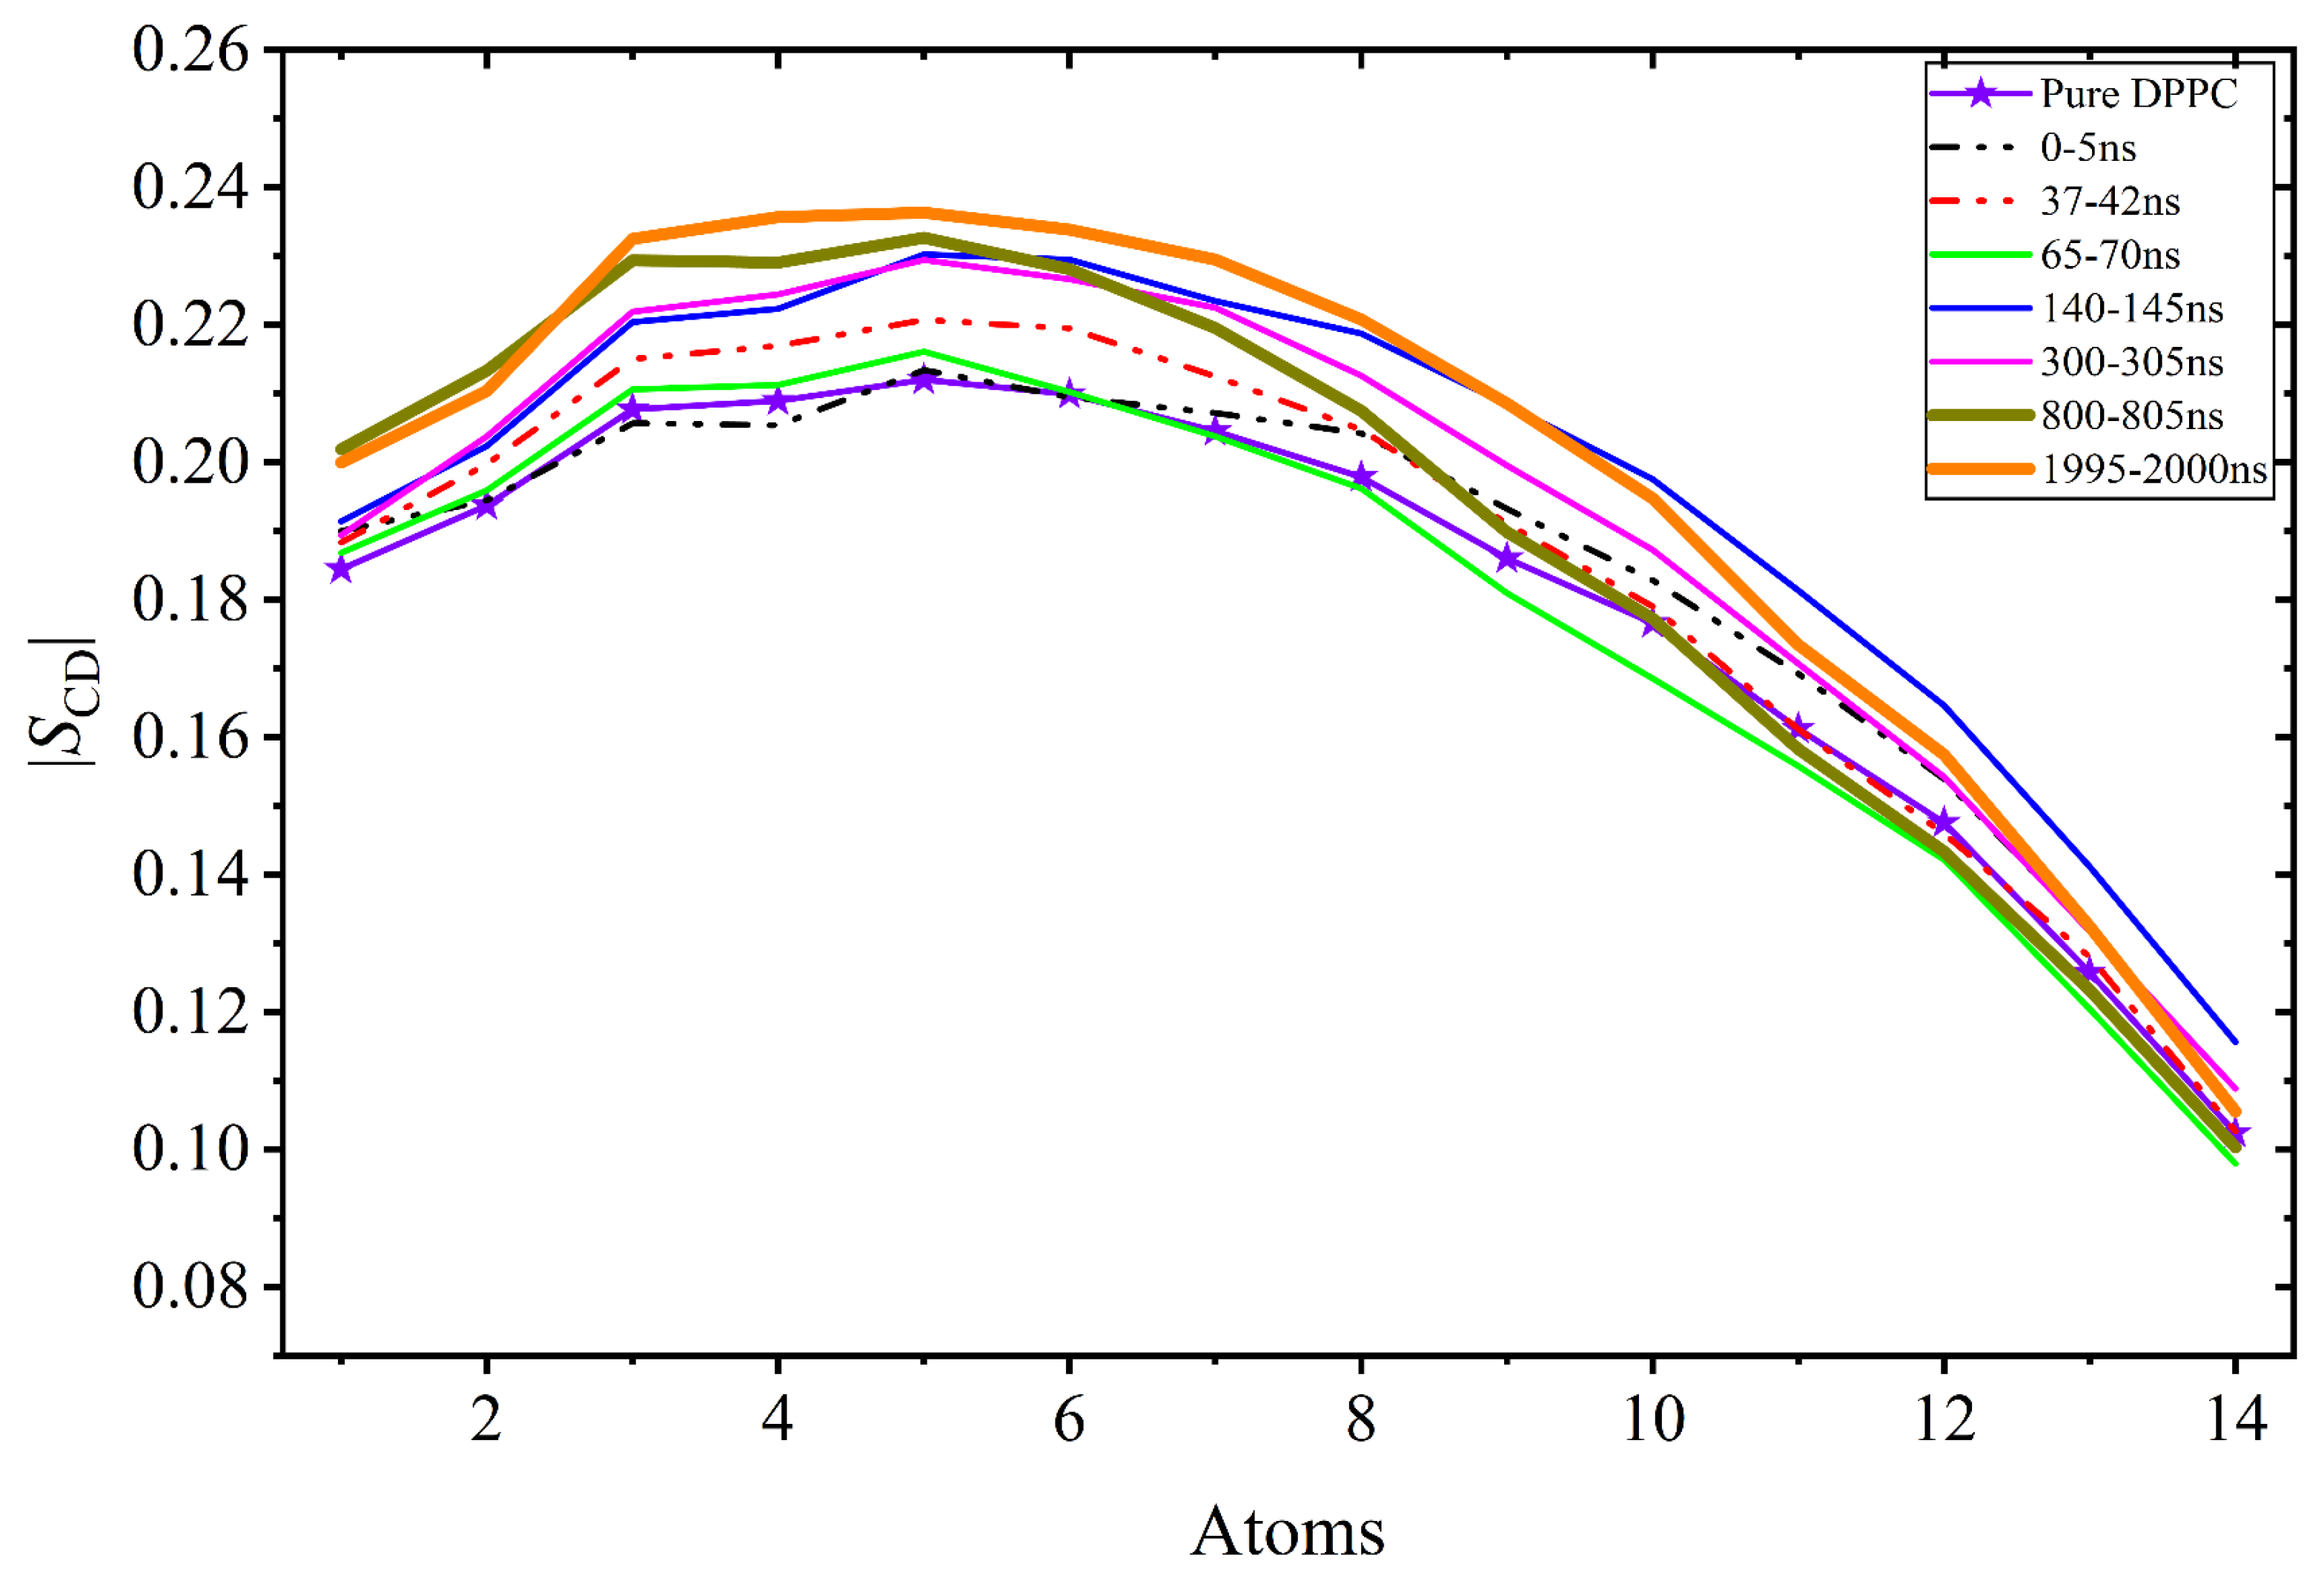
This enhancement is attributed to the presence of caffeine molecules not only near their preferred location at the headgroup–acyl chain (HG–AC) interface but also transiently within the central region of the bilayer, as evidenced by the mass density and caffeine fraction profiles (panels (b) and (c) of Figure 3). At later interval (800 – 805 ns), a pronounced increase in is observed near the acyl chain nearer to headgroup region, reaching approximately 10–12% for the fourth carbon atom by 1995 – 2000 ns with minimal effect on the terminal atoms. Overall, these results indicate that the localization of caffeine at the headgroup–tail interface during the equilibration phase increases the order parameter in the upper segments of the acyl chains, consequently reduced local fluidity in these regions and potentially causing altered membrane function [96,97]. A similar trend is observed for the sn-1 chain (Figure S1), further supporting this interpretation.
3.6. Effect of Initial Caffeine Placement
The influence of the initial caffeine placement on its dispersion and spatial distribution inside the membrane is assessed by comparing the primary modelling approach against an alternative setup where caffeine molecules, corresponding to the same concentration, are placed, in the form of a droplet, at the membrane centre (hydrophobic core of the lipid), keeping the rest of simulation parameters the same (2000 ns of NPT, T = 323 K and P = 1 bar). Representative snapshots illustrate the initial, intermediate, and final states as seen in the panels (a), (b) and (c) of Figure 11, respectively. Visual inspection (compare for example panel (c) of Figure 11 with panel (g) of Figure 2) demonstrates that in the final phase the caffeine molecules adopt positions which follow very closely the ones when caffeine is placed in the aqueous environment.
The caffeine spatial positioning, corresponding to equilibrium remains unchanged across the two placement patterns (in water and in the hydrophobic core of DPPC), as evidenced by the mass density profiles presented in panel (a) of Figure 12. The comparison demonstrates that caffeine resides consistently at the headgroup-tail interface, regardless of the initial positioning. This can also be confirmed from time dependent caffeine fraction plot for various distances along the membrane normal as seen in panel (b) of Figure 12. After 700 ns, the caffeine molecules lie in the range 0.5 < |z| ≤ 2 nm, i.e. adjacent to the headgroups for |z| ≤ 0.5 nm. The final caffeine partitioning when the molecules are placed in the DPPC core (panel (b) of Figure 12) is thus the same as when the molecules are dispersed in the aqueous environment (panel (c) of Figure 3).
The cluster analysis data as seen in panel (c) of Figure 12 clearly demonstrates the caffeine fraction in the largest cluster after energy minimization is the maximum possible including all molecules as these are placed in the form of a droplet inside the hydrophobic center. This fraction is significantly reduced to 0.54 after the 1ns-long NVT equilibration. The number of distinct clusters gradually increases with time when the initial droplet starts disintegrating till it reaches the equilibrium value at around 700 ns.
In parallel, when caffeine is placed as a droplet in the DPPC core its dispersion consistently elevates the Deuterium order parameter (panel (a) of Figure 13) in an almost identical way as the placement in the aqueous domain. Similarly, the placement pattern has no appreciable effect on the preferential alignment of the caffeine molecules parallel to the acyl chains as demonstrated by the data of panel (b) in Figure 13.
3.7. System Size Effect and Reproducibility
We also simulate a smaller system containing 128 DPPC and 25 caffeine molecules to study the system size effect while keeping all other simulation conditions unchanged. A smaller system is chosen instead of a larger one due to the significantly higher computational cost of larger systems and the need to access simulation times in the order of microsecond. The smaller system shows similar behavior, including aggregation, stacking, penetration, and gradual dispersion, as shown in Figure S3. The final mass density profile, orientation of caffeine, and deuterium order parameter of the DPPC also remain similar to those of the larger system (Figures S3–S5). However, as the total number of caffeine molecules is half compared to the original system the cluster size accordingly decreases leading consequently to a rapid dispersion phase.
To examine the effect of the initial configuration, we also perform two independent simulations for the original system size (256 DPPC and 50 caffeine molecules). In each simulation, caffeine molecules are randomly distributed in the aqueous phase, with independently randomized initial velocities. The corresponding results, provided in the supplementary information (Figures S3–S5), show no significant differences between the independent simulations. The cluster analysis, mass density profile, caffeine orientation, and deuterium order parameter of the DPPC show excellent agreement across the independent systems demonstrating the reproducibility of the simulations.
4. Conclusions
This study investigates the permeation process of caffeine in a solvated DPPC bilayer using united atom MD (2 µs) simulations. Caffeine molecules initially placed in the aqueous solution tend to form transient aggregates that rapidly evolve into ordered stacks, and partition into the membrane by roughly 200 ns. The nematic correlation function successfully captures the multilayer stacking, and the interplanar spacing between the caffeine planes are like those in aqueous and NaCl salt solutions [79,81,84]. During partitioning, the caffeine stack gradually fragments and reaches full dispersion by 800 ns. The dispersed phase remains stable throughout the simulation, and the caffeine molecules are located near the headgroup-acyl chain interface. The caffeine molecules are preferentially orient parallel to the acyl chains. The location and orientation are in good agreement with the previous simulation [32,33] and experimental results [34] for phosphatidylcholine lipids. We also carried out another simulation by placing the caffeine molecules in the hydrophobic core of the membrane, which eventually disperse and locate in the very identical position (near the headgroup-acyl chain interface) compared to the results of initially placed at the aqueous solution. The caffeine mass density profile and caffeine fraction show that the molecules do not tend to cross the hydrophobic, suggestive of the direct translocation through the membrane is unlikely.
The process of caffeine permeation temporarily reduces the bilayer thickness which recovers on equilibration. Concurrently, the surface area of the membrane swells up by ≈ 8% to accommodate the caffeine molecules. The presence of caffeine molecules causes membrane stiffening as evident by the increase in acyl chain ordering (characterized by SCD order parameter) near the hydrophilic part of the membrane, while the hydrophobic part remains unperturbed.
The location of caffeine molecules near the HG-AC interface suggests a free energy minimum inside the membrane, which is in qualitative agreement with the binding site predicted for selective antagonist ZM241385 [98] and for caffeine [99]. We note that, for both these antagonists, the primary binding site on A2A receptors are found to be inside the transmembrane region, though facilitated by intermediate binding site in the extracellular region of the cell. However, the present simulations do not include an explicit receptor environment and therefore do not address ligand–receptor binding or kinetics. Consequently, any connection between membrane localization and receptor interaction remains speculative and warrants further investigation using explicit receptor–membrane simulation models.
The established trends are reproducible as verified by conducting simulations on a smaller system and through two independent simulations differing in the initial velocities and placements of the caffeine molecules.
This study could aid the development of membrane-based drug delivery systems by providing a detailed molecular understanding of caffeine–DPPC interactions and their impact on bilayer structure and dynamics.
Supplementary Materials
The following supporting information can be downloaded at the website of this paper posted on Preprints.org. Figure S1: Deuterium order parameter for the sn-1 chain segment. Figure S2: Detailed representations of system snapshots at t = 0 (top left), 40 (top right), 75 (bottom left) and 2000 ns (bottom right) as obtained from the cluster analysis similar to Figure 4. Figure S3: System snapshots at various time instances for two new independent simulations (sim_2 and sim_3) for the same system size (256 DPPC with 50 caffeine molecules) and a smaller system size (128 DPPC with 25 caffeine molecules). Figure S4: Cluster analysis for the two independent simulations and the smaller system. Figure S5: Comparison Mass density profiles of caffeine molecules, tilt angles and deuterium order parameters for all the systems.
Author Contributions
S.R.: Conceptualization, Methodology, Validation, Formal analysis, Investigation; Methodology, Writing—review and editing, Supervision. S.D.: Software, Investigation, Data curation, Writing—original draft preparation. N.C.K.: Methodology, Formal analysis, Data curation, Investigation, writing—review and editing. All authors have read and agreed to the published version of the manuscript.
Funding
This research was funded by the projects “PID2021-127533NB-I00” of MICINN/FEDER (Minis-terio de Ciencia e Innovación, Fondo Europeo de Desarrollo Regional) and “Seeds Project-VRISEM25NK”, “Seeds Project-VRISEM26NK” and “D05DMF26” of UPM (Universidad Politécnica de Madrid).
Data Availability Statement
All raw data from the simulations reported here are available upon request.
Acknowledgments
Support through projects “PID2021-127533NB-I00” of MICINN/FEDER (Ministerio de Ciencia e Innovación, Fondo Europeo de Desarrollo Regional) and “Seeds Project-VRISEM25NK”, “Seeds Project-VRISEM26NK” and “D05DMF26” of UPM (Universidad Politécnica de Madrid) is deeply appreciated. N.C.K. gratefully acknowledges the Universidad Politécnica de Madrid (www.upm.es) for providing computing resources on the Magerit Supercomputer. Fruitful discussions with Daniel Martínez-Fernandez, Katerina Foteinopoulou, Zhou Wan, Paawan C and Fernando Monson are deeply appreciated.
Conflicts of Interest
The authors declare no conflicts of interest.
Abbreviations
The following abbreviations are used in this manuscript:
| DPPC | 1,2-dipalmitoyl-sn-glycero-3-phosphocholine |
| MD | molecular dynamics |
| CNS | central nervous system; |
| HCC | Hepatocellular carcinoma |
| CKD | chronic kidney disease |
| BLF | glycoprotein bovine lactoferrin |
| DODAB | dioctadecyldimethylammonium bromide |
| QENS | Quasielastic neutron scattering; |
| ADME | absorption, distribution, metabolism, and excretion |
| POPG | palmitoyl-2-oleoylphosphatidylglycerol |
| DOPC | 1,2-dioleoyl-sn-glycero-3-phosphocholine |
| PMF | potential of mean force |
| POPC | 1-Palmitoyl-2-oleoyl-sn-glycero-3-phosphocholine |
| ATB | Automated Force Field Topology Builder |
| VMD | Visual Molecular Dynamics |
| PME | particle-mesh Ewald |
| PC | phosphatidylcholine |
| C.o.M. | center-of-mass |
| HG-AC | headgroup–acyl chain |
| DFT | DFT, Density Functional Theory |
| APL | Area per lipid |
| SCD | Deuterium order parameter |
References
- Martinotti, C.; Ruiz-Perez, L.; Deplazes, E.; Mancera, R. L. Molecular Dynamics Simulation of Small Molecules Interacting with Biological Membranes. In Wiley-VCH Verlag; 17 Jul 2020. [Google Scholar] [CrossRef] [PubMed]
- Di Meo, F.; et al. , In silico pharmacology: Drug membrane partitioning and crossing. Pharmacol. Res. 2016, vol. 111, 471–486. [Google Scholar] [CrossRef] [PubMed]
- Kopec̈, W.; Telenius, J.; Khandelia, H. Molecular dynamics simulations of the interactions of medicinal plant extracts and drugs with lipid bilayer membranes. FEBS J. 2013, vol. 280(no. 12), 2785–2805. [Google Scholar] [CrossRef] [PubMed]
- Smith. Caffeine; 2005. [Google Scholar] [CrossRef]
- Romero-Martínez, S.; et al. , Possible Beneficial Actions of Caffeine in SARS-CoV-2. Int. J. Mol. Sci. 2021, vol. 22(no. 11). [Google Scholar] [CrossRef] [PubMed]
- Bawornruttanaboonya, K.; Chindapan, N.; Devahastin, S. Numerical Investigation of Conventional and Ultrasound-Assisted Aqueous Extraction of Caffeine from Whole Green Robusta Coffee Beans: Extraction Enhancement via Changing of Extraction Water. Foods 2025, vol. 14(no. 11), 1956. [Google Scholar] [CrossRef]
- Di Pietrantonio, D.; Pace Palitti, V.; Cichelli, A.; Tacconelli, S. Protective Effect of Caffeine and Chlorogenic Acids of Coffee in Liver Disease. Foods 2024, Vol. 13, Page 2280, vol. 13(no. 14), 2280. [Google Scholar] [CrossRef] [PubMed]
- Hsu, C. W.; Wang, C. S.; Chiu, T. H. Caffeine and a selective adenosine A2A receptor antagonist induce sensitization and cross-sensitization behavior associated with increased striatal dopamine in mice. J. Biomed. Sci. 2010, vol. 17(no. 1), 4. [Google Scholar] [CrossRef] [PubMed]
- Do, H. N.; Akhter, S.; Miao, Y. “Pathways and Mechanism of Caffeine Binding to Human Adenosine A2A Receptor,” Front. Mol. Biosci. 2021, vol. 8. [Google Scholar] [CrossRef] [PubMed]
- López-Cruz, L.; Salamone, J. D.; Correa, M. Caffeine and selective adenosine receptor antagonists as new therapeutic tools for the motivational symptoms of depression. Front. Pharmacol. 2018, vol. 9, no. JUN, 353416. [Google Scholar] [CrossRef]
- Ruggiero, M.; Calvello, R.; Porro, C.; Messina, G.; Cianciulli, A.; Panaro, M. A. Neurodegenerative Diseases: Can Caffeine Be a Powerful Ally to Weaken Neuroinflammation? 2022, MDPI. [Google Scholar] [CrossRef] [PubMed]
- Gaascht, F.; Dicato, M.; Diederich, M. Coffee provides a natural multitarget pharmacopeia against the hallmarks of cancer. Genes Nutr. 2015, vol. 10(no. 6), 1–17. [Google Scholar] [CrossRef] [PubMed]
- Elzupir, O. Caffeine and caffeine-containing pharmaceuticals as promising inhibitors for 3-chymotrypsin-like protease of SARS-CoV-2. J. Biomol. Struct. Dyn. 2022, vol. 40(no. 5), 2113–2120. [Google Scholar] [CrossRef] [PubMed]
- Saraiva, S. M.; Jacinto, T. A.; Gonçalves, A. C.; Gaspar, D.; Silva, L. R. Overview of Caffeine Effects on Human Health and Emerging Delivery Strategies. Pharm. 2023 2023, Vol. 16, Page 1067, vol. 16(no. 8), 1067. [Google Scholar] [CrossRef] [PubMed]
- Yuan, S.; Larsson, S. C. Coffee and Caffeine Consumption and Risk of Kidney Stones: A Mendelian Randomization Study. Am. J. Kidney Dis. 2022, vol. 79(no. 1), 9–14.e1. [Google Scholar] [CrossRef] [PubMed]
- Kanlaya, R.; Subkod, C.; Nanthawuttiphan, S.; Thongboonkerd, V. Caffeine causes cell cycle arrest at G0/G1 and increases of ubiquitinated proteins, ATP and mitochondrial membrane potential in renal cells. Comput. Struct. Biotechnol. J. 2023, vol. 21, 4552–4566. [Google Scholar] [CrossRef] [PubMed]
- Srithongkul, T.; Ungprasert, P. Coffee Consumption is Associated with a Decreased Risk of Incident Chronic Kidney Disease: A Systematic Review and Meta-analysis of Cohort Studies. Eur. J. Intern. Med. 2020, vol. 77, 111–116. [Google Scholar] [CrossRef] [PubMed]
- Heath, R. D.; Brahmbhatt, M.; Tahan, A. C.; Ibdah, J. A.; Tahan, V. Coffee: The magical bean for liver diseases. World J. Hepatol. 2017, vol. 9(no. 15), 689–696. [Google Scholar] [CrossRef] [PubMed]
- Li, Z.; et al. Molecular insight into binding behavior of caffeine with lactoferrin: Spectroscopic, molecular docking, and simulation study. J. Dairy Sci. 2023, vol. 106(no. 12), 8249–8261. [Google Scholar] [CrossRef] [PubMed]
- Alao, J. P.; Kumar, J.; Stamataki, D.; Rallis, C. Dissecting the cell cycle regulation, DNA damage sensitivity and lifespan effects of caffeine in fission yeast. Microb. Cell 2025, vol. 12(no. 1), 141–156. [Google Scholar] [CrossRef] [PubMed]
- Lin, Z.; Wei, J.; Hu, Y.; Pi, D.; Jiang, M.; Lang, T. Caffeine Synthesis and Its Mechanism and Application by Microbial Degradation, A Review. Foods 2023 2023, Vol. 12, Page 2721, vol. 12(no. 14), 2721. [Google Scholar] [CrossRef] [PubMed]
- Rodak, K.; Kokot, I.; Kratz, E. M. Caffeine as a factor influencing the functioning of the human body—friend or foe? Nutrients 2021, vol. 13(no. 9). [Google Scholar] [CrossRef] [PubMed]
- Musgrave, F.; Farrington, R. L.; Hoban, C.; Byard, R. W. Caffeine toxicity in forensic practice: possible effects and under-appreciated sources. Forensic Sci. Med. Pathol. 2016, vol. 12(no. 3), 299–303. [Google Scholar] [CrossRef] [PubMed]
- Yan, Y.; et al. Molecular view of the interactions between the amphiphilic drug propranolol hydrochloride and model lipid membranes. J. Colloid Interface Sci. 2026, vol. 708, 139814. [Google Scholar] [CrossRef] [PubMed]
- Sharma, V. K.; Srinivasan, H.; García Sakai, V.; Mitra, S. Caffeine modulates the dynamics of DODAB membranes: Role of the physical state of the bilayer. arXiv Soft Condens. Matter 2020, vol. 128(no. 15). [Google Scholar] [CrossRef]
- Sharifian Gh, M. Recent Experimental Developments in Studying Passive Membrane Transport of Drug Molecules. Mol. Pharm. 2021, vol. 18(no. 6), 2122–2141. [Google Scholar] [CrossRef] [PubMed]
- Alves, C.; Ribeiro, D.; Nunes, C.; Reis, S. Biophysics in cancer: The relevance of drug-membrane interaction studies. Biochim. Et. Biophys. Acta (BBA) -Biomembr. 2016, vol. 1858(no. 9), 2231–2244. [Google Scholar] [CrossRef] [PubMed]
- Li, H.; Zhao, T.; Sun, Z. Analytical techniques and methods for study of drug-lipid membrane interactions. Rev. Anal. Chem. 2018, vol. 37(no. 1). [Google Scholar] [CrossRef]
- Xu, Y.; Yushmanov, V. E.; Tang, P. NMR Studies of Drug Interaction with Membranes and Membrane-Associated Proteins. Biosci. Rep. 2002, vol. 22(no. 2), 175–196. [Google Scholar] [CrossRef] [PubMed]
- Seddon, M.; et al. Drug interactions with lipid membranes. 2009, vol. 38(no. 9). [Google Scholar] [CrossRef] [PubMed]
- Peetla; Stine, A.; Labhasetwar, V. reviews Biophysical Interactions with Model Lipid Membranes : Applications in Drug Discovery and Drug Delivery 2009, no. 4, 8053–8058.
- Paloncýová, M.; Berka, K.; Otyepka, M. Molecular insight into affinities of drugs and their metabolites to lipid bilayers. J. Phys. Chem. B 2013, vol. 117(no. 8), 2403–2410. [Google Scholar] [CrossRef] [PubMed]
- Paloncýová, M.; Devane, R.; Murch, B.; Berka, K.; Otyepka, M. Amphiphilic drug-like molecules accumulate in a membrane below the head group region. J. Phys. Chem. B 2014, vol. 118(no. 4), 1030–1039. [Google Scholar] [CrossRef] [PubMed]
- Khondker, et al. Partitioning of caffeine in lipid bilayers reduces membrane fluidity and increases membrane thickness. Phys. Chem. Chem. Phys. 2017, vol. 19(no. 10), 7101–7111. [Google Scholar] [CrossRef] [PubMed]
- Tavagnacco, L.; Corucci, G.; Gerelli, Y. Interaction of Caffeine with Model Lipid Membranes. J. Phys. Chem. B 2021, vol. 125(no. 36), 10174–10181. [Google Scholar] [CrossRef]
- Tavagnacco, L.; Schnupf, U.; Mason, P. E.; Saboungi, M. L.; Cesàro, A.; Brady, J. W. Molecular Dynamics Simulation Studies of Caffeine Aggregation in Aqueous Solution. J. Phys. Chem. B 2011, vol. 115(no. 37), 10957. [Google Scholar] [CrossRef] [PubMed]
- Tavagnacco, L.; Di Fonzo, S.; D’Amico, F.; Masciovecchio, C.; Brady, J. W.; Cesàro, A. Stacking of purines in water: the role of dipolar interactions in caffeine. Phys. Chem. Chem. Phys. 2016, vol. 18(no. 19), 13478–13486. [Google Scholar] [CrossRef] [PubMed]
- Tavagnacco, L.; Gerelli, Y.; Cesàro, A.; Brady, J. W. Stacking and Branching in Self-Aggregation of Caffeine in Aqueous Solution: From the Supramolecular to Atomic Scale Clustering. J. Phys. Chem. B 2016, vol. 120(no. 37), 9987–9996. [Google Scholar] [CrossRef] [PubMed]
- Das, S.; Karayiannis, N. C.; Roy, S. DPPC Membrane Under Lateral Compression and Stretching to Extreme Limits: Phase Transitions and Rupture. Membranes . 2025, vol. 15(no. 6), 161. [Google Scholar] [CrossRef]
- Kitjanon; Nisoh, N.; Phongphanphanee, S.; Chattham, N.; Karttunen, M.; Wong-ekkabut, J. Dispersion of Hydrophilic Nanoparticles in Natural Rubber with Phospholipids. Polymers . 2024, vol. 16(no. 20). [Google Scholar] [CrossRef] [PubMed]
- Guo, X. Y.; Peschel, C.; Watermann, T.; von Rudorff, G. F.; Sebastiani, D. Cluster formation of polyphilic molecules solvated in a DPPC bilayer. Polymers . 2017, vol. 9(no. 10). [Google Scholar] [CrossRef] [PubMed]
- Przybyłek, M.; et al. , Molecular Insights into the Interactions Between Human Serum Albumin and Phospholipid Membranes. Appl. Sci. 2024, vol. 14(no. 24). [Google Scholar] [CrossRef]
- Yin, Q.; Shi, X.; Ding, H.; Dai, X.; Wan, G.; Qiao, Y. Interactions of borneol with DPPC phospholipid membranes: A molecular dynamics simulation study. Int. J. Mol. Sci. 2014, vol. 15(no. 11), 20365–20381. [Google Scholar] [CrossRef] [PubMed]
- Neupane, S.; Cordoyiannis, G.; Renner, F. U.; Losada-Pérez, P. Real-Time monitoring of interactions between solid-supported lipid vesicle layers and shortand medium-chain length alcohols: Ethanol and 1-pentanol. Biomimetics 2019, vol. 4(no. 1). [Google Scholar] [CrossRef] [PubMed]
- Dai, Y.; Xie, Z.; Liang, L. Pore Formation Mechanism of A-Beta Peptide on the Fluid Membrane: A Combined Coarse-Grained and All-Atomic Model. Molecules 2022, vol. 27(no. 12). [Google Scholar] [CrossRef] [PubMed]
- Van Der Spoel, D.; Lindahl, E.; Hess, B.; Groenhof, G.; Mark, A. E.; Berendsen, H. J. C. GROMACS: Fast, flexible, and free; Dec 2005. [Google Scholar] [CrossRef] [PubMed]
- Berger; Edholm, O.; Jähnig, F. Molecular dynamics simulations of a fluid bilayer of dipalmitoylphosphatidylcholine at full hydration, constant pressure, and constant temperature. Biophys. J. vol. 72(no. 5), 2002–2013, 1997. [CrossRef] [PubMed]
- Kasparyan, G.; Hub, J. S. Molecular Simulations Reveal the Free Energy Landscape and Transition State of Membrane Electroporation. Phys. Rev. Lett. 2024, vol. 132(no. 14). [Google Scholar] [CrossRef] [PubMed]
- Filipe, H. A. L.; Loura, L. M. S.; Moreno, M. J. Permeation of a Homologous Series of NBD-Labeled Fatty Amines through Lipid Bilayers: A Molecular Dynamics Study. Membranes . 2023, vol. 13(no. 6). [Google Scholar] [CrossRef] [PubMed]
- Rossos, G.; Hadjikakou, S. K.; Kourkoumelis, N. Molecular dynamics simulation of 2-benzimidazolyl-urea with dppc lipid membrane and comparison with a copper(Ii) complex derivative. Membranes . 2021, vol. 11(no. 10). [Google Scholar] [CrossRef] [PubMed]
- Capelli, R.; Gardin, A.; Empereur-Mot, C.; Doni, G.; Pavan, G. M. A Data-Driven Dimensionality Reduction Approach to Compare and Classify Lipid Force Fields. J. Phys. Chem. B 2021, vol. 125(no. 28), 7785–7796. [Google Scholar] [CrossRef] [PubMed]
- Cordomí; Caltabiano, G.; Pardo, L. Membrane protein simulations using AMBER force field and Berger lipid parameters. J. Chem. Theory Comput. 2012, vol. 8(no. 3), 948–958. [Google Scholar] [CrossRef] [PubMed]
- Zeng, S.; Chen, J.; Wang, X.; Zhou, G.; Chen, L.; Dai, C. Selective Transport through the Ultrashort Carbon Nanotubes Embedded in Lipid Bilayers. J. Phys. Chem. C 2018, vol. 122(no. 48), 27681–27688. [Google Scholar] [CrossRef]
- Chen, et al. Encapsulation and Release of Drug Molecule Pregabalin Based on Ultrashort Single-Walled Carbon Nanotubes. J. Phys. Chem. C 2019, vol. 123(no. 14), 9567–9574. [Google Scholar] [CrossRef]
- Chen, J.; Zhou, G.; Chen, L.; Wang, Y.; Wang, X.; Zeng, S. Interaction of Graphene and its Oxide with Lipid Membrane: A Molecular Dynamics Simulation Study. J. Phys. Chem. C 2016, vol. 120(no. 11), 6225–6231. [Google Scholar] [CrossRef]
- Polvat, T.; et al. The potential mechanism of methamphetamine-induced mitochondrial dysfunction and cell degeneration via direct permeation across mitochondrial membranes: The study on molecular dynamics simulations and in vitro model. Food Chem. Toxicol. 2025, vol. 206. [Google Scholar] [CrossRef] [PubMed]
- Schmid, N.; et al. Definition and testing of the GROMOS force-field versions 54A7 and 54B7. Eur. Biophys. J. 2011, vol. 40(no. 7), 843–856. [Google Scholar] [CrossRef] [PubMed]
- Pedersen, B.; et al. The Martini 3 Lipidome: Expanded and Refined Parameters Improve Lipid Phase Behavior. ACS Cent. Sci. 2025, vol. 11(no. 9), 1598–1610. [Google Scholar] [CrossRef] [PubMed]
- Marrink, S. J.; Risselada, H. J.; Yefimov, S.; Tieleman, D. P.; De Vries, A. H. The MARTINI Force Field: Coarse Grained Model for Biomolecular Simulations. J. Phys. Chem. B 2007, vol. 111(no. 27), 7812–7824. [Google Scholar] [CrossRef] [PubMed]
- Shinoda, W.; Devane, R.; Klein, M. L. Multi-property fitting and parameterization of a coarse grained model for aqueous surfactants. Mol. Simul. 2007, vol. 33(no. 1–2), 27–36. [Google Scholar] [CrossRef]
- Wu, J.; Mukherji, D. Comparison of all atom and united atom models for thermal transport calculations of amorphous polyethylene. Comput. Mater. Sci. 2022, vol. 211, 111539. [Google Scholar] [CrossRef]
- Oliveira, P.; Gonçalves, Y. M. H.; Ol Gheta, S. K.; Rieder, S. R.; Horta, B. A. C.; Hünenberger, P. H. Comparison of the United- and All-Atom Representations of (Halo)alkanes Based on Two Condensed-Phase Force Fields Optimized against the Same Experimental Data Set. J. Chem. Theory Comput. 2022, vol. 18(no. 11), 6757–6778. [Google Scholar] [CrossRef] [PubMed]
- Harrison, J. A.; Schall, J. D.; Maskey, S.; Mikulski, P. T.; Knippenberg, M. T.; Morrow, B. H. Review of force fields and intermolecular potentials used in atomistic computational materials research. Appl. Phys. Rev. 2018, vol. 5(no. 3). [Google Scholar] [CrossRef]
- Humphrey, W.; Dalke, A.; Schulten, K. VMD - Visual Molecular Dynamics. In J. Molec. Graphics; 1996. [Google Scholar]
- Marrink, S. J.; Berger, O.; Tieleman, P.; Jähnig, F. Adhesion forces of lipids in a phospholipid membrane studied by molecular dynamics simulations. Biophys. J. 1998, vol. 74 no. 2 Pt 1, 931. [Google Scholar] [CrossRef] [PubMed]
- Nagle, J. F.; Tristram-Nagle, S. Structure of lipid bilayers. Biochim. Biophys. Acta 2000, vol. 1469(no. 3), 159. [Google Scholar] [CrossRef] [PubMed]
- Berendsen, H. J. C.; Postma, J. P. M.; van Gunsteren, W. F.; Hermans, J. Interaction Models for Water in Relation to Protein Hydration; 1981; pp. 331–342. [Google Scholar] [CrossRef]
- Hess, B.; Bekker, H.; Berendsen, H. J. C.; Fraaije, J. G. E. M. LINCS: A linear constraint solver for molecular simulations. J. Comput. Chem. 1997, vol. 18(no. 12), 1463–1472. [Google Scholar] [CrossRef]
- Darden, T.; York, D.; Pedersen, L. Particle mesh Ewald: An N·log(N) method for Ewald sums in large systems. J. Chem. Phys. 1993, vol. 98(no. 12), 10089–10092. [Google Scholar] [CrossRef]
- Nosé, S. A unified formulation of the constant temperature molecular dynamics methods. J. Chem. Phys. 1984, vol. 81(no. 1), 511–519. [Google Scholar] [CrossRef]
- Nosé, S. A molecular dynamics method for simulations in the canonical ensemble. Mol. Phys. 1984, vol. 52(no. 2), 255–268. [Google Scholar] [CrossRef]
- Hoover, W. G. Canonical dynamics: Equilibrium phase-space distributions. Phys. Rev. A (Coll. Park) . 1985, vol. 31(no. 3), 1695. [Google Scholar] [CrossRef] [PubMed]
- Parrinello; Rahman, A. Polymorphic transitions in single crystals: A new molecular dynamics method. J. Appl. Phys. 1981, vol. 52(no. 12), 7182–7190. [Google Scholar] [CrossRef]
- Nosé, S.; Klein, M. L. Constant pressure molecular dynamics for molecular systems. Mol. Phys. 1983, vol. 50(no. 5), 1055–1076. [Google Scholar] [CrossRef]
- Malde, K.; et al. An Automated force field Topology Builder (ATB) and repository: Version 1.0. J. Chem. Theory Comput. 2011, vol. 7(no. 12), 4026–4037. [Google Scholar] [CrossRef] [PubMed]
- Koziara, K. B.; Stroet, M.; Malde, A. K.; Mark, A. E. Testing and validation of the Automated Topology Builder (ATB) version 2.0: Prediction of hydration free enthalpies. J. Comput. Aided. Mol. Des. 2014, vol. 28(no. 3), 221–233. [Google Scholar] [CrossRef] [PubMed]
- Stroet, M.; Caron, B.; Visscher, K. M.; Geerke, D. P.; Malde, A. K.; Mark, A. E. Automated topology builder version 3.0: prediction of solvation free enthalpies in water and hexane. J. Chem. Theory Comput. 2018, vol. 14(no. 11), 5834–5845. [Google Scholar] [CrossRef] [PubMed]
- Herranz, M.; Pedrosa, C.; Martínez-Fernández, D.; Foteinopoulou, K.; Karayiannis, N. C.; Laso, M. Fine-tuning of colloidal polymer crystals by molecular simulation. Phys. Rev. E 2023, vol. 107(no. 6), 064605. [Google Scholar] [CrossRef] [PubMed]
- Senthilnithy, R.; Weerasingha, M. S. S.; Dissanayake, D. P. Interaction of caffeine dimers with water molecules. Comput. Theor. Chem. 2014, vol. 1028, 60–64. [Google Scholar] [CrossRef]
- Vraneš, M.; Borović, T. T.; Drid, P.; Trivić, T.; Tomaš, R.; Janković, N. Influence of Sodium Salicylate on Self-Aggregation and Caffeine Solubility in Water—A New Hypothesis from Experimental and Computational Data. Pharmaceutics 2022, vol. 14(no. 11), 2304. [Google Scholar] [CrossRef]
- Gutierrez, M. P. S.; Jimenez, E. G.; Deriabina, A.; Perez, J. C. S.; Poltev, V. Reproduction of experimental data for stacked caffeine dimers using various computational methods. Sci. Rep. 2024, vol. 14(no. 1). [Google Scholar] [CrossRef] [PubMed]
- Wilson, M. R. Determination of order parameters in realistic atom-based models of liquid crystal systems. J. Mol. Liq. 1996, vol. 68(no. 1), 23–31. [Google Scholar] [CrossRef]
- Roy, S.; Chen, Y. L. Rich phase transitions in strongly confined polymer-nanoparticle mixtures: Nematic ordering, crystallization, and liquid-liquid phase separation. J. Chem. Phys. 2021, vol. 154(no. 2). [Google Scholar] [CrossRef]
- Sharma, B.; Paul, S. Effects of dilute aqueous NaCl solution on caffeine aggregation. J. Chem. Phys. 2013, vol. 139(no. 19). [Google Scholar] [CrossRef] [PubMed]
- Sun, D.; et al. Assessing the Perturbing Effects of Drugs on Lipid Bilayers Using Gramicidin Channel-Based in Silico and in Vitro Assays. J. Med. Chem. 2020, vol. 63(no. 20), 11809–11818. [Google Scholar] [CrossRef] [PubMed]
- Peyear, T. A.; Andersen, O. S. Screening for bilayer-active and likely cytotoxic molecules reveals bilayer-mediated regulation of cell function. J. General. Physiol. 2023, vol. 155(no. 4). [Google Scholar] [CrossRef] [PubMed]
- Grage, S. L.; Afonin, S.; Kara, S.; Buth, G.; Ulrich, A. S. Membrane thinning and thickening induced by membrane-active amphipathic peptides. Front. Cell Dev. Biol. 2016, vol. 4, no. JUN. [Google Scholar] [CrossRef] [PubMed]
- Shinoda, W.; Okazaki, S. A Voronoi analysis of lipid area fluctuation in a bilayer. J. Chem. Phys. 1998, vol. 109(no. 4), 1517–1521. [Google Scholar] [CrossRef]
- Michaud-Agrawal; Denning, E. J.; Woolf, T. B.; Beckstein, O. MDAnalysis: a toolkit for the analysis of molecular dynamics simulations. J. Comput. Chem. 2011, vol. 32(no. 10), 2319–2327. [Google Scholar] [CrossRef] [PubMed]
- Gowers, R. J.; et al. MDAnalysis: A Python Package for the Rapid Analysis of Molecular Dynamics Simulations. 2016. Available online: http://mdanalysis.org.
- Hunter, J. D. Matplotlib: A 2D graphics environment. Comput. Sci. Eng. 2007, vol. 9(no. 3), 90–95. [Google Scholar] [CrossRef]
- Welcome to Python.org. Available online: https://www.python.org/ (accessed on 21 May 2026).
- Huang, C. hsien; Mason, J. T. Structure and properties of mixed-chain phospholipid assemblies. Biochim. Et. Biophys. Acta (BBA) -Rev. Biomembr. 1986, vol. 864(no. 3–4), 423–470. [Google Scholar] [CrossRef] [PubMed]
- Goto, M.; Ishida, S.; Tamai, N.; Matsuki, H.; Kaneshina, S. Chain asymmetry alters thermotropic and barotropic properties of phospholipid bilayer membranes. Chem. Phys. Lipids 2009, vol. 161(no. 2), 65–76. [Google Scholar] [CrossRef] [PubMed]
- Vermeer, L. S.; De Groot, B. L.; Réat, V.; Milon, A.; Czaplicki, J. Acyl chain order parameter profiles in phospholipid bilayers: computation from molecular dynamics simulations and comparison with 2H NMR experiments. Eur. Biophys. J. 2007, vol. 36(no. 8), 919–931. [Google Scholar] [CrossRef] [PubMed]
- Róg, T.; Girych, M.; Bunker, A. Mechanistic understanding from molecular dynamics in pharmaceutical research 2: Lipid membrane in drug design. Pharmaceuticals 2021, vol. 14(no. 10). [Google Scholar] [CrossRef] [PubMed]
- Chen, J.; Chen, L.; Wang, Y.; Wang, X.; Zeng, S. Exploring the Effects on Lipid Bilayer Induced by Noble Gases via Molecular Dynamics Simulations. Sci. Rep. 2015, 2015 5:1, vol. 5(no. 1), 17235. [Google Scholar] [CrossRef] [PubMed]
- Jaakola, V. P.; et al. The 2.6 angstrom crystal structure of a human A2A adenosine receptor bound to an antagonist. Science 2008, vol. 322(no. 5905), 1211–1217. [Google Scholar] [CrossRef] [PubMed]
- Do, H. N.; Akhter, S.; Miao, Y. “Pathways and Mechanism of Caffeine Binding to Human Adenosine A2A Receptor,” Front. Mol. Biosci. 2021, vol. 8, 673170. [Google Scholar] [CrossRef]
Figure 1.
(a) A DPPC molecule with two acyl chains (sn-1 and sn-2) is shown in CPK representation with the carbon, oxygen, nitrogen and phosphorus atoms colored in cyan, red, blue and brown respectively. (b) A caffeine molecule is shown in CPK representation with carbon, oxygen, hydrogen, nitrogen colored in cyan, red, grey and blue respectively. (c) The complete DPPC-caffeine system after energy minimization. The aqueous solution is represented as a transparent surface. DPPC molecules are represented as orange lines and caffeine atoms are shown as blue spheres in CPK representation for visual clarity. The above color schemes and representations will be followed throughout the manuscript except if otherwise stated. Image created with the VMD software.
Figure 1.
(a) A DPPC molecule with two acyl chains (sn-1 and sn-2) is shown in CPK representation with the carbon, oxygen, nitrogen and phosphorus atoms colored in cyan, red, blue and brown respectively. (b) A caffeine molecule is shown in CPK representation with carbon, oxygen, hydrogen, nitrogen colored in cyan, red, grey and blue respectively. (c) The complete DPPC-caffeine system after energy minimization. The aqueous solution is represented as a transparent surface. DPPC molecules are represented as orange lines and caffeine atoms are shown as blue spheres in CPK representation for visual clarity. The above color schemes and representations will be followed throughout the manuscript except if otherwise stated. Image created with the VMD software.
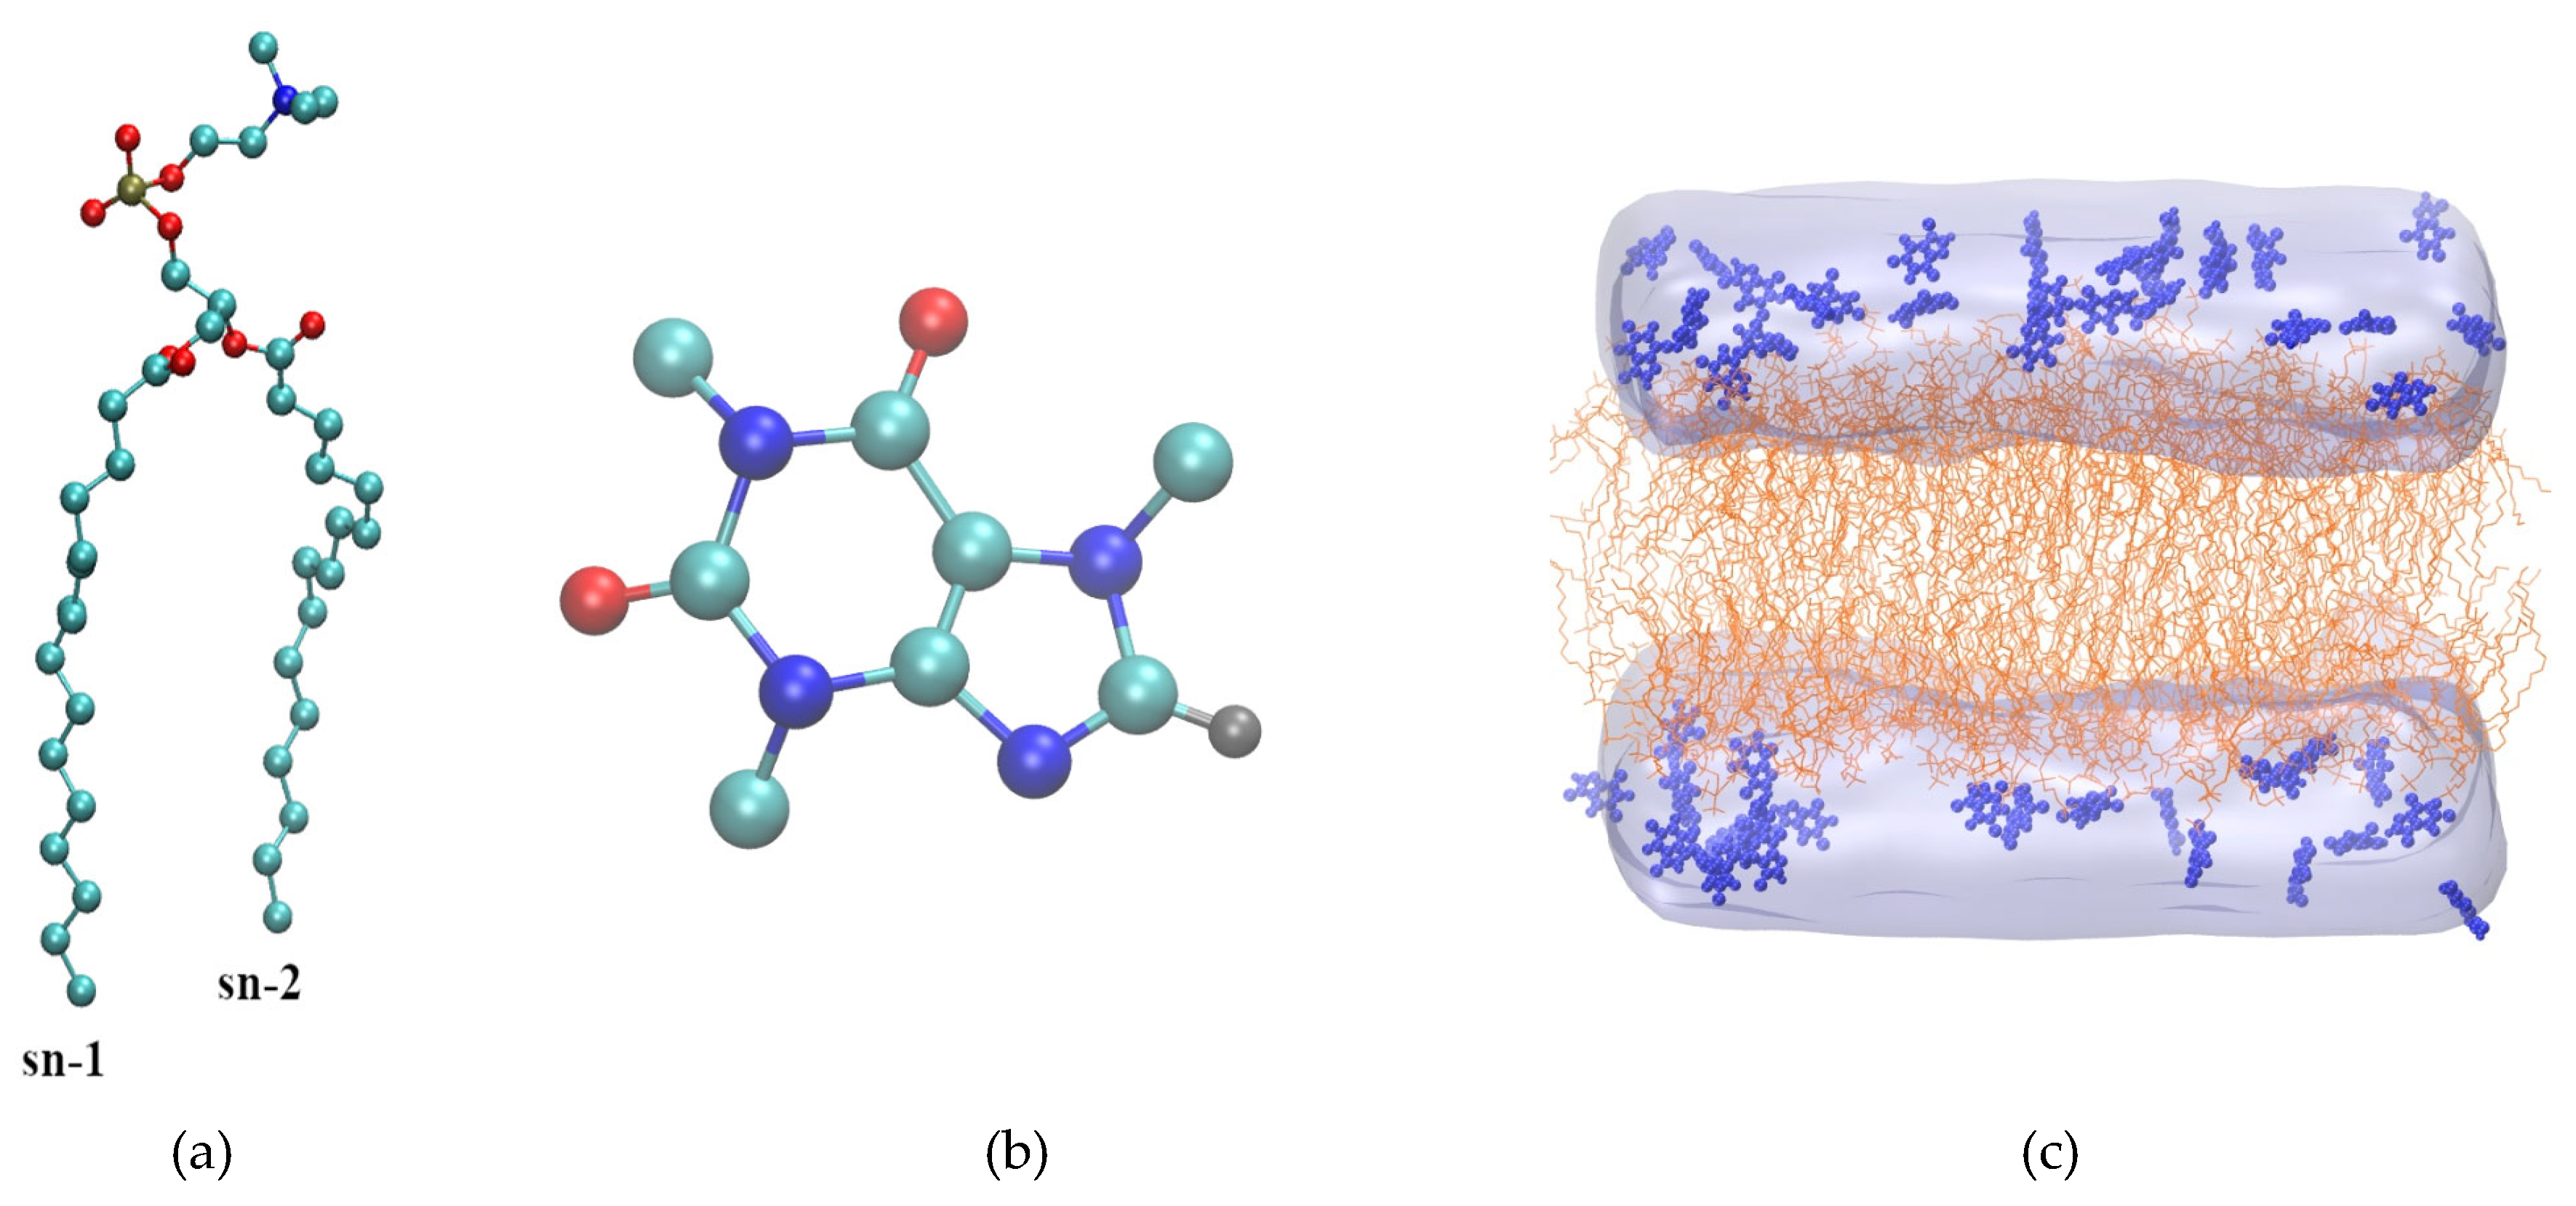
Figure 2.
System configurations at various time instances during the NPT MD simulation. (Top) From left to right (panels a-e): t = 0 (initial configuration as obtained from the 1 ns NVT MD equilibration), 40, 75, 143 and 200 ns; (Bottom) From left to right (panels f-j): t = 300, 400, 600, 800 and 2000 ns (end of simulation).
Figure 2.
System configurations at various time instances during the NPT MD simulation. (Top) From left to right (panels a-e): t = 0 (initial configuration as obtained from the 1 ns NVT MD equilibration), 40, 75, 143 and 200 ns; (Bottom) From left to right (panels f-j): t = 300, 400, 600, 800 and 2000 ns (end of simulation).
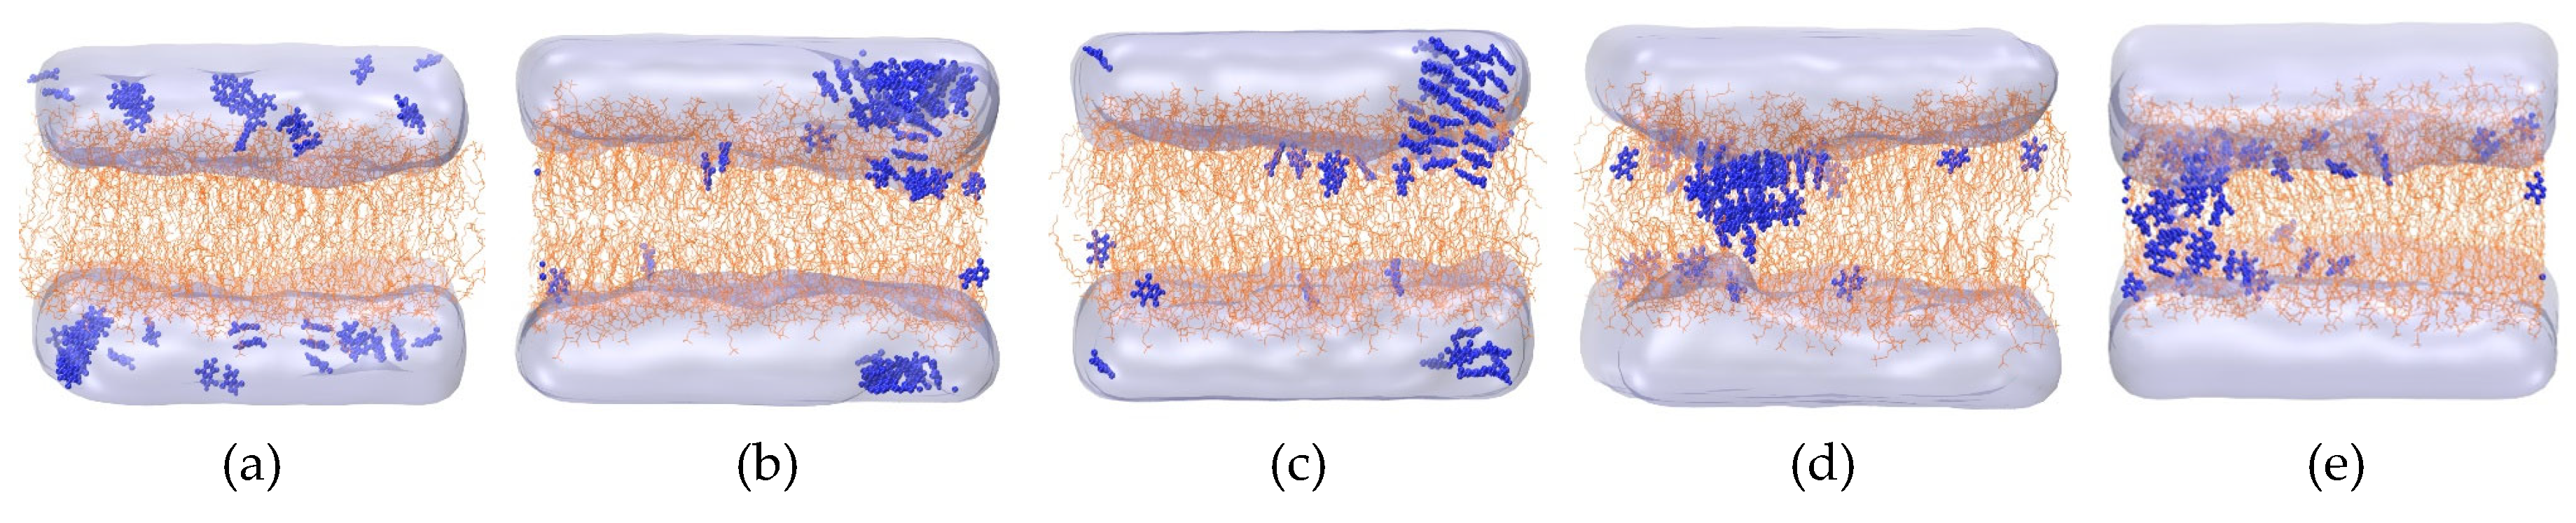

Figure 3.
(a) Mass density profile for the center of mass of caffeine molecules, the head groups (HG) (pure DPPC system in navy blue and Caffeine + DPPC in purple) and acyl chains (AC) for caffeine + DPPC system (olive) and of water (orange). The HG, AC and water profiles correspond to the last part of the simulation (800 – 2000ns). Different profile curves for caffeine (lines with filled circle symbols) correspond to different time intervals, including the initial equilibration NVT simulation. (b) Mass density profile focusing exclusively on the caffeine molecules. The vertical purple and olive dashed-dotted lines mark the peaks of the HG and AC mass density profiles, respectively, as identified in panel (a). The peaks correspond to the last part of the simulation: 800 – 2000 ns for the current caffeine-DPPC system and last 400 ns for the pure DPPC system from our previous study[39]. (c) schematic of the DPPC membrane + water system being portioned into three regions: aqueous (|z| ≥ 2 nm), interfacial mixed (0.5nm ≤ |z| ≤ 2 nm), and hydrophobic membrane core (|z| ≤ 0.5 nm). The grey and blue planes define the transitions between the different regions. (d) Caffeine fraction as a function of time in aqueous, interfacial and core regions as identified in panel (c). Thick and thin lines correspond to running average and instantaneous values, respectively. The blue dot-dashed vertical lines are placed at t = 40, 75, 200, 400 and 800 ns to indicate the distinct permeation phases. .
Figure 3.
(a) Mass density profile for the center of mass of caffeine molecules, the head groups (HG) (pure DPPC system in navy blue and Caffeine + DPPC in purple) and acyl chains (AC) for caffeine + DPPC system (olive) and of water (orange). The HG, AC and water profiles correspond to the last part of the simulation (800 – 2000ns). Different profile curves for caffeine (lines with filled circle symbols) correspond to different time intervals, including the initial equilibration NVT simulation. (b) Mass density profile focusing exclusively on the caffeine molecules. The vertical purple and olive dashed-dotted lines mark the peaks of the HG and AC mass density profiles, respectively, as identified in panel (a). The peaks correspond to the last part of the simulation: 800 – 2000 ns for the current caffeine-DPPC system and last 400 ns for the pure DPPC system from our previous study[39]. (c) schematic of the DPPC membrane + water system being portioned into three regions: aqueous (|z| ≥ 2 nm), interfacial mixed (0.5nm ≤ |z| ≤ 2 nm), and hydrophobic membrane core (|z| ≤ 0.5 nm). The grey and blue planes define the transitions between the different regions. (d) Caffeine fraction as a function of time in aqueous, interfacial and core regions as identified in panel (c). Thick and thin lines correspond to running average and instantaneous values, respectively. The blue dot-dashed vertical lines are placed at t = 40, 75, 200, 400 and 800 ns to indicate the distinct permeation phases. .
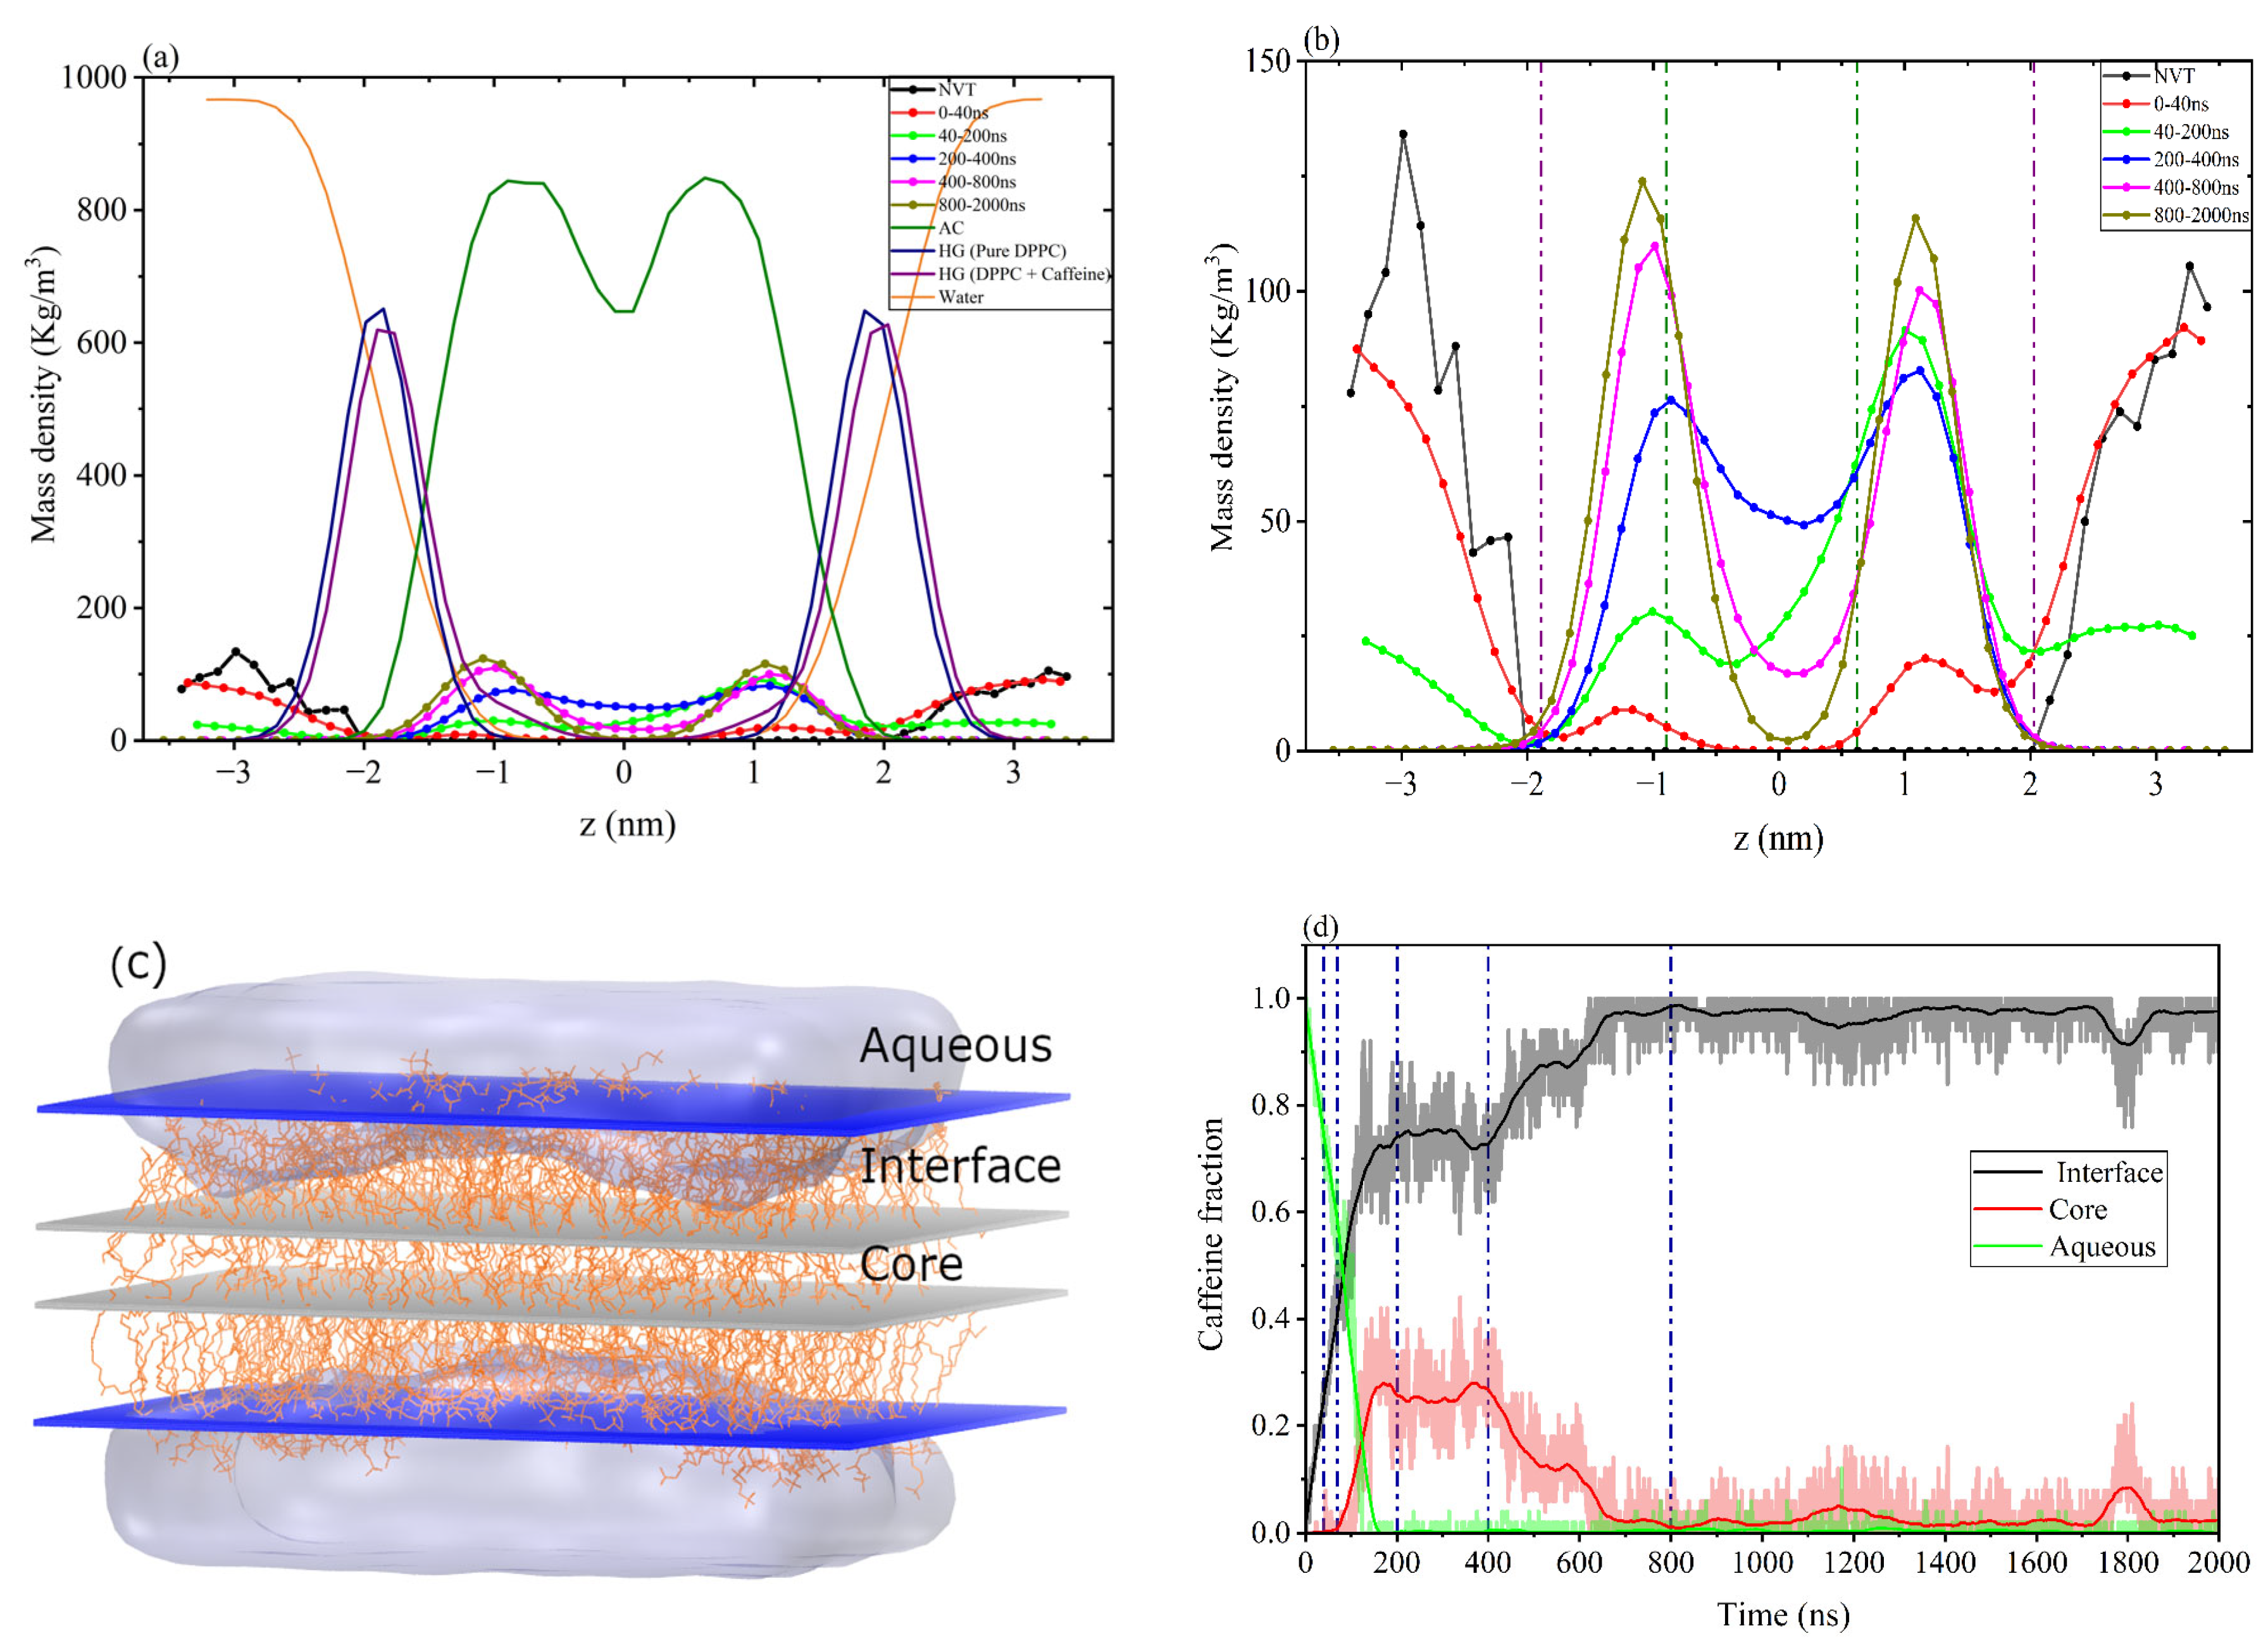
Figure 4.
Caffeine clustering and stacking process during membrane permeation. The water and DPPC are purposefully hidden to increase the clarity of the formed clusters. (a) Configuration after energy minimization. Caffeine molecules belonging to the largest cluster are shown by green-coloured spheres and rest of the molecules are in yellow spheres. The small blue spheres are the nitrogen (N) atoms of the DPPC headgroups. (b) Maximum size of cluster for t = 40 ns, (c) Ordered cluster (caffeine stacking) at t = 75 ns, (d) Dispersion of caffeine molecules near the headgroups of both leaflets at the end of the simulation (t = 2000 ns). .
Figure 4.
Caffeine clustering and stacking process during membrane permeation. The water and DPPC are purposefully hidden to increase the clarity of the formed clusters. (a) Configuration after energy minimization. Caffeine molecules belonging to the largest cluster are shown by green-coloured spheres and rest of the molecules are in yellow spheres. The small blue spheres are the nitrogen (N) atoms of the DPPC headgroups. (b) Maximum size of cluster for t = 40 ns, (c) Ordered cluster (caffeine stacking) at t = 75 ns, (d) Dispersion of caffeine molecules near the headgroups of both leaflets at the end of the simulation (t = 2000 ns). .
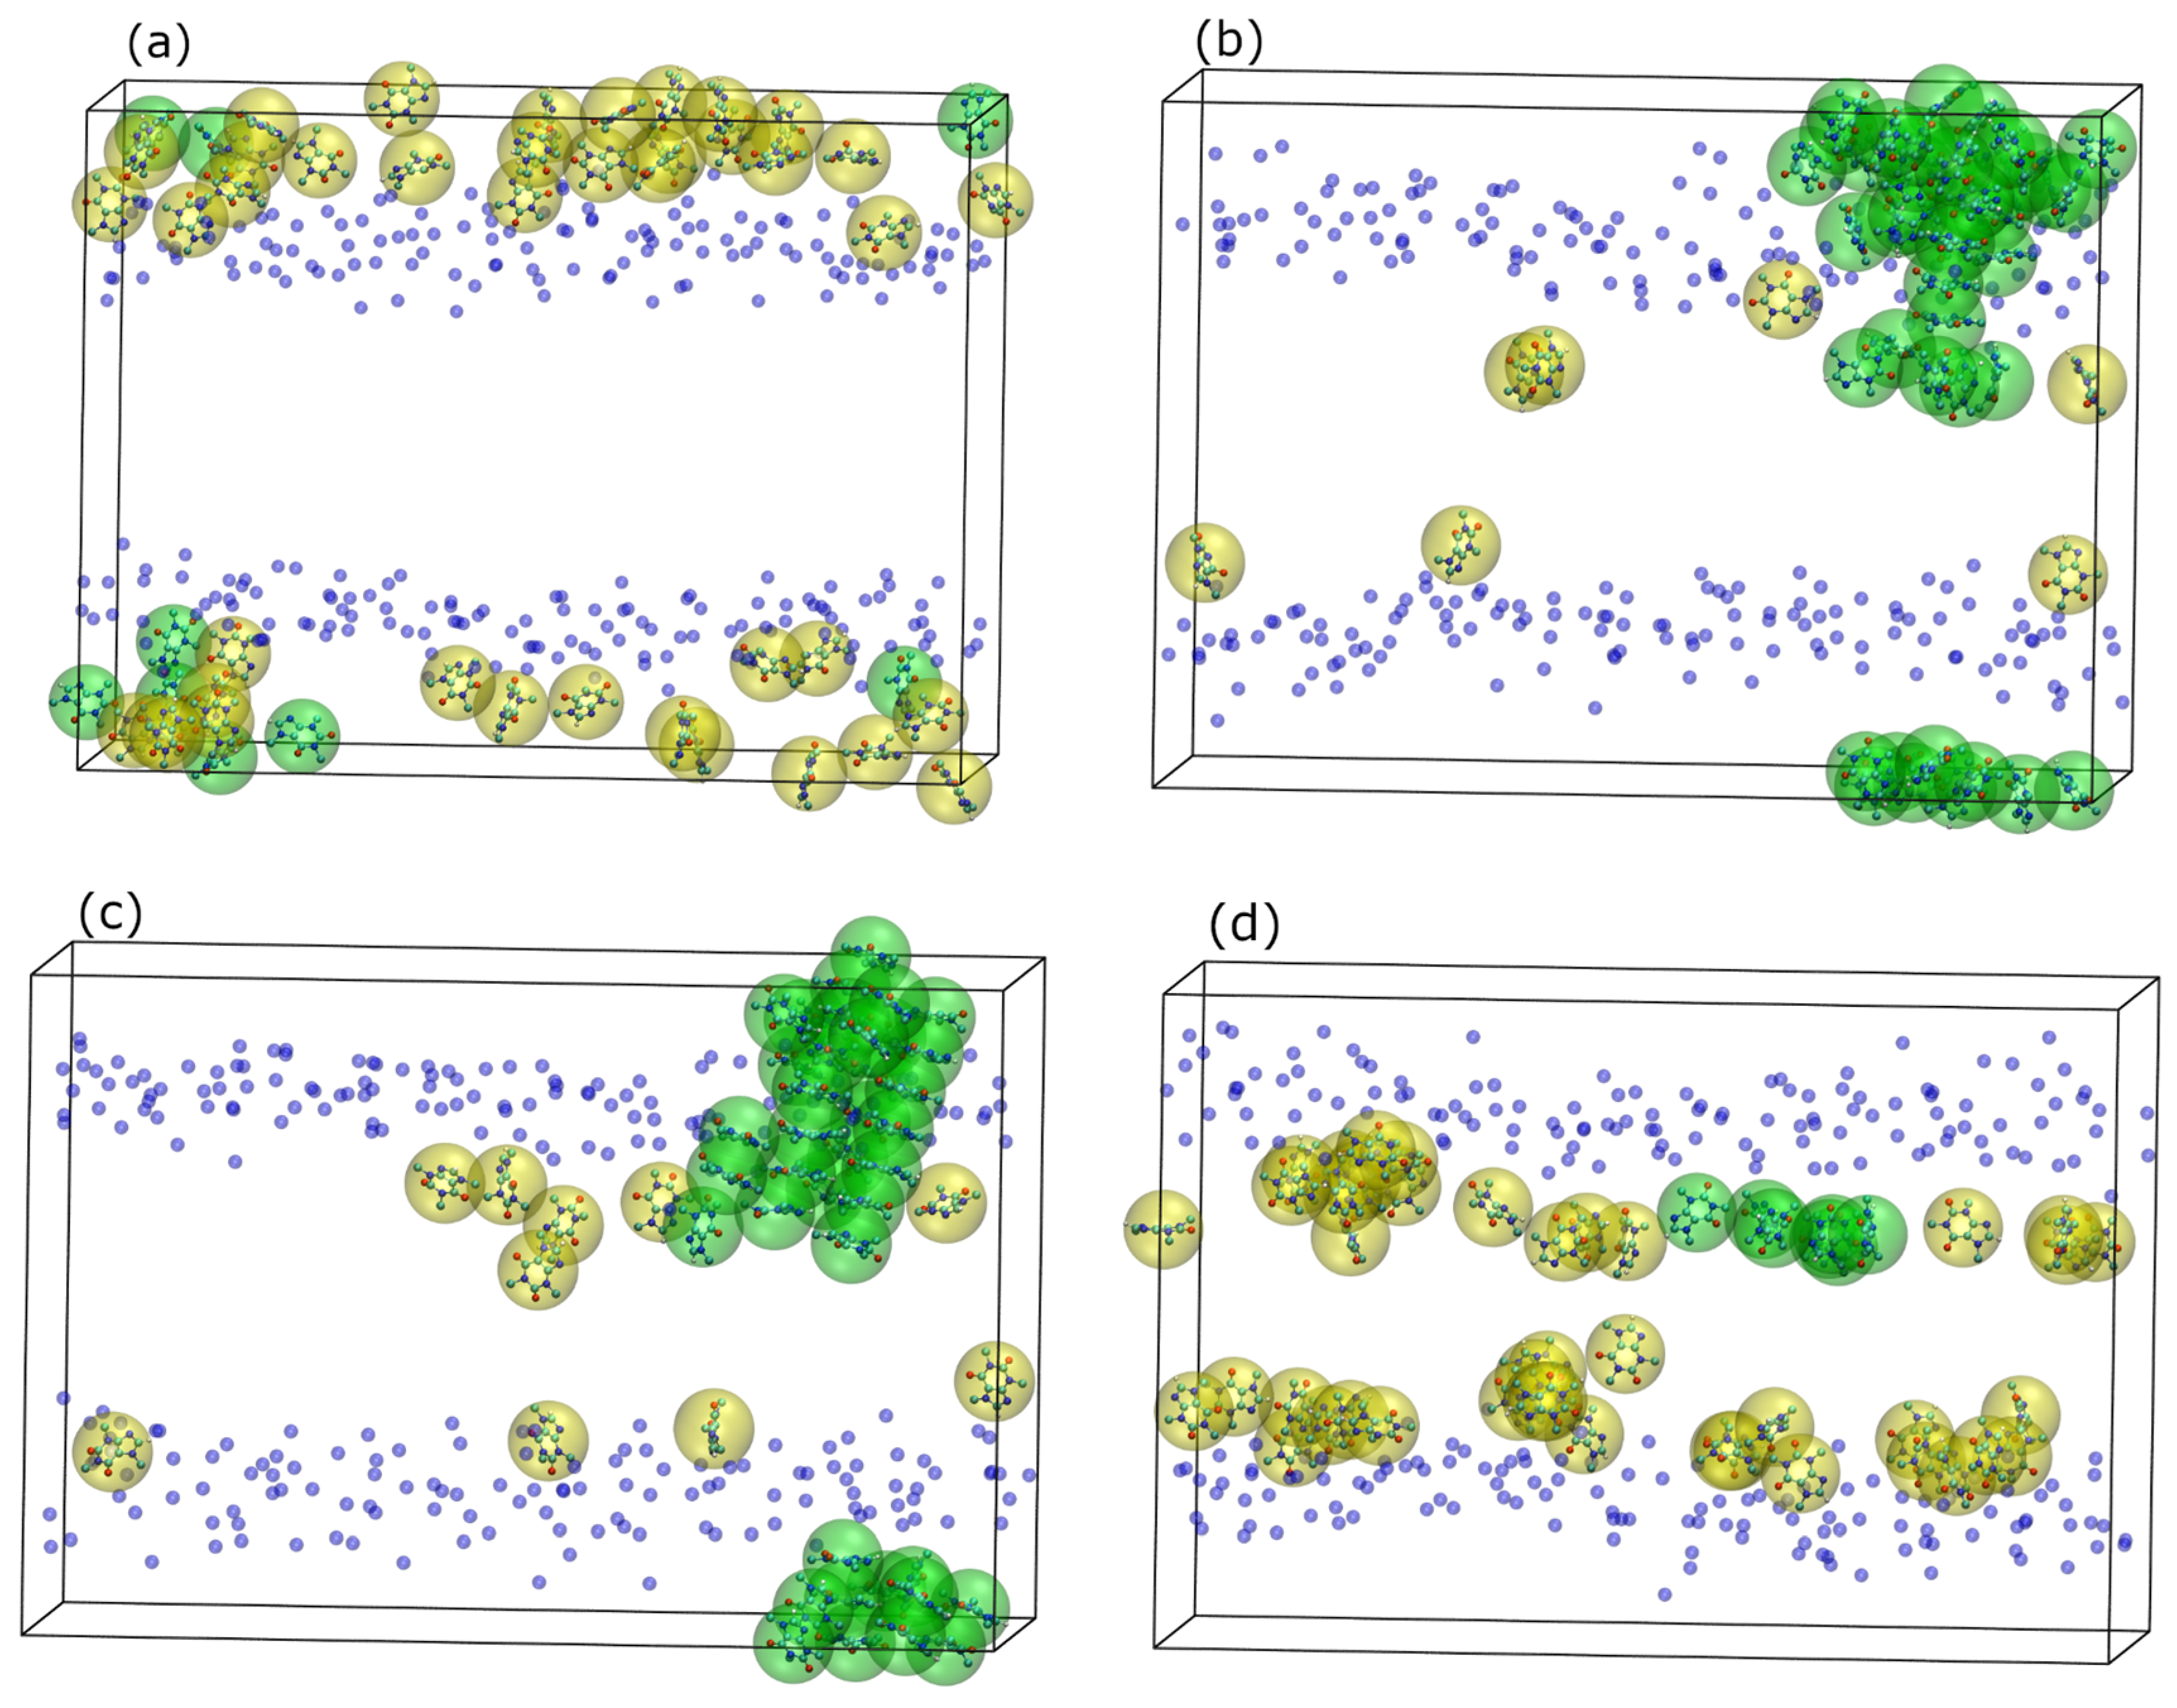
Figure 5.
(a) Number of distinct clusters (black line, left y-axis), nclust, and caffeine fraction in the largest cluster (red line, right y-axis), fLC, as a function of time. Thin and thick lines correspond to instantaneous and running average values, respectively. Asterisk and square symbols denote the cluster data as extracted from the system configuration after energy minimization and the 1ns-long equilibration NVT MD simulation, respectively. (b) Same as in panel (a) focusing on a narrower initial time range. (c) Probability distribution of cluster size (measured in fraction of caffeine molecules), ϕcaf at different time instances. (d) Same as in panel (c) but excluding the clusters of size 1 (i.e. individual caffeine molecules). The blue dot-dashed vertical lines are placed at t = 40, 75, 200, 400 and 800 ns to indicate the distinct permeation phases.
Figure 5.
(a) Number of distinct clusters (black line, left y-axis), nclust, and caffeine fraction in the largest cluster (red line, right y-axis), fLC, as a function of time. Thin and thick lines correspond to instantaneous and running average values, respectively. Asterisk and square symbols denote the cluster data as extracted from the system configuration after energy minimization and the 1ns-long equilibration NVT MD simulation, respectively. (b) Same as in panel (a) focusing on a narrower initial time range. (c) Probability distribution of cluster size (measured in fraction of caffeine molecules), ϕcaf at different time instances. (d) Same as in panel (c) but excluding the clusters of size 1 (i.e. individual caffeine molecules). The blue dot-dashed vertical lines are placed at t = 40, 75, 200, 400 and 800 ns to indicate the distinct permeation phases.
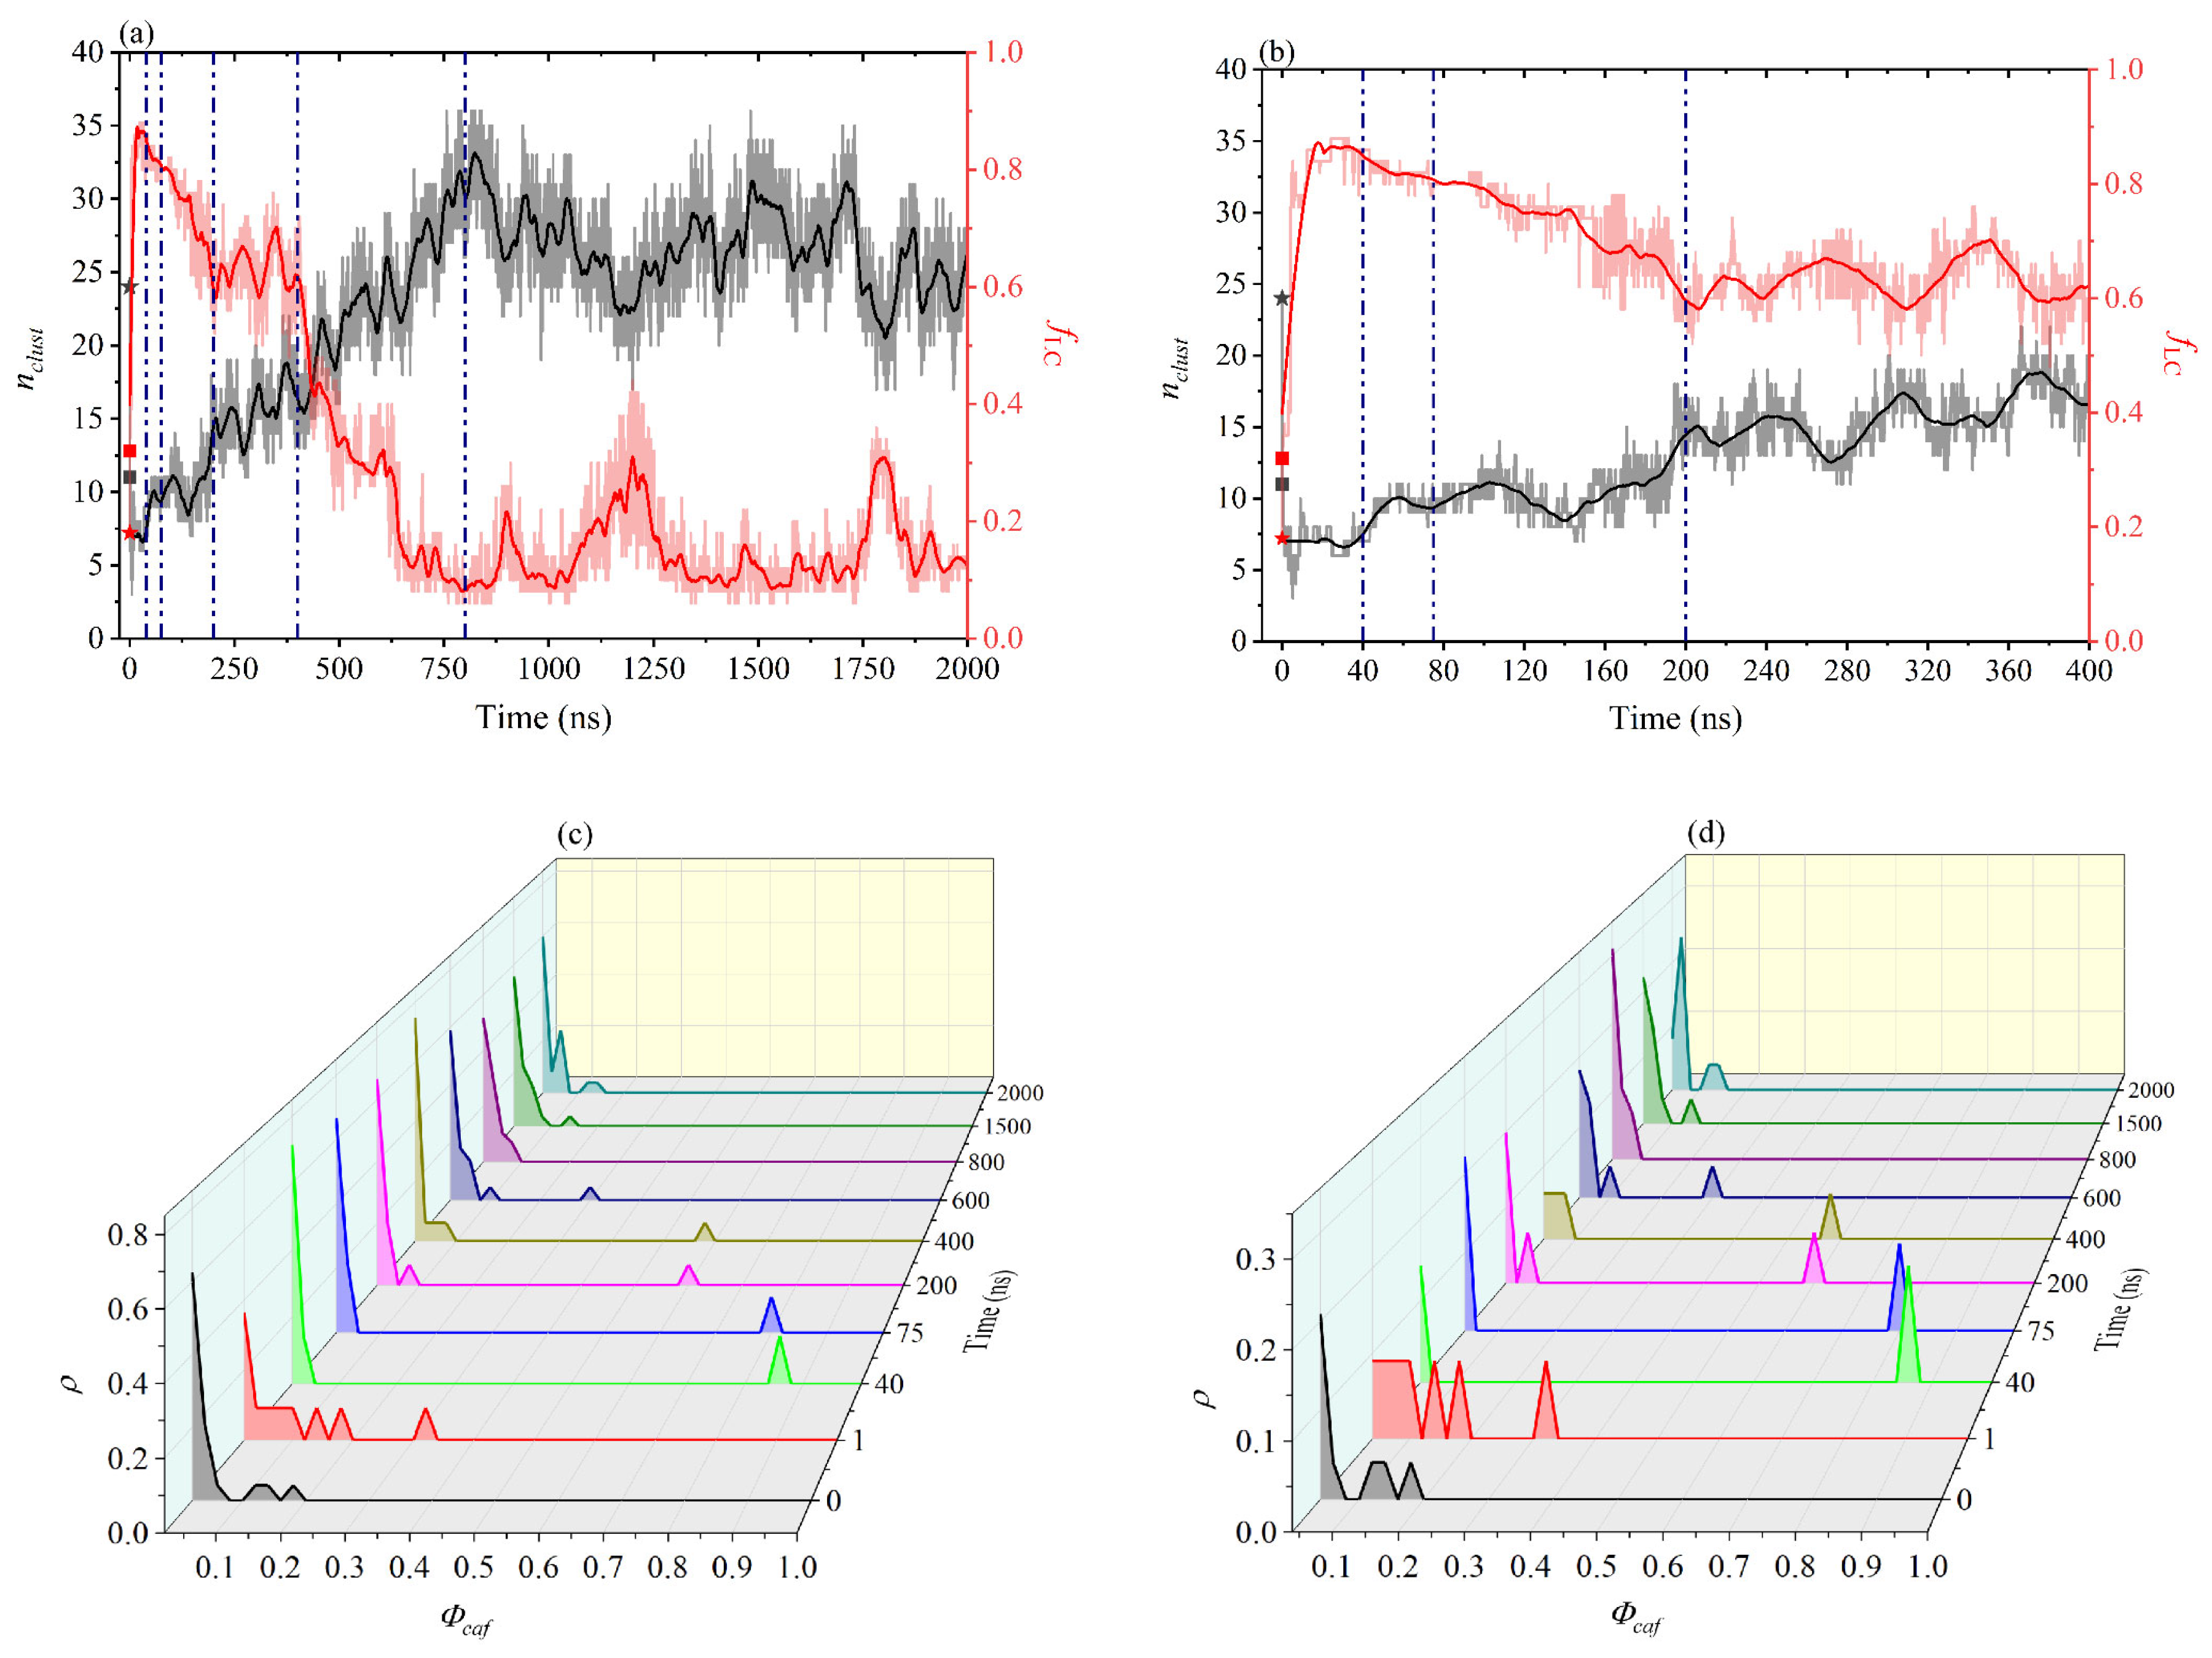
Figure 6.
(a) Schematic representation of the caffeine molecules where the orange arrows drawn correspond to the vectors connecting carbon pairs C6 – C7 and C6 – C8. The cyan arrow corresponds to the vector normal to the plane defined by the C6 – C7 and C6 – C8 vectors. (b) Probability distribution of caffeine tilt angle at various time intervals. (c) Nematic correlation function of caffeine molecules belonging to the largest cluster at various time intervals.
Figure 6.
(a) Schematic representation of the caffeine molecules where the orange arrows drawn correspond to the vectors connecting carbon pairs C6 – C7 and C6 – C8. The cyan arrow corresponds to the vector normal to the plane defined by the C6 – C7 and C6 – C8 vectors. (b) Probability distribution of caffeine tilt angle at various time intervals. (c) Nematic correlation function of caffeine molecules belonging to the largest cluster at various time intervals.
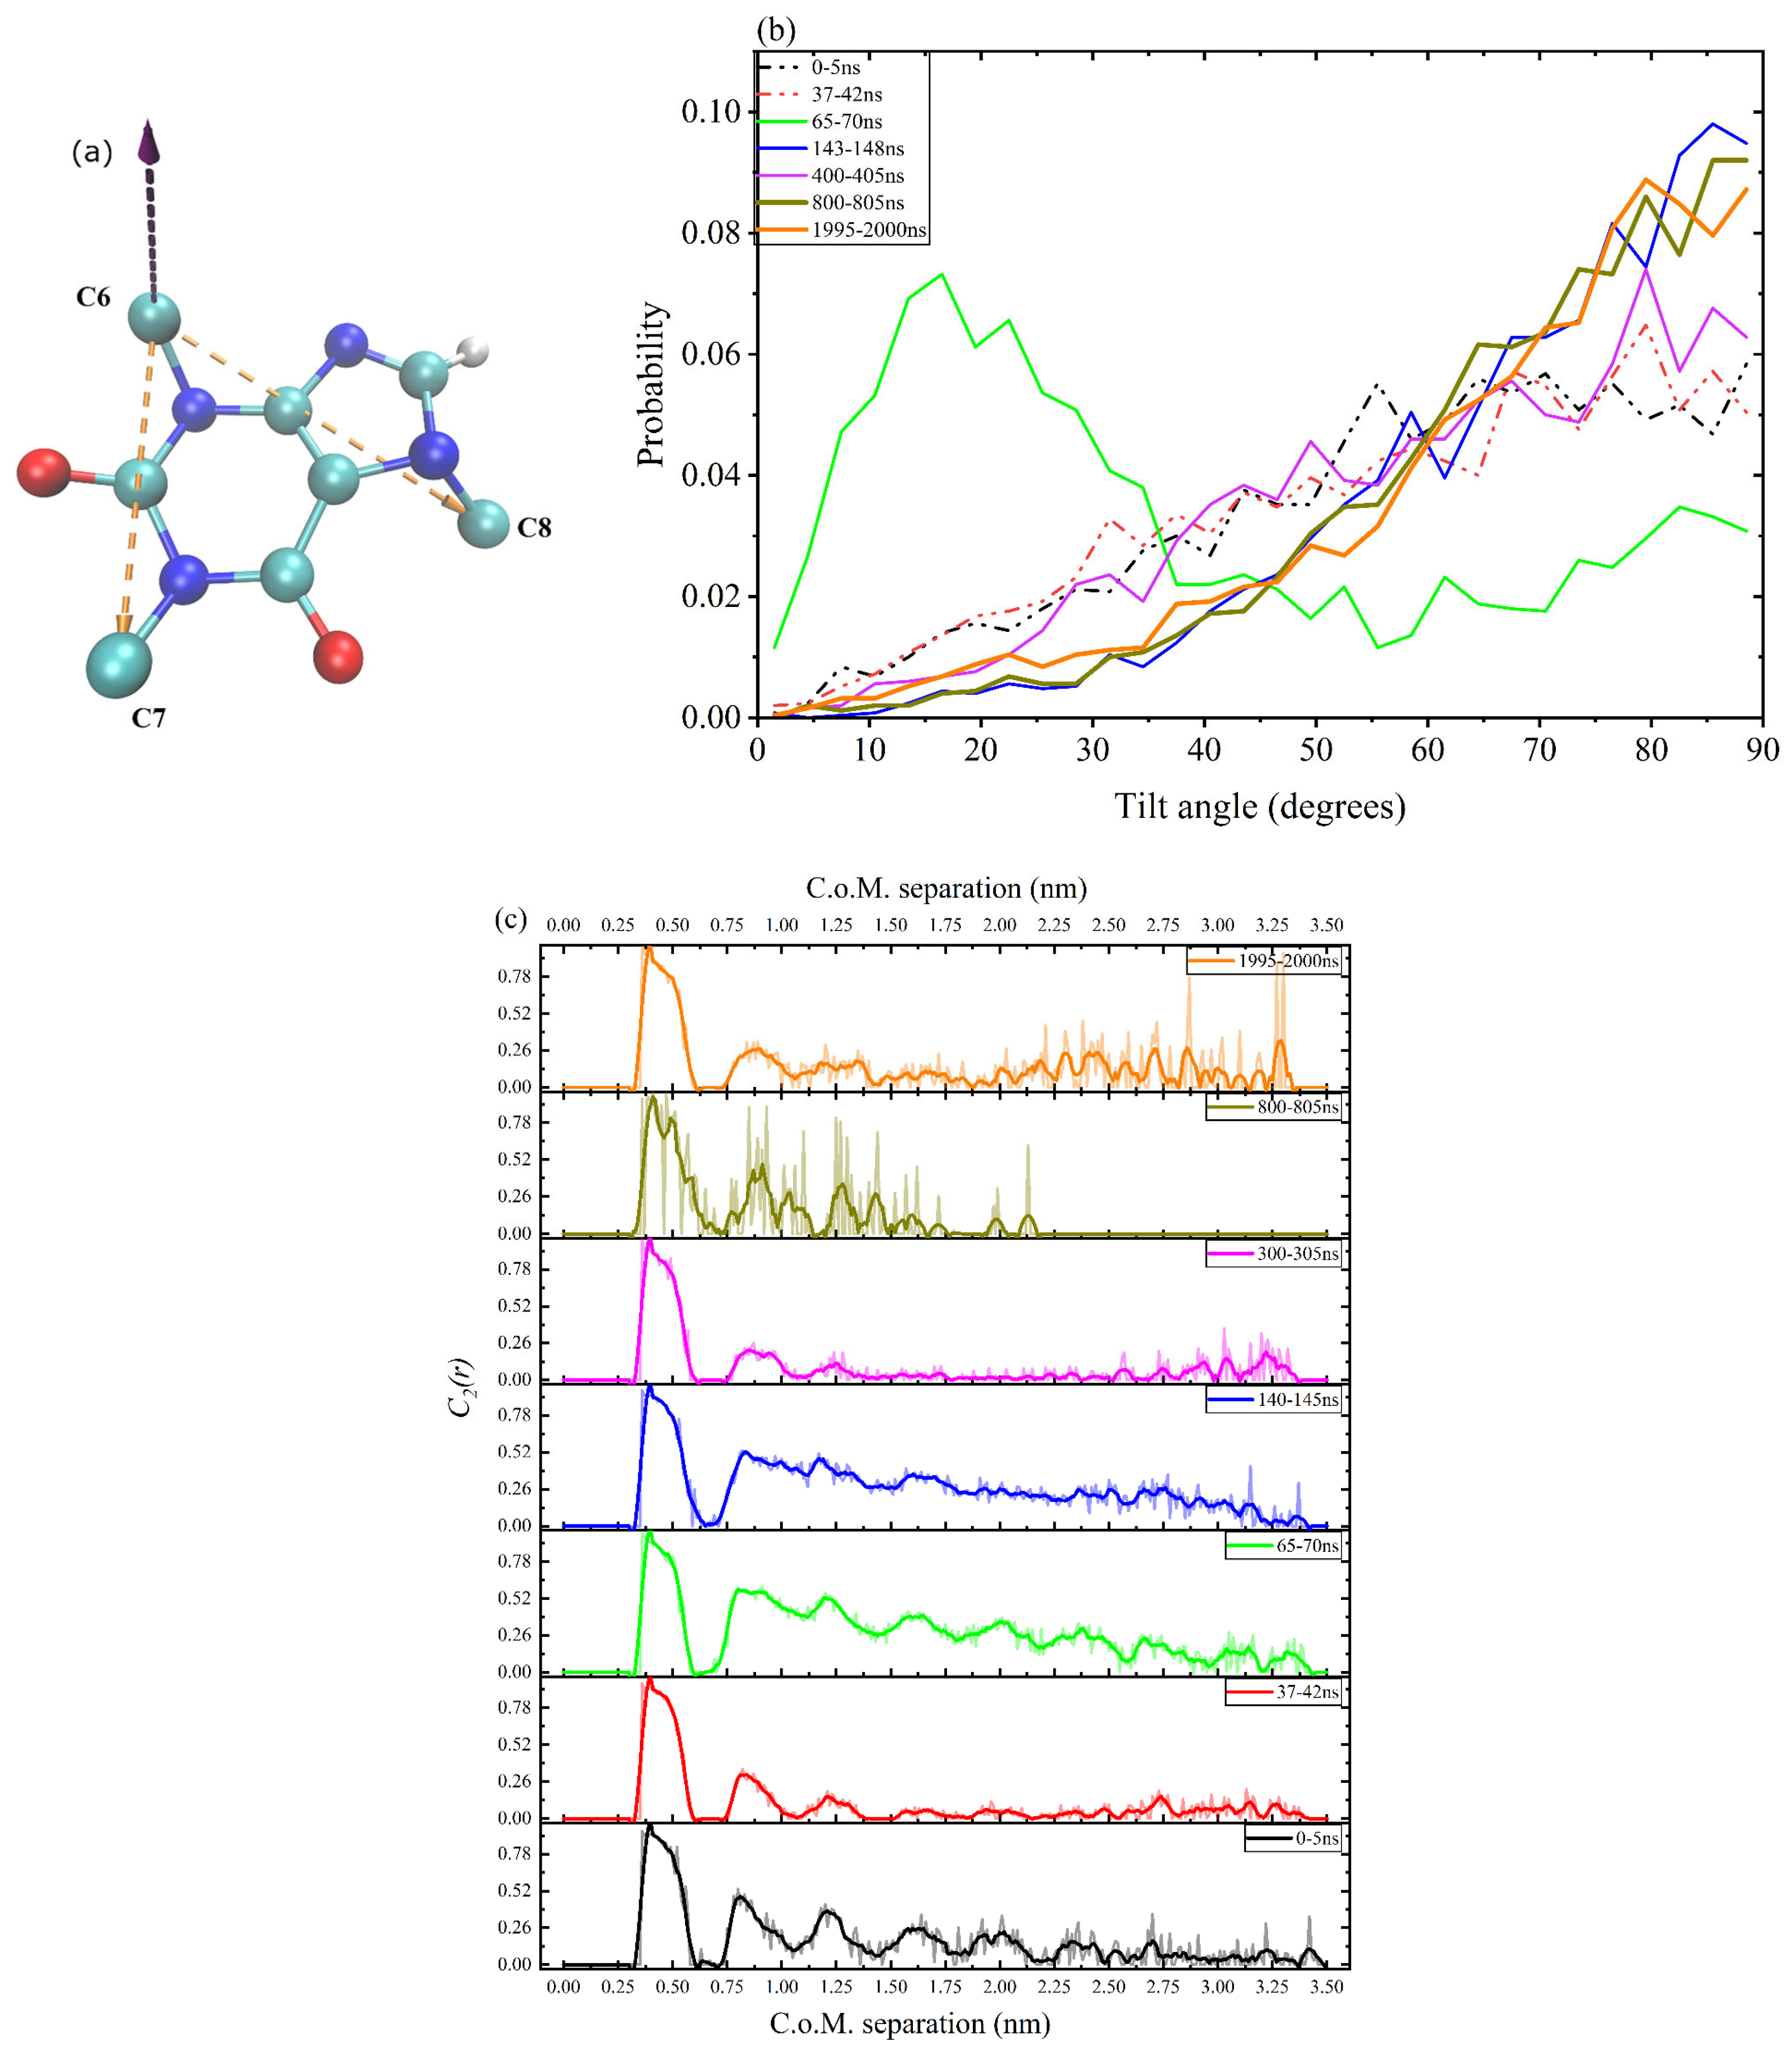
Figure 7.
Variation of surface area, Sxy (left y-axis, black curve), and bilayer thickness (right y-axis) as a function of time. Solid and dotted lines correspond to the caffeine-loaded and pure DPPC membrane, respectively. The blue dot-dashed vertical lines are placed at t = 40, 75, 200, 400 and 800 ns, marking the different phases of the caffeine permeation process.
Figure 7.
Variation of surface area, Sxy (left y-axis, black curve), and bilayer thickness (right y-axis) as a function of time. Solid and dotted lines correspond to the caffeine-loaded and pure DPPC membrane, respectively. The blue dot-dashed vertical lines are placed at t = 40, 75, 200, 400 and 800 ns, marking the different phases of the caffeine permeation process.
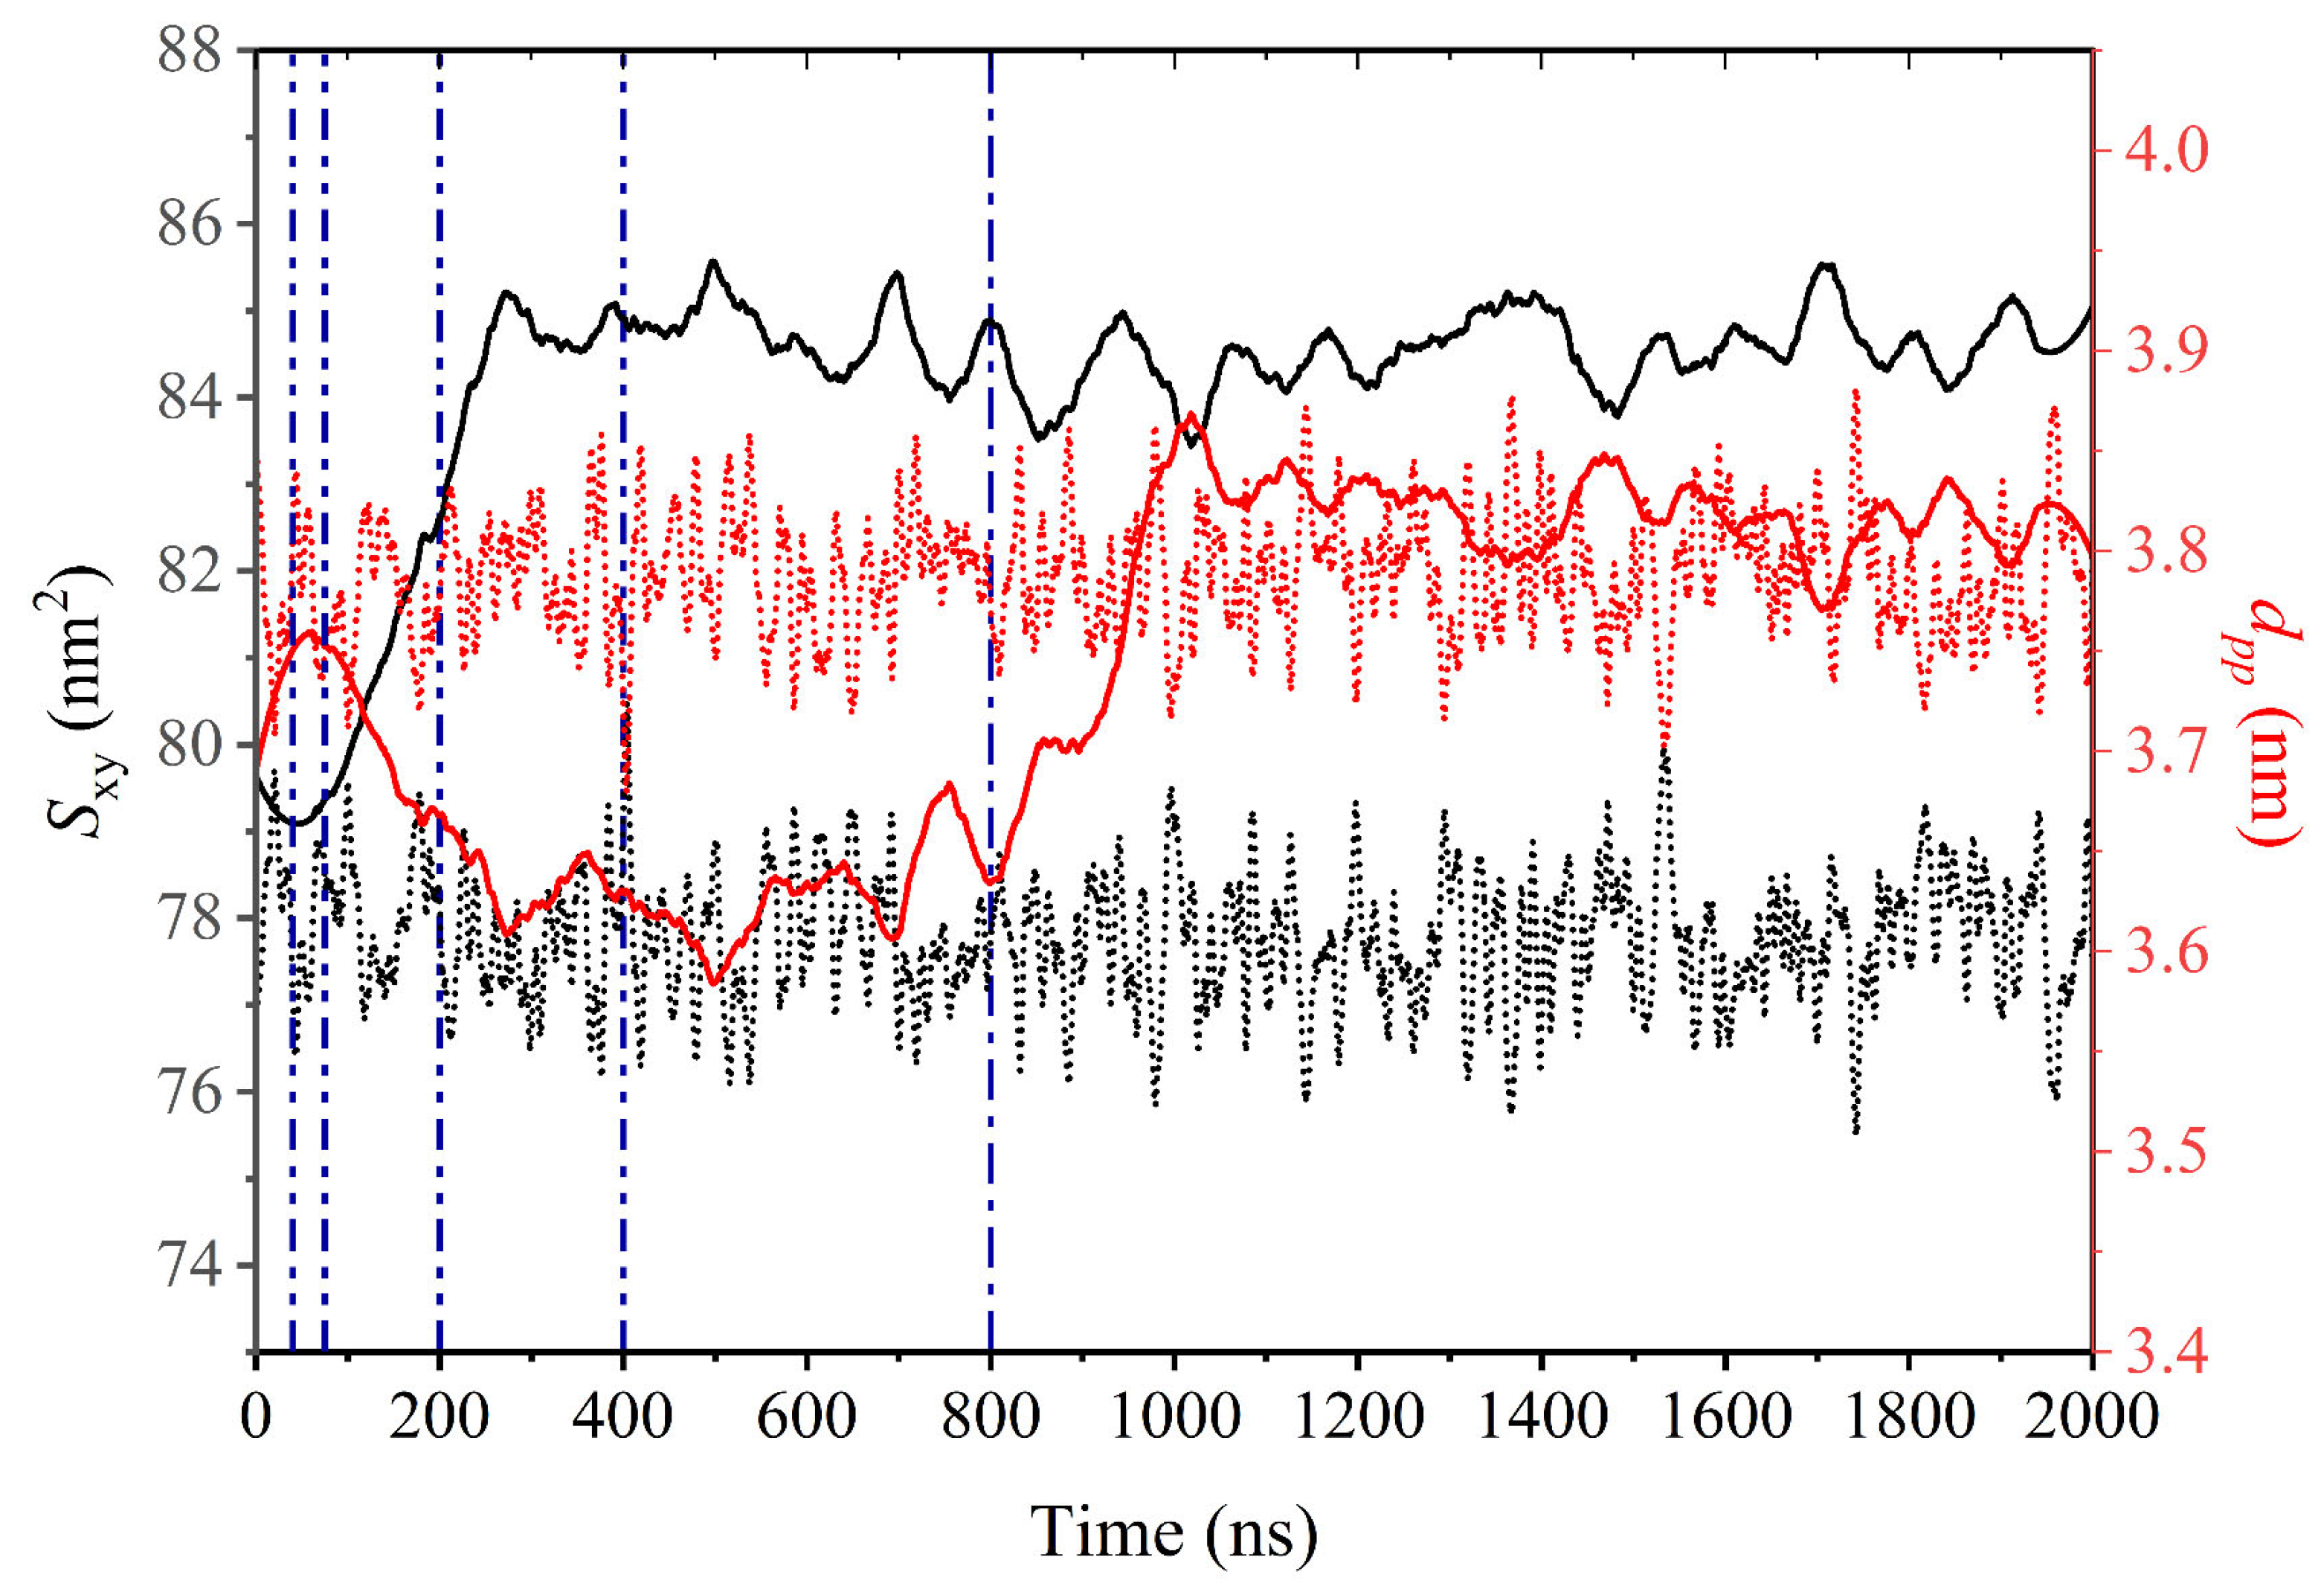
Figure 8.
Voronoi diagrams for the top (left side, blue color) and bottom (right side, red color) leaflets at different time instances: t= 0 ns (energy minimization), t = 40 ns, t = 75 ns, and t = 2000 ns. The color bar for top and bottom leaflet is shown in blue and red shades respectively. Projected coordinates of the phosphorus (P) atoms and center-of-mass (C.o.M.) for the caffeine molecules, are shown as black circles and green stars, respectively. Each DPPC and caffeine molecule is assigned to either the top or bottom leaflet based on the closest proximity according to its z-coordinate. The darker the Voronoi cell (polygon) the denser the local environment. .
Figure 8.
Voronoi diagrams for the top (left side, blue color) and bottom (right side, red color) leaflets at different time instances: t= 0 ns (energy minimization), t = 40 ns, t = 75 ns, and t = 2000 ns. The color bar for top and bottom leaflet is shown in blue and red shades respectively. Projected coordinates of the phosphorus (P) atoms and center-of-mass (C.o.M.) for the caffeine molecules, are shown as black circles and green stars, respectively. Each DPPC and caffeine molecule is assigned to either the top or bottom leaflet based on the closest proximity according to its z-coordinate. The darker the Voronoi cell (polygon) the denser the local environment. .
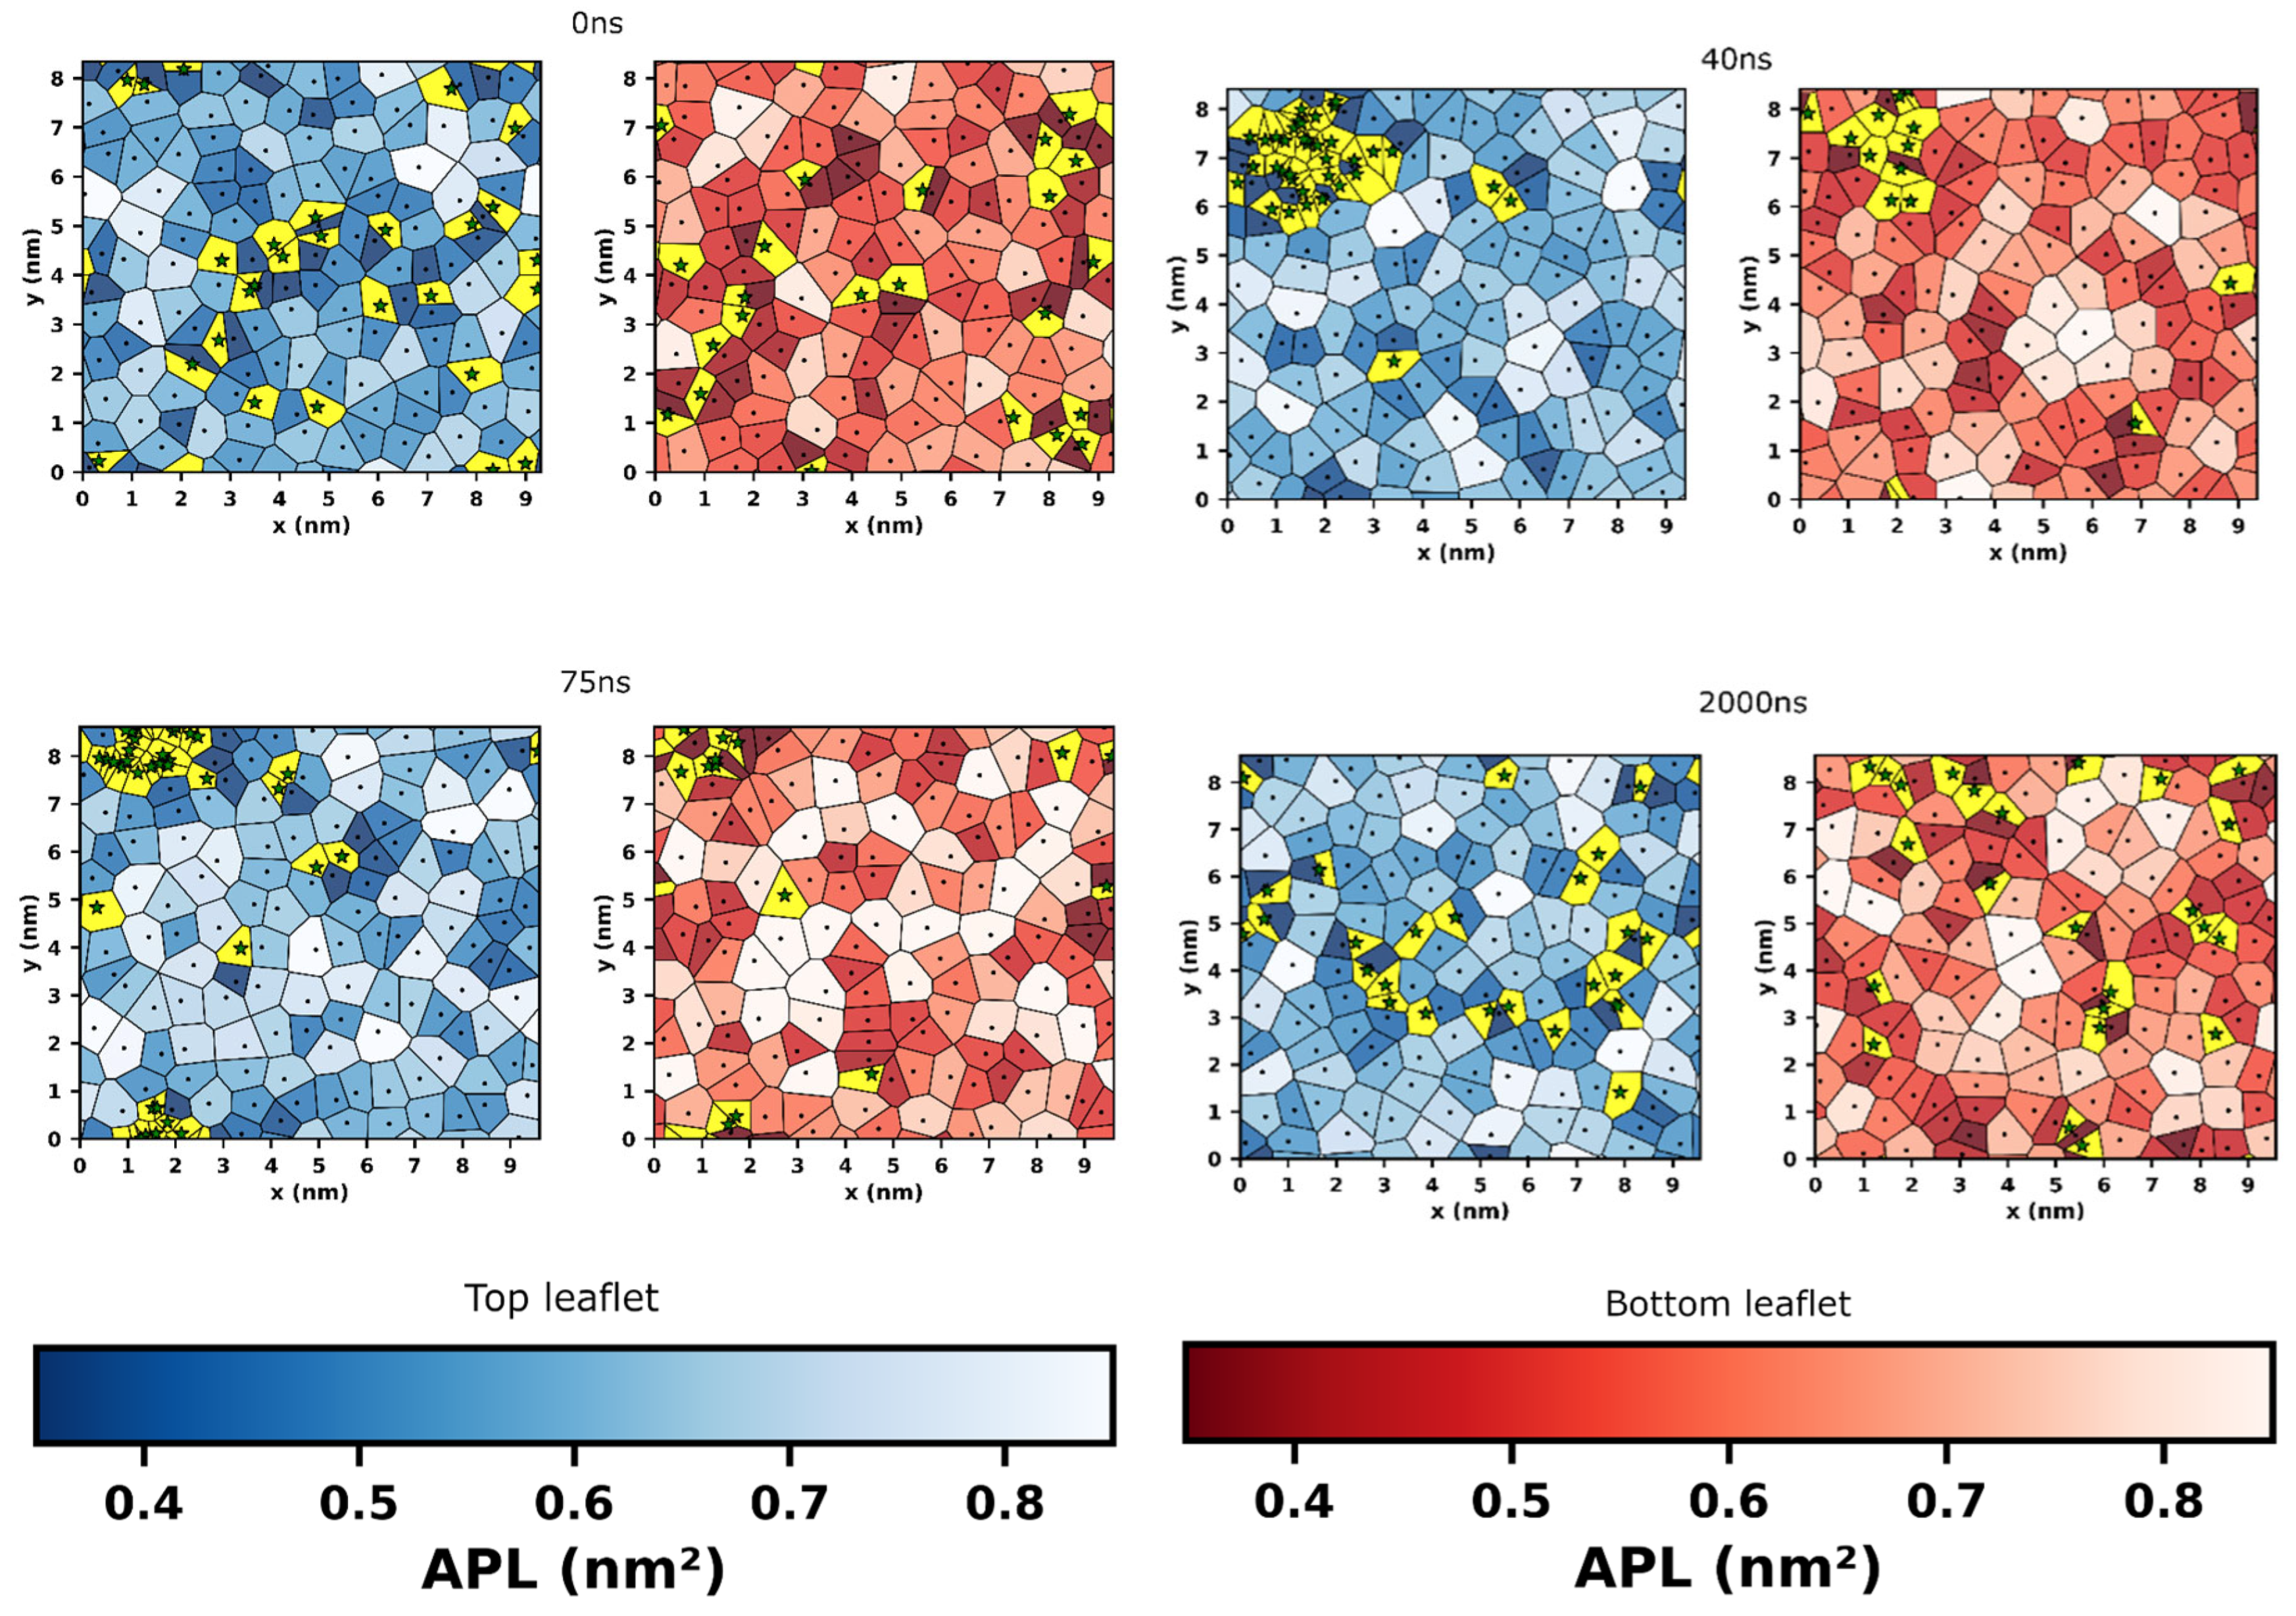
Figure 9.
(a) Area per lipid (APL) for the top (red color) and bottom (black color) leaflets, and (b) Area per caffeine (APC, blue color) as a function of time. Thin and thick lines represent the instantaneous and running average values, respectively. (c) Caffeine fraction in the top (red) and bottom (black) leaflets as a function of time. The blue dot-dashed vertical lines are placed at t = 40, 75, 200, 400 and 800 ns to indicate the different phases of the caffeine permeation process.
Figure 9.
(a) Area per lipid (APL) for the top (red color) and bottom (black color) leaflets, and (b) Area per caffeine (APC, blue color) as a function of time. Thin and thick lines represent the instantaneous and running average values, respectively. (c) Caffeine fraction in the top (red) and bottom (black) leaflets as a function of time. The blue dot-dashed vertical lines are placed at t = 40, 75, 200, 400 and 800 ns to indicate the different phases of the caffeine permeation process.
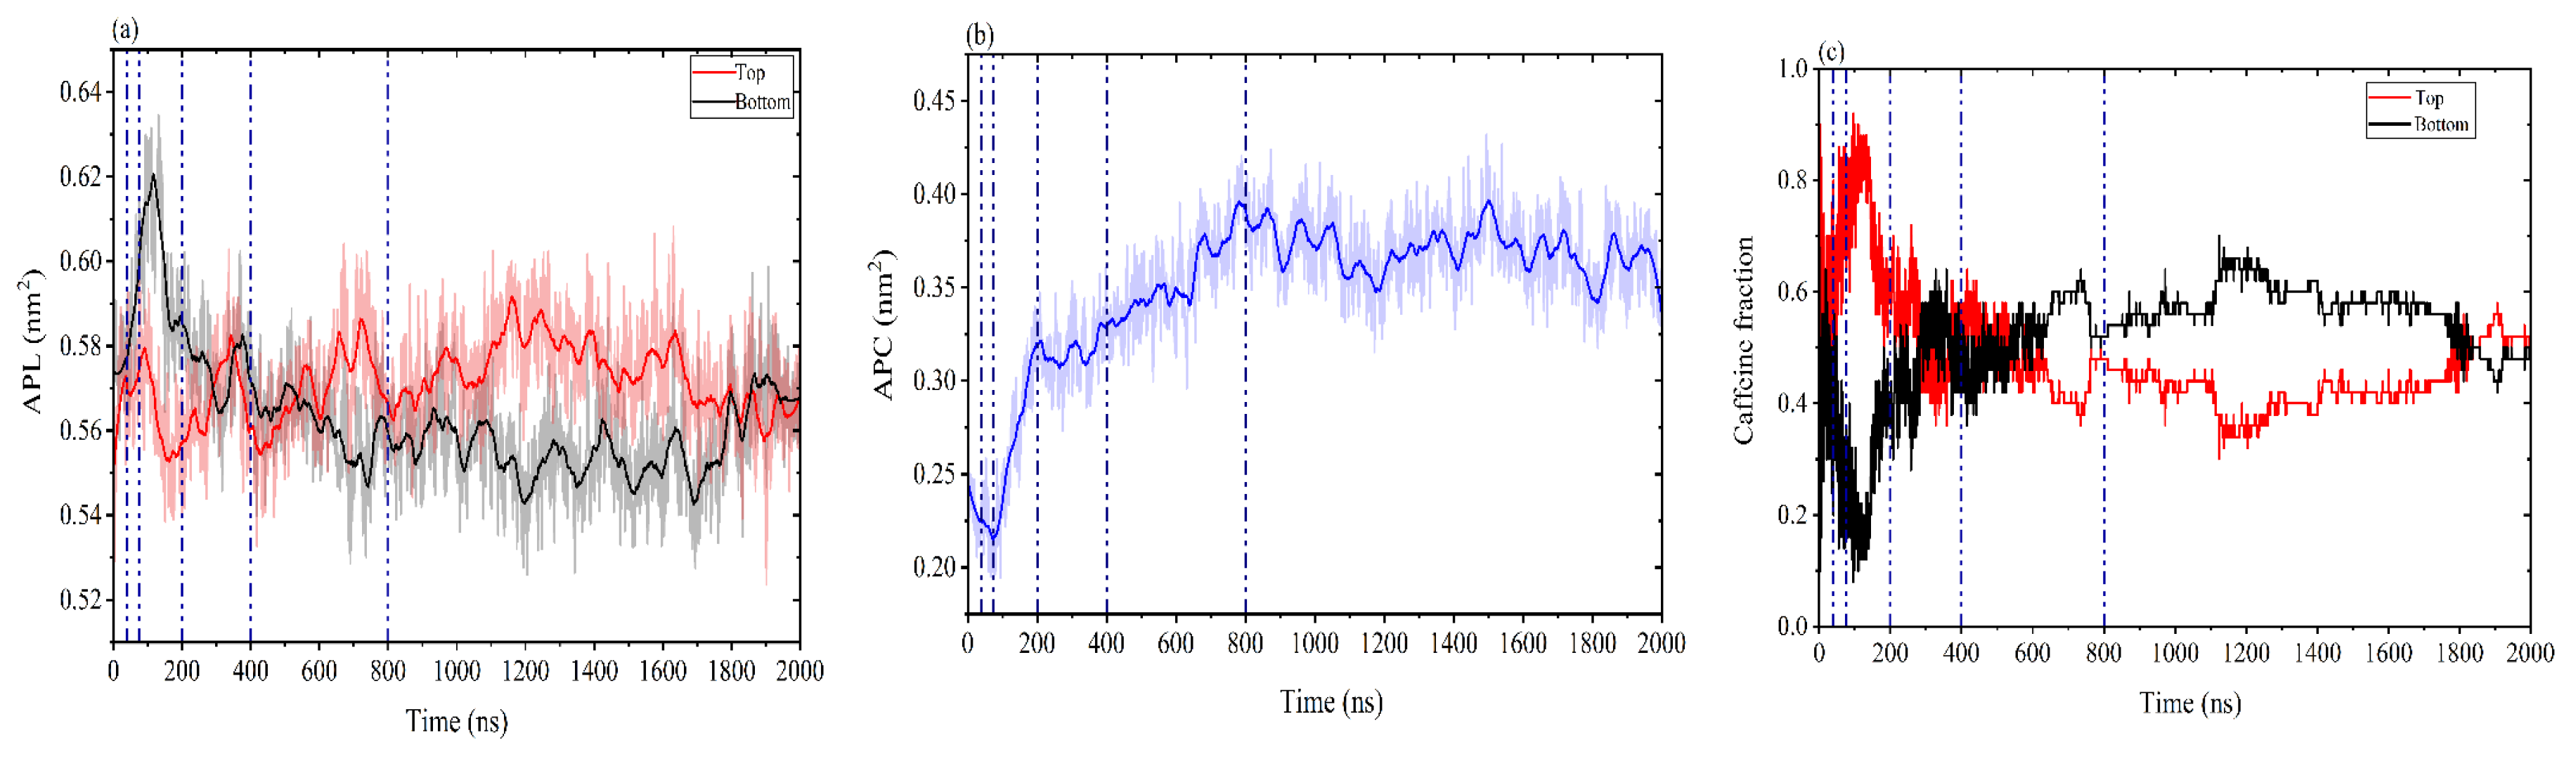
Figure 11.
System configurations (snapshots) for the modeling setup where 50 caffeine molecules are placed, in the form of a single droplet, in the hydrophobic core of the DPPC membrane. (a) Initial system configurations after energy minimization, (b) t = 500 ns), and (c) final state (t = 2000 ns). Color coding and representation follows that of Figure 1.
Figure 11.
System configurations (snapshots) for the modeling setup where 50 caffeine molecules are placed, in the form of a single droplet, in the hydrophobic core of the DPPC membrane. (a) Initial system configurations after energy minimization, (b) t = 500 ns), and (c) final state (t = 2000 ns). Color coding and representation follows that of Figure 1.
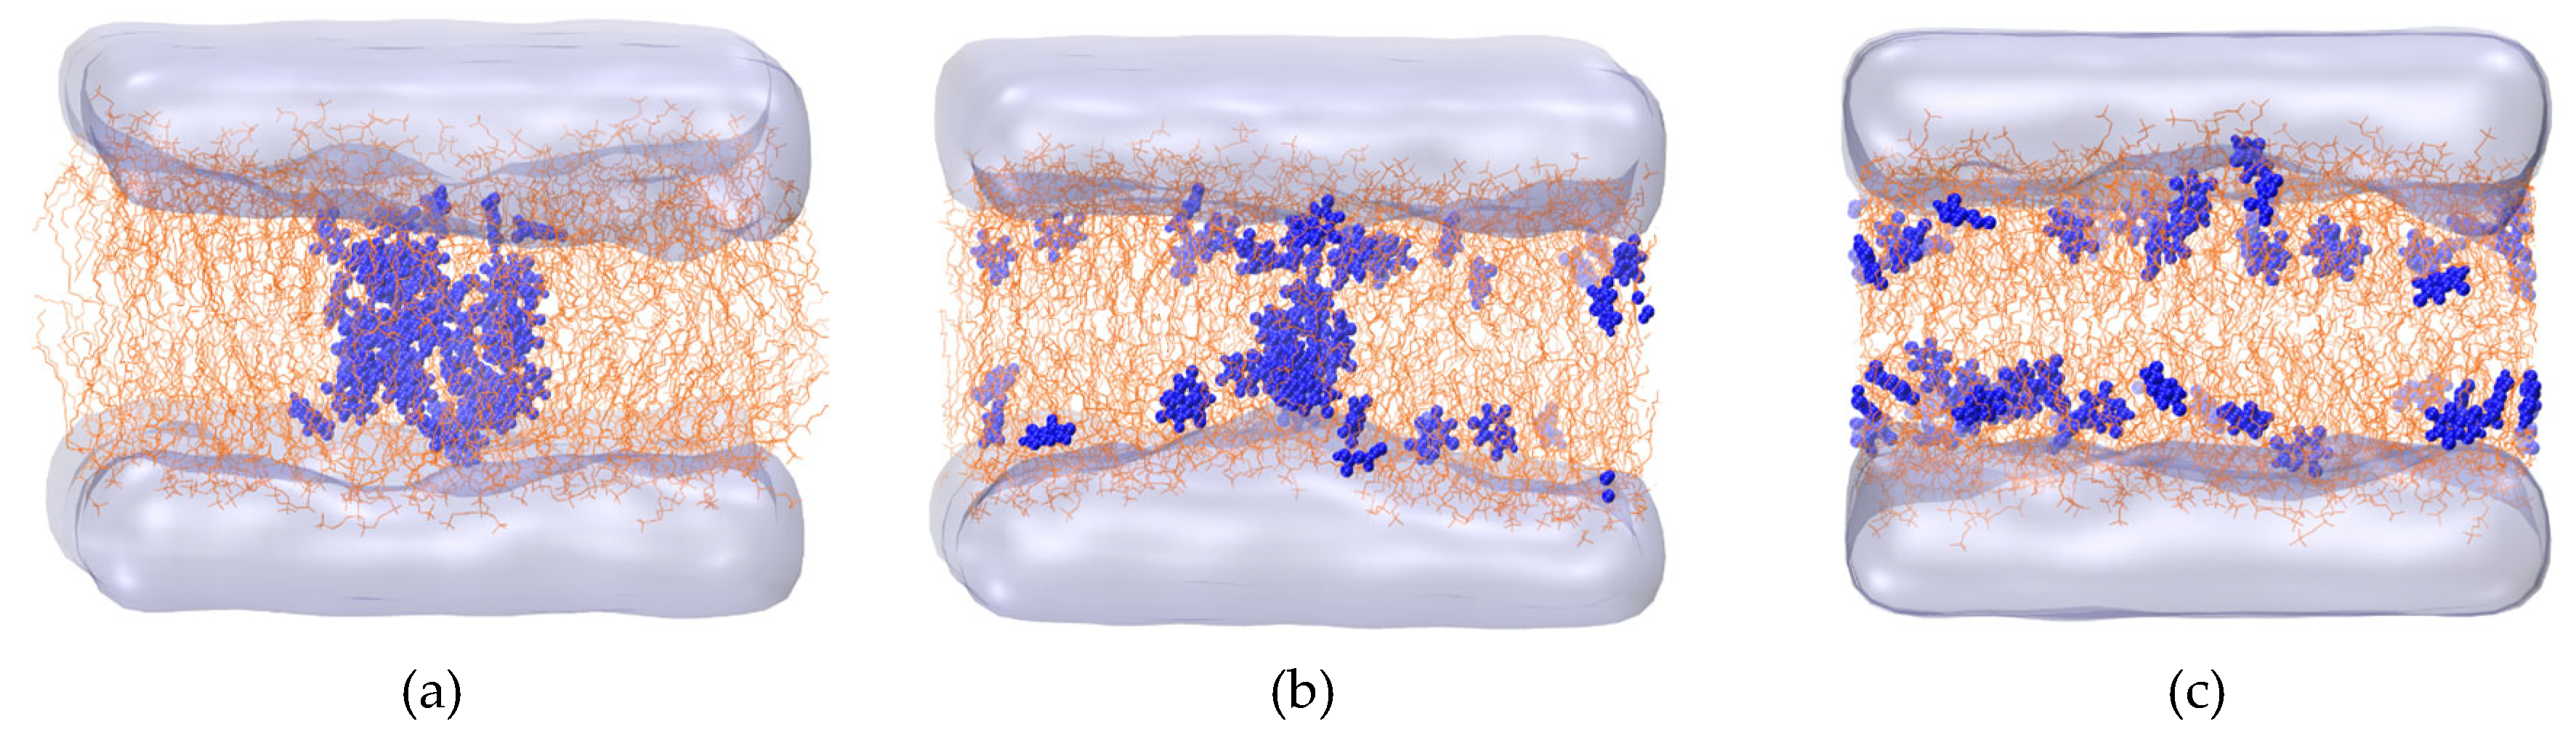
Figure 12.
(a) Mass density profile for the caffeine molecules at the beginning (filled curve) and ending (open curve) of the simulation for the two different placement patterns: in water (magenta color) and in the hydrophobic core of the DPPC membrane (orange color). Vertical black and blue dashed-dotted lines mark the peaks of the HG and AC mass density profiles, respectively, as identified in panel (a) of Figure 3. (b) Caffeine fraction as a function of time in aqueous, interfacial and core regions as identified in panel (c) of Figure 3 when caffeine molecules are placed in the form of a droplet in the DPPC core. (c) Number of distinct clusters (black line, left y-axis) and caffeine fraction in the largest cluster (red line, right y-axis) as a function of time. Thin and thick lines correspond to instantaneous and running average values, respectively. Asterisk and square symbols denote the cluster data as extracted from the system configuration after energy minimization and the 1ns-long equilibration NVT MD simulation, respectively.
Figure 12.
(a) Mass density profile for the caffeine molecules at the beginning (filled curve) and ending (open curve) of the simulation for the two different placement patterns: in water (magenta color) and in the hydrophobic core of the DPPC membrane (orange color). Vertical black and blue dashed-dotted lines mark the peaks of the HG and AC mass density profiles, respectively, as identified in panel (a) of Figure 3. (b) Caffeine fraction as a function of time in aqueous, interfacial and core regions as identified in panel (c) of Figure 3 when caffeine molecules are placed in the form of a droplet in the DPPC core. (c) Number of distinct clusters (black line, left y-axis) and caffeine fraction in the largest cluster (red line, right y-axis) as a function of time. Thin and thick lines correspond to instantaneous and running average values, respectively. Asterisk and square symbols denote the cluster data as extracted from the system configuration after energy minimization and the 1ns-long equilibration NVT MD simulation, respectively.
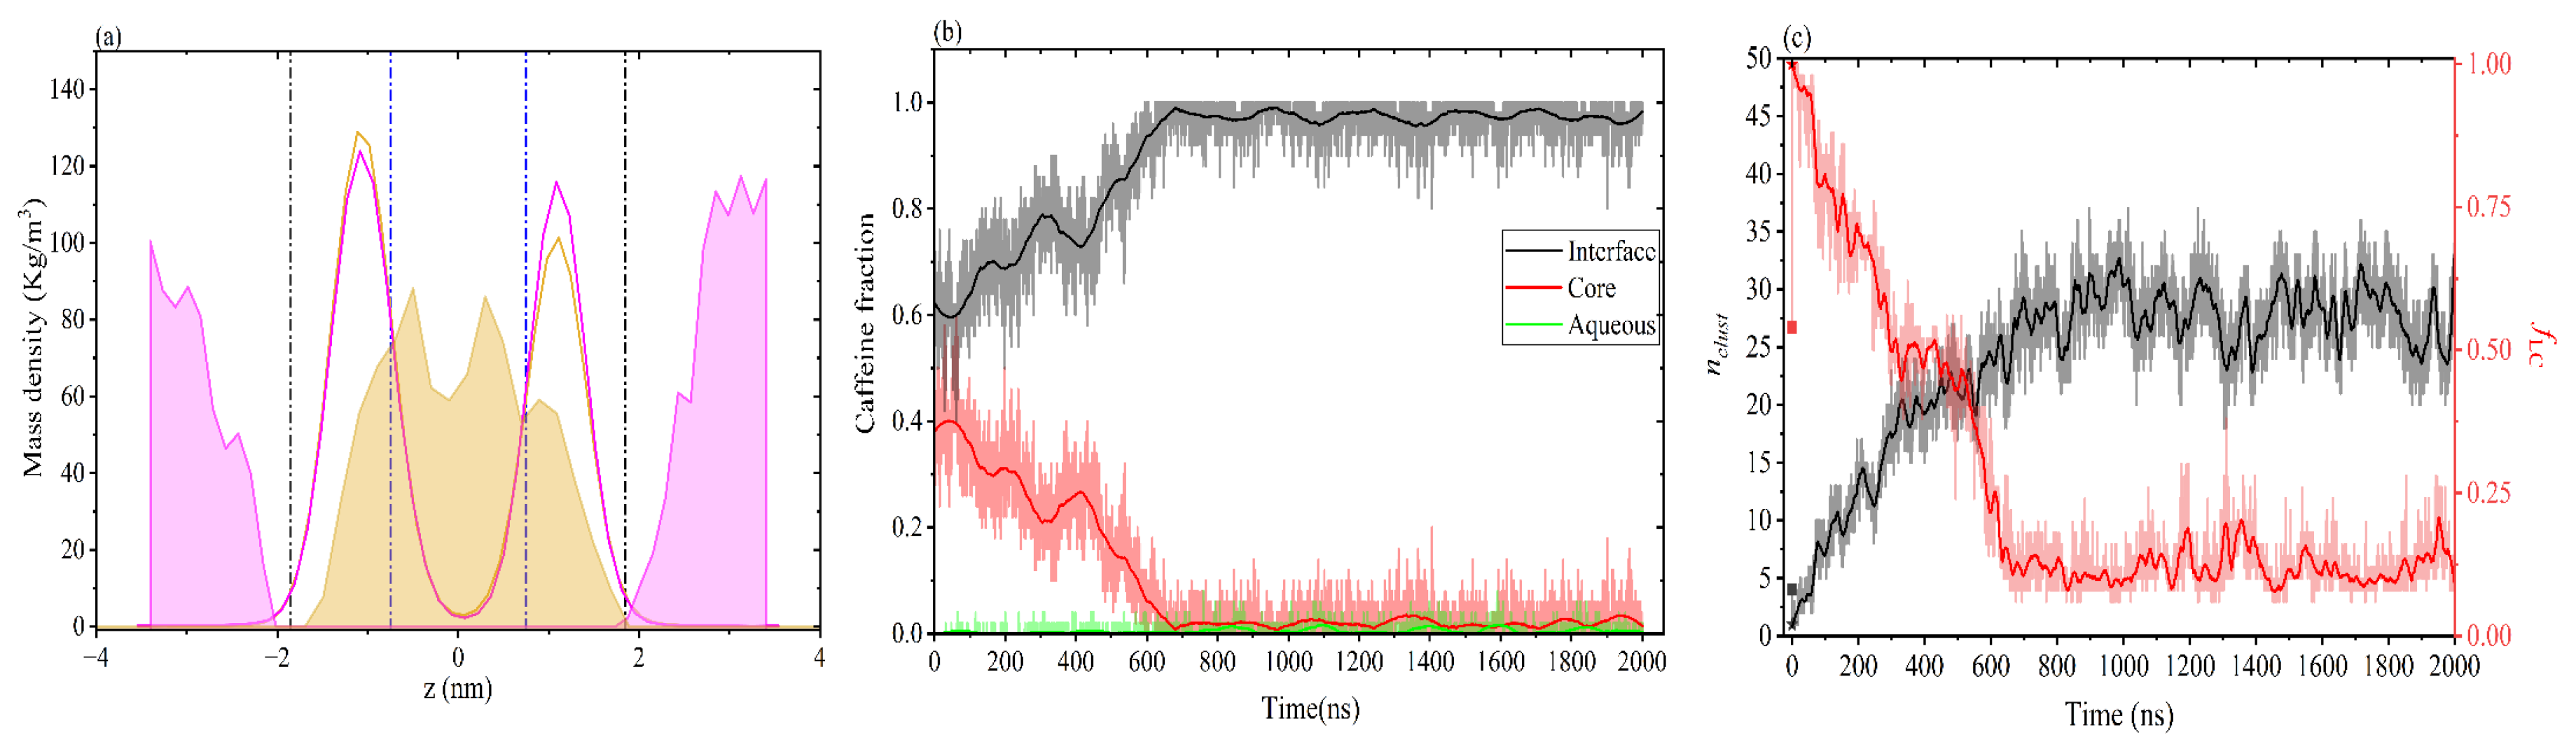
Figure 13.
(a) Deuterium order parameter (sn-1) at the end of the simulation for the pure DPPC system (violet line with stars), and for the caffeine-loaded ones, when caffeine molecules are dispersed in the aqueous phase (red curve) and as a droplet in the core of the DPPC (black curve). (b) Distribution of caffeine tilt angle at the end of the simulation for the two different placement patterns.
Figure 13.
(a) Deuterium order parameter (sn-1) at the end of the simulation for the pure DPPC system (violet line with stars), and for the caffeine-loaded ones, when caffeine molecules are dispersed in the aqueous phase (red curve) and as a droplet in the core of the DPPC (black curve). (b) Distribution of caffeine tilt angle at the end of the simulation for the two different placement patterns.
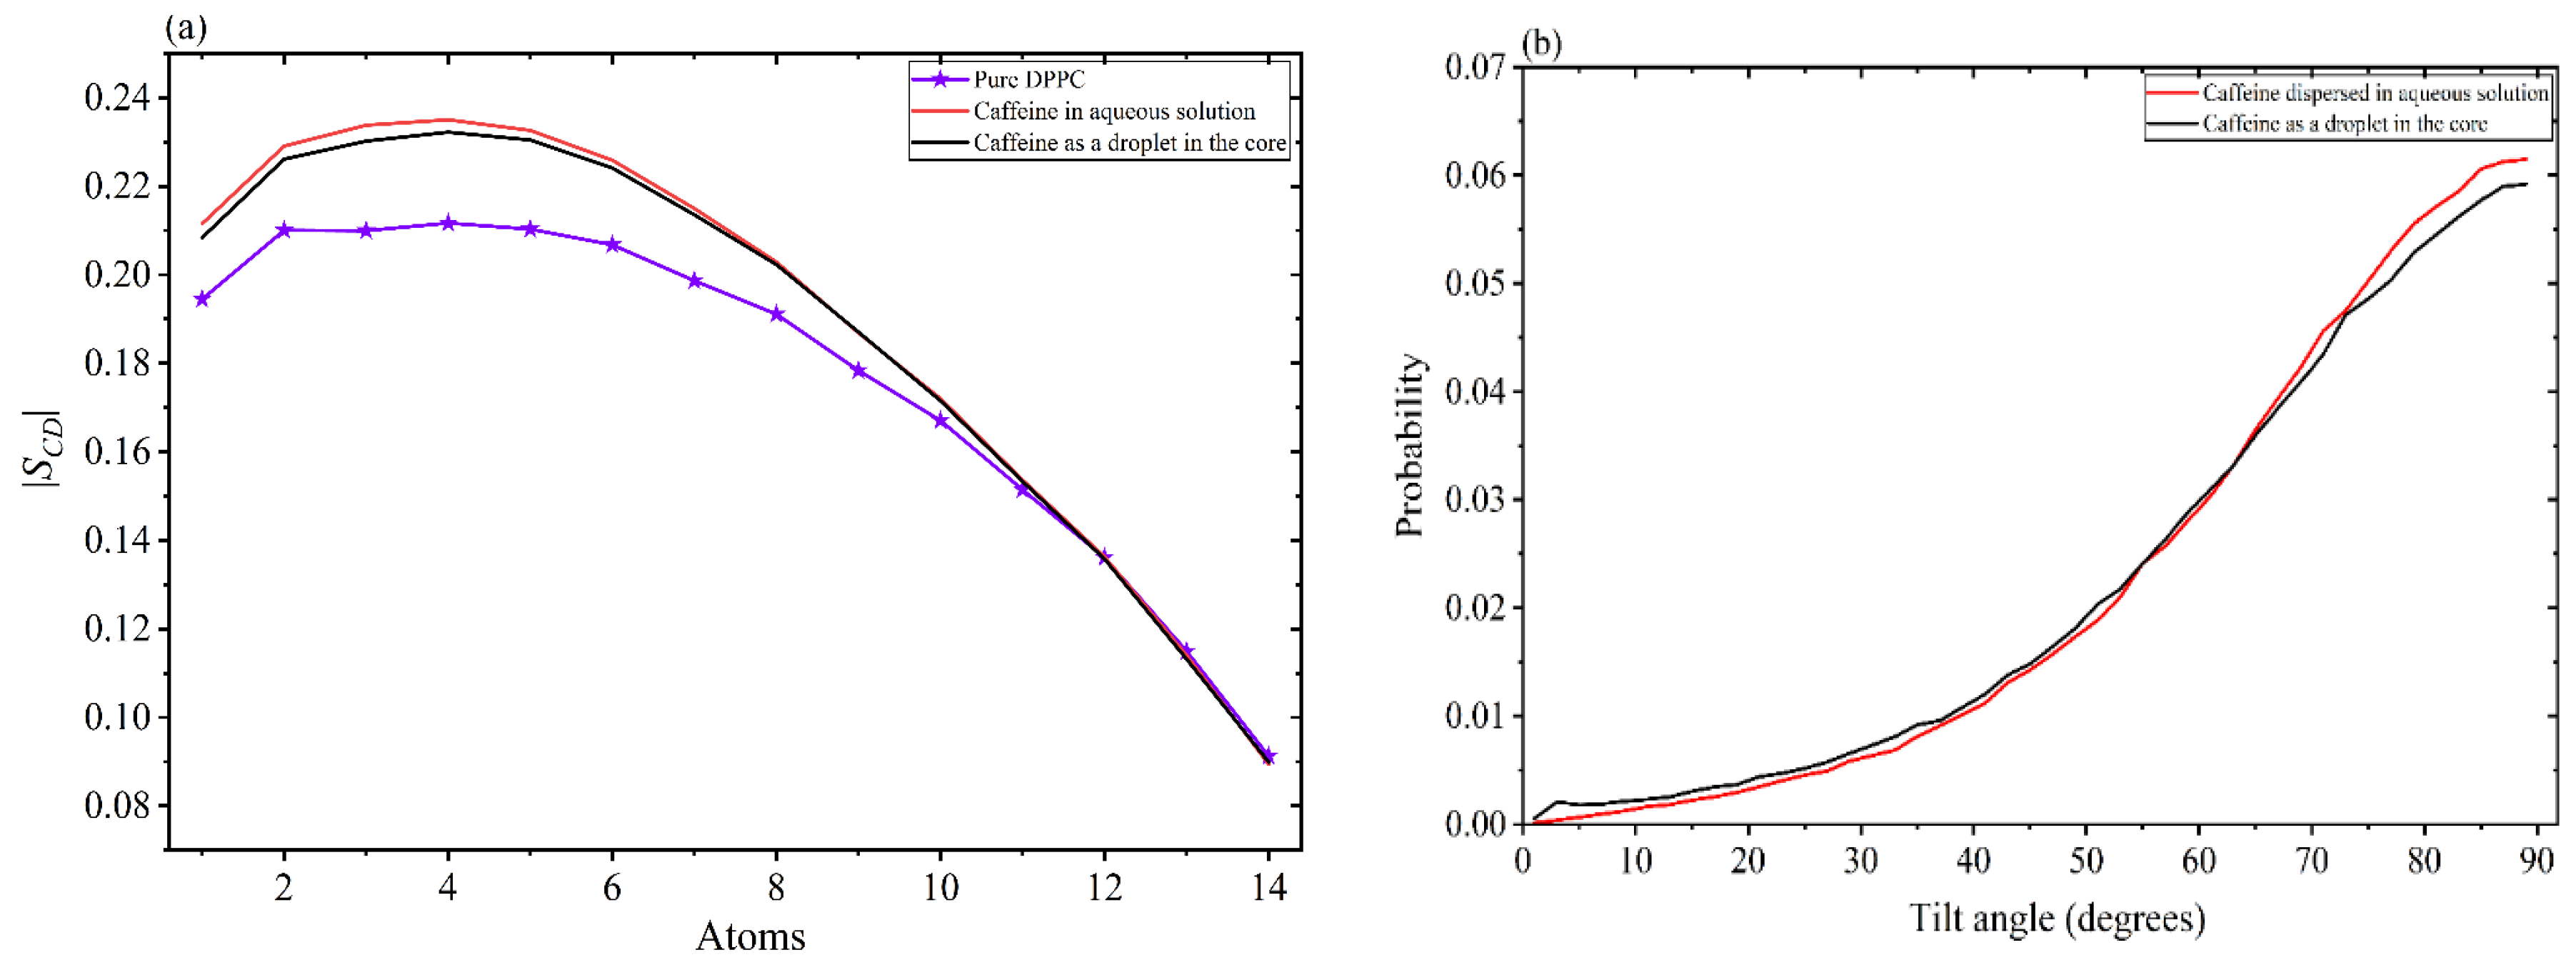
Disclaimer/Publisher’s Note: The statements, opinions and data contained in all publications are solely those of the individual author(s) and contributor(s) and not of MDPI and/or the editor(s). MDPI and/or the editor(s) disclaim responsibility for any injury to people or property resulting from any ideas, methods, instructions or products referred to in the content. |
© 2026 by the authors. Licensee MDPI, Basel, Switzerland. This article is an open access article distributed under the terms and conditions of the Creative Commons Attribution (CC BY) license (http://creativecommons.org/licenses/by/4.0/).
Copyright: This open access article is published under a Creative Commons CC BY 4.0 license, which permit the free download, distribution, and reuse, provided that the author and preprint are cited in any reuse.


