

Submitted:
17 July 2026
Posted:
20 July 2026
You are already at the latest version
Abstract
In order to clarify effects of the volcanic activity on hydrological, thermal and chemical features of a crater lake, Lake Katanuma, Japan, temperature and electric conductivity at 25 °C (EC25) of lake water were monitored at two maximum-depth points in 2023-2025. Under closed condition of the lake without river outflow, the lake is characterized by the high acidity of pH = 2 on average and the existence of the surrounding geothermal area. A seasonal variation of the thermal and chemical features for the lake was shown by sporadic vertical profiling (0.1 m pitch) of temperature, EC25 and dissolved oxygen (DO) at the two points. A groundwater flow system in the lake was specified by quantifying the groundwater inflow Gin and groundwater outflow Gout in the lake from the estimate of hydrological and chemical budgets under non precipitation. During the pycnal stratification of May – September, the lake exhibited the four-layer structure with different temperature and EC25 values, probably due to the lower intrusion of groundwater passing through three different pathways. The four-layer structure disappeared by the vertical mixing in October – December and March – April and the inverse stratification in January – February. The Gout and Gin values were estimated for three budget periods in the mixing season. Applying the Darcy’s law to the Gout values as a confined groundwater flow, it is found out that Gout has a linear relationship with lake volume. The relatively high Gin and Gout estimated is probably caused by the high permeability of lacustrine sand and gravel deposited as bedrock, which furnishes the high adjustability to lake level, i.e., its small variation at ca. 0.5 m in amplitude.
Keywords:
crater lake
; acidity
; geothermal heat
; thermocline
; halocline
; groundwater flow
; Darcy’s law
1. Introduction
In Japan, there exist 111 active volcanoes, which are defined by the Japan Meteorological Agency (JMA) as volcanoes erupted within ca. 10,000 yrs or at present accompanied by fumarolic activity [1]. Some of the volcanoes contain caldera lakes or crater lakes adjacent to the volcanic mountains or inside the mountains. In states of high volcanic activity, volcanic lakes could trigger limnic eruptions, lahars, phreatic eruptions, etc., as magma rises. In relation to disaster mitigation measures, much discussion about such volcanic lakes has been conducted, mainly from a geochemical viewpoint [2]. Under more quiescent volcanos, where the thermal and chemical monitoring for the lakes is often possible, it can be explored how hydrological, thermal and chemical conditions are built up in the lakes. The findings are useful for the precursor of a next eruption and the development of disaster mitigation measures. For example, thermal and chemical variations in a volcanic lake often provide an indicator of the conditions of underground heat sources connected to the lake [3,4]. Especially, in temperate to subtropical volcanic lakes, the geothermal heat flux at bottom can be estimated from a temporal change of thermal storage in the bottom layer under condition of the thermal stratification, since the downward heat transfer from lake surface is then suppressed by the strong pycnal stability [5,6].
Here, hydrological, thermal and chemical features of a highly acid crater lake under relatively high volcanic activity are clarified by in situ elaborate water quality surveys and the monitoring of meteorology and lake water’s temperature and electric conductivity. Thereby, geothermal effects on a groundwater flow connected to the lake are investigated.
2. Study Area
There are three volcanoes, Kurikoma, Naruko and Zao, in Miyagi Prefecture, Japan (Figure 1a). Naruko Volcano and Zao Volcano contain Crater Lake Katanuma and Crater Lake Okama [3,4], respectively. Lake Katanuma (38°44′0.8″ N, 140°43′28.1″ E: water surface elevation, 306 m asl (above sea level)) has the water surface area of 0.1239 km2 (nearly oval shape at 460 m east-west and 320 m north-south) at the highest water level (Figure 1b). As shown by the water divide in Figure 1b, the lake has a catchment area of 0.4462 km2, including the lake area. Naruko Volcano consists of an unclear caldera (ca. 7 km in diameter) and some central lava domes, surrounding the lake. Naruko Volcano erupted five times for the past 10 ka, which is presumed to have occurred at or around Lake Katanuma (URL: https://gbank.gsj.jp/volcano/cgi-bin/volcanic.cgi?id=029 (accessed on 7 May 2026)). The latest active eruption of the volcano occurred in 837 as a phreatic eruption. A geothermal area with high fumarolic activity is located on the northeastern slope, where some fumes are also observed (Figure 1b). The earth temperature in most of the geothermal area was ca. 21 °C higher than air temperature in 2017 and 2018 [7], and the fumarole temperature was 97.2 °C at maximum on 8 July 2026 (personal communication with A. Goto, Tohoku University). An artificial steam well is situated on the western shore to produce hot spring water of pH = 5–6, where stream water in the neighboring catchment is supplied using a siphon system. The Naruko Hot Spring area, ca. 1 km northwest of the lake, has many highly alkaline or highly acid hot spring sites. About two million people per year enjoy the hot spring.
A bathymetric map of the lake is shown in Figure 2, which was obtained as that at a relatively high water level at site L (Figure 1b), based on the echo sounding on 23 August 2023. The water level in Figure 2 corresponds to that just before the overflow at site O. Using the bathymetry, the lake volume and mean depth were obtained at 6.09 × 10⁵ m3 and 4.92 m, respectively. As a feature of the basin shape, a subaqueous sill exists at water depth of 8.6 m on a point ca. 100 m south-southwest of site MD1 (red square in Figure 2). Thereby, the lower basin is divided into the northwestern and southeastern parts, of which each has a maximum depth point at site MD1 (20.1 m depth) or site MD2 (12.6 m depth). Through a water pathway at site I, the lake constantly receives the mixed water (pH = 6.1–7.1) of the supplied stream water and the hot spring water produced at the steam well. Meanwhile, the increase of lake level by heavy rainfalls or snowmelt produces the overflow at site O, which produces a pool of less than 2500 m2 in area on the northwestern shore.
The geology around the lake is shown in Figure 3. This is a seamless geologic map drawn on the 3D topographic map (URL: https://www.web-gis.jp/GM1000/GM_Red1/GM_Red1-012.html (accessed on 1 May 2026)). It is noted that the lacustrine sediment at less than 2.58 Ma is distributed around dacite and rhyolite of Pleistocene at less than 0.126 Ma which produced a central lava cone group. This indicates that a large caldera lake once existed and buried in mud and debris. Thereafter, an eruption of Naruko Volcano produced the lava cone group and Lake Katanuma. Consequently, the bed rock of the volcano is the lacustrine sand-gravel layer with high permeability, which is exposed at less than 340 m asl to the northwest from Mt. Kurumiga-take (Figure 1b) [8].
3. Methods
3.1. Field Observations
In order to explore geothermal and hydrothermal effects on Lake Katanuma, onboad observations and monitoring of water temperature and electric conductivity (EC) were carried out in 2023–2025. At site MD1 in Figure 2, the mooring system consisting of 11 temperature loggers (HOBO MX2201 and TidbiT v2, Onset Computer, Inc., USA; accuracies of ±0.5 °C and ±0.2 °C, respectively) and an EC logger (HOBO U24-001, Onset Computer, Inc., USA; accuracies of ±2 mS/m for EC and ±0.1 °C for temperature), which recoded water temperature and EC at 1 h interval (Figure 4a). The EC logger was set at 6 m, 7 m or 9 m above lake bottom, considering the sill’s depth (Figure 2). Similarly, nine temperature loggers were moored at site MD2 (Figure 4b).
The onboard observations were performed a few times in May–November of 2023–2025, when lake water and bottom sediment were sampled and vertical profiles of some water quality items (water temperature, electric conductivity at 25 °C (EC25), dissolved oxygen (DO) and bulk water density) were obtained at 0.1 m depth interval by using a self-recording profiler, called “RINKO-Profiler” (Advantech, Co., Ltd., Japan) (URL: https://www.jfe-advantech.co.jp/eng/products/ocean-rinko.html (accessed on 11 May 2026)). Time required for one profiling was then a few minutes. The bulk water density was obtained by using the water temperature and total dissolved solids (mg/L) from the EC25 values. The sampled water and the pore water in the sediment were chemically analyzed by using ion chromatography (type Dionex ICS-1600 (cation) and ICS-2100 (anion), Thermo Fisher Scientific Inc., Japan; URL https://www.thermofisher.com/jp/ja/home.html (accessed on 14 May 2026)). Concentrations of major ions (K+, Na+, Mg2+, Ca2+, Cl−, SO42−) were then measured. Meanwhile the bicarbonate ion (HCO3−) concentration was obtained by using the 0.1 mol hydrochloric acid titration. During the onboad observations, it was seen that the lake water surface bubbles with volcanic gases such as H2S and CO2 up to ca. 100 m off the southern shore.
At site M in Figure 1b and Figure 2b, some meteorological factors (air temperature, relative humidity, air pressure, wind speed, wind direction, solar radiation, rainfall) were measured at 30 min or 1 h interval in 2023–2025. The height of the measurements was ca. 2 m above the lake water surface. These data were utilized to estimate the water budget of the lake, including water surface evaporation related to the latent heat flux. In order to determine whether the precipitation over the lake is rainfall or snowfall in winter, the air temperature at site M and the precipitation data of the Kawatabi weather station, 3.34 km east-northeast of the lake, were utilized. Daily precipitation at site M in December–March, in which some days with daily mean air temperature of less than 2 °C appear, was estimated by using a regression equation (y = 0.903x, where x and y are daily rainfalls (mm/d) at Kawatabi and site M, respectively) with the high correlation (R2 = 0.970, p < 0.01) between Kawatabi and site M.
At site L, the pressure logger was set, and the lake level was obtained at 1 h interval from a difference between the air pressure plus water pressure at site L and the air pressure at site M. The lake level was then given as water depths of the logger fixed on a sandbag, and the continuity from record to record in the logger was maintained by sporadic leveling between lake level and a benchmark.
During the onboard observations, water temperature, pH and EC25 was measured at site I by a thermocouple thermometer and portable pH and EC meters (HORIBA Advanced Techno, Co., Ltd., Japan; URL: https://www.horiba.com/usa/water-quality/pocket-meters/ (accessed on 14 May 2026)). Simultaneously, the inflow through the water pathway at site I was measured by the one-point method. The outflow at site O occurred a few days as overflow from the rapid increase of lake level by heavy rainfalls (more than 50 mm/d) or snowmelt. Unfortunately, the outflow was not able to be measured because of the spontaneous occurrence of the overflow and the outflow’s large variation in a short time period.
3.2. Hydrological Budget Estimate for Lake Katanuma
In order to quantify a geothermal effect on groundwater flow in Lake Katanuma, the inflow and outflow of groundwater for the lake were evaluated by estimating hydrological and chemical budgets of the lake. Here, only the closed condition of the lake without any outflow at site O is considered. In the rainfall season, when the lake has an open water surface, the hydrological budget equation is then given in the following [3]:
where V is the water volume (m3), A0 is the water surface area (m2), P is the rainfall (m/s) to the lake surface, E is the evaporation (m/s) at the lake surface, Rin is the river inflow (m3/s), and Gin and Gout are the groundwater inflow and outflow (m3/s), respectively, and t is the budget time period. The evaporation E was calculated as follows:
where QE is the evaporative latent heat flux (W/m2), ρw is the water density (kg/m3), λ is the latent heat for evaporation (J/kg), ρa is the air density (kg/m3), u is the wind speed (m/s), CE is dimensionless bulk transfer coefficients for latent heat flux (here, CE = 0.0014 was given as constant at 2 m above lake surface, assuming a neutral atmosphere at all times)., qa is the specific humidity of air, and qs is the saturated specific humidity at surface water temperature. Using the records at site M, the u, Ta and qa values were also given as those at 2 m above the water surface.
V/t = (P − E)A0 + Rin + Gin − Gout
E = QE/(λρw)
QE = λρaCEu(qs − qa)
Under condition of non-rainfall, Equation (1) yields:
G = Gin − Gout = V/t + EA0 − Rin
Here, the net groundwater inflow G is provided by the calculation of water volume change and total evaporation EA0 over the lake surface with surface water area A0 changed following the lake level and the in situ measurement of river inflow Rin.
3.3. Chemical Budget Estimate for Lake Katanuma
The chemical budget equation for the closed lake is as follows:
where CL is the ionic concentration (g/L) averaged over the lake volume, CRin, CF, and CGin are the ionic concentrations (g/L) of an inflowing river, rainfall and inflowing groundwater, respectively, and S is the net depositional flux (kg/s) related to the chemical reaction of the ion. The volume-averaged ionic concentration, CL, of the lake is given as that of groundwater outflow, since it is unknown at which depth the lake water leaks out as groundwater. The ionic concentration CGin of inflowing groundwater is here given by that of pore water within bottom sediment.
Δ(CLV)/Δt = CRinRin + CFPA0 + CGinGin − CLGout − S
The magnitude of S is inferred by considering the lake water chemistry based on the ionic analysis. If a non-rainfall period is adopted as a budget period, the second term on the right side of Equation (5) is zero. Here, as an ion specifying the ionic concentration in Equation (5), an ion with a small influence of the chemical reaction was selected.
3.4. Evaluation of Groundwater Inflow and Outflow for Lake Katanuma
Under condition of non-precipitation, the simultaneous equations for Equation (5) and Equation (4) from the hydrological budget equation yield to:
where D =Δ(CLV)/Δt − CRinRin + S. The D values are given by incorporating the chemistry of the stream and lake waters into the hydrological terms.
Gout = (CGin G − D)/(CL − CGin)
Gin = Gout + G
3.5. Relation Between Groundwater Outflow and Lake Level
How groundwater outflow Gout is related to lake level is shown by applying the Darcy’s law. If Gout occurs as a confined groundwater flow, the Darcy’ law yields to the following equation:
where K is the hydraulic conductivity (m/s) of sediment below lake bottom, L is the length of groundwater pathway, H0 is the lake level, HL is the water head at a spring site, and AL is the outflowing area from the lake. Here, K, L and HL are considered to be constant, when the spring site is at any time located at the same point. Thus, Gout holds the linear relationship with lake level H0, if AL is nearly constant. If H0 is proportional to lake volume V, i.e., H0 = gV (g, constant of proportionality),
Gout = KAL(H0 − HL)/L
Gout = aV − b
a º gKAL/L, b º KALHL/L
Here, both a and b are nearly constant. Gout is then given as a linear expression of lake volume V.
4. Results
4.1. Meteorology and Hydrological Response of Lake Katanuma
Time series of daily mean lake level and air temperature and diurnal precipitation for 18 April 2023–19 November 2025 are shown in Figure 5. The lake level varied with the amplitude of ca. 0.7 m at most. This amplitude is much smaller than ca. 1.5 m for Lake Kuttara [9] and ca. 6 m for Crater Lake Okama [10], of which both are of closed type without river outflow. The stream inflow at site I was very small at 0.006–0.017 m3/s from five measurements, and the evaporation at lake surface at 0.00099 m3/s on average during non-rainfall of April–September. Hence, the small amplitude of lake level variations suggests that the groundwater inflow Gin and the groundwater outflow Gout are in a near-equilibrium state quantitatively throughout the year. When the lake level is more than 2.40 m (horizontal dotted line in Figure 5), the overflow occurred at site O. However, regardless of whether there is the outflow at site O, the lake level increased by a mere 0.1–0.2 m in response to rainfalls of more than 40 mm/d. This suggests that a variation of groundwater inflow Gin is small, being independent of an increase in the infiltration of rainwater on the ground surface around the lake by heavy rainfalls. The variation of lake level is small also in January–February with relatively small precipitation and negative air temperature (Figure 5). This suggests that snowmelt by the geothermal heat around the lake is in progress even in mid-winter.
Meanwhile, as shown by Equation (8), the groundwater outflow from the lake should occur as confined groundwater flow, following the Darcy’s law, where the magnitude of outflow could exhibit a linear relationship with the lake level or lake volume.
4.2. Characteristics of Thermal and Chemical Structures of Lake Katanuma
Vertical profiles of water temperature, EC25, bulk water density and DO at site MD1, obtained by the onboad observations in 2024, are shown in Figure 6. On 22 May and 17 July, the water temperature, EC25 and water density greatly changed at three depths (or boundaries) as (a) thermocline, (b) halocline and (c) pycnocline, respectively. Thereby, the lake water is divided into the four layers of A to D. Here, the water depth of a certain boundary was defined as that with an inflection point or a maximum-change point on a vertical profile accompanied by a vertical change (per 1 m in depth) of more than 1 °C, 10 mS/m or 0.3 kg/m3. The EC25 profiles were similar in shape to the water density ones (Figure 6b,c). This indicates that the lake water stability is controlled by the EC25 rich in dissolved solids. The DO profiles then decreased greatly between A and B layers. This suggests that, during the pycnal stability, the water deoxygenated by volcanic gases from the lake bottom extends up to the boundary of A and B layers. Thus, the B to D layers were probably formed by the intrusion of groundwater through three different pathways under condition of a geothermal heat source weakened downward but dissolved solids more abundant downward. The boundaries between B and C layers are located at the water depth (8.6 m) of the subaqueous sill in Figure 2. Thus, the northwestern basin is likely to have a unique water quality at depths below the sill. The 18-September profiles indicates that the cooling at lake surface produced the mixing in the upper layer. Thereby, the boundaries between A and B layers were lost, and those between B and C layers were deepened. Meanwhile, the lowest D layer still continued, since the whole mixing was not yet established. On 22 October, the more cooing made all the boundaries disappear, and all the vertical distributions were then almost uniform, indicating that the mixing was complete and continuous in the whole lake.
Vertical profiles of water temperature, EC25, bulk water density and DO at site MD2 on the same days are shown in Figure 7. On 22 May, the relatively weak thermocline, halocline and pycnocline were located at two water depths of 2 m or less, and the lowest boundaries at 3.9–4.8 m depth were similar in depth to the upper boundaries of the B layer at site MD1. The DO distribution at site MD2 is also similar to that at site MD1 on 17 July. However, on 22 May and 18 September, the lower layer at more than 4 m depth is relatively rich in DO. This suggests that the supply of volcanic gases from lake bottom is relatively weak.
Being different from the distributions at site MD1, water temperature, EC25 and water density at site MD2 were vertically almost uniform at depths of more than 8 m (here, called “E layer”), where water temperature and EC25 were larger and smaller than at site MD1, respectively. The top of the subaqueous sill is at 8.6 m depth at the lake level of 2.40 m (Figure 2 and Figure 5). Hence, the E layer at depths of more than 8 m appears to exist separately from the C layer at site MD1. In the E layer, the groundwater heated by a geothermal heat source stronger than the C layer at site MD1 likely inflows. On 18 September and 22 October, the vertical distributions of water temperature and EC25 were similar between sites MD1 and MD2. This means that the vertical mixing due to the cooling at lake surface similarly occurred at less than 12 m in depth.
4.3. Temporal Variations of Thermal and Chemical Structures in Lake Katanuma
Using the 1-h data recorded in the mooring systems at sites MD1 and MD2, temporal variations of daily mean water temperature were obtained (Figure 8). In June–September of 2023 and 2024, the thermoclines in Figure 6 clearly exist, while, in early October—middle January of 2023 and 2024 and in late March—early April (2024) or early June (2025), the vertical mixing occurred in the whole layer. Hence, Lake Katanuma belongs to a dimictic lake accompanied by the whole mixing in spring and autumn, irrespective of the high acidity and high geothermal activity. The existence of the clear stratification and mixing indicates that the thermal structure of the lake is controlled by the net heat flux at lake surface rather than the geothermal heat input at lake bottom. In the two winters of December–March, the inverse stratification (less than 3 °C at lake surface and a little more than 4 °C at bottom) occurred, but this stratification was stronger and longer in December 2024–March 2025 than in December 2023–March 2024. This relatively strong stratification is due to the colder winter of December 2024–March 2025, as shown by the lower air temperature in Figure 5. Actually, air temperature averaged over 1 December 2024–31 March 2025 was 0.49 °C, which was lower than 1.64 °C averaged over 1 December 2023–31 March 2024.
Temporal variations of daily mean water temperature (WT) and EC25 obtained from the EC logger at 7 m (10 August 2023–17 September 2024), 9 m (19 September 2024–14 March 2025) and 6 m (17 May–19 November 2025) above lake bottom at site MD1 is shown in Figure 9. Data failure occurred for 15 March–16 May 2025. Irrespective of the three different heights above bottom, the water temperature and EC25 appear to be recorded in a continuous sequence. This is due to the relatively long existence of the C layer in the stratification season of May–September (Figure 6 and Figure 8). Every mid-September, highest water temperature and lowest EC25 occurred almost simultaneously. As shown by Figure 6, Figure 7 and Figure 8, in the stratification season, water temperature increased and EC25 decreased, while, in the mixing season of October–December and March–April or June, water temperature decreased and EC25 increased.
The largest water density at EC25 of 240–400 mS/m (equivalent to 1.23–1.94 PSU (Practical Salinity Unit)) and its water temperature are 1000.99–1001.56 kg/m3 and 3.55–3.71 °C under 1 atm, respectively [11]. In Figure 8, the inverse stratification seems to be established in the winters, irrespective of the bottom temperature at more than 4 °C. This is probably because EC25 slightly increases downward. For example, assuming that EC25 and water temperature are 380 mS/m and 1 °C at lake surface, 390 mS/m and 4 °C in the lower layer, and 400 mS/m and 4.5 °C at bottom, respectively, the water density is calculated at 1001.45, 1001.53 and 1001.55 kg/m3, respectively. This downward increase furnishes the pycnal stability in the whole layer.
Relatively large rainfall often occurred after the snowmelt season of March (Figure 5). For example, the total rainfall for 1 May–30 September 2024 occupied 67.5% of the annual precipitation in 2024. Then, the infiltrated rainwater touched with the underground geothermal heat source is thought to have intruded mainly into the lake as relatively hot but diluted groundwater. The geothermal heat source could be strongest at depths of 4–8 m (B layer) and be gradually weakened at depths of 8–16 m (C layer) and more than 16 m (D layer) (Figure 6). In the mixing season, the net heat flux at lake surface works for cooling and heating the lake in autumn and spring, respectively. In the winters of the inverse stratification, the inflow of groundwater with relatively high EC25 but low temperature seems to have prevailed (Figure 9). The EC25 value finally reached a peak around mid-January. This suggests that the inflowing groundwater reached to a state of equilibrium with lake water for EC25.
Sato [12] investigated thermal and chemical conditions of Lake Katanuma in the mixing, stratification and inverse stratification seasons of 1986–1994. During the stratification,, such a four-layer structure (or three-step structure) of water temperature and salinity as in Figure 6 was then not observed. The water temperature and salinity were vertically almost uniform at more than ca. 4 m in depth, although there existed the non-DO (H2S rich) layer. Sato [12] also found out that, in the mixing season of March, the bottom temperature was relatively high (14.4 °C) at site MD1. However, as in Figure 8, the bottom temperature at site MD1was not high at 5–6 °C. Hence, the inflowing groundwater pathway and the spatial distribution of geothermal heat source below the lake bottom is judged to have changed after 1994. When and how these drastic changes occurred is not clear. Meanwhile, the Iwate-Miyagi Inland Earthquake of magnitude 7.2 occurred on 14 June 2008, which damaged the Naruko Hot Spring Area by seismic intensity of lower 6 (URL https://en.wikipedia.org/wiki/2008_Iwate%E2%80%93Miyagi_Nairiku_earthquake, accessed on 30 June 2026) (Figure 1b). The sedimentary structure of the lacustrine sand-gravel layer, which is the bedrock of Naruko Volcano (Figure 3), may then have changed.
5. Discussion
5.1. Heat Storage Change in Lake Katanuma
Vertical profiles of water temperature, EC25, bulk density and DO at sites MD1 and MD2 in the stratification season of 2025 are shown in Figure 10. At site MD1, the lake water is vertically divided into four layers, A–D, by three boundaries (Figure 6), while, at site MD2, lake water was nearly uniform in the layer deeper than the sill’s top (Figure 2 and Figure 7). As in Figure 6, the intrusion of groundwater with three different water quality is judged to have produced the B–D layers.
Here, by using the thermal difference between the two vertical profiles in each stratification season of 2024 and 2025, the heat storage change was calculated for each of the A–D layers and the E layer deeper than the sill’s top in the southeastern basin including site MD2. Then, the bathymetric map in Figure 2 was utilized to get the volume of each layer. It was then assumed that horizontal water temperature exhibits a same value at a certain depth (i.e., horizontal multilayer structure).
Calculated results are shown in Table 1. The heat flux was calculated by dividing the heat storage change by the area at the upper boundary of each layer. The heat flux for the whole layer of B–E was obtained by dividing the total heat storage change by the area of the boundary between the A and B layers. Of all the layers, the A layer shows the highest heat storage change, but the B layer exhibits the highest heat flux. The heat storage change in the D layer was a little negative in 2024, even though there was an increase in water temperature (Figure 6a). This is because the thermocline became deeper on 17 July.
As shown in Figure 6d and Figure 10d, only the A layer had enough DO. Hence, only the A layer is probably affected by the net heat flux at lake surface, while the lower layers including volcanic gases receive the inflow of groundwater heated geothermally. The B layer seems to receive the strongest geothermal heat because of the highest heat storage change and heat flux. In the northwestern basin (Figure 2), the deeper the layer, the weaker the geothermal heat became. The D layer little contributes to the thermal budget of the lake, although the chemical effect is very large (Figure 6b and Figure 10b). Meanwhile, the E layer in the southeastern basin appears to have an independent heat source below the bottom.
The calculated heat flux at 29.9 and 28.6 W/m2 for the whole layer of B–E is comparable in magnitude to that at 29.0–35.8 W/m2 in 1998–2002 by Shikano et al. [13] and 23.6 W/m2 in 2022 by Goto and Chikita [14]. In Shikano et al. [13], the B–E layer structure was not observed, but the hypolimnion with vertical uniform temperature. Thus, the geothermal heat source below the bottom appears to exist stably, although the spatial distribution may have changed after 2002.
5.4. Chemistry and Its Relations to EC25 and pH
Stiff diagrams of lake surface water and pore water from the sediment, sampled at site MD1 on 28 July 2025 (Figure 10b), are shown in Figure 11. Chemical components of the waters are commonly dominated by sulfate ion, where the pore water exhibits higher acidity and EC25. This characteristic water chemistry is similar to that of the highly acid hot spring in the Naruko hot spring area, ca. 1 km northwest of Lake Katanuma (Figure 1), of which the formation mechanism is explained by Noguchi and Nakagawa [15] as follows:
“Hydrothermal water rising from deep underground (generally, a few kilometers underground) is hot, alkaline, and rich in chlorides, sulfides and other salts. However, upon reaching the surface, the high temperature causes the hydrogen sulfide, initially dissolved in sulfide form, to become free and vaporize. This vapor rises away from the hydrothermal water along with water vapor, where it is oxidized by the air to produce a large amount of sulfuric acid. This sulfuric acid then mixes with shallow groundwater, resulting in the formation of acidic springs.”
Thus, the relatively low temperature of such highly acid hot spring water as in Lake Katanuma is likely due to the mixing with shallow groundwater.
Relations between pH or EC25 and SO42− concentration for lake water and pore water sampled on 28 July 2025 are shown in Figure 12. There exist clearly linear relationships for lake water and pore water. Thus, the in situ measurement of EC25 can provide us with both the SO42− concentration and pH.
A 25. at site MD1 and volume-averaged EC25 is shown in Figure 13. The volume averaged EC25 was obtained by eight vertical EC25 profiles at each of sites MD1 and MD2 in 2023–2025 and the bathymetry in Figure 2, the EC logger and the volume-averaged SO42− concentration, applying Figure 12b. Thus, selecting SO42− as an ion specified in the chemical budget of the lake, the temporal change of total weight for SO42− in Lake Katanuma (left side of Equation (5)) is numerically obtained from the records of the EC logger and lake level in Figure 5. It is because there is also a linear relationship between lake level and lake volume (Figure 14).
5.5. Estimate of Groundwater Inflow and Outflow for Lake Katanuma
By using Equations (6) and (7), groundwater inflow Gin and groundwater outflow Gout for Lake Katanuma were calculated on the base of daily mean data of lake level, surface water temperature and meteorology. First, considering the stability of lake level or lake volume, periods of non-precipitation for more than four days were chosen as the water budget periods. This is because the lake level varied greatly in quick response to the precipitation amount (Figure 5), which could induce a large error in calculated Gin and Gout values. For D = Δ(CLV)/Δt − CRinRin + S in Equation (6), the stream inflow Rin and the stream’s SO42− concentration CRin at site I ranged over 0.0019–0.017 m3/s and 2.6–9.4 mg/L, respectively, thus giving CRinRin = 0.015–0.089 g/s. Here, the depositional flux S with respect to SO42 was assumed to be negligibly small, since deposits such as gypsum dihydrate (CaSO4·2H2O) form only a little in the lake because of the very small amount of Ca2+ (Figure 11). Meanwhile, the rate of change, Δ(CLV)/Δt, in total SO42− of the lake was calculated on the 10 g/s order. Thus, the mass flux CRinRin by stream inflow at site I is also neglected.
First, Gin and Gout in the mixing season were calculated, since the SO42− concentration CGin for groundwater inflow Gin in Equation (6) is uniquely presumed. The budget periods, accompanied by non-rainfall of more than four days were 11–14 October 2023, 30 December 2023–2 January 2024 and 24–27 April 2025 (Figure 5 and Figure 8). Then, CGin was given at 4422 mg/L in the SO42− concentration, corresponding to 395 mS/m (Figure 12a). This CGin value is based on the record of the EC logger at site MD1 (Figure 9), where the EC25 reached to the peak of 395 mS/m on 21 January 2024 after the mixing season and 10 January 2025 before the stratification season. The EC25 peak occurred probably because the SO42− concentrations reached equilibrium between lake water and inflowing groundwater.
Applying this CGin value and the time series of Δ(CLV)/Δt, CL and G calculated from Figure 13 and Figure 14 and the water budget, Gout and Gin were calculated as in Table 2. Relations between lake level and the Gout values are shown in Figure 15. There exists a clear linear relationship between the two variables for the three budget periods. The negative G values at −0.017, −0.010 and −0.023 m3/s decrease lake level at 0.012 and 0.0072 and 0.016 m/day during non-precipitation, respectively. Referring to Figure 14, when a numerical value of 2.453 is added to lake level H0 in Equation (8), the proportional constant g in Equation (10) is given at 7.932 × 10⁻⁶. Similarly, a and b are obtained at 2.415 × 10⁻⁶ and 1.202, respectively.
The Gout values in the stratification season should also hold the linear relationship with the correspondent lake levels or lake volumes. If the linearity given by Gout (m3/s) = 2.415 × 10⁻⁶ V − 1.202 in the mixing season is applied to relations between Gout and V in the stratification season, a unique unknown factor is the SO42− concentration CGin of inflowing groundwater in each budget period.
The CGout values estimated by holding the linearity in the stratification season are shown in Table 3, and the relation between lake volume and Gout, including those in the mixing season, are shown in Figure 16a. Pore water from the sediment sampled on 28 July 2025 gave SO42− concentrations of 2258 mg/L and 1226 mg/L at sites MD1 (19.1 m depth) and MD2 (12.5 m depth), respectively. Similarly, SO42− concentrations of pore water at bottom depths of 0.8 m, 6.2 m and 16.2 m southwest of site MD1 were 1686 mg/L, 2527 mg/L and 2128 mg/L, respectively (Figure 2). Meanwhile, the SO42− concentration for CGin was then estimated at 2241 mg/L (No. 13 in Table 3). Hence, compared with vertical profiles of 28 July 2025 (Figure 10), the groundwater inflow is considered to have occurred in the B–D layers, although Gin in each of the B–D layers is unknown. The Gout and Gin values in Figure 16a were given as Mean ± SD (standard deviation) at 0.258 ± 0.042 m3/s and 0.238 ± 0.041 m3/s, respectively, for the lake volume of 6.05 × 10⁵ ± 1.74 × 10⁴ m3. Hence, the small G (=Gin − Gout) or the small SD is considered to be one of hydrological characteristics of Lake Katanuma, which produces the high adjustability to lake level.
For comparison, a relation between Gout and lake volume for Okama Crater Lake in Zao Volcano is shown in Figure 16b [10]. There also exists the clearly linear relationship for Okama Lake. The Gout and Gin values were then obtained at 0.031 ± 0.014 m3/s and 0.018 ± 0.012 m3/s, respectively for the lake volume of 1.27 × 10⁶ ± 1.44 × 10⁵ m3. Thus, Gout and Gin in Lake Katanuma were 8.3 times and 13.6 times larger than in Okama, respectively, even though the lake volume is 48% of Okama’s volume. The much larger groundwater flow in Lake Katanuma is probably due to the high permeability (probably, the order of K = 0.1–1 m/s) of the lacustrine sand-gravel layer as bed rock. In contrast, the bedrock of Okama is pyroclastic rock with relatively low permeability (probably, the order of K= 10−4–10−3 m/s [16]). Thus, the bedrock geology could control the scale of a groundwater flow system in a volcanic lake.
6. Conclusions
Crater Lake Katanuma in Naruko Volcano, Japan, is dominantly rich in SO42− with high acidity of pH = 1.8–2.2, and is characterized by the vertically three-step structure for water temperature, electric conductivity at 25 °C (EC25) and bulk water density in the stratification season of May–September. Then, in the whole lake, the larger the water temperature, the smaller the EC25. However, the step structure vanished in the mixing season of October–December and March–April, when water temperature, EC25 and bulk water density were vertically almost uniform. Meanwhile, the inverse stratification (water temperature decreases upward from ca. 4 °C at bottom) appeared in mid winters of January—February. Here, the thermal budgets in the stratification season were estimated by vertical temperature profiling and lake bathymetry. Also, in order to clarify the hydrological regime in the lake, the hydrological and chemical budgets of the lake were estimated by using the daily mean data of meteorology, lake level, water temperature and EC25 in 2023–2025. The conclusions are as follows:
- (1)
- The seasonal variation of the thermal structure in the lake basically follows the net heat flux at lake surface, but during the stratification, rainwater infiltration probably produced the lower three layers by the inflow of groundwater heated geothermally with volcanic gas. Then, the three layers is judged to have been produced by groundwater passing through three different pathways under condition of the geothermal heat source varied vertically. The heat source is probably centered at ca. 6 m below lake surface and diminishes downward with increasing SO42− concentration of groundwater.
- (2)
- The water budget estimate in non-rainfall periods always gave the negative net groundwater inflow, meaning groundwater outflow larger than groundwater inflow. The negative net inflow offers the high adjustability to the lake level which could increase greatly in response to heavy rainfalls.
- (3)
- A coupling of the water budget estimate with the chemical budget estimate quantified the groundwater inflow Gin and groundwater outflow Gout in the mixing season, when the peaked SO42− concentration in equilibrium between lake water and groundwater was given as the SO42− concentration, CGin, of inflowing groundwater. The calculated Gout exhibited the linear relationship with lake level or lake volume as evidenced by the Darcy’s law.
- (4)
- Assuming the linearity between Gout and lake level or lake volume, Gin and Gout in Lake Katanuma were quantified also in the stratification season. Compared with the relations between Gout and lake volume for Crater Lake Okama in Zao Volcano, Gout and Gin in Lake Katanuma were 8.3 times and 13.6 times larger than in Okama, respectively, even though the lake volume is 48% of Okama’s volume. The much larger groundwater system in Lake Katanuma is probably due to the high permeability of the lacustrine sand-gravel layer as bed rock.
When and how the three groundwater pathways were built up is not yet clear, since such a step structure was not observed in 2002. The Iwate-Miyagi Inland Earthquake on 14 June 2008 may have changed the sedimentary structure of the bed rock. We need to investigate the current underground structure and groundwater distribution by a geophysical exploration, e.g., by the TEM (Transient Electromagnetic) method, which is suitable for the shallow (50–100 m) underground exploration (URL https://guidelinegeo.com/methods/transient-electromagnetics-tem/, accessed on 26 June 2026).
Author Contributions
Conceptualization, K.A.C., A.G. and J.O.; methodology, K.A.C., A.G., J.O., S.Y., H.O. and K.A.; software, S.Y. and H.O.; validation, A.G., J.O. and S.Y.; formal analysis, K.A.C.; investigation, K.A.C., A.G., J.O. and K.A.; resources, S.Y., H.O. and K.A.; data curation, K.A.C. and A.G.; writing—original draft preparation, K.A.C.; writing—review and editing, A.G.; visualization, K.A.C.; project administration, K.A.C. and A.G.; funding acquisition, K.A.C. and A.G. All authors have read and agreed to the published version of the manuscript.
Funding
This research was funded by the Earthquake Research Institute, the University of Tokyo, Japan, 2023-KOBO29 and 2024-KOBO06 and Center for Northeast Asian Studies, Tohoku University, Japan.
Data Availability Statement
The original contributions presented in this study are included in the article. Further inquiries can be directed to the corresponding author.
Conflicts of Interest
The authors declare no conflicts of interest.
References
- Location Map of Active Volcanoes. Available online: https://www.data.jma.go.jp/vois/data/filing/souran_eng/location.htm (accessed on 20 June 2026).
- Rouwet, D.; Tassi, F.; Mazot, A.; Caudron, C. (Eds.) Volcanic Lake Dynamics and Related Hazards; Frontiers Media SA: Lausanne, Switzerland, 2022. [Google Scholar] [CrossRef]
- Chikita, K.A.; Goto, A.; Okada, J.; Yamaguchi, T.; Miura, S.; Yamamoto, M. Hydrological and Chemical Budgets of Okama Crater Lake in Active Zao Volcano, Japan. Hydrology 2022, 9, 28. [Google Scholar] [CrossRef]
- Chikita, K.A.; Goto, A.; Okada, J.; Yamaguchi, T.; Oyagi, H. Water Cycles and Geothermal Processes in a Volcanic Crater Lake. Hydrology 2023, 10, 54. [Google Scholar] [CrossRef]
- Boehrer, B.; Fukuyama, R.; Chikita, A.K. Geothermal Heat flux into Deep Caldera Lakes Shikotsu, Kuttara, Tazawa and Towada. Limnology 2013, 14, 129–134. [Google Scholar] [CrossRef]
- Chikita, K.A.; Ochiai, Y.; Oyagi, H.; Sakata, Y. Geothermal Linkage between a Hydrothermal Pond and a Deep Lake: Kuttara Volcano, Japan. Hydrology 2019, 6, 4. [Google Scholar] [CrossRef]
- Japan Meteorological Agency. Monthly Report for the Activity of Naruko Volcano; Japan Meteorological Agency: Tokyo, Japan, 2018; 2p. [Google Scholar]
- Omoto, K. Geomorphological Development of the Naruko Basin, Miyagi Prefecture, Northeastern Japan. Geogr. Rev. Jpn. 1966, 39, 521–537. [Google Scholar] [CrossRef]
- Chikita, K.A.; Oyagi, H.; Makino, S.; Kanna, N.; Tone, K.; Sakamoto, H.; Hata, S.; Ando, T.; Shirai, Y. Relations between Freezing and Climate Change in a Mountainous Lake. Jour. Jpn. Soc. Phys. Hydrol. 2020, 2, 3–13. [Google Scholar] [CrossRef] [PubMed]
- Chikita, K.A.; Goto, A.; Okada, J.; Oyagi, H.; Amita, K. Hydrological Regime in Volcanic Lakes Based on Lake-Water Leakage: Review and Interpretation. Jour. Jpn. Soc. Phys. Hydrol. 2025, 7, 3–13. [Google Scholar] [CrossRef] [PubMed]
- Chen, C.-T.A.; Millero, F.J. Precise Thermodynamic Properties for Natural Waters Covering Only the Limnological Range. Limnol. Oceanogr. 1986, 31, 657–662. [Google Scholar] [CrossRef]
- Sato, G. A Formation Mechanism of Water Temperature and Water Quality in Lake Katanuma, Narugo Volcano. Jour. Jpn. Soc. Water Environ. 1995, 18, 829–836. [Google Scholar] [CrossRef]
- Shikano, S.; Kikuchi, E.; Takagi, S.; Doi, H. Volcanic Heat Flux and Short-Term Holomixis during the Summer Stratification Period in a Crater Lake. Limnol. Oceanogr. 2004, 49, 2287–2292. [Google Scholar] [CrossRef]
- Goto, A.; Chikita, K.A. Thermal Activity Surveys on Crater Lake Katanuma Using Limnological Methods. Program Abstr. Volcanol. Soc. Jpn. 2022, A3-06. [Google Scholar] [CrossRef] [PubMed]
- Noguchi, K.; Nakagawa, R. Arsenic Content of the Hot Spring Waters in Narugo and Onikobe Districts, Miyagi Prefecture. Jour. Hot Spring Sci. 1968, 19, 40–47. [Google Scholar]
- Rositha, A.S.; Putra, D.P.K.; Setijadji, L.D.; Hendrayana, H. Porosity and Hydraulic Conductivity of Volcanic Rocks on The Northern Slope of Bromo-Tengger Volcano Complex. In Proceedings of the PIT IAGI 51st 2022, Makassar, South Sulawesi, Indonesia, 25–27 October 2022. [Google Scholar]
Figure 1.
Locations of (a) three volcanoes in Miyagi Prefecture, Japan, and (b) observation sites in the catchment of Katanuma Crater Lake (site M: meteorological station, site L: lake level, site MD1: deepest point) on the topographic map. The red dotted line in (b) shows a water divide of the lake catchment.
Figure 1.
Locations of (a) three volcanoes in Miyagi Prefecture, Japan, and (b) observation sites in the catchment of Katanuma Crater Lake (site M: meteorological station, site L: lake level, site MD1: deepest point) on the topographic map. The red dotted line in (b) shows a water divide of the lake catchment.
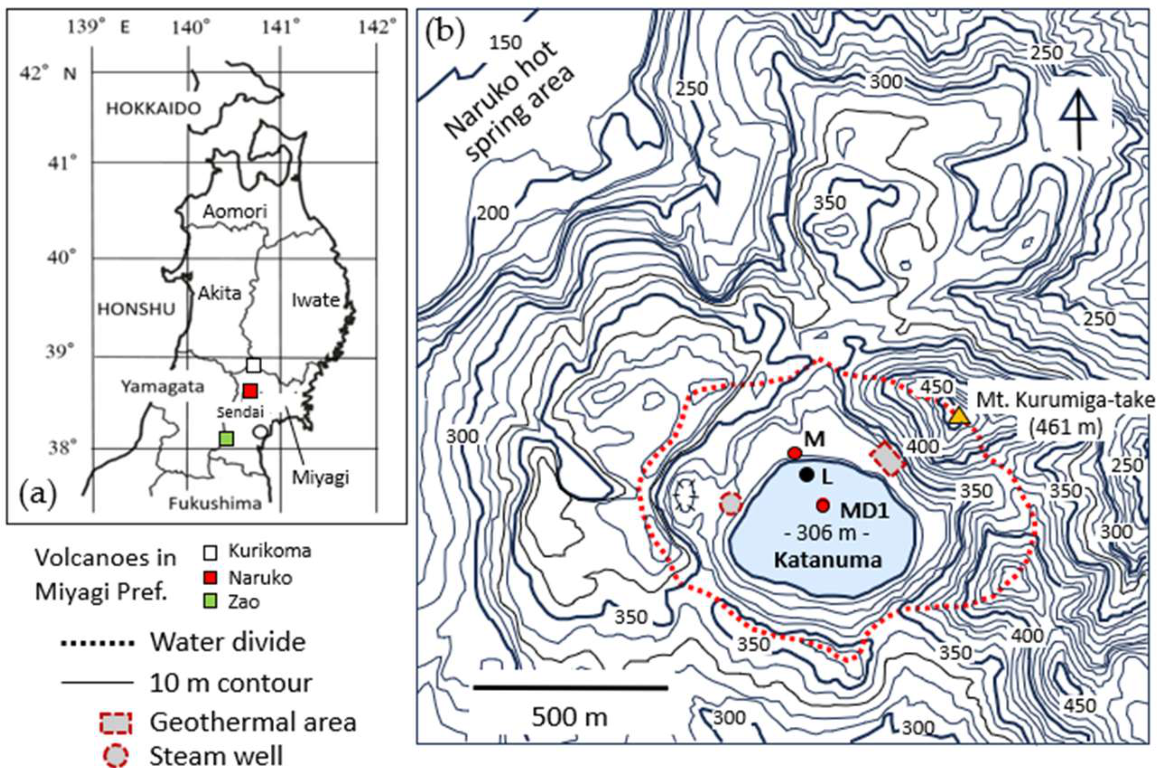
Figure 2.
Bathymetry of Lake Katanuma at a relatively high water level, obtained on the base of echo-sounding on 23 August 2023. There is a subaqueous sill at the point of red square, which divides the lake’s lower basin into northwestern and southeastern parts with maximum points at sites MD1 and MD2, respectively.
Figure 2.
Bathymetry of Lake Katanuma at a relatively high water level, obtained on the base of echo-sounding on 23 August 2023. There is a subaqueous sill at the point of red square, which divides the lake’s lower basin into northwestern and southeastern parts with maximum points at sites MD1 and MD2, respectively.
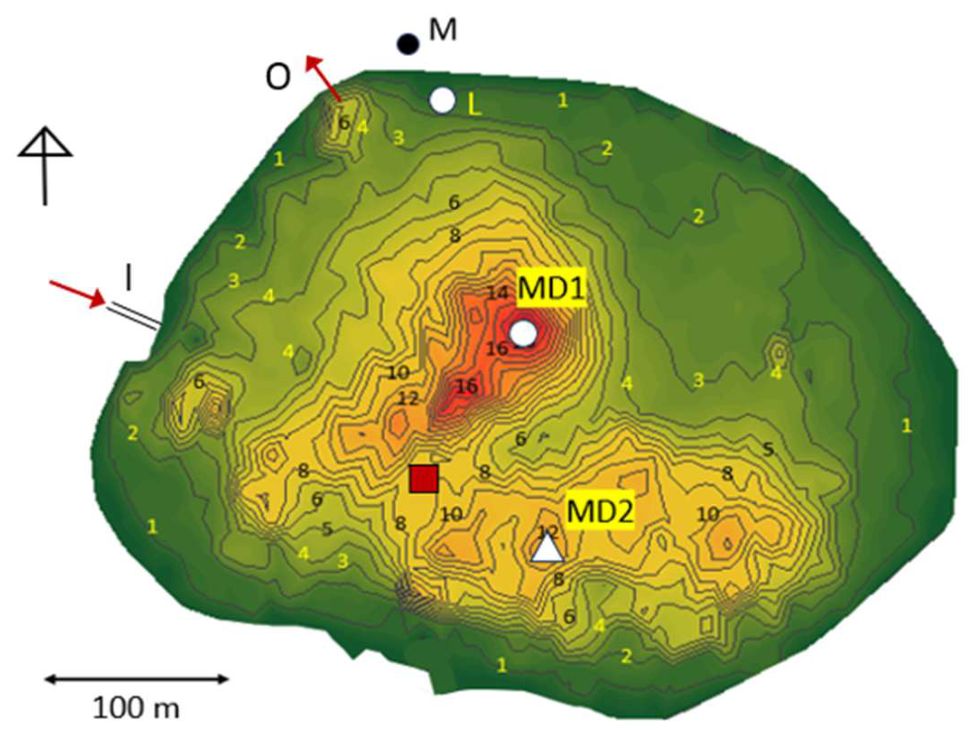
Figure 3.
Geology around Lake Katanuma, categorized on the 3D topographic map. The ages in parentheses of the legend show lower limit ages (Ma) before present.
Figure 3.
Geology around Lake Katanuma, categorized on the 3D topographic map. The ages in parentheses of the legend show lower limit ages (Ma) before present.
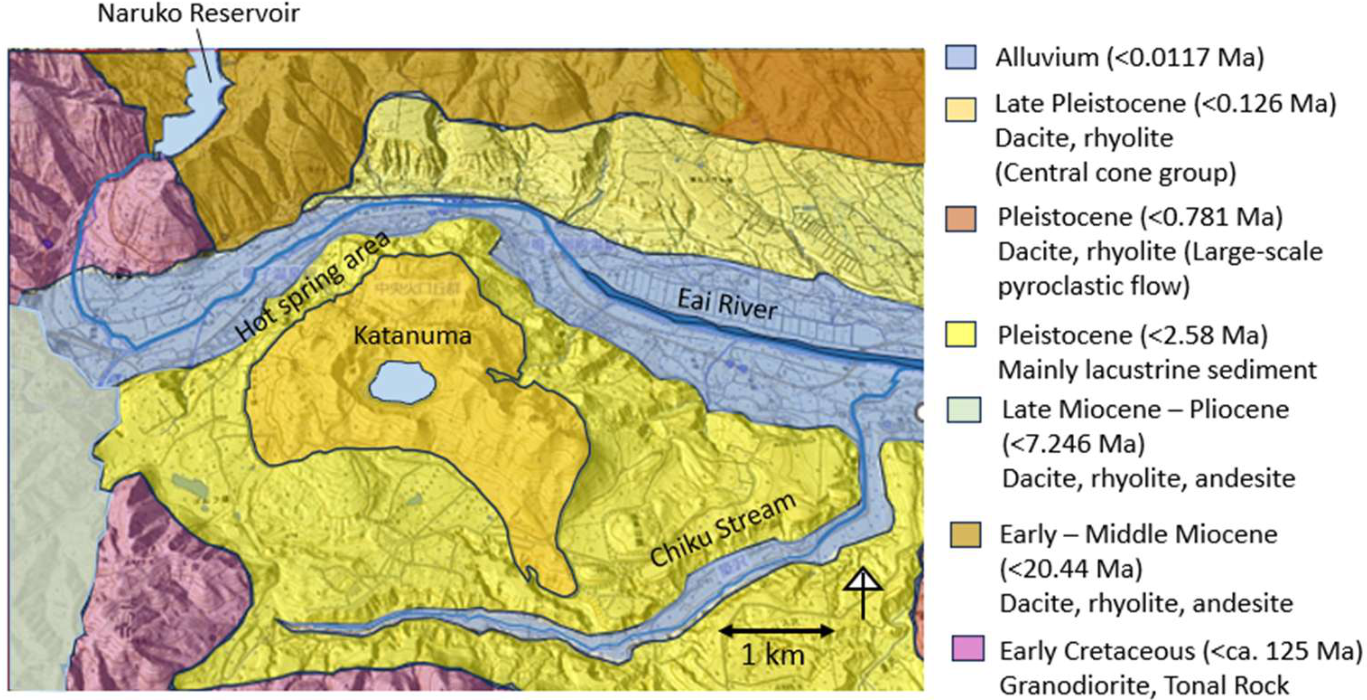
Figure 4.
Mooring systems set at (a) site MD1 and (b) site MD2. The EC logger was set at 6 m, 7 m or 9 m above lake bottom of site MD1, accounting for the sill’s depth in Figure 2.
Figure 4.
Mooring systems set at (a) site MD1 and (b) site MD2. The EC logger was set at 6 m, 7 m or 9 m above lake bottom of site MD1, accounting for the sill’s depth in Figure 2.
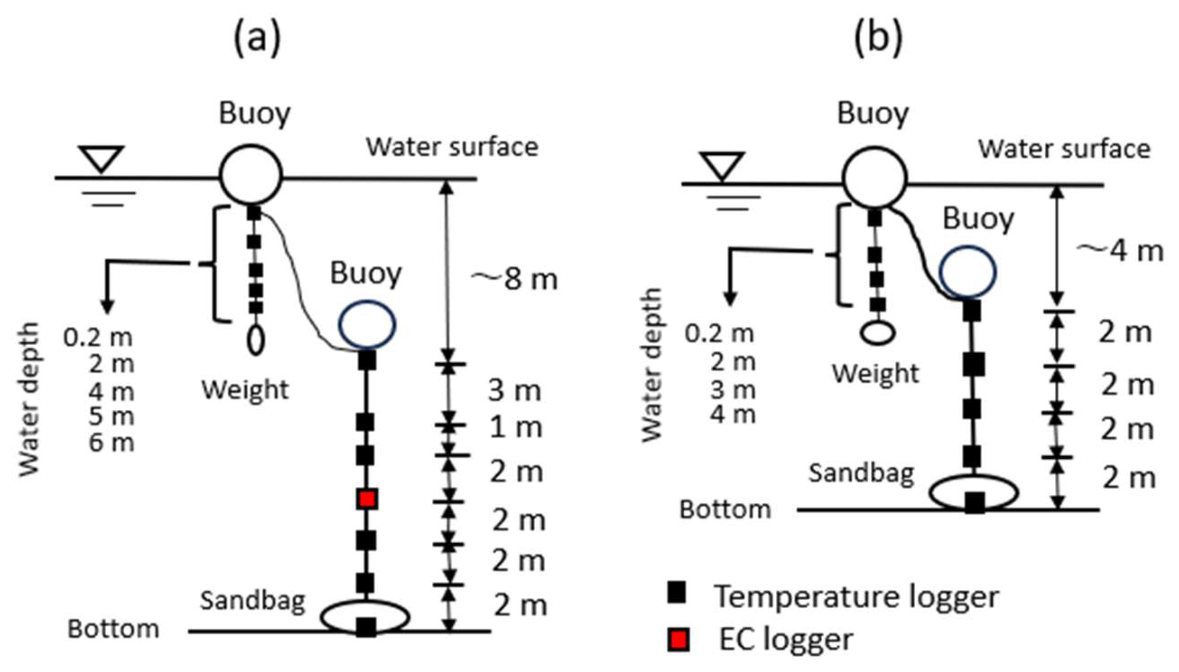
Figure 5.
Time series of daily mean air temperature and lake water level and diurnal precipitation in April 2023–November 2025. The horizontal dotted line shows the upper limit (2.40 m) of water level without outflow at site O (Figure 2).
Figure 5.
Time series of daily mean air temperature and lake water level and diurnal precipitation in April 2023–November 2025. The horizontal dotted line shows the upper limit (2.40 m) of water level without outflow at site O (Figure 2).
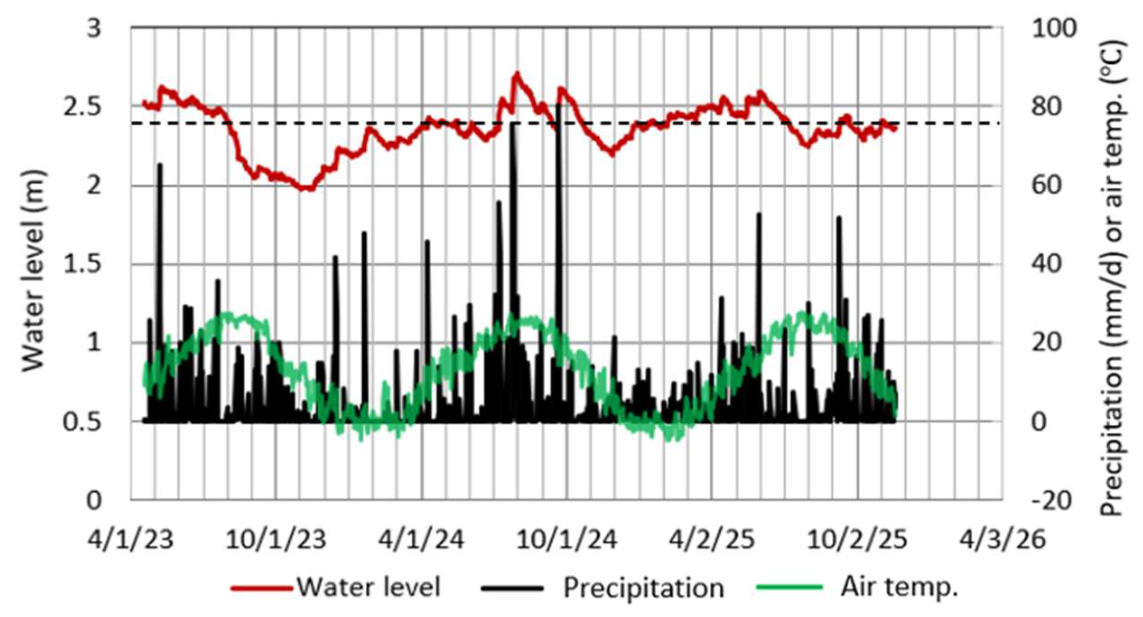
Figure 6.
Vertical profiles of (a) water temperature, (b) EC25, (c) bulk water density and (d) DO at site MD1 in 2024. The dotted lines in (a), (b) and (c) show thermocline, halocline and pycnocline, respectively, by which lake water is divided into four (A–D) layers on 22 May and 17 July, and three layers on 18 September.
Figure 6.
Vertical profiles of (a) water temperature, (b) EC25, (c) bulk water density and (d) DO at site MD1 in 2024. The dotted lines in (a), (b) and (c) show thermocline, halocline and pycnocline, respectively, by which lake water is divided into four (A–D) layers on 22 May and 17 July, and three layers on 18 September.
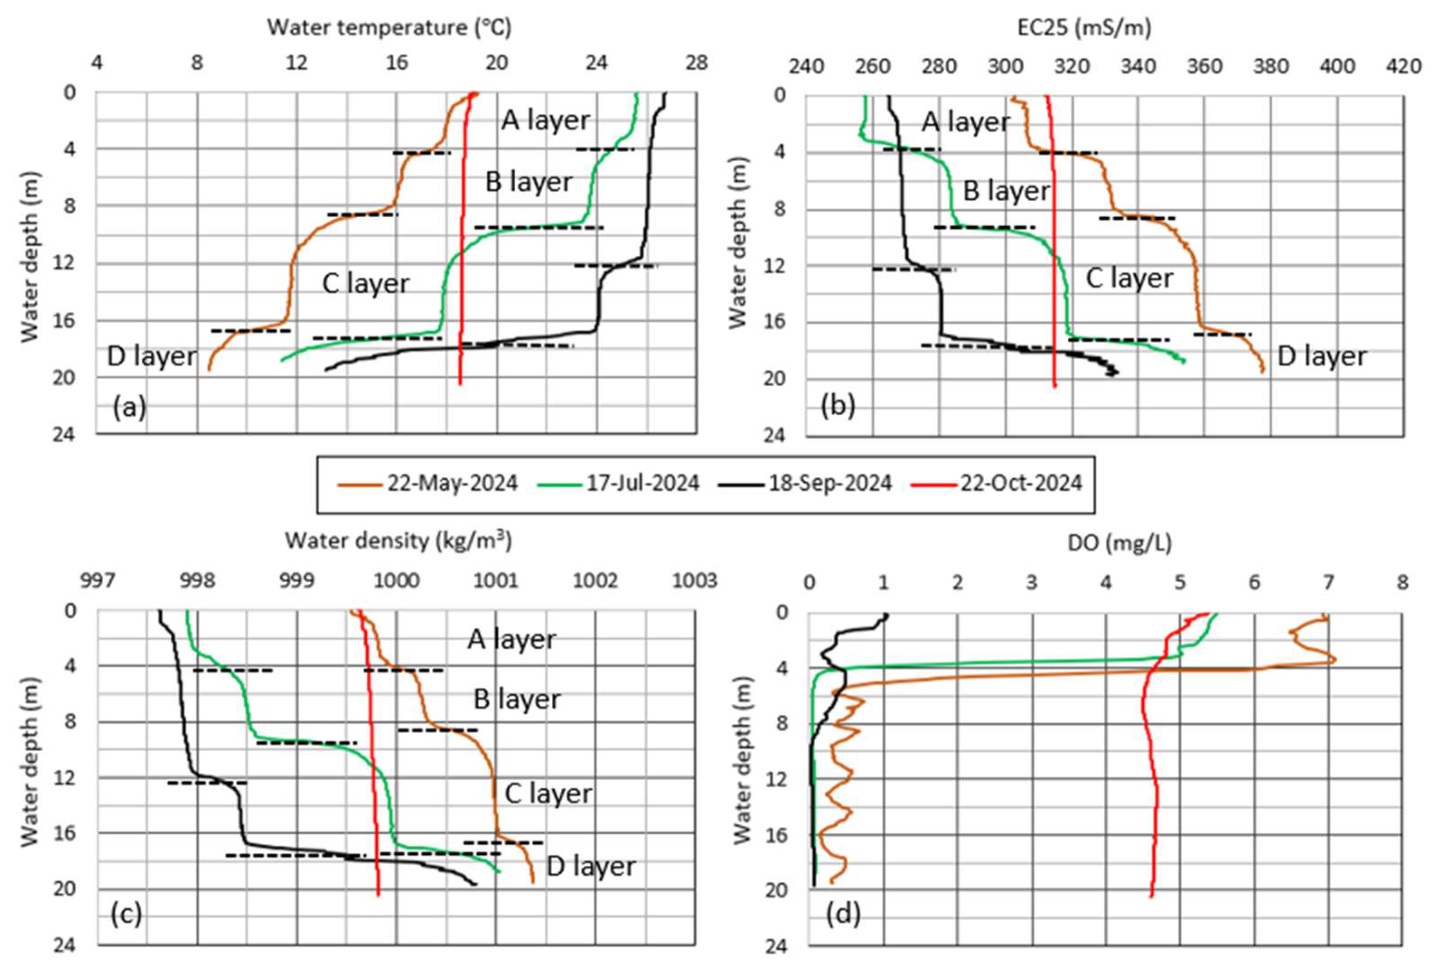
Figure 7.
Vertical profiles of (a) water temperature, (b) EC25, (c) bulk water density and (d) DO at site MD2 in 2024. The black dotted lines show thermocline in (a), halocline in (b) and pycnocline in (c). The “E layer” below each red dotted line is a bottom layer, deeper than the sill’s top at ca. 8 m depth (Figure 2).
Figure 7.
Vertical profiles of (a) water temperature, (b) EC25, (c) bulk water density and (d) DO at site MD2 in 2024. The black dotted lines show thermocline in (a), halocline in (b) and pycnocline in (c). The “E layer” below each red dotted line is a bottom layer, deeper than the sill’s top at ca. 8 m depth (Figure 2).
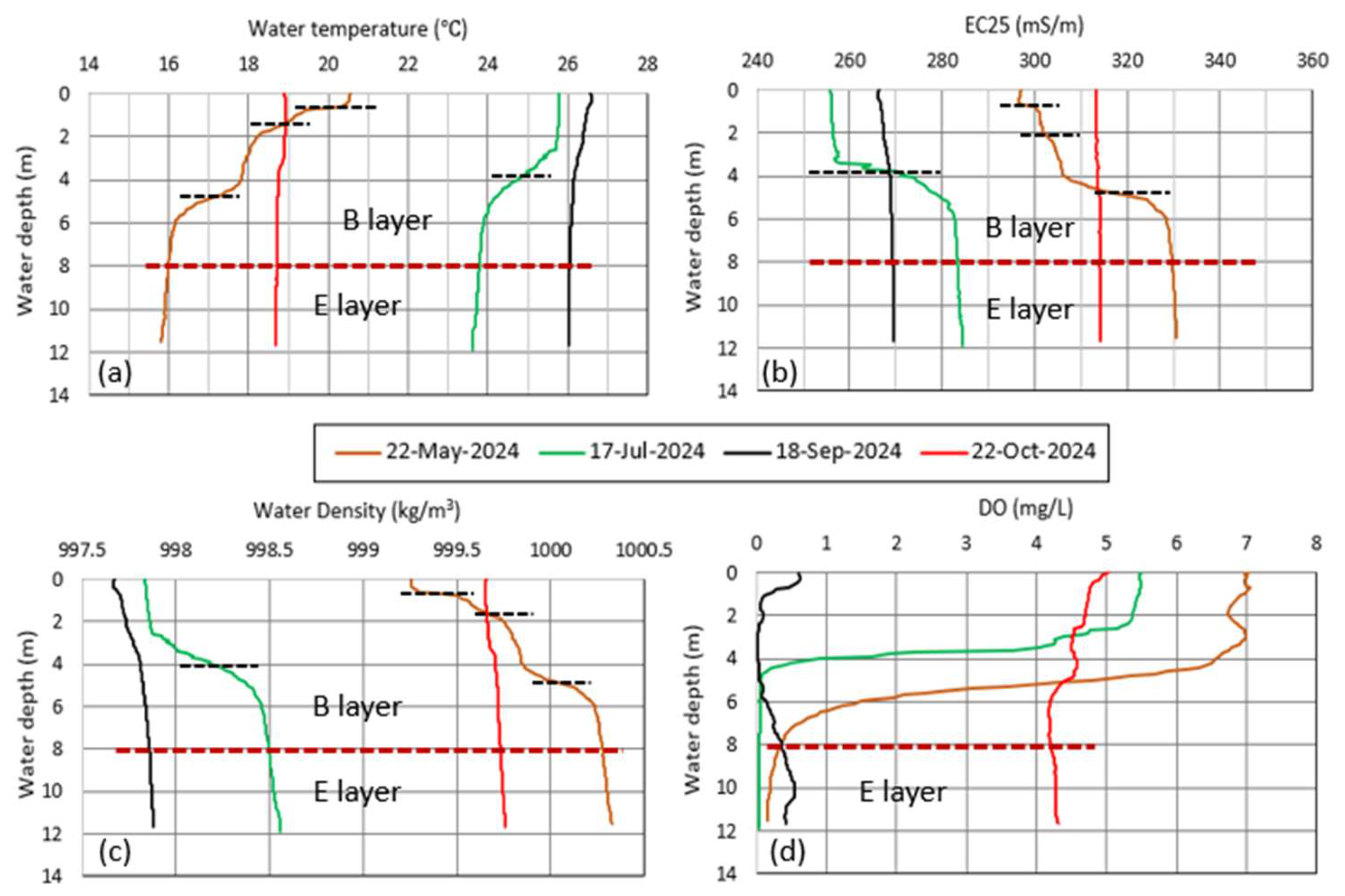
Figure 8.
Temporal variations of daily mean water temperature at (a) site MD1 and (b) site MD2 for 1 June 2023- 1 September 2025. The horizontal dotted lines show the location of thermoclines.
Figure 8.
Temporal variations of daily mean water temperature at (a) site MD1 and (b) site MD2 for 1 June 2023- 1 September 2025. The horizontal dotted lines show the location of thermoclines.
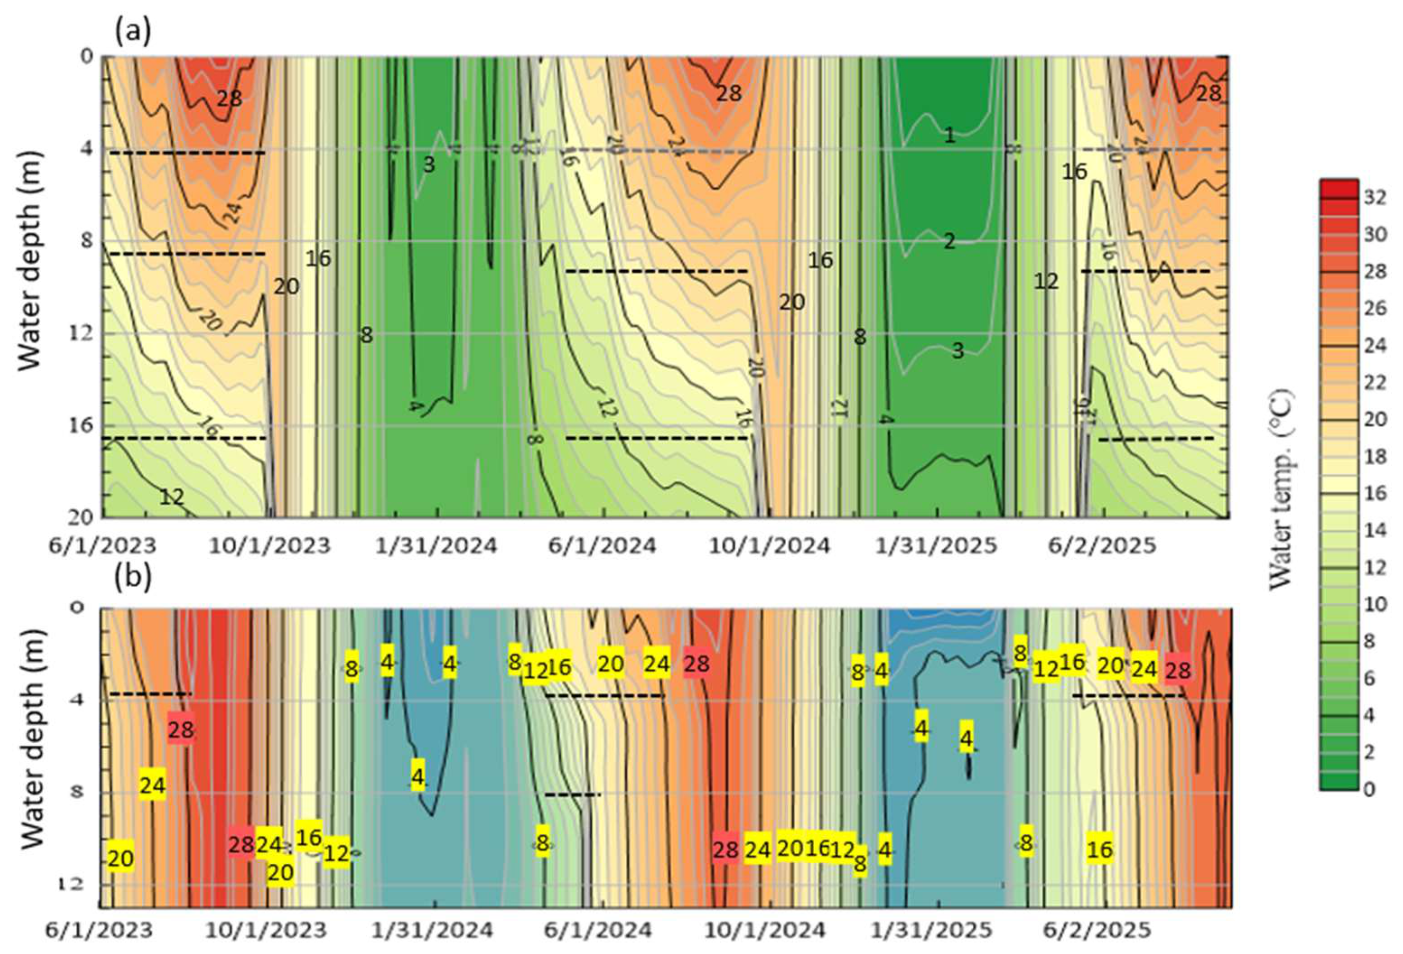
Figure 9.
Temporal variations of daily mean water temperature and EC25 at 6 m (b-6 m), 7m (b-7 m) and 9 m (b-9 m) above the bottom of site MD1 for 10 August 2023–19 November 2025.
Figure 9.
Temporal variations of daily mean water temperature and EC25 at 6 m (b-6 m), 7m (b-7 m) and 9 m (b-9 m) above the bottom of site MD1 for 10 August 2023–19 November 2025.
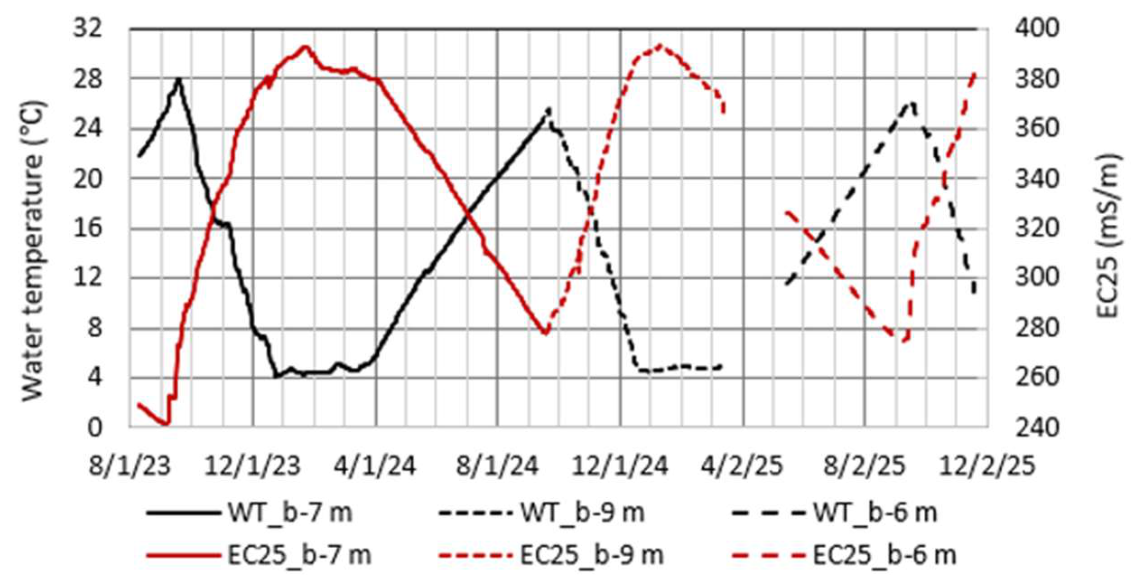
Figure 10.
Vertical profiles of (a) water temperature, (b) EC25, (c) bulk water density and (d) DO at sites MD1 and MD2 on 16 May and 28 July in the stratification season of 2025. At site MD1, lake water is vertically divided into the A–D layers by three boundaries (dotted lines in (a–c)), and, at site MD2, a layer deeper than the sill’s top (Figure 2) exists as the E layer, which is vertically nearly uniform in (a–d).
Figure 10.
Vertical profiles of (a) water temperature, (b) EC25, (c) bulk water density and (d) DO at sites MD1 and MD2 on 16 May and 28 July in the stratification season of 2025. At site MD1, lake water is vertically divided into the A–D layers by three boundaries (dotted lines in (a–c)), and, at site MD2, a layer deeper than the sill’s top (Figure 2) exists as the E layer, which is vertically nearly uniform in (a–d).
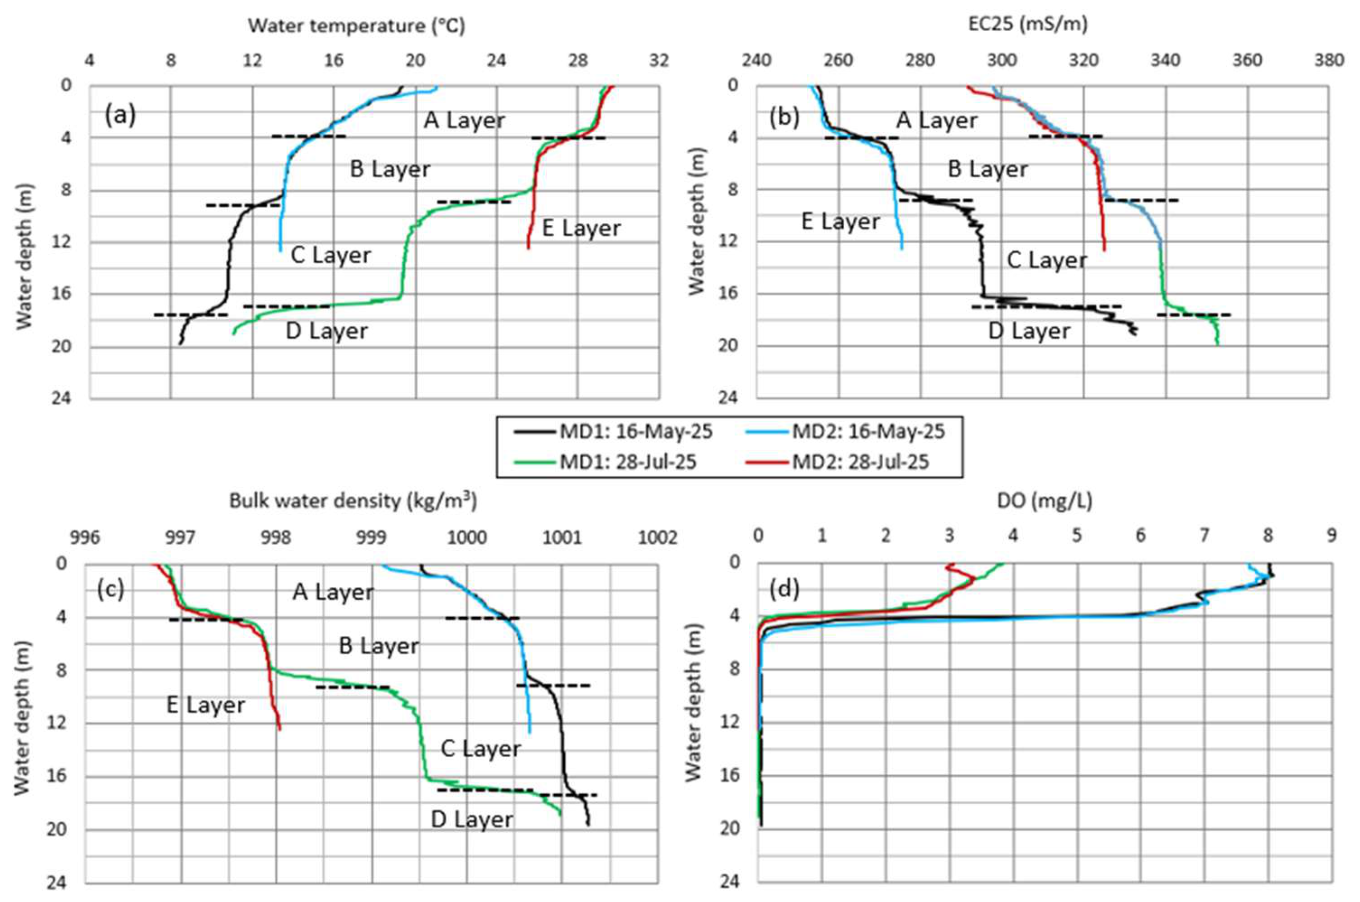
Figure 11.
Stiff diagrams for (a) lake surface water and (b) pore water, sampled at site MD1 on 28 July 2025. Their pH and EC25 values are also shown.
Figure 11.
Stiff diagrams for (a) lake surface water and (b) pore water, sampled at site MD1 on 28 July 2025. Their pH and EC25 values are also shown.
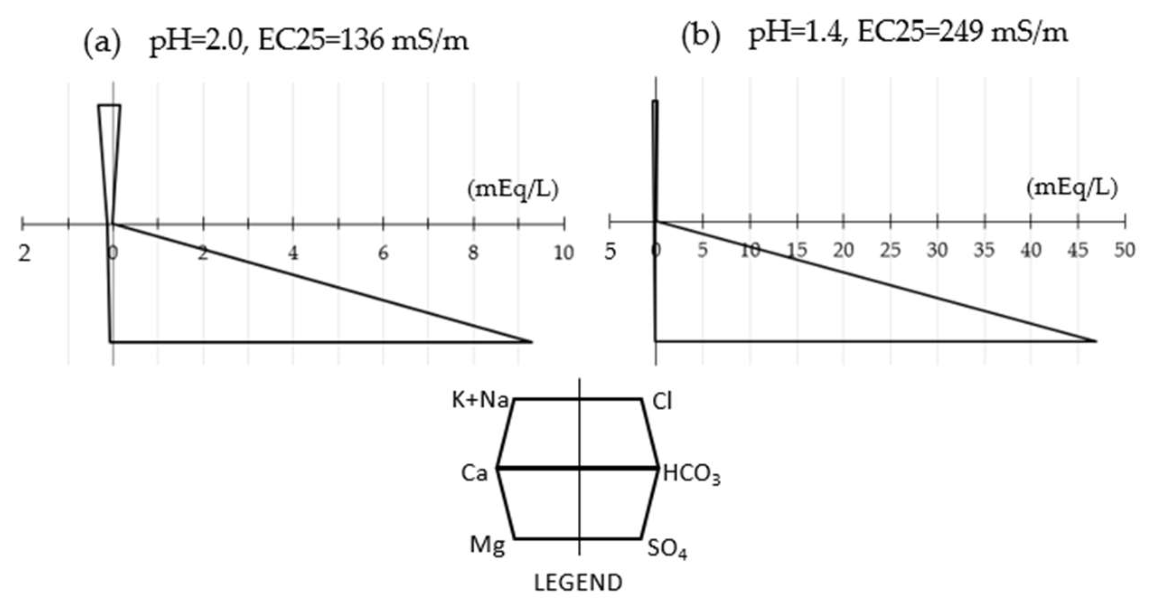
Figure 12.
Relations between EC25 and SO42− concentration for (a) lake water and pore water and for (b) lake water (plots within the oval line in (a)), and (c,d) those between SO42− concentration and pH.
Figure 12.
Relations between EC25 and SO42− concentration for (a) lake water and pore water and for (b) lake water (plots within the oval line in (a)), and (c,d) those between SO42− concentration and pH.
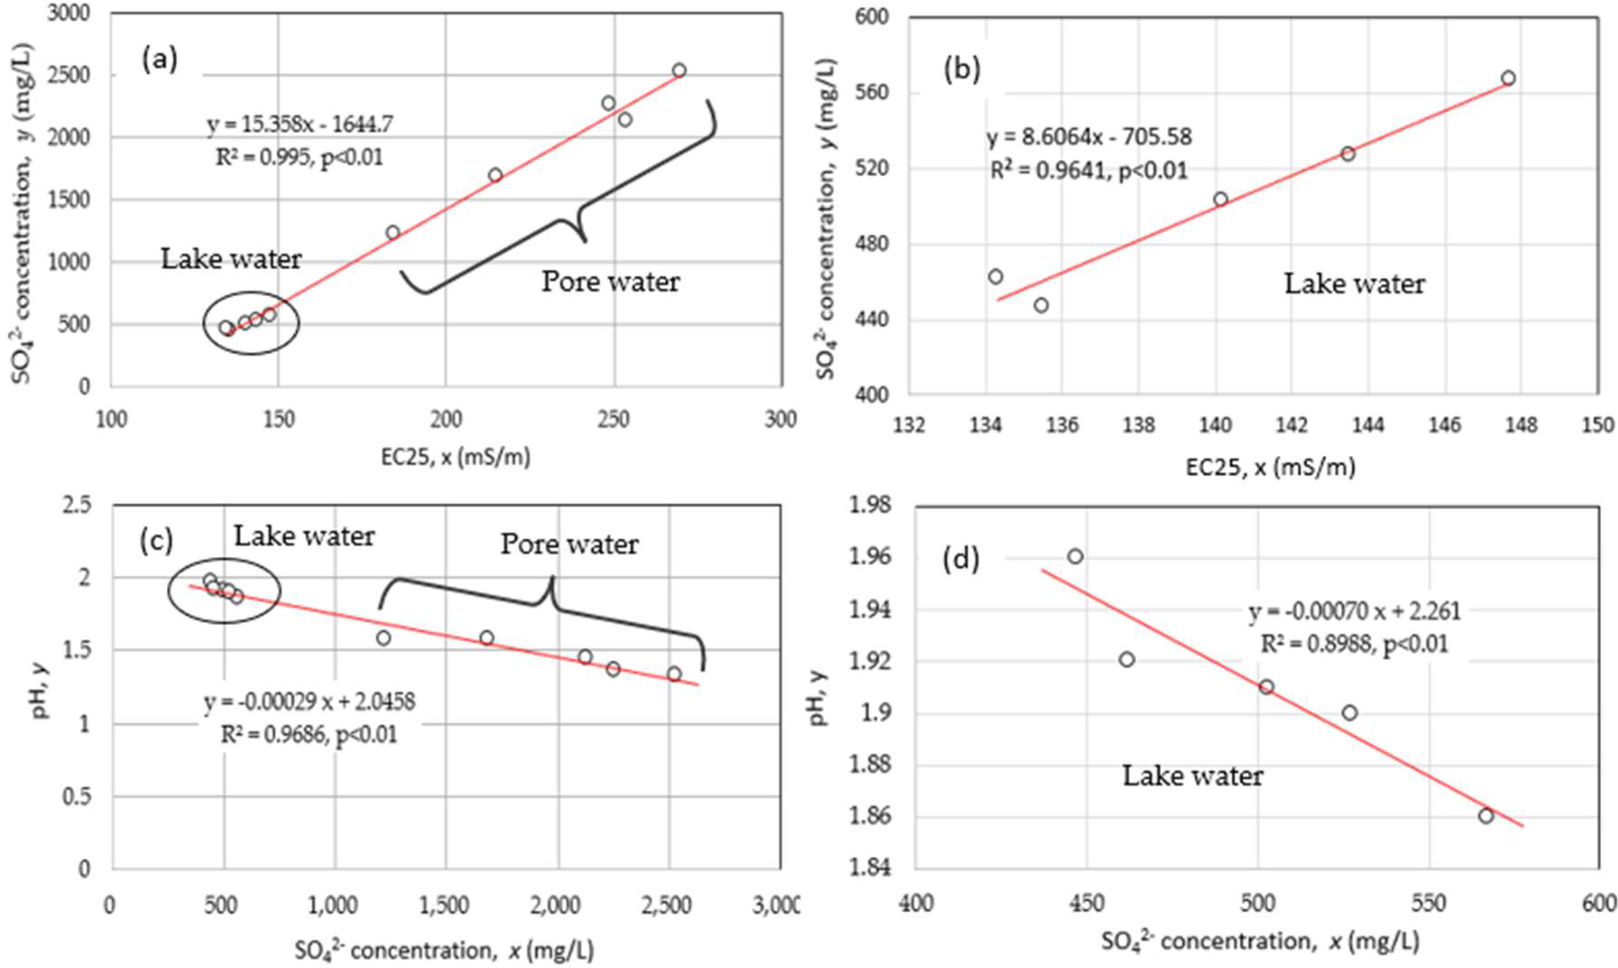
Figure 13.
Relation between EC25 from the EC logger at site MD1 and volume-averaged EC25 from a coupling between eight vertical EC25 profiles at each of sites MD1 and MD2 in 2023–2025 and the bathymetry in Figure 2.
Figure 13.
Relation between EC25 from the EC logger at site MD1 and volume-averaged EC25 from a coupling between eight vertical EC25 profiles at each of sites MD1 and MD2 in 2023–2025 and the bathymetry in Figure 2.
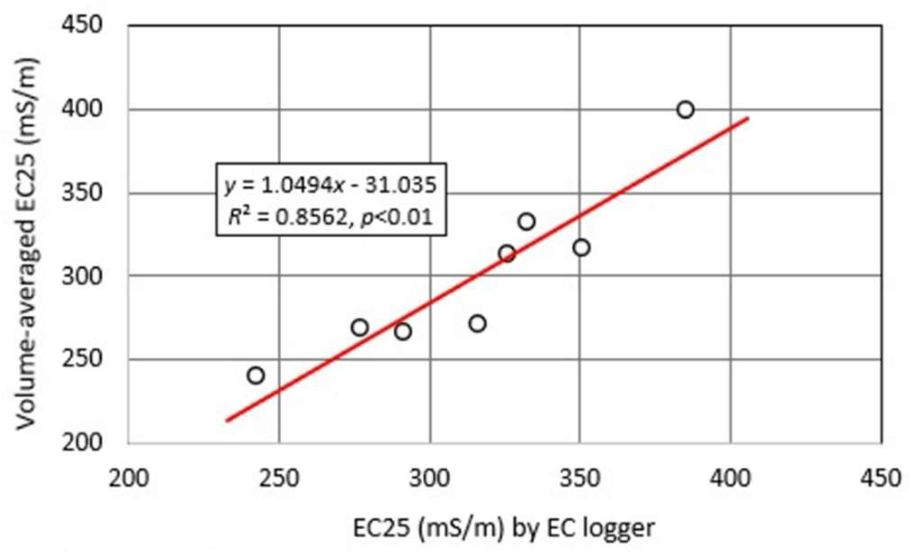
Figure 14.
Relation between water level and lake volume for Lake Katanuma.
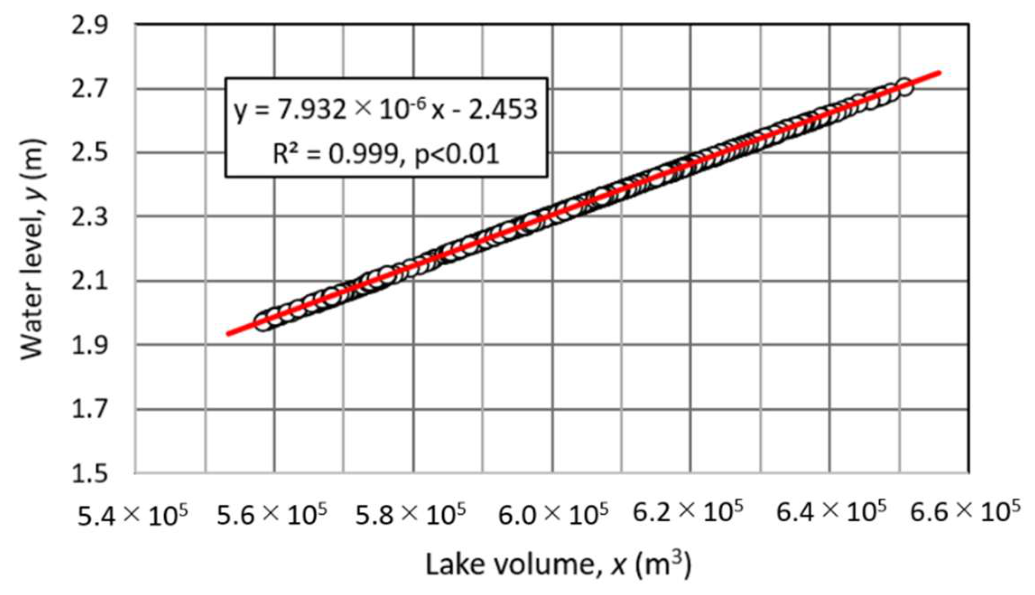
Figure 15.
Relation between lake volume and Gout from Table 2.
Figure 15.
Relation between lake volume and Gout from Table 2.
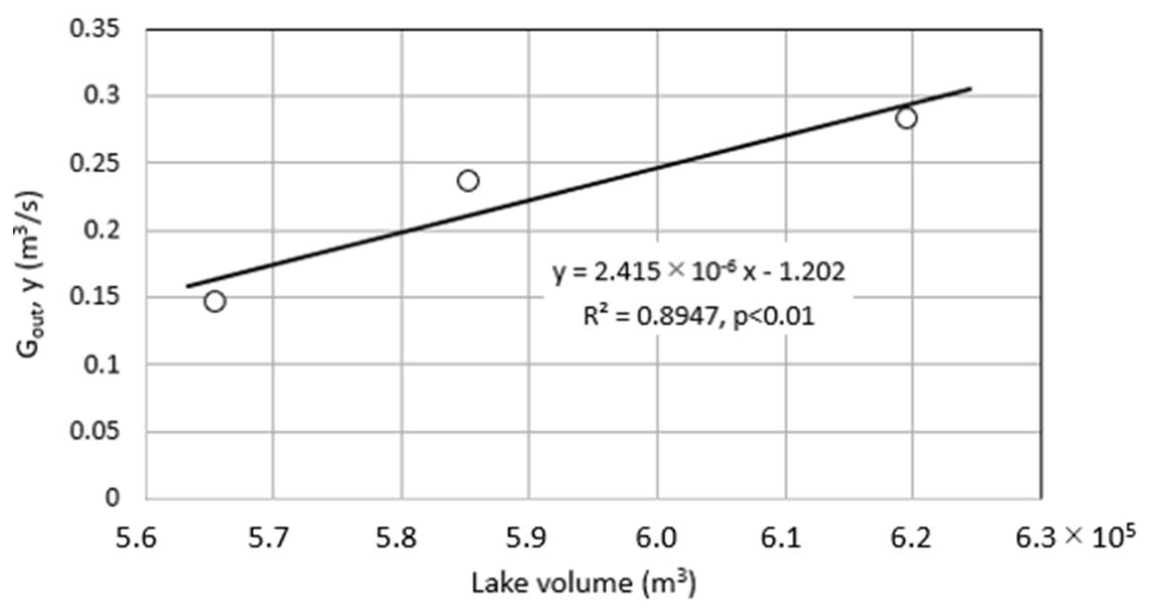
Figure 16.
Relations between lake volume and Gout (a) in the mixing (red plots) and stratification (white plots) seasons for Lake Katanuma and (b) for Okama Lake [10].
Figure 16.
Relations between lake volume and Gout (a) in the mixing (red plots) and stratification (white plots) seasons for Lake Katanuma and (b) for Okama Lake [10].
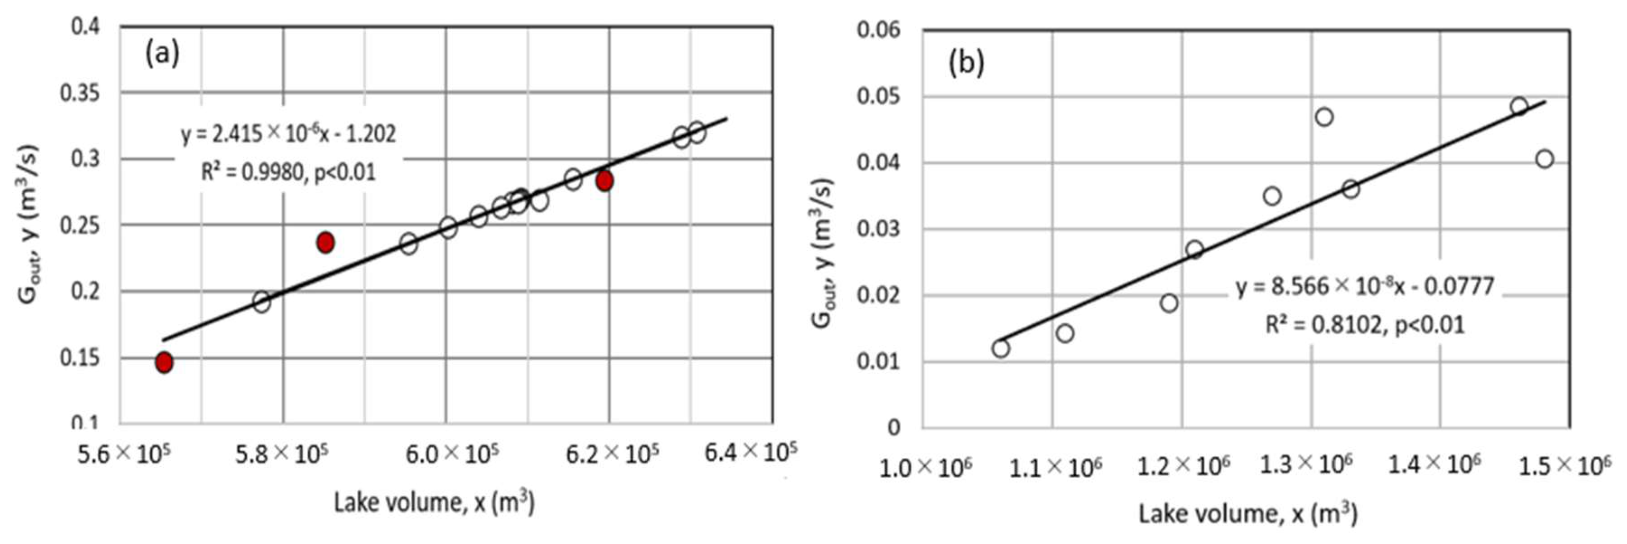

Table 1.
Calculated heat storage change and heat flux for the A–E layers in Figure 6, Figure 7 and Figure 10.
| Time Period | Layer | Heat Storage Change (kW) | Heat Flux (W/m2) |
|---|---|---|---|
| 1256 h, 22 May–1031 h, 17 July 2024 | A B C D E B–E |
2458 1447 250.8 −2.30 110.9 1806 |
19.8 24.4 20.3 −4.69 9.48 29.9 |
| 1450 h, 16 May–1405 h, 28 July 2025 | A B C D E B–E |
2571 1248 259.1 1.10 147.1 1655 |
21.2 22.3 20.9 2.20 12.6 28.6 |
Table 2.
Lake level (WL), lake volume (V) and estimated G, Gin and Gout averaged for three budget periods in the mixing seasons of 2023–2025. Presumed EC25 (mS/m) and correspondent SO42− concentration (mg/L) for CGin are also shown.
Table 2.
Lake level (WL), lake volume (V) and estimated G, Gin and Gout averaged for three budget periods in the mixing seasons of 2023–2025. Presumed EC25 (mS/m) and correspondent SO42− concentration (mg/L) for CGin are also shown.
| Budget Period | Days | WL (m) | V (m3) | Gout (m3/s) | Gin (m3/s) | G (m3/s) | CGin (mS/m) | CGin (mg/L) |
|---|---|---|---|---|---|---|---|---|
| 11–14 Oct. 2023 | 4 | 2.036 | 5.653 × 10⁵ | 0.147 | 0.130 | −0.017 | 395 | 4422 |
| 30 Dec. 2023–2 Jan. 2024 | 4 | 2.202 | 5.852 × 10⁵ | 0.237 | 0.228 | −0.010 | 395 | 4422 |
| 24–27 Apr. 2025 | 4 | 2.482 | 6.194 × 10⁵ | 0.284 | 0.261 | −0.023 | 395 | 4422 |
Table 3.
Lake level (WL), lake volume (V) and estimated G, and Gin and Gout suggested for 13 budget periods in the stratification seasons of 2023–2025. The CGin values in EC25 (mS/m) and correspondent SO42− concentration (mg/L) were given to make it possible to hold the linearity between WL and Gout in Figure 15.
Table 3.
Lake level (WL), lake volume (V) and estimated G, and Gin and Gout suggested for 13 budget periods in the stratification seasons of 2023–2025. The CGin values in EC25 (mS/m) and correspondent SO42− concentration (mg/L) were given to make it possible to hold the linearity between WL and Gout in Figure 15.
| No. | Budget Period | Days | WL (m) | V (m3) | Gout (m3/s) | Gin (m3/s) | G (m3/s) | CGin (mS/m) | CGin (mg/L) |
|---|---|---|---|---|---|---|---|---|---|
| 1 | 21–24 Aug. 2023 | 4 | 2.136 | 5.773 × 10⁵ | 0.192 | 0.173 | –0.019 | 220.7 | 1745 |
| 2 | 10–22 Apr. 2024 | 13 | 2.399 | 6.114 × 10⁵ | 0.269 | 0.247 | –0.022 | 364.7 | 3957 |
| 3 | 26–29 Apr. 2024 | 4 | 2.399 | 6.091 × 10⁵ | 0.270 | 0.247 | –0.023 | 358.1 | 3854 |
| 4 | 1–6 May 2024 | 6 | 2.390 | 6.080 × 10⁵ | 0.267 | 0.247 | –0.020 | 350.4 | 3737 |
| 5 | 8–12 May 2024 | 5 | 2.379 | 6.067 × 10⁵ | 0.264 | 0.245 | –0.019 | 346.8 | 3681 |
| 6 | 4–9 Jun. 2024 | 6 | 2.397 | 6.090 × 10⁵ | 0.269 | 0.241 | –0.028 | 332.0 | 3454 |
| 7 | 11–15 Jun. 2024 | 5 | 2.356 | 6.039 × 10⁵ | 0.257 | 0.234 | –0.023 | 324.9 | 3346 |
| 8 | 18–22 Jun. 2024 | 5 | 2.326 | 6.002 × 10⁵ | 0.248 | 0.225 | –0.023 | 320.9 | 3284 |
| 9 | 18–21 Aug. 2024 | 4 | 2.573 | 6.308 × 10⁵ | 0.321 | 0.294 | –0.027 | 221.6 | 1759 |
| 10 | 9–13 Sep. 2024 | 5 | 2.451 | 6.156 × 10⁵ | 0.285 | 0.259 | –0.026 | 233.6 | 1943 |
| 11 | 5–9 Jun. 2025 | 5 | 2.558 | 6.288 × 10⁵ | 0.316 | 0.303 | –0.013 | 284.8 | 2729 |
| 12 | 6–9 Jul. 2025 | 4 | 2.392 | 6.088 × 10⁵ | 0.268 | 0.249 | –0.019 | 267.4 | 2462 |
| 13 | 17–31 Jul. 2025 | 15 | 2.286 | 5.953 × 10⁵ | 0.236 | 0.220 | –0.016 | 253.0 | 2241 |
Disclaimer/Publisher’s Note: The statements, opinions and data contained in all publications are solely those of the individual author(s) and contributor(s) and not of MDPI and/or the editor(s). MDPI and/or the editor(s) disclaim responsibility for any injury to people or property resulting from any ideas, methods, instructions or products referred to in the content. |
© 2026 by the authors. Licensee MDPI, Basel, Switzerland. This article is an open access article distributed under the terms and conditions of the Creative Commons Attribution (CC BY) license (http://creativecommons.org/licenses/by/4.0/).
Copyright: This open access article is published under a Creative Commons CC BY 4.0 license, which permit the free download, distribution, and reuse, provided that the author and preprint are cited in any reuse.


