

Submitted:
17 July 2026
Posted:
20 July 2026
You are already at the latest version
Abstract
This study aims to forecast South Africa’s import demand for cassava starch using monthly data from April 2015 to December 2030. It applies Augmented Dickey-Fuller (ADF) to verify the stationarity of the series, while the Akaike criterion and Schwarz criterion were utilized to select the fitted model of ARIMA (p, d, q). The series were integrated of order one, and the best-fitted model was ARIMA (0,1,2). Thereafter, the Box-Jenkins estimation strategy was used to forecast the import demand for cassava starch. The forecasted import demand for cassava starch showed a steady increase in quantity, with an annual average import demand of 12 032 tons between 2025 and 2030. Given South Africa’s rising cassava starch imports, we endeavored to forecast demand thereof, considering the absence of commercial cassava production and processing in the country. This is the first empirical study to offer a thorough forecasting of the rising trend in Southern Africa’s demand for cassava starch imports. To manage the growing demand for cassava starch in South Africa, policymakers should consider medium- to long-term interventions to further develop the value chain. The most urgent and critical need is to fund research and development (R&D) for the advancement of the cassava value chain, as well as to establish phytosanitary-certified nurseries for producers to access high-quality planting materials.
Keywords:
agro-processing
; autoregressive integrated moving average (ARIMA) model
; cassava starch
; South Africa
1. Introduction
Forecasting refers to the process of examining the behaviour of a particular phenomenon in the past to predict what can happen for it now and in the future based on events from the past and present [1]. Forecasting the import demand for cassava starch for South Africa is important given the rising domestic consumption needs. Nowadays, cassava (Manihot esculenta. Crantz) is deeply entwined with the intricate human and environmental systems throughout tropical Africa [2,3,4,5,6]. Whereas cassava is considered a crop for the twenty-first century, with several uses including food [7,8], animal feed [9,10], pharmaceuticals including bioethanol [11,12], packaging and building materials [13,14], its value chain is underdeveloped and underutilized in Southern Africa.
Moreover, even though cassava production in Africa accounts for nearly half of the global production (FAOSTAT, 2024), minimal agro-processing into high-value products such as starch is done when compared to Asia. The limited agro-processing of cassava has exacerbated the increasing reliance on imports of highly processed cassava products. For instance, in 2023, cassava starch was by far the most imported into Southern Africa of all starch types and was valued at R193.7 million, of which more than 95% was destined for South Africa [15]. This is equivalent to a six percent annual growth rate in the import value between 2019 and 2023. All imported cassava starch is used within the country, except for the negligible quantities of cassava starch (less than 3%), which is re-exported to other countries within Southern Africa. This is therefore a clear indication of the growing demand for cassava starch in the country.
Over the years, the increasing demand for cassava starch for industrial use in South Africa, among other factors, including climate change, sparked interest to develop the cassava value chain in the country. During the mid-2000s, the Agricultural Research Council (ARC) of South Africa embarked on experimental field trials in three provinces—Mpumalanga, Limpopo, and KwaZulu-Natal to assess suitable agroecological areas for cassava production. On the other hand, academic institutions also embarked on specialized research about the crop. For instance, the biodiversity, evolution, and epidemiology of cassava begomoviruses and whitefly vectors in southern Africa were investigated at the University of the Witwatersrand (WITS) through the plant biotechnology programme. WITS successfully engineered transgenic cassava that showed increased starch content in the tubers or increased resistance to cassava mosaic disease. Other academic institutions have contributed towards the mentoring of graduate students in various fields of specialisation, including breeding and agricultural economics as exhibited by literature (for example: [3,16,17].
However, none of the existing work empirically tackles the observed increasing trend in the volume and monetary value of cassava starch imports into South Africa, although there are no known cassava starch processors in South Africa [18,19]. The problem is compounded by the fact that cassava production is at a subsistence level in the country [8,20,21], and there is no production-related data despite its relevance in making informed strategic policy decisions and interventions to further develop the value chain. Closely related work done by the Industry Development Corporation (IDC) [22] only assessed historical trends of cassava starch imports into South Africa but never forecasted the import demand thereof. It is against this background that in this paper, we forecast the import demand for cassava starch in South Africa. To the best of our knowledge, this is the first empirical work to forecast the import demand for cassava starch in Southern Africa. Given the fluctuating volume of cassava starch imports, it is envisioned that findings of this study might be of great significance and used as a guide by stakeholders and policy makers in the making of informed policy decisions and interventions to further develop the value chain.
2. Insight into the Trade Performance of Cassava Starch
As an insight into the trade performance of cassava products, global trade is dominated by Southeast Asia and East Asia [23], whereby traded products include chips, pellets, flour, and starch. China is the main importer of cassava starch, accounting for approximately 80% of global trade, while in Southern Africa, South Africa is the leading and a net importer of cassava starch. Apart from 2022, during which potato starch was marginally higher (see Figure 1), cassava starch has over the years been the most imported type of starch (by volume). Between 2010 and 2016, South Africa’s imports of cassava starch greatly fluctuated from as low as 14 489 tons recorded in 2013 to the highest record of 20 255 tons in 2010. However, thereafter, the volume of imports stabilised until the last three years (2020–2023), when a 35.9% drastic decline was registered. The decline is attributable to the COVID-19 pandemic outbreak period during which the restrictive measures imposed disrupted the global supply chain [24,25,26,27].
South Africa’s leading suppliers of cassava starch are Thailand, Viet Nam, Brazil and Mozambique, in that order. Whereas South Africa exports negligible quantities of cassava starch to neighboring countries, it is highly probable that it is repackaged starch, which is then re-exported, given that there is no known cassava starch processor in the country [18,19]. It is against this background that in this paper, we forecast the import demand for cassava starch in South Africa. To the best of our knowledge, this is the first empirical work to forecast the import demand for cassava starch in Southern Africa. Given the fluctuating volume of cassava starch imports, it is envisioned that findings of this study might be of great significance and used as a guide by stakeholders and policy makers in the making of informed policy decisions and interventions to further develop the value chain
2. Methodology
2.1. Data
This study used secondary monthly data spanning 135 months (from January 2015 to March 2024) obtained from the ITC’s TradeMap database [28] (https://www.trademap.org/) to forecast the import demand of cassava starch. The import data of cassava starch is expressed in tons. Before the econometric estimation, testing for stationarity of the series and evaluating the autocorrelation of the residuals were done to achieve a technically sound forecasting performance in time series models. Both the line graph and statistical testing approaches were used. Following Ogundeji et al. [29] and Hill et al. [30], we tested stationarity using the Augmented Dickey-Fuller (ADF) unit root test to detect the order of integration to prevent unreliable results from spurious associations [31,32].
In contrast to the alternative hypothesis that the time series is stationary, the ADF test is used to determine if the time series has a unit root (is non-stationary). The ADF unit root models consist of (i) a random walk process with drift (ADF with α) and (ii) a random walk with drift and linear time trend (ADF with α and T). Mathematically, the ADF is expressed as follows.
Random walk with drift.
Random walk with drift and linear time trend.
where, is the time series of the variable, is the order of difference, is the constant term, is the time trend, and are the coefficients of the variable of interest; t is the time lag starting from 1, 2, 3, …...p, while is the error term. At a 95% significance level, if the p-value is less than 0.05%, then the time series exhibits stationarity at the normal stage. Thus, the null hypothesis that the series are not stationary is rejected. Such a series is integrated at order I (0). However, if the series exhibits non-stationarity, it was differenced and tested again until the series are stationarity. In instances where the time series exhibited a unit root at the first difference, it was concluded that it contains the unit root at order I (1).
2.2. Box-Jenkins Estimation Strategy
The Box-Jenkins estimation strategy was used to forecast the import demand for cassava starch from 2024 up to 2030. The Box-Jenkins methodology, developed in 1976 by Box-Jenkins, is a structured procedure for determining, fitting, and analysing autoregressive integrated moving average (ARIMA) models for time series data [33,34]. Numerous studies have successfully employed this approach, including the forecasting of tourism demand [35,36], production and price forecasting in the agricultural sector [34] and migration [37,38].
Within the South African context, the Box-Jenkins approach can offer useful insights into the future demand for cassava starch. This is because an accurate import demand forecast is essential for efficient resource allocation and planning. This strategy can assist in making accurate predictions about future demand levels by evaluating previous import data and spotting patterns and trends [39]. Furthermore, prior comparisons of the Box-Jenkins method with other forecasting methods, such as regression models, have demonstrated its efficacy in capturing the dynamics of demand fluctuations [40]. This comparison demonstrates the superiority of the Box-Jenkins technique under specific conditions, highlighting its applicability and importance in predicting South Africa’s import demand for cassava starch.
Using the Box-Jenkins approach to forecast South Africa’s import demand for cassava starch can provide various value chain stakeholders and policymakers with important information about the trade. One of the most effective forecasting techniques is the Box-Jenkins strategy, which can examine any set of observations. Box et al. [41] posits that each variable can be described by its own previous or lag values as well as stochastic error terms. With the use of the ARIMA model and historical import data analysis, precise forecasts may be produced to support resource management and informed decision-making. Forecasting using the Box-Jenkins procedure entails four separate steps, namely: ARIMA model identification, model estimation, diagnostic checking, and forecasting [42,43] as elaborated further in the subsequent paragraphs. Three parameters make up ARIMA (p, d, q) models, that is, p denoting the autoregressive model’s order, d is the order of differencing, and q is the order of the moving average.
Step 1: We identified the appropriate forecasting ARIMA model using the correlogram plots. At this stage, the aim was to get the values p, d, and q required in the generic linear ARIMA model to get the preliminary parameter estimations. The values of p and q, as defined above, were identified using the Partial Autocorrelation Function (PACF) and Autocorrelation Function (ACF), respectively, while the value of d is equivalent to the number of differencing done to make the series stationary [34]. The values of q and p that produced the most economical and efficient model were then used to determine the final model selection. The parsimonious model’s refusal to promote overfitting served as the driving force behind this. Compared to other competitive models that fit the relevant data, it advocates using fewer parameters with a significantly higher degree of freedom (df) [44]. The study made sure that the guidelines and post-diagnostic conditions found in the literature ultimately guided the model selection process, preventing overfitting [45].
Step 2: At a 5% level of significance, Maximum Likelihood Estimation (MLE) was used to estimate coefficients p, d, q in the ARIMA model. In general, a simple form of the ARIMA model is written as:
where Xt denotes the series of interest (in this case cassava starch imports), and are the parameters of the model, while is the random error term, p is the number of lags of the autoregressive terms, and q is the number of lags of the moving terms. Mathematically, the ARIMA (p, d, q) components are expressed as: The autoregressive component p assumes that observation Xt is linearly influenced by the preceding observations as:
where is a coefficient of the previous period.
For the integrated process, nonstationary series provide a good example, such that the difference between two consecutive values of X is assumed to be constant in a differentiation of order 1. This can be expressed as:
Whereby the error term is white noise. On the other hand, given one or more prior error terms, the moving average component, q, is a linear function of the current error term. It displays the number of prior periods incorporated in the present value [46]. Mathematically, it is expressed as follows:
Following Meher et al. [47], the model with the lowest volatility, highest R-square ((R2), the greatest number of significant coefficients, and least values for the Akaike Information Criterion (AIC) [34,48], the Bayesian Information Criterion (BIC) [34,49], and the Hannan and Quin Information Criterion (HQC) [50,51] was chosen as the best fit model.
In step 3, diagnostic checking was executed to test for serial correlation using the Ljung-Box (QLB) statistic following [52,53,54]. To identify outliers, trends, or any set pattern, time plots of the residuals plotted against time were used. In a similar vein, the residuals were checked for normality using the Q-Plots. The model is only deemed to be a good match when most of the points are in line and closer to the normal line, as demonstrated by the normal Q-Q plots, which compare a sample’s distribution to a theoretical distribution [44]. Whereas the overall appropriateness of the model was verified using the Ljung-Box Q Statistics [45,55], the Autocorrelation Function (ACF) plot was also used. As a rule of thumb, a well-fitting model is one in which most of the sample autocorrelation coefficients of the residuals randomly fall within the 95% confidence interval limits.
Step 4: Forecasting. In the absence of serial correlation, the chosen model was then used to forecast cassava starch import demand for the 2024-2030 period. In this study, forecasting was done using the ARIMA following the Box-Jenkins technique [54,56]. In this study, the analysis was done using STATA 17 software to forecast the import demand of cassava starch for 6 years ahead, starting from March 2024 to December 2030.
3. Results and Discussion
3.1. ADF Unit Root Stationarity Test
According to Figure 2 (panel on the left side), the original series of the imported cassava starch generally exhibits an increasing trend with time, indicating the series are not stationary. However, when the series were first differenced, Figure 2 (panel on the right side) suggests that the trend cleared, implying that stationarity was achieved.
However, to be very sure of the stationarity, the Augmented Dickey-Fuller (ADF) unit root test was employed on the first difference series. In this context, the ADF test equation with only the intercept term and no trend was employed to test for stationarity because the differenced series varied around a non-zero sample average and exhibited no trend, as seen in the panel on the right side of Figure 2. The test results presented in Table 1 show that the absolute value of the ADF test statistic (4.589) of the first differenced series exceeds all the absolute test critical values at all levels of significance. Thus, the series has a unit root, and the null hypothesis (H0) cannot be rejected.
3.2. Identified Model
Based on the correlograms displayed in Figure 3, the original data exhibited significant autocorrelations outside of the 95% confidence interval as shown in the Autocorrelation Function (ACF) plot (panel on the left side). Moreover, the dataset exhibited elements of both AR(p) and MA (q) (see Figure 3 & 4); thus, more than one ARIMA models were found for the data series, estimated, and the various coefficients were examined. Autocorrelations for the ACF correlogram are noticeable from lags 1 and 2, but very gradually diminish to zero. In contrast, lags 1, 27, and 33 for the Partial Autocorrelation Function (PACF) plot are significantly outside of the 95% confidence zone (panel on the right side).
However, the series becomes stationary when the ACF and PACF graphs of the series with the first difference are inspected (see Figure 4). The ACF and PACF plots of the differenced series were used to identify the most appropriate model of the three ARIMA models: ARIMA (0,1,1), ARIMA (0,1,2), and ARIMA (0,1,4). The predictive abilities of the fitted ARIMA models were evaluated using the values of the R-squared (R2), number of significant coefficients, AIC, BIC, HQC, and volatility.
The most suitable model for forecasting the import demand of cassava starch was ARIMA (0,1,2) (see Table 2), as it had a high number of significant coefficients, the lowest AIC and BIC values, as well as HQ and Volatility.
After the estimation of the ARIMA (0,1,2) model, a diagnostic test was performed to check whether the residuals fit the model specification using the portmanteau test for white noise. Figure 4 indicates that all the eigenvalues lie inside the unit circle and both AR and MA parameters satisfy the stability condition.
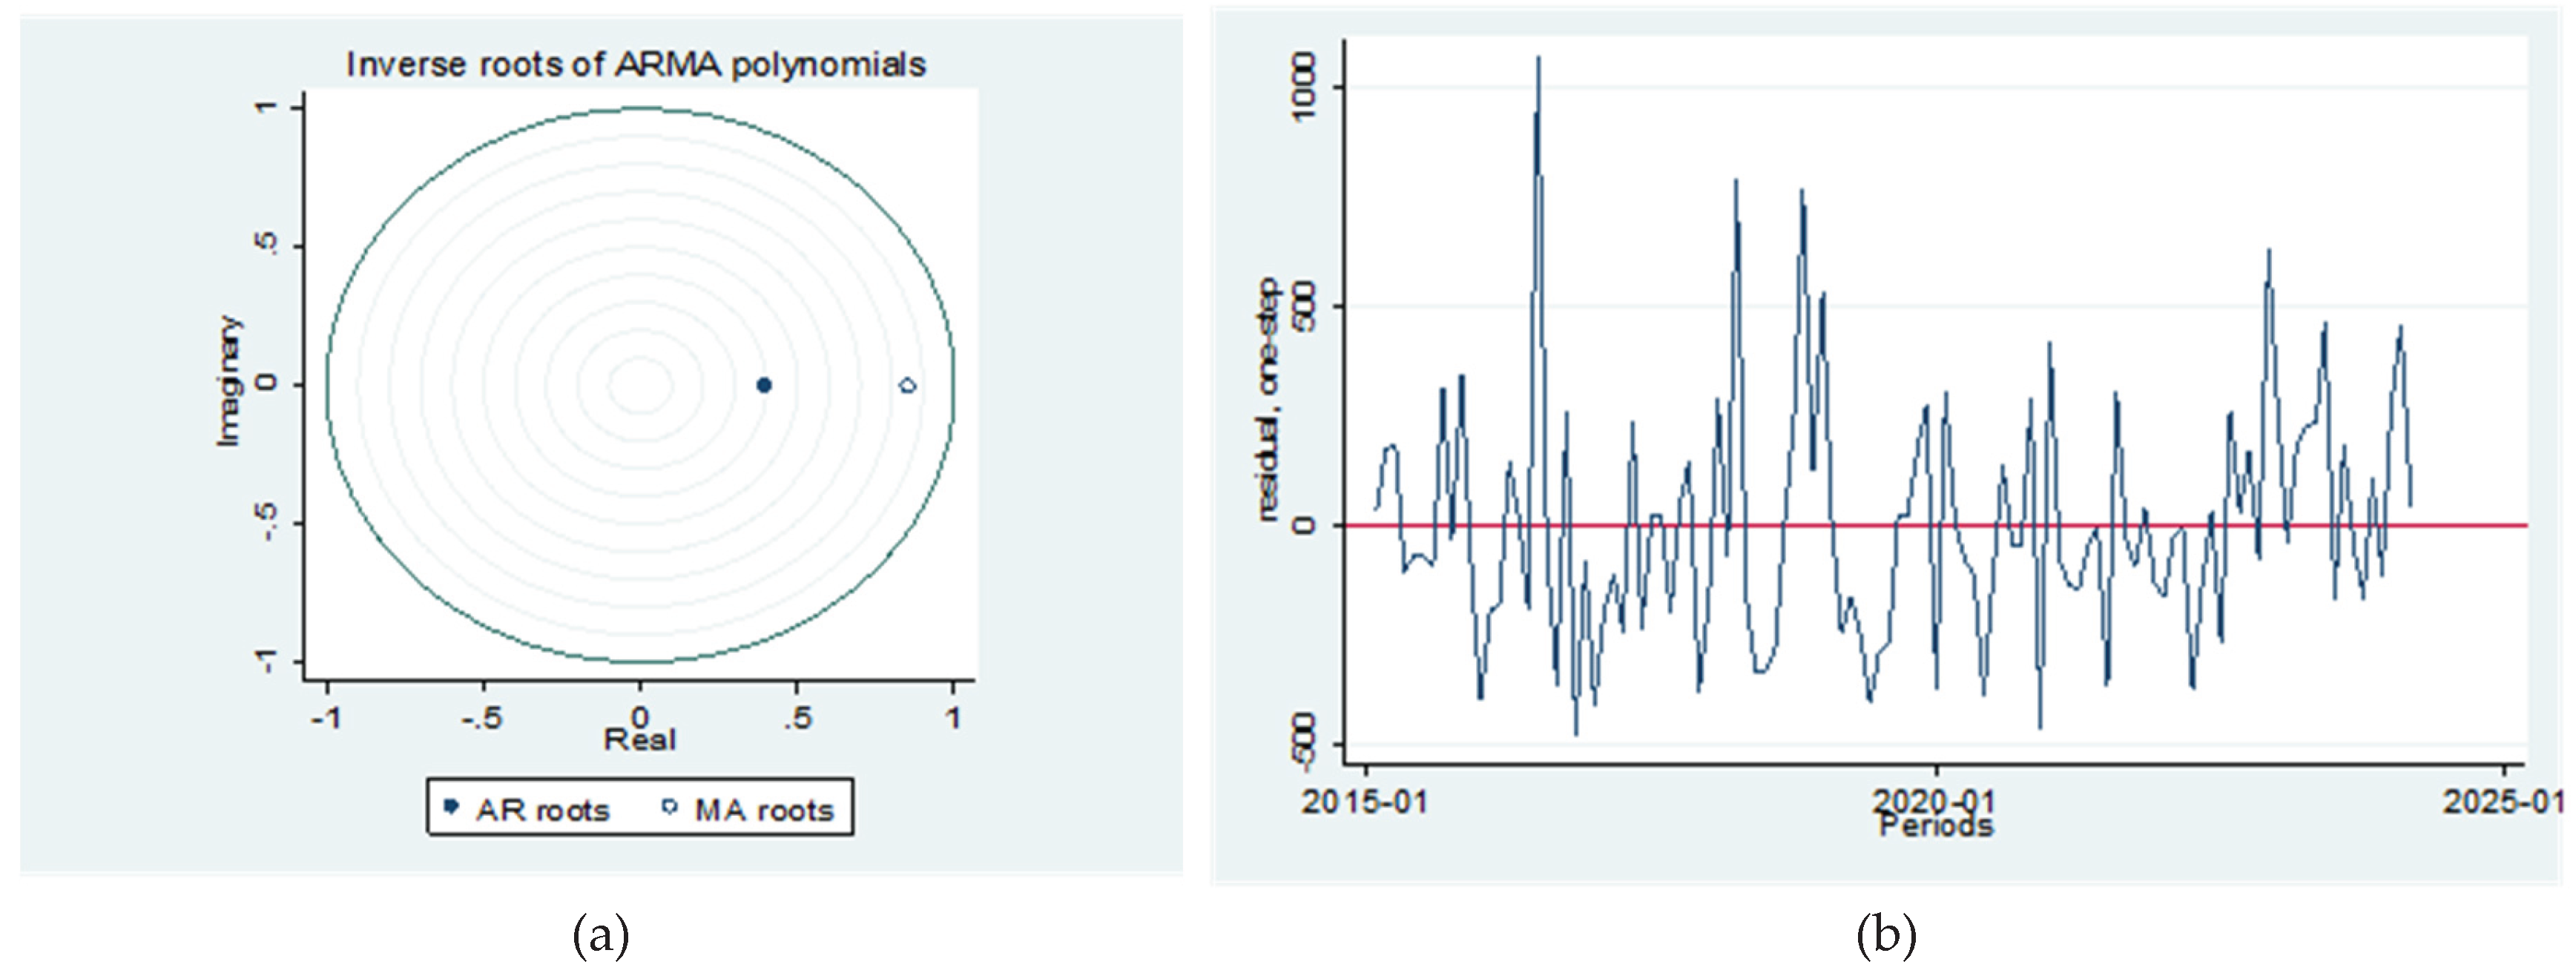
Figure 5.
Diagnostics test for residuals. Source: Authors’ elaboration based on data extracted from ITC’s TradeMap database.
Figure 5.
Diagnostics test for residuals. Source: Authors’ elaboration based on data extracted from ITC’s TradeMap database.
Thus, the distribution of the historical series of import demand for cassava starch showed that ARIMA (0,1,2) was the best fit. Thereafter, the model was deployed to forecast the cassava starch import demand for the next six years (April 2024 until December 2030).
3.3. Forecasted Import Demand for Cassava Starch
The projected import demand for cassava starch from April 2024 to December 2030 is presented in Figure 6, showing a consistent rise in the volume of imported cassava starch. Cassava starch imports were estimated to be 945 tonnes in April 2024 and 1 140 tonnes by December 2030. Over time, it is anticipated that cassava starch imports will increase gradually, thereby affirming that South Africa’s demand for cassava starch has been rising in the past. growth pattern underscores the necessity of strategic planning in both public and private domains to effectively manage and use the growing demand for cassava starch.
Figure 7 illustrates the projected import demand from early 2024 to December 2030, as well as the actual quantities of cassava starch imported from January 2015 to March 2024. The blue line depicts the actual quantities of cassava starch imported, while the orange line shows the projected import demand for cassava starch from April 2024 to December 2030. When compared to the historical data, the predicted data generally reveals a slow but steadily increasing pattern. The actual import demand is expected to peak in April 2024, thereafter, rise gradually until October 2030, when it is expected to reach about 1 200 tonnes. This shift from an unstable past to a stable future could be the result of better supply chain management following the Covid-19 outbreak disruptions [57], better market conditions, or more accurate demand forecasting techniques.
From an annual perspective, Table 3 presents aggregated forecasted cassava starch imports. On average, South Africa’s cassava starch import demand was projected at 12 032 tonnes per year over the 6 years (2024 to 2030), but the total imported volume was forecast at 84 222 tonnes by 2030. The rise in the forecasted cassava import demand between 2025 and 2030 equates to an annual growth rate of 15.85%. This is much higher than the observed -2% annual growth in the quantity imported between 2019 and 2023 (ITC 2024c). The large disparity in estimated annual growth rate is attributed to the COVID-19 outbreak at the start of 2020, which culminated in disruptions of global supply chains, negatively impacting trade and other economic activities globally [57,58].
However, since the relaxation of the stringent COVID-19 restrictions, the quantity of cassava starch imports increased by 90.7% between 2022 and 2023, an equivalent 82% increase in annual growth in value [59]. After 2025, the annual growth is expected to remain stable, ranging between 400–800 tonnes. Therefore, there is a need to boost cassava production and processing thereof into starch, among other products, to meet the increasing demand, as exhibited by the forecast consistent rise in the imported volume. This also calls for the full participation of the private sector to get ready in anticipation of higher volumes. Participation of the private sector could be through increased investment in agro-processing infrastructure in proximity to cassava-producing areas, coupled with more deliberate financial support to smallholder producers to enable a sustainable supply of fresh cassava tubers for processing.
This finding confirms a rising demand for cassava starch and other derived products in South Africa as noted by [8,16,19,60,61], who attribute it to reasons like population growth, the growing usage of cassava starch and flour in a variety of industries (food processing, biofuels, … etc.). For instance, cassava flour and starch are good substitutes in the food industry for the costly wheat flour [62,63]. Moreover, Caccamisi [64] posits that the growing demand is due to the absence of vertical integration between farmers and processors, which exacerbates the eminent postharvest challenges associated with the crop [65]. Furthermore, the ITC’s TradeMap database [66] confirms that South Africa’s untapped import potential of cassava starch is worth US$ 4.27 million.
5. Conclusions
Cassava is both a key food and an industrial crop globally. However, minimal agro-processing into high-value products such as starch is done in Africa, compelling many countries to rely on imports. In South Africa, for instance, cassava is hardly grown at a commercial level, and the value chain is underdeveloped, thus exacerbating the observed increasing trend in cassava starch imports for both food and industrial purposes. Therefore, this study used the ARIMA model by executing the Box-Jenkins methodology to forecast South Africa’s cassava starch import demand from April 2024 until December 2030. As far as we are aware, this is the first empirical study to predict Southern Africa’s need for cassava starch imports. Findings of this study are envisioned to assist policymakers and economic planners in making informed decisions on strategic interventions needed to further develop the cassava value chain in the country, with much emphasis on agro-processing.
Based on the study’s findings, it is prudent to conclude that the demand for cassava starch imports has been erratic, with notable peaks and troughs between January 2015 and early 2024. However, the forecasted volume suggests a change towards a more stable and predictable market during the next six years, starting from early 2024 to October 2030, with an annual average (2025–2030) cassava import demand of 12 032 tons. Given that there are no known cassava starch processors in South Africa, which is a net importer of cassava starch, there is a need to heed the call by government (as enshrined in the Agricultural Policy Action Plan (APAP) and Industrial Policy Action Plan (IPAP), among other policy documents) to foster domestic production to minimise reliance on imports. There must be a deliberate effort to implement the import substitution agenda.
Thus, the study recommends that policymakers should consider medium-to-long-term strategies and interventions to successfully and sustainably manage the increasing cassava starch demand. Such strategies and interventions include the urgent need to invest in research and development (R&D) for the further development of the cassava value chain. Specifically, there is a need to boost sustainable primary production to ensure a reliable supply of low-cost cassava roots, coupled with substantial investment in agro-processing, as emphasized by [64]. The boosting of sustainable primary production can be achieved through providing increased access to good quality and affordable planting material by producers. High-quality, pest- and disease-free planting materials can only be bred through R&D using expensive cutting-edge technologies. Practically, there is a need to establish certified nurseries in production areas through which producers can easily acquire pest- and disease-free planting materials. The establishment of certified nurseries can be achieved under the guidance of the Agricultural Research Council (ARC), a duly mandated institution in this regard, in partnership with provincial departments of agriculture.
With respect to agro-processing, there is a need to subsidize agro-processing equipment to attract the business sector to invest in the value chain at the post-harvest stage. Feedback based on engagements with industry experts and processors involved in related agro-processing activities urges that it is very costly to acquire processing modules, especially since cassava processing into either flour or starch is relatively new in South Africa. From a trade perspective, as the emerging cassava value chain begins to stabilize, it might be necessary to protect it from the increasing volume of imports by increasing the tariff rate. Currently, the average applied tariff rate on cassava starch is 4.2% [59], but it is probable to increase it in comparison with other closely related starch-based products like inulin, which attracts a 17% average tariff.
However, this study’s limitation is the use of one forecasting approach. Thus, further research should consider comparing the performance of other forecasting methods.
Author Contributions
Conceptualization, M.H.L. and W.S.; methodology, M.H.L and W.S.; software, W.S. and M.H.L.; validation, P.C., G.C. M.B., and S.M.; formal analysis, W.S. and M.H.L.; investigation, all.; resources, M.H.L., P.C., G.C., and M.B; data curation, W.S. and S.M.; writing—original draft preparation, W.S. and M.H.L.; writing—review and editing, P.C., M.B., G.C., and S.M.; visualization, W.S. and M.H.L.; supervision, M.H.L. and P.C.; project administration, M.H.L.; funding acquisition, M.H.L. and P.C. All authors have read and agreed to the published version of the manuscript.
Funding
This research was funded by the Technology Innovation Agency (TIA), an implementing agency of the Department of Science and Innovation (DSI) in South Africa, grant number 2021/FUN116/AA.
Institutional Review Board Statement
Not applicable.
Data Availability Statement
Data are available on request.
Acknowledgments
We acknowledge input provided during the 2024 Annual Conference of the Agricultural Economics Association of South Africa (AEASA). Furthermore, the research team is grateful to FABCO, a farmers’ primary cooperative based in Tzaneen (Limpopo province), and agricultural advisors from the Greater Letaba, uMhlathuze, and uMhlabuyalingana local municipalities for their involvement in the project.
Conflicts of Interest
The authors declare no conflicts of interest.
References
- Kourentzes, N.; Barrow, D.K.; Crone, S.F. Neural network ensemble operators for time series forecasting. Expert Syst. Appl. 2014, 41, 4235–4244. [Google Scholar] [CrossRef]
- Lamboll, R.; Martin, A.; Sanni, L.; Adebayo, K.; Graffham, A.; Kleih, U.; Abayomi, L.; Westby, A. Shaping, adapting and reserving the right to play: Responding to uncertainty in high quality cassava flour value chains in Nigeria. J. Agribus. Dev. Emerg. Econ. 2018, 8, 54–76. [Google Scholar] [CrossRef]
- Otun, S.; Escrich, A.; Achilonu, I.; Rauwane, M.; Lerma-Escalera, J.A.; Morones-Ramírez, J.R.; Rios-Solis, L. The future of cassava in the era of biotechnology in Southern Africa. Crit. Rev. Biotechnol. 2023, 43, 594–612. [Google Scholar] [PubMed]
- Padi, R.K.; Chimphango, A.; Roskilly, A.P. Economic and environmental analysis of waste-based bioenergy integration into industrial cassava starch processes in Africa. Sustain. Prod. Consum. 2022, 31, 67–81. [Google Scholar] [CrossRef]
- Adebayo, W.G. Cassava production in Africa: A panel analysis of the drivers and trends. Heliyon 2023, 9(9). [Google Scholar] [CrossRef] [PubMed]
- Robson, F.; Hird, D.L.; Boa, E. Cassava brown streak: A deadly virus on the move. Plant Pathol. 2024, 73, 221–241. [Google Scholar]
- Mutyaba, C.; Lubinga, M.H.; Ogwal, R.O.; Tumwesigye, S. The role of institutions as actors influencing Uganda’s cassava sector. J. Agric. Rural Dev. Trop. Subtrop. 2016, 117, 113–123. [Google Scholar]
- Amelework, A.B.; Bairu, M.W.; Maema, O.; Venter, S.L.; Laing, M. Adoption and promotion of resilient crops for climate risk mitigation and import substitution: A case analysis of cassava for South African agriculture. Front. Sustain. Food Syst. 2021, 5, 617783. [Google Scholar] [CrossRef]
- Amole, T.A.; Adekeye, A.B.; Adebayo, A.B.; Okike, I.; Duncan, A.J.; Jones, C.S. High-Quality Cassava Peel® (HQCP®) mash as a feed ingredient for livestock—A review of feeding trials. ILRI Proj. Rep. 2022. Available online: https://cgspace.cgiar.org/server/api/core/bitstreams/cf31820d-af39-4d29-af02-1ae143ac1ab2/content (accessed on 20 September 2024).
- Okike, I.; Wigboldus, S.; Samireddipalle, A.; Naziri, D.; Adesehinwa, A.O.; Adejoh, V.A.; et al. Turning waste to wealth: Harnessing the potential of cassava peels for nutritious animal feed. In Root, Tuber and Banana Food System Innovations: Value Creation for Inclusive Outcomes; Thiele, G., Friedmann, M., Campos, H., Polar, V., Bentley, J.W., Eds.; Springer Nature: Cham, Switzerland, 2022; p. 561. [Google Scholar]
- Fathima, A.A.; Sanitha, M.; Tripathi, L.; Muiruri, S. Cassava (Manihot esculenta) dual use for food and bioenergy: A review. Food Energy Secur. 2023, 12, e380. [Google Scholar]
- Cao, M.; Lin, S.; Geng, M.; Zhang, Y.; Ren, J.; Yang, B.; Li, X. Fabrication of cassava (Manihot esculenta Crantz) starch-based ultrafine fibres: Investigation of fundamental and antimicrobial properties. J. Appl. Polym. Sci. 2024, 141, e54796. [Google Scholar]
- Gunathilake, I.A.D.S.R.; Somendrika, M.A.D. Development of a biodegradable packaging with antimicrobial properties from cassava starch by incorporating Ocimum tenuiflorum extract. Food Chem. Adv. 2024, 100658. [Google Scholar] [CrossRef]
- Piccini, A.; Moura, J.D.; Piccini, A.R. Literature review and preliminary analysis of cassava by-products’ potential use in particleboards. BioResources 2024, 19. [Google Scholar] [CrossRef]
- International Trade Centre (ITC). List of products at 6 digits level imported by South Africa in 2023 at the same aggregation level as the product: 110814 Manioc starch. 2024.a. Available online: https://www.trademap.org/ (accessed on 16 June 2024).
- Okudoh, V.; Trois, C.; Workneh, T.; Schmidt, S. The potential of cassava biomass and applicable technologies for sustainable biogas production in South Africa: A review. Renew. Sustain. Energy Rev. 2014, 39, 1035–1052. [Google Scholar] [CrossRef]
- Lukhele, J.C.; Tsvakirai, C.Z.; Tshehla, M. Determining the drivers and deterrents of climate-smart crop adoption: The case of cassava in Mpumalanga Province, South Africa. J. Agribus. Rural Dev. 2023, 70, 391–400. [Google Scholar] [CrossRef]
- ARC; NAMC; FABCO; TIPS. Economic Analysis of Cassava Starch Production vis-à-vis Starch Production from Maize and Potatoes in South Africa; Unpublished report prepared for the Agriculture Bioeconomy Innovation Partnership Programme (ABIPP) of the Technology Innovation Agency (TIA); National Agricultural Marketing Council: Pretoria, South Africa, 2024. [Google Scholar]
- NAMC; ARC; FABCO; TIPS. Market Opportunities for Cassava and Its Derivatives in South Africa; Unpublished report submitted to the Agriculture Bioeconomy Innovation Partnership Programme (ABIPP) of the Technology Innovation Agency (TIA); National Agricultural Marketing Council: Pretoria, South Africa, 2024. [Google Scholar]
- Manganyi, B.; Lubinga, M.H.; Zondo, B.; Tempia, N. Factors Influencing Cassava Sales and Income Generation among Cassava Producers in South Africa. Sustainability 2023, 15, 14366. [Google Scholar] [CrossRef]
- Lubinga, M.H.; Zondo, B.; Manganyi, B.; Ningi, T. Determinants of household participation in the cassava value chain in South Africa. J. Infrastruct. Policy Dev. 2024, 8, 1–18. [Google Scholar] [CrossRef]
- Industrial Development Corporation (IDC). A Study on Market Potential for Increased Industrial Starch Production in South Africa; Industrial Development Corporation of South Africa: Sandton, South Africa, 2017. [Google Scholar]
- Wongpit, P.; Boungvatthana, T.; Xaysombath, A.; Chanhthalangma, V. Enhancing the cassava value chain: Policy recommendations and strategies for sustainable development. Res. World Agric. Econ. 2024, 5. [Google Scholar] [CrossRef]
- Aday, S.; Aday, M.S. Impact of COVID-19 on the food supply chain. Food Qual. Saf. 2020, 4, 167–180. [Google Scholar] [CrossRef]
- Agarwal, P.; Chonzi, M. Impact of COVID-19 on international trade: Lessons for African LDCs. SSRN Electron. J. 2020. [Google Scholar] [CrossRef]
- Sharma, R.; Shishodia, A.; Kamble, S.; Gunasekaran, A.; Belhadi, A. Agriculture supply chain risks and COVID-19: Mitigation strategies and implications for practitioners. Int. J. Logist. Res. Appl. 2020, 1–27. [Google Scholar]
- Raj, A.; Mukherjee, A.A.; de Sousa Jabbour, A.B.L.; Srivastava, S.K. Supply chain management during and post-COVID-19 pandemic: Mitigation strategies and practical lessons learned. J. Bus. Res. 2022, 142, 1125–1139. [Google Scholar] [CrossRef] [PubMed]
- International Trade Centre (ITC). List of products at 6 digits level imported by South Africa in 2023: Detailed products in category 1108—Starches; inulin. 2024b. Available online: https://www.trademap.org/ (accessed on 20 May 2024).
- Ogundeji, A.A.; Jooste, A.; Uchezuba, D. Econometric estimation of Armington elasticities for selected agricultural products in South Africa: Pricing models. S. Afr. J. Econ. Manag. Sci. 2010, 13, 123–234. [Google Scholar] [CrossRef]
- Hill, P.; Biggs, J.; Ponce-López, V.; Bull, D. Time-series prediction approaches to forecasting deformation in Sentinel-1 InSAR data. J. Geophys. Res. Solid Earth 2021, 126, e2020JB020176. [Google Scholar] [CrossRef]
- Dickey, D.A.; Fuller, W.A. Distribution of the Estimators for Autoregressive Time Series with a Unit Root. J. Am. Stat. Assoc. 1979, 74, 427–431. [Google Scholar] [CrossRef]
- Dickey, D.A.; Fuller, W.A. Likelihood Ratio Statistics for Autoregressive Time Series with a Unit Root. Econometrica 1981, 49, 1057–1072. [Google Scholar] [CrossRef]
- Gebretensae, Y.A.; Asmelash, D. Trend analysis and forecasting the spread of COVID-19 pandemic in Ethiopia using Box–Jenkins modelling procedure. Int. J. Gen. Med. 2021, 14, 1485–1498. [Google Scholar] [CrossRef] [PubMed]
- Shankar, S.V.; Chandel, A.; Gupta, R.K.; Sharma, S.; Chand, H.; Aravinthkumar, A.; Ananthakrishnan, S. Comparative study on key time series models for exploring agricultural price volatility in potato prices. Potato Res. 2024, 1–19. [Google Scholar] [CrossRef]
- Arshad, M.O.; Khan, S.; Haleem, A.; Mansoor, H.; Arshad, M.O.; Arshad, M.E. Understanding the impact of COVID-19 on Indian tourism sector through time series modelling. J. Tour. Futur. 2023, 9, 101–115. [Google Scholar]
- Phumchusri, N.; Suwatanapongched, P. Forecasting hotel daily room demand with transformed data using time series methods. J. Revenue Pricing Manag. 2023, 22, 44–56. [Google Scholar]
- Cappelen, Å.; Skjerpen, T.; Tønnessen, M. Forecasting immigration in official population projections using an econometric model. Int. Migr. Rev. 2015, 49, 945–980. [Google Scholar] [CrossRef]
- Bijak, J.; Disney, G.; Findlay, A.M.; Forster, J.J.; Smith, P.W.; Wiśniowski, A. Assessing time series models for forecasting international migration: Lessons from the United Kingdom. J. Forecast. 2019, 38, 470–487. [Google Scholar] [CrossRef]
- Borhan, N.; Arsad, Z. Forecasting international tourism demand from theUS, Japan and South Korea to Malaysia: A SARIMA approach. In Proceedings of the 21st National Symposium on Mathematical Sciences (SKSM21): Germination of Mathematical Sciences Education and Research towards Global Sustainability, Malaysia, 6–8 November 2013; Ismail, M.T., et al., Eds.; 6–8 November 2013; pp. 955–960. [Google Scholar]
- Nanda, S. Forecasting: Does the Box–Jenkins method work better than regression? Vikalpa 1988, 13, 53–62. [Google Scholar] [CrossRef]
- Box, et al. 1994.
- Box, G.E.P.; Jenkins, G.M.; Reinsel, G.C.; Ljung, G.M. Time Series Analysis: Forecasting and Control, 5th ed.; John Wiley & Sons: Hoboken, NJ, USA, 2015. [Google Scholar]
- Gujarati, D.N.; Porter, D.C. Basic Econometrics, 5th ed.; McGraw-Hill: New York, NY, USA, 2009. [Google Scholar]
- Enders, W. Applied Econometric Time Series, 4th ed.; John Wiley & Sons: Hoboken, NJ, USA, 2015. [Google Scholar]
- Brooks, C. Introductory Econometrics for Finance, 4th ed.; Cambridge University Press: Cambridge, UK, 2019. [Google Scholar]
- Fattah, J.; Ezzine, L.; Aman, Z.; El Moussami, H.; Lachhab, A. Forecasting of demand using ARIMA model. Int. J. Eng. Bus. Manag. 2018, 10, 1847979018808673. [Google Scholar] [CrossRef]
- Meher, B.K.; Hawaldar, I.T.; Spulbar, C.M.; Birau, F.R. Forecasting stock market prices using mixed ARIMA model: A case study of Indian pharmaceutical companies. Invest. Manag. Financ. Innov. 2021, 18, 42–54. [Google Scholar] [CrossRef]
- Akaike, H. A new look at the statistical model identification. IEEE Trans. Autom. Control 1974, 19, 716–723. [Google Scholar] [CrossRef]
- Schwarz, G. Estimating the dimension of a model. Ann. Stat. 1978, 6, 461–464. [Google Scholar] [CrossRef]
- Hannan, E.J.; Quinn, B.G. The determination of the order of an autoregression. J. R. Stat. Soc. Ser. B Stat. Methodol. 1979, 41, 190–195. [Google Scholar] [CrossRef]
- Kamila, K. General Hannan and Quinn criterion for common time series. Statistics 2022, 56, 222–241. [Google Scholar] [CrossRef]
- Ljung, G.M.; Box, G.E.P. On a measure of lack of fit in time series models. Biometrika 1978, 65, 297–303. [Google Scholar] [CrossRef]
- Hamjah, M.A. Forecasting major fruit crops productions in Bangladesh using Box–Jenkins ARIMA model. J. Econ. Sustain. Dev. 2014, 5. [Google Scholar]
- Yasmin, S.; Moniruzzaman, M. Forecasting area, production, and yield of jute in Bangladesh using the Box–Jenkins ARIMA model. J. Agric. Food Res. 2024, 16, 101203. [Google Scholar] [CrossRef]
- Dabral, P.P.; Murry, M.Z. Modelling and forecasting of rainfall time series using SARIMA. Environ. Process. 2017, 4, 399–419. [Google Scholar] [CrossRef]
- Humaira, S.P.; Nursuprianah, I.; Darwan, D. Forecasting of the number of schizophrenia disorder by using the Box–Jenkins time series analysis. J. Robot. Control 2020, 1, 213–219. [Google Scholar] [CrossRef]
- Mhonyera, G.; Masunda, S.; Meyer, D.F. Investigating the effect of COVID-19 on intra-COMESA trade. Acta Commer. 2024, 24, 13. [Google Scholar] [CrossRef]
- Lubinga, M.H.; Matebeni, F.; Dempers, C.; Tempia, N. The linkage between governments’ COVID-19 response measures, real exchange rate, and grain prices in South Africa. J. Hunan Univ. Nat. Sci. 2021, 48. [Google Scholar]
- International Trade Centre (ITC). List of products at 6 digits level imported by South Africa in 2023 at the same aggregation level as the product: 110814 Manioc starch. 2024c. Available online: https://www.trademap.org/ (accessed on 14 April 2024).
- Parmar, A.; Sturm, B.; Hensel, O. Crops that feed the world: Production and improvement of cassava for food, feed, and industrial uses. Food Secur. 2017, 9, 907–927. [Google Scholar] [CrossRef]
- Costa, C.; Delgado, C. The Cassava Value Chain in Mozambique; World Bank: Washington, DC, USA, 2019. [Google Scholar]
- Bennett, B.; Naziri, D.; Mahende, G.; Towo, E. Driving demand for cassava in Tanzania: The next steps. Gates Open Res. 2019, 3, 360. [Google Scholar]
- Kleih, U.; Phillips, D.; Jagwe, J.; Kirya, M. Cassava market and value chain analysis—Uganda case study. Gates Open Res. 2019, 3, 187. [Google Scholar]
- Caccamisi, D.S. Cassava: Global production and market trends. Chronica 2010, 50, 15. [Google Scholar]
- Nwajiuba, C.; Akinsanmi, A. Economics and Social Issues Affecting the Sustainability of Cassava Post-Harvest Projects in Southern Nigeria; Owerri, Nigeria, 1997. [Google Scholar]
- International Trade Centre (ITC). List of products at 6 digits level imported by South Africa in 2023 at the same aggregation level as the product: 110814 Manioc starch. Available online. 2025. (accessed on 2 January 2025). (insert URL).
Figure 1.
Quantity of the various types of starch imported by South Africa. Source: Authors’ elaboration based on data extracted from TradeMap.
Figure 1.
Quantity of the various types of starch imported by South Africa. Source: Authors’ elaboration based on data extracted from TradeMap.
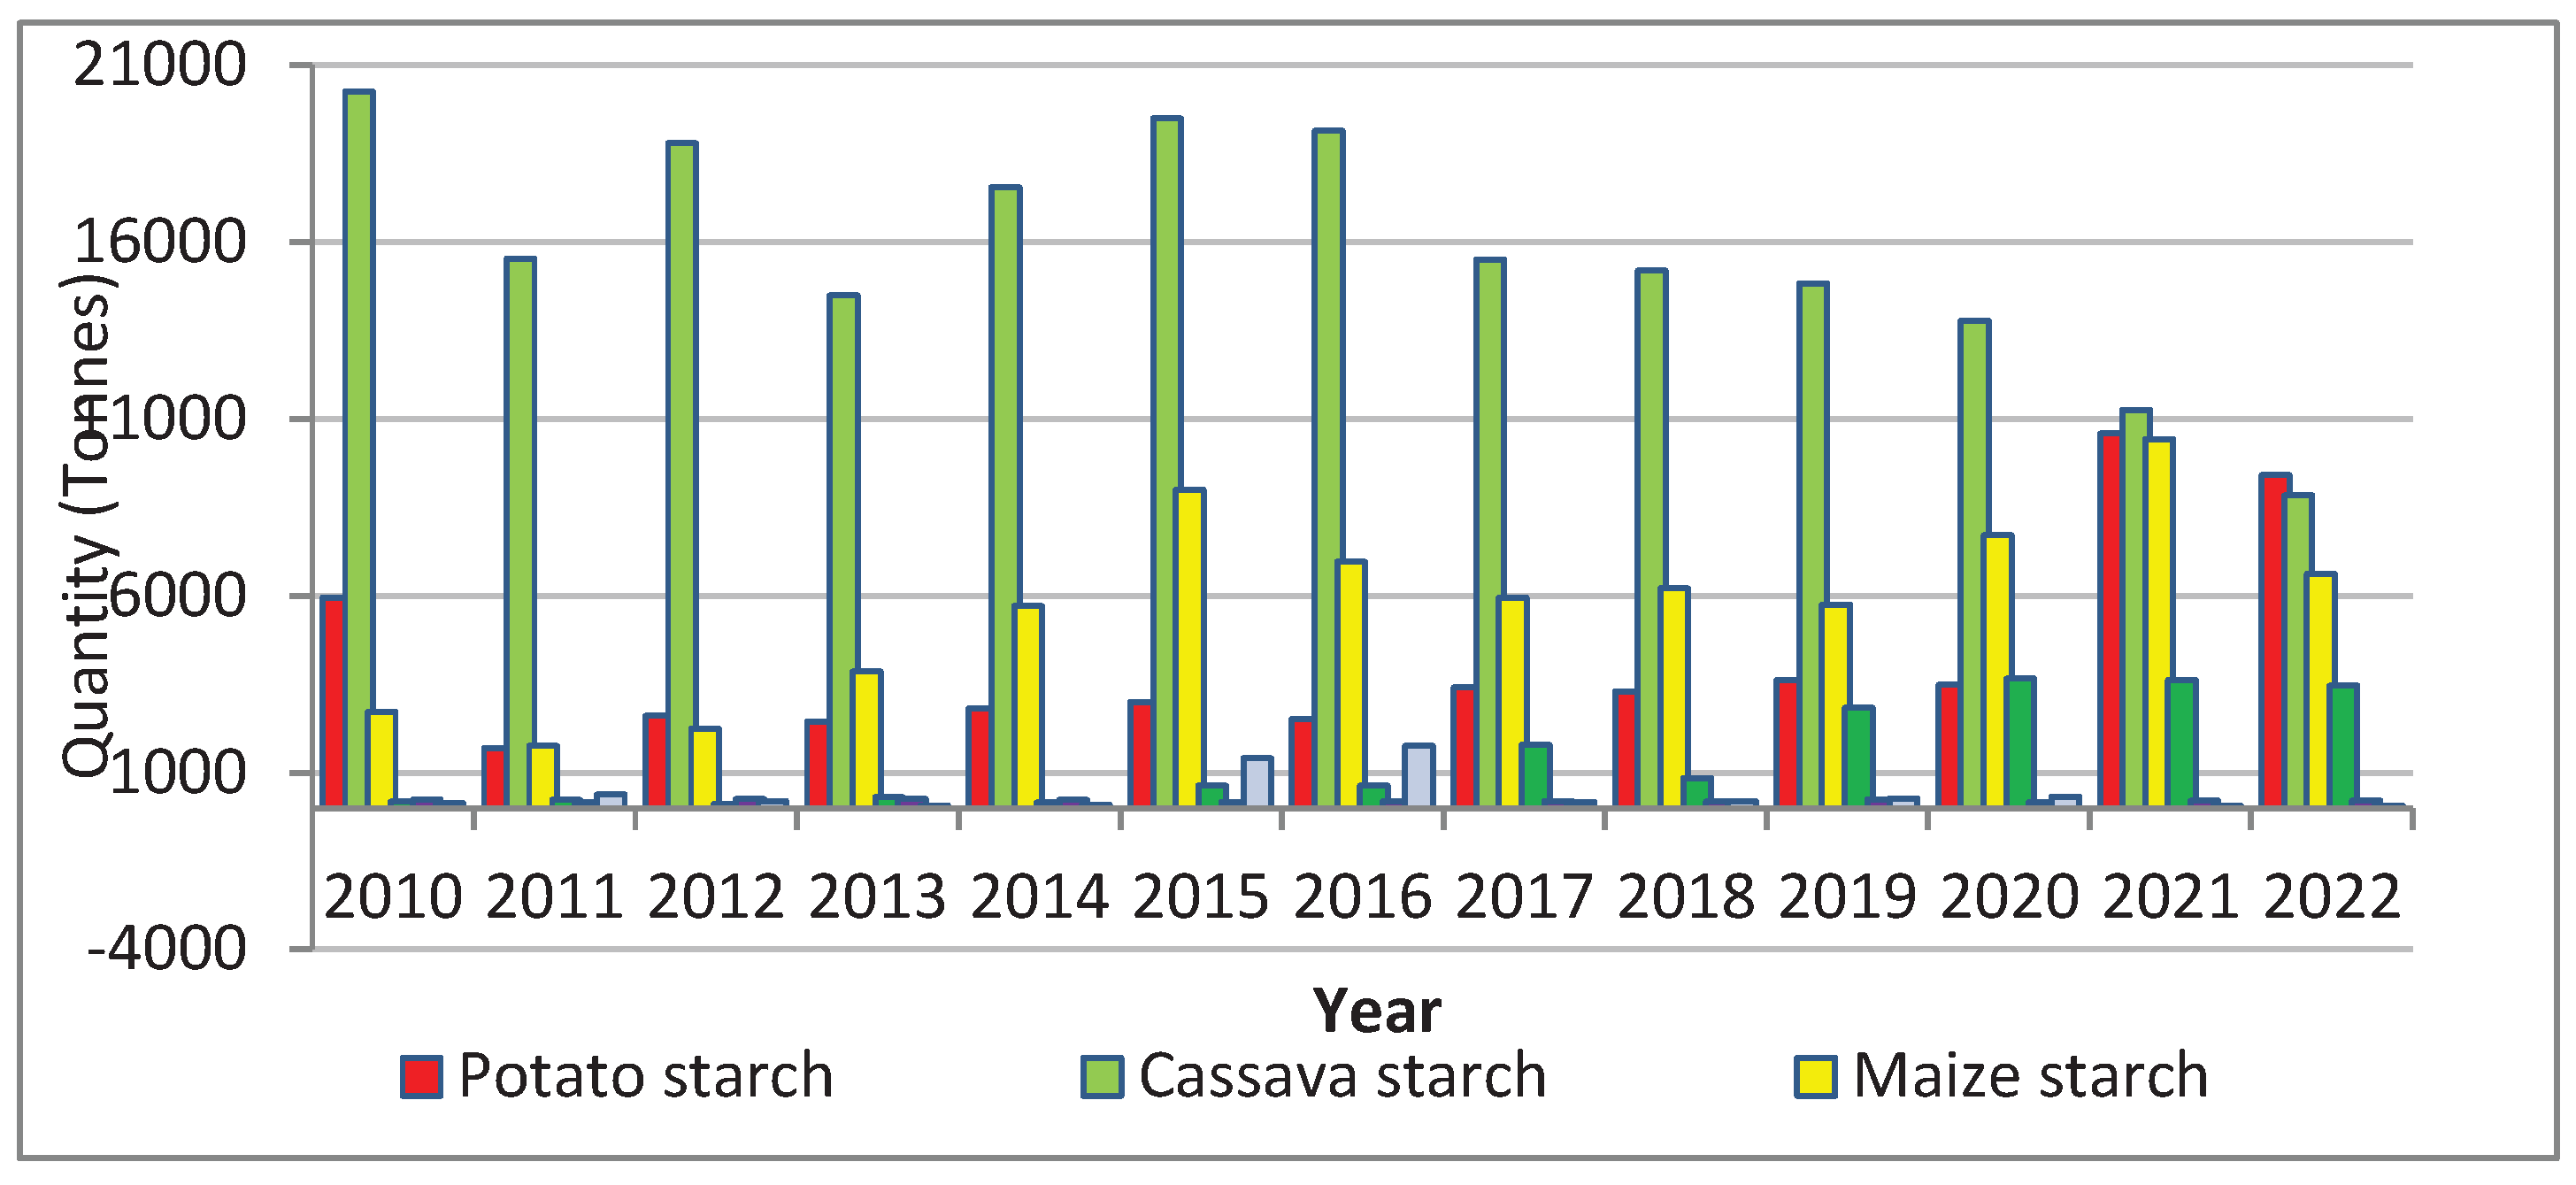
Figure 2.
The trend of original import demand and at first difference series from 2015-2024. Source: Authors’ elaboration based on data extracted from ITC’s TradeMap database.
Figure 2.
The trend of original import demand and at first difference series from 2015-2024. Source: Authors’ elaboration based on data extracted from ITC’s TradeMap database.
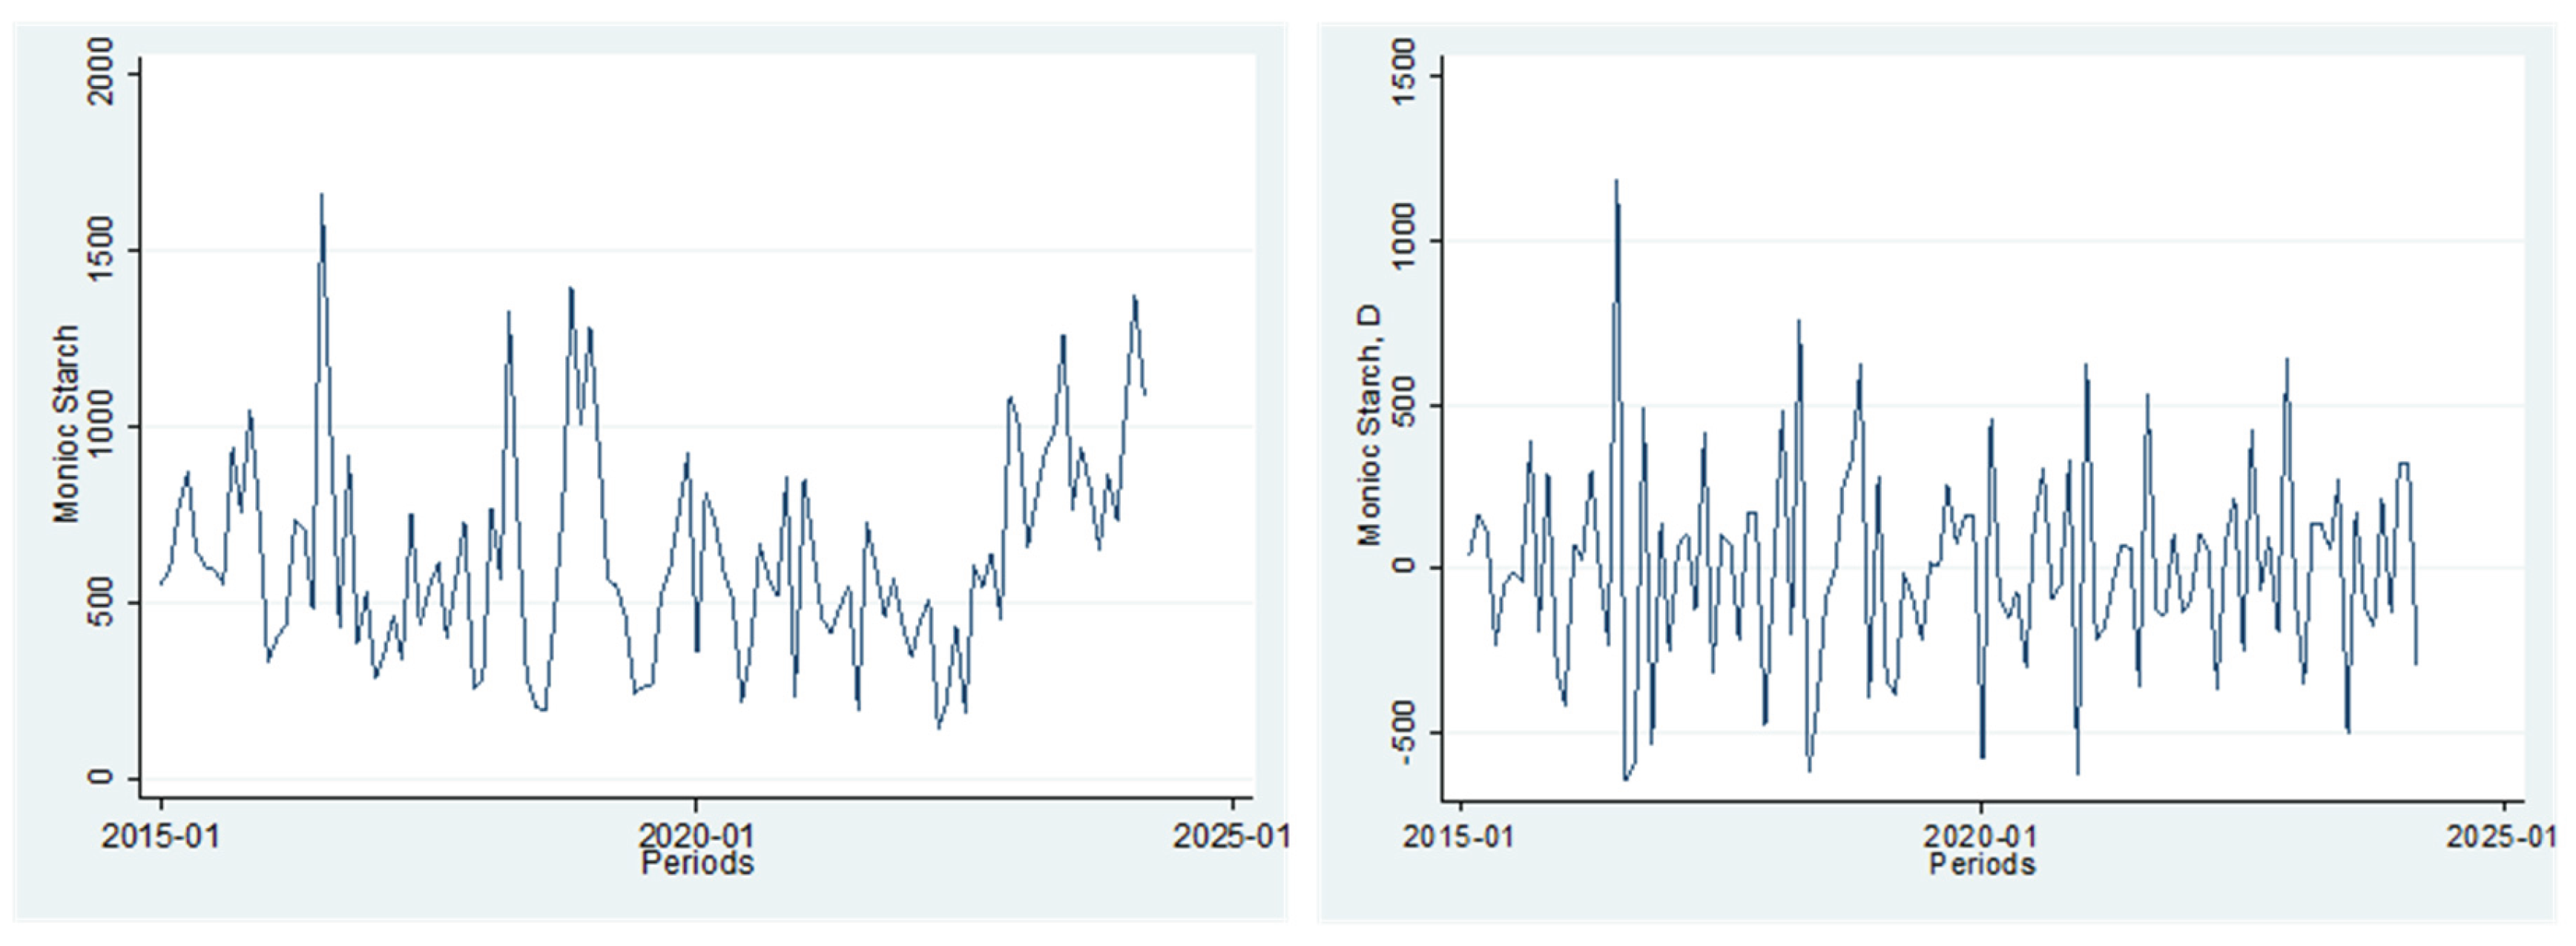
Figure 3.
The autocorrelation (ACF—panel a) and partial autocorrelation (PACF—panel b) plots of cassava starch. The term “manioc starch” is used interchangeably with “cassava starch” as seen in the figure. Source: Authors’ elaboration based on data extracted from ITC’s TradeMap database.
Figure 3.
The autocorrelation (ACF—panel a) and partial autocorrelation (PACF—panel b) plots of cassava starch. The term “manioc starch” is used interchangeably with “cassava starch” as seen in the figure. Source: Authors’ elaboration based on data extracted from ITC’s TradeMap database.
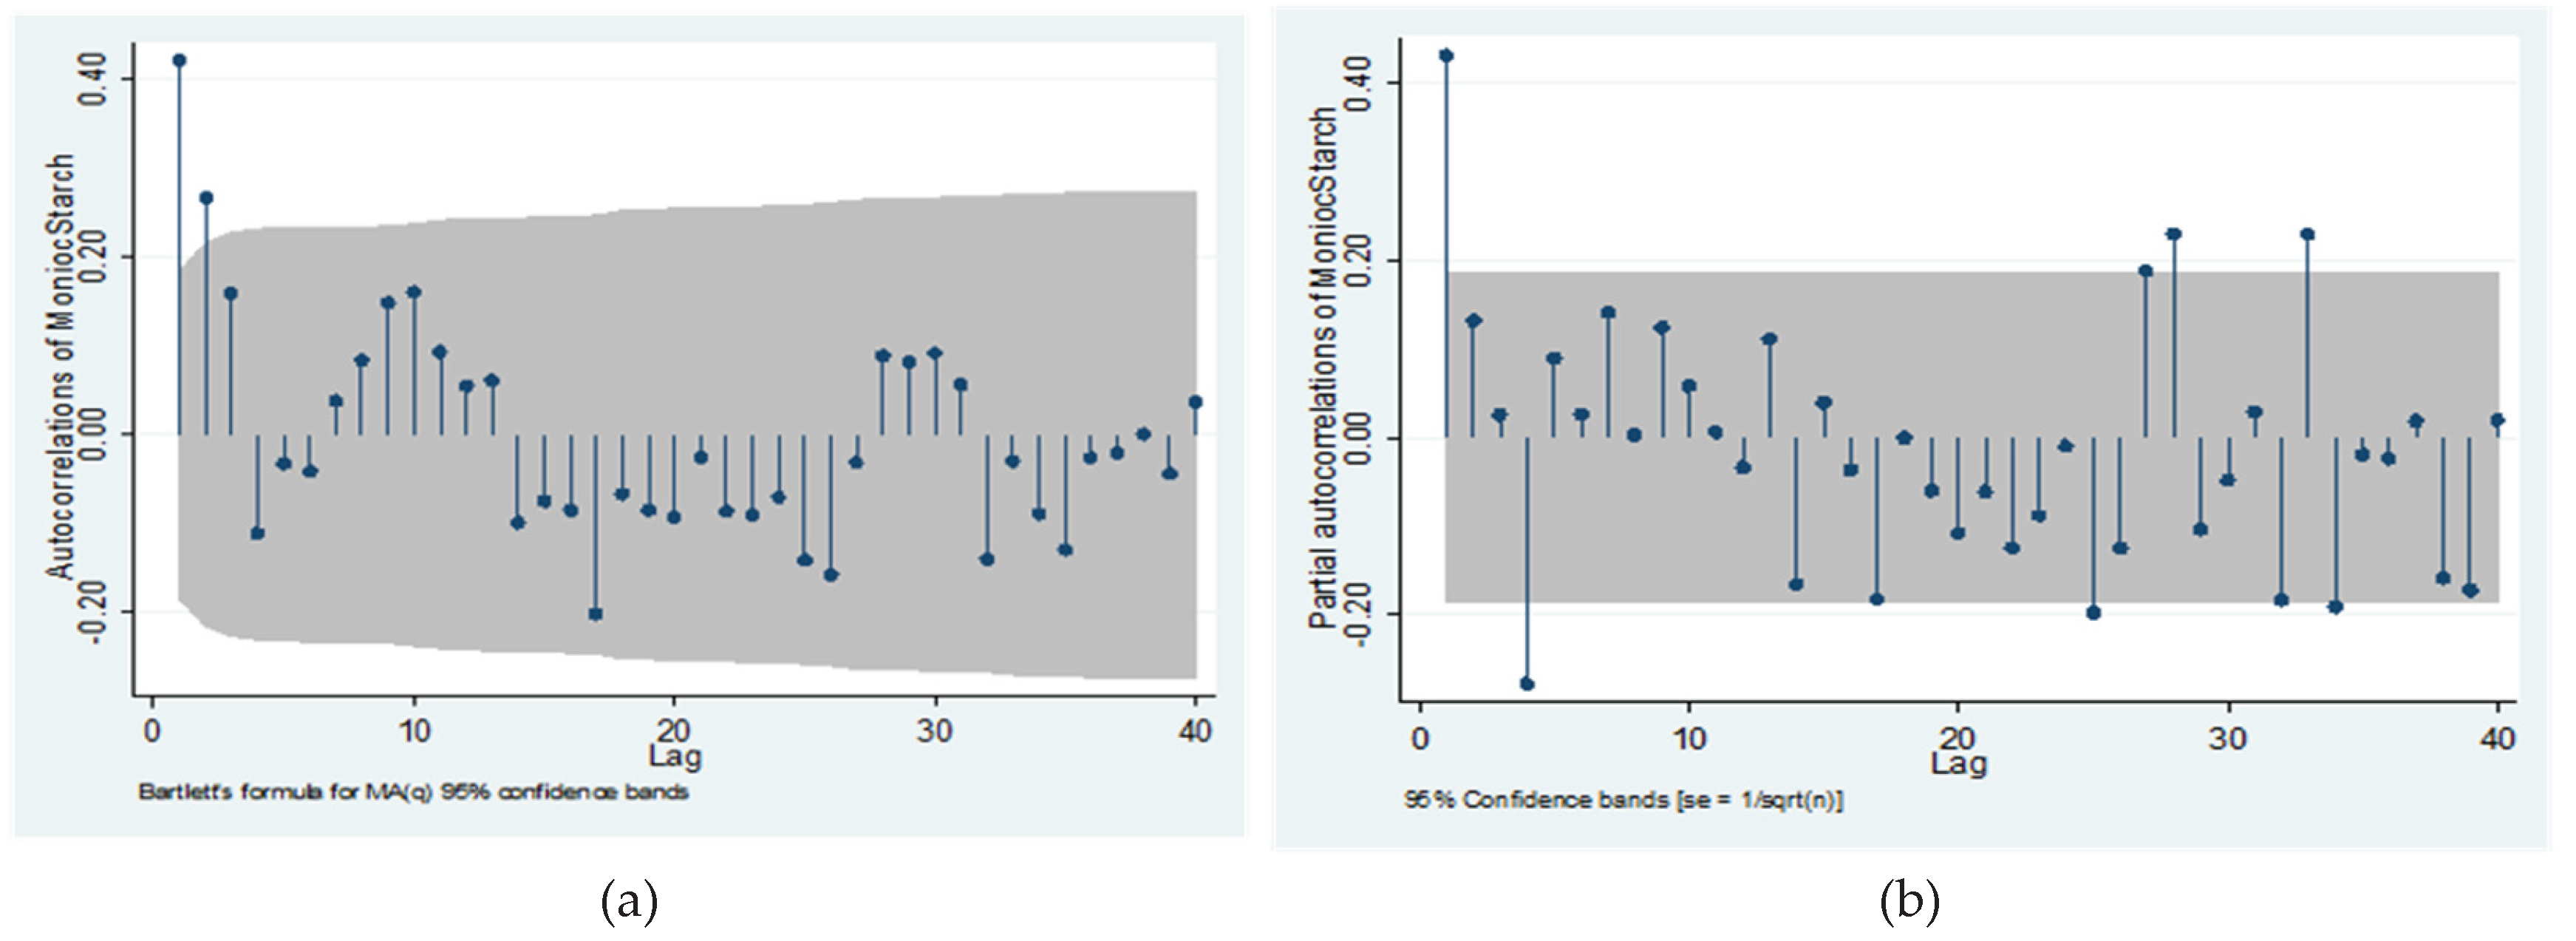
Figure 4.
Autocorrelation (ACF—panel a) and partial autocorrelation (PACF—panel b) plots of first differenced series. The term “manioc starch” is used interchangeably with “cassava starch” as seen in the figure. Source: Authors’ elaboration based on data extracted from ITC’s TradeMap database.
Figure 4.
Autocorrelation (ACF—panel a) and partial autocorrelation (PACF—panel b) plots of first differenced series. The term “manioc starch” is used interchangeably with “cassava starch” as seen in the figure. Source: Authors’ elaboration based on data extracted from ITC’s TradeMap database.
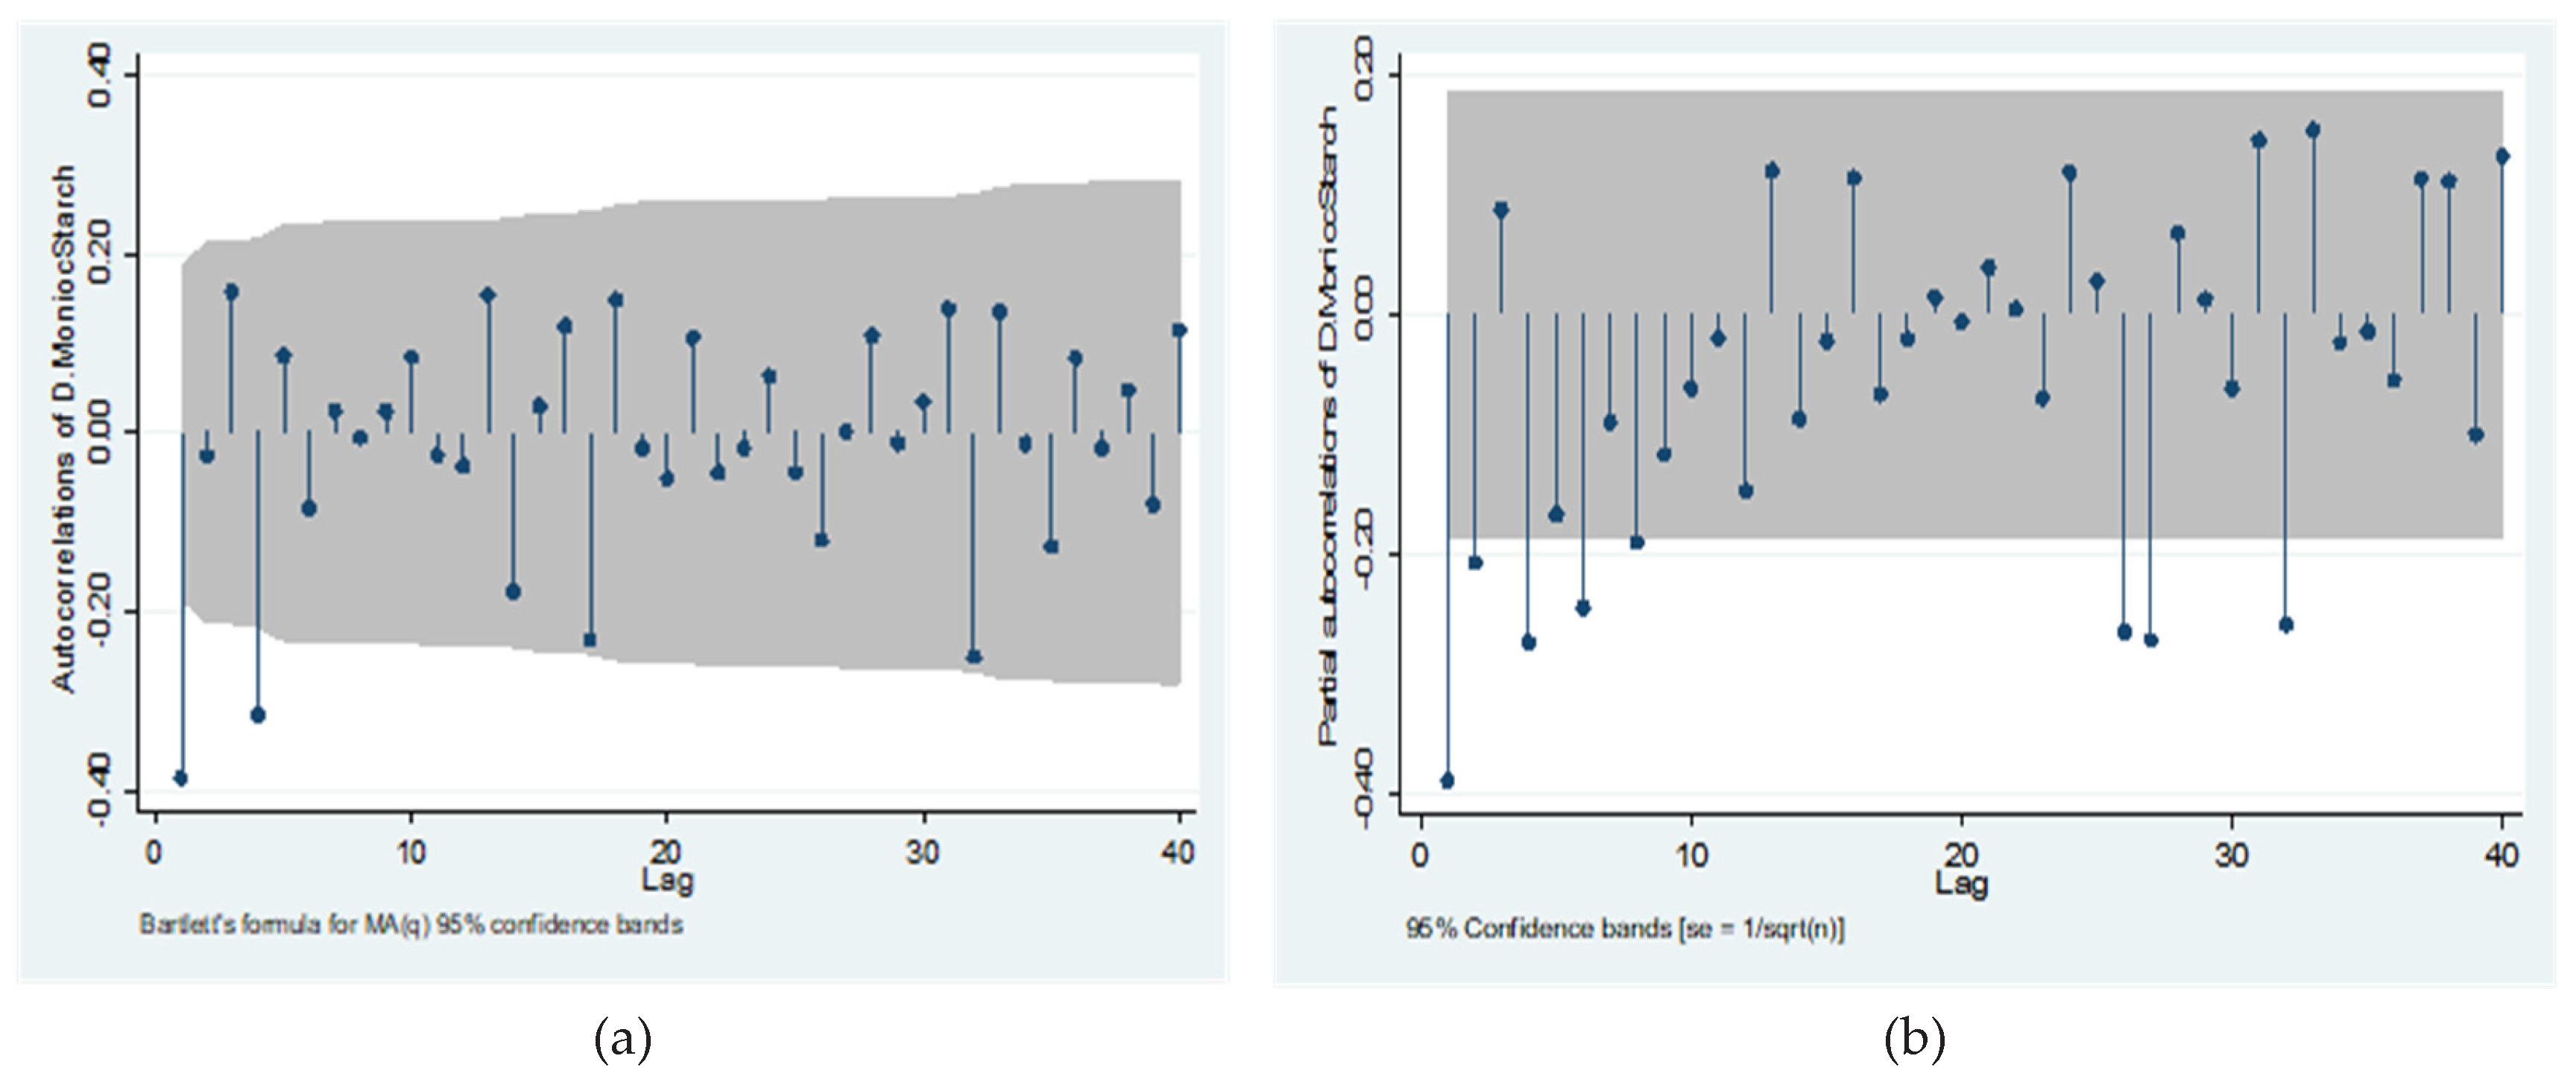
Figure 6.
The forecasted import demand of cassava starch from April 2024 to December 2030. Source: Authors’ elaboration based on data extracted from ITC’s TradeMap database.
Figure 6.
The forecasted import demand of cassava starch from April 2024 to December 2030. Source: Authors’ elaboration based on data extracted from ITC’s TradeMap database.
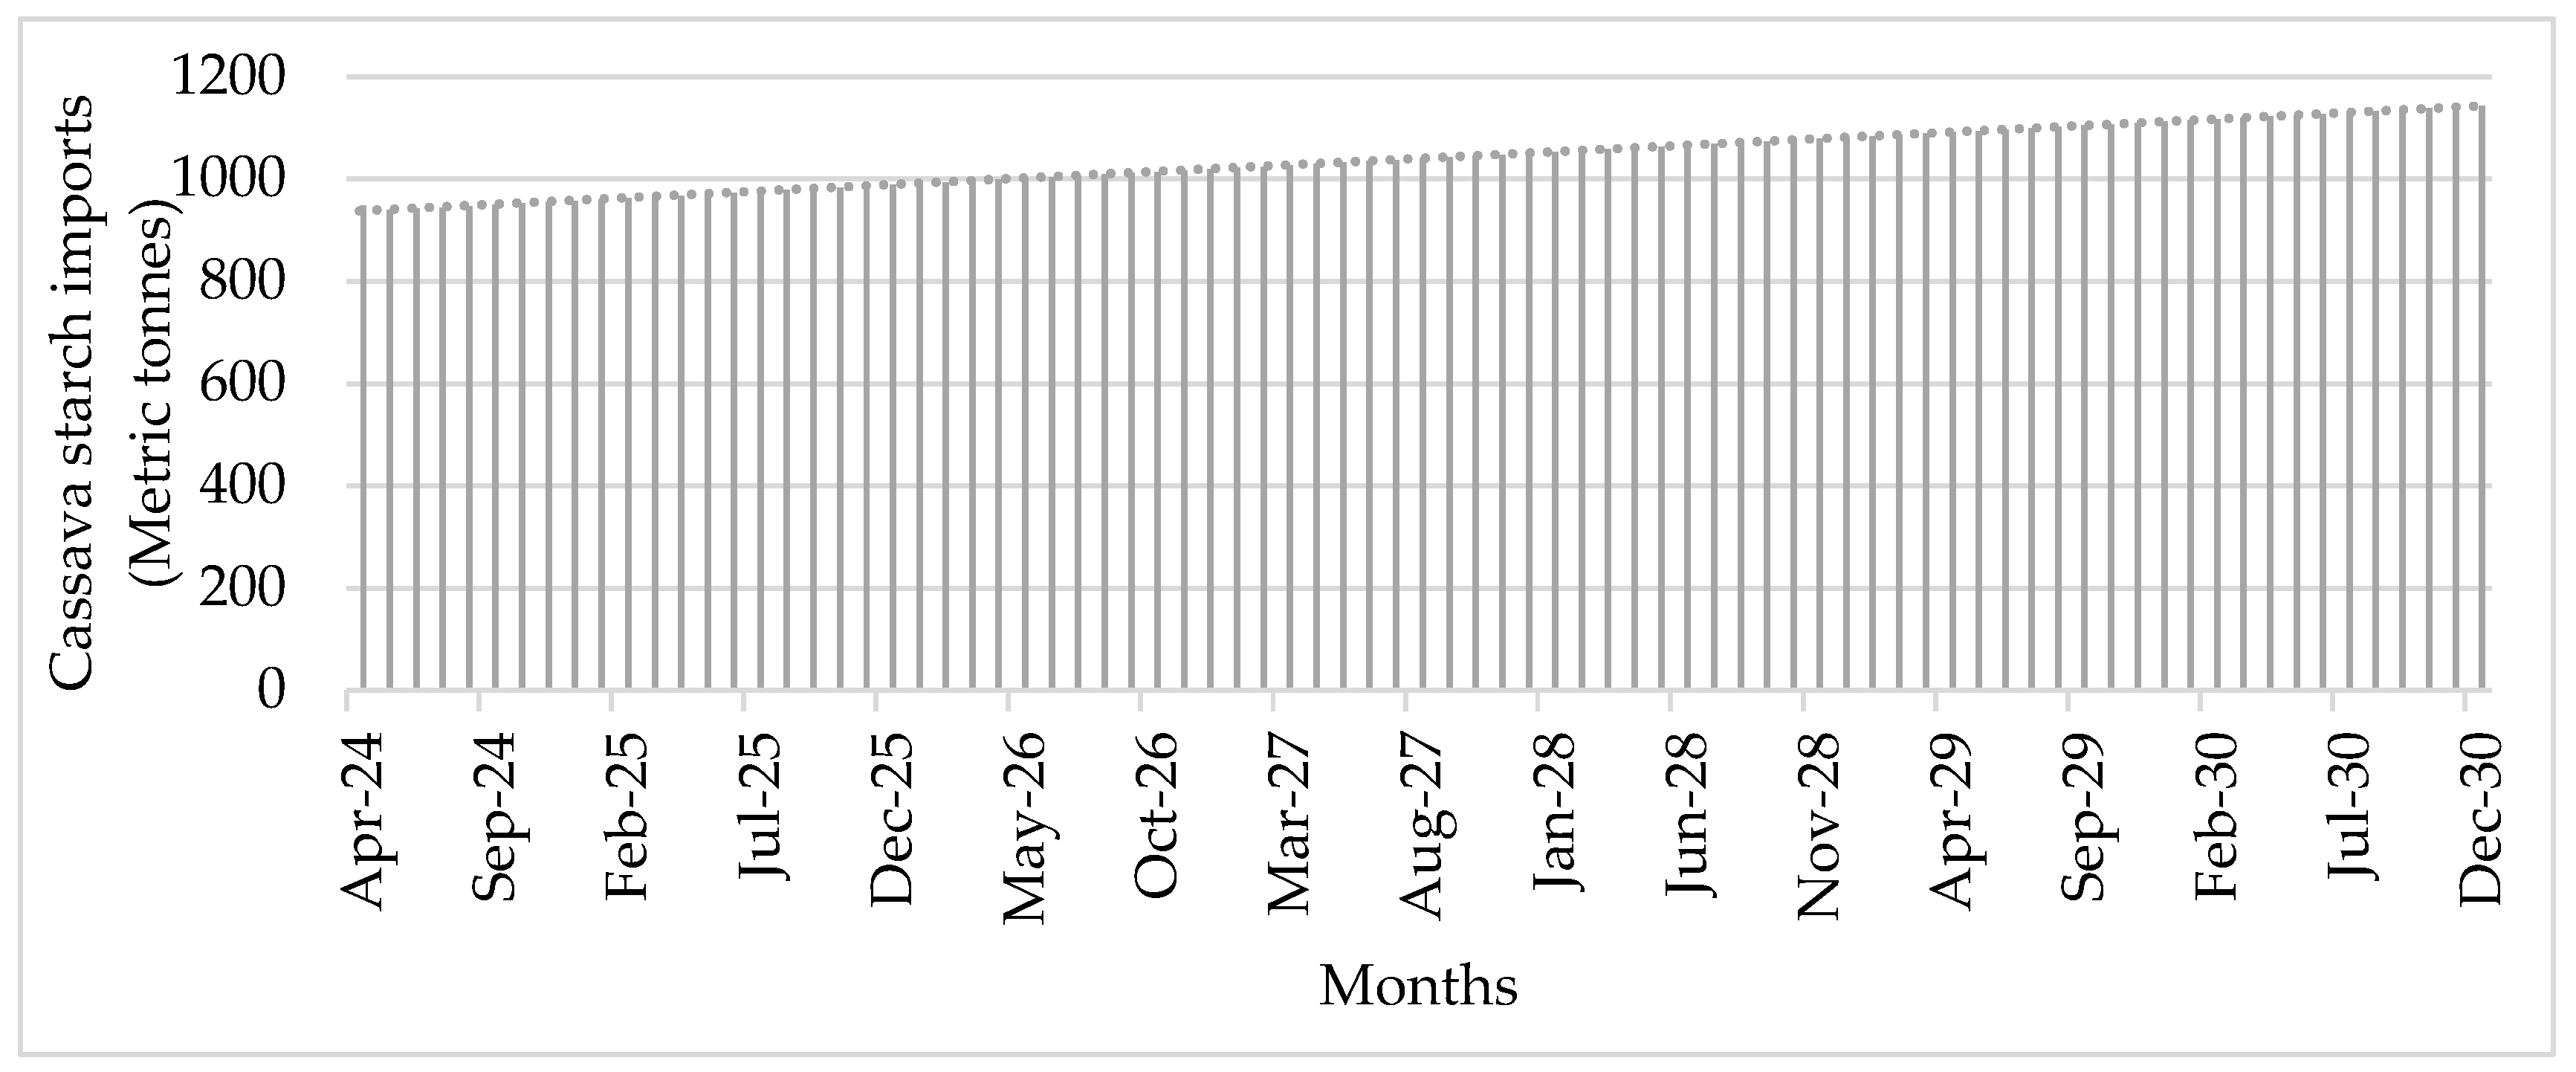
Figure 7.
Actual and forecasted cassava starch import demand in metric tonnes. The term “manioc starch” is used interchangeably with “cassava starch” as seen in the figure. Source: Authors’ elaboration based on data extracted from ITC’s TradeMap database.
Figure 7.
Actual and forecasted cassava starch import demand in metric tonnes. The term “manioc starch” is used interchangeably with “cassava starch” as seen in the figure. Source: Authors’ elaboration based on data extracted from ITC’s TradeMap database.
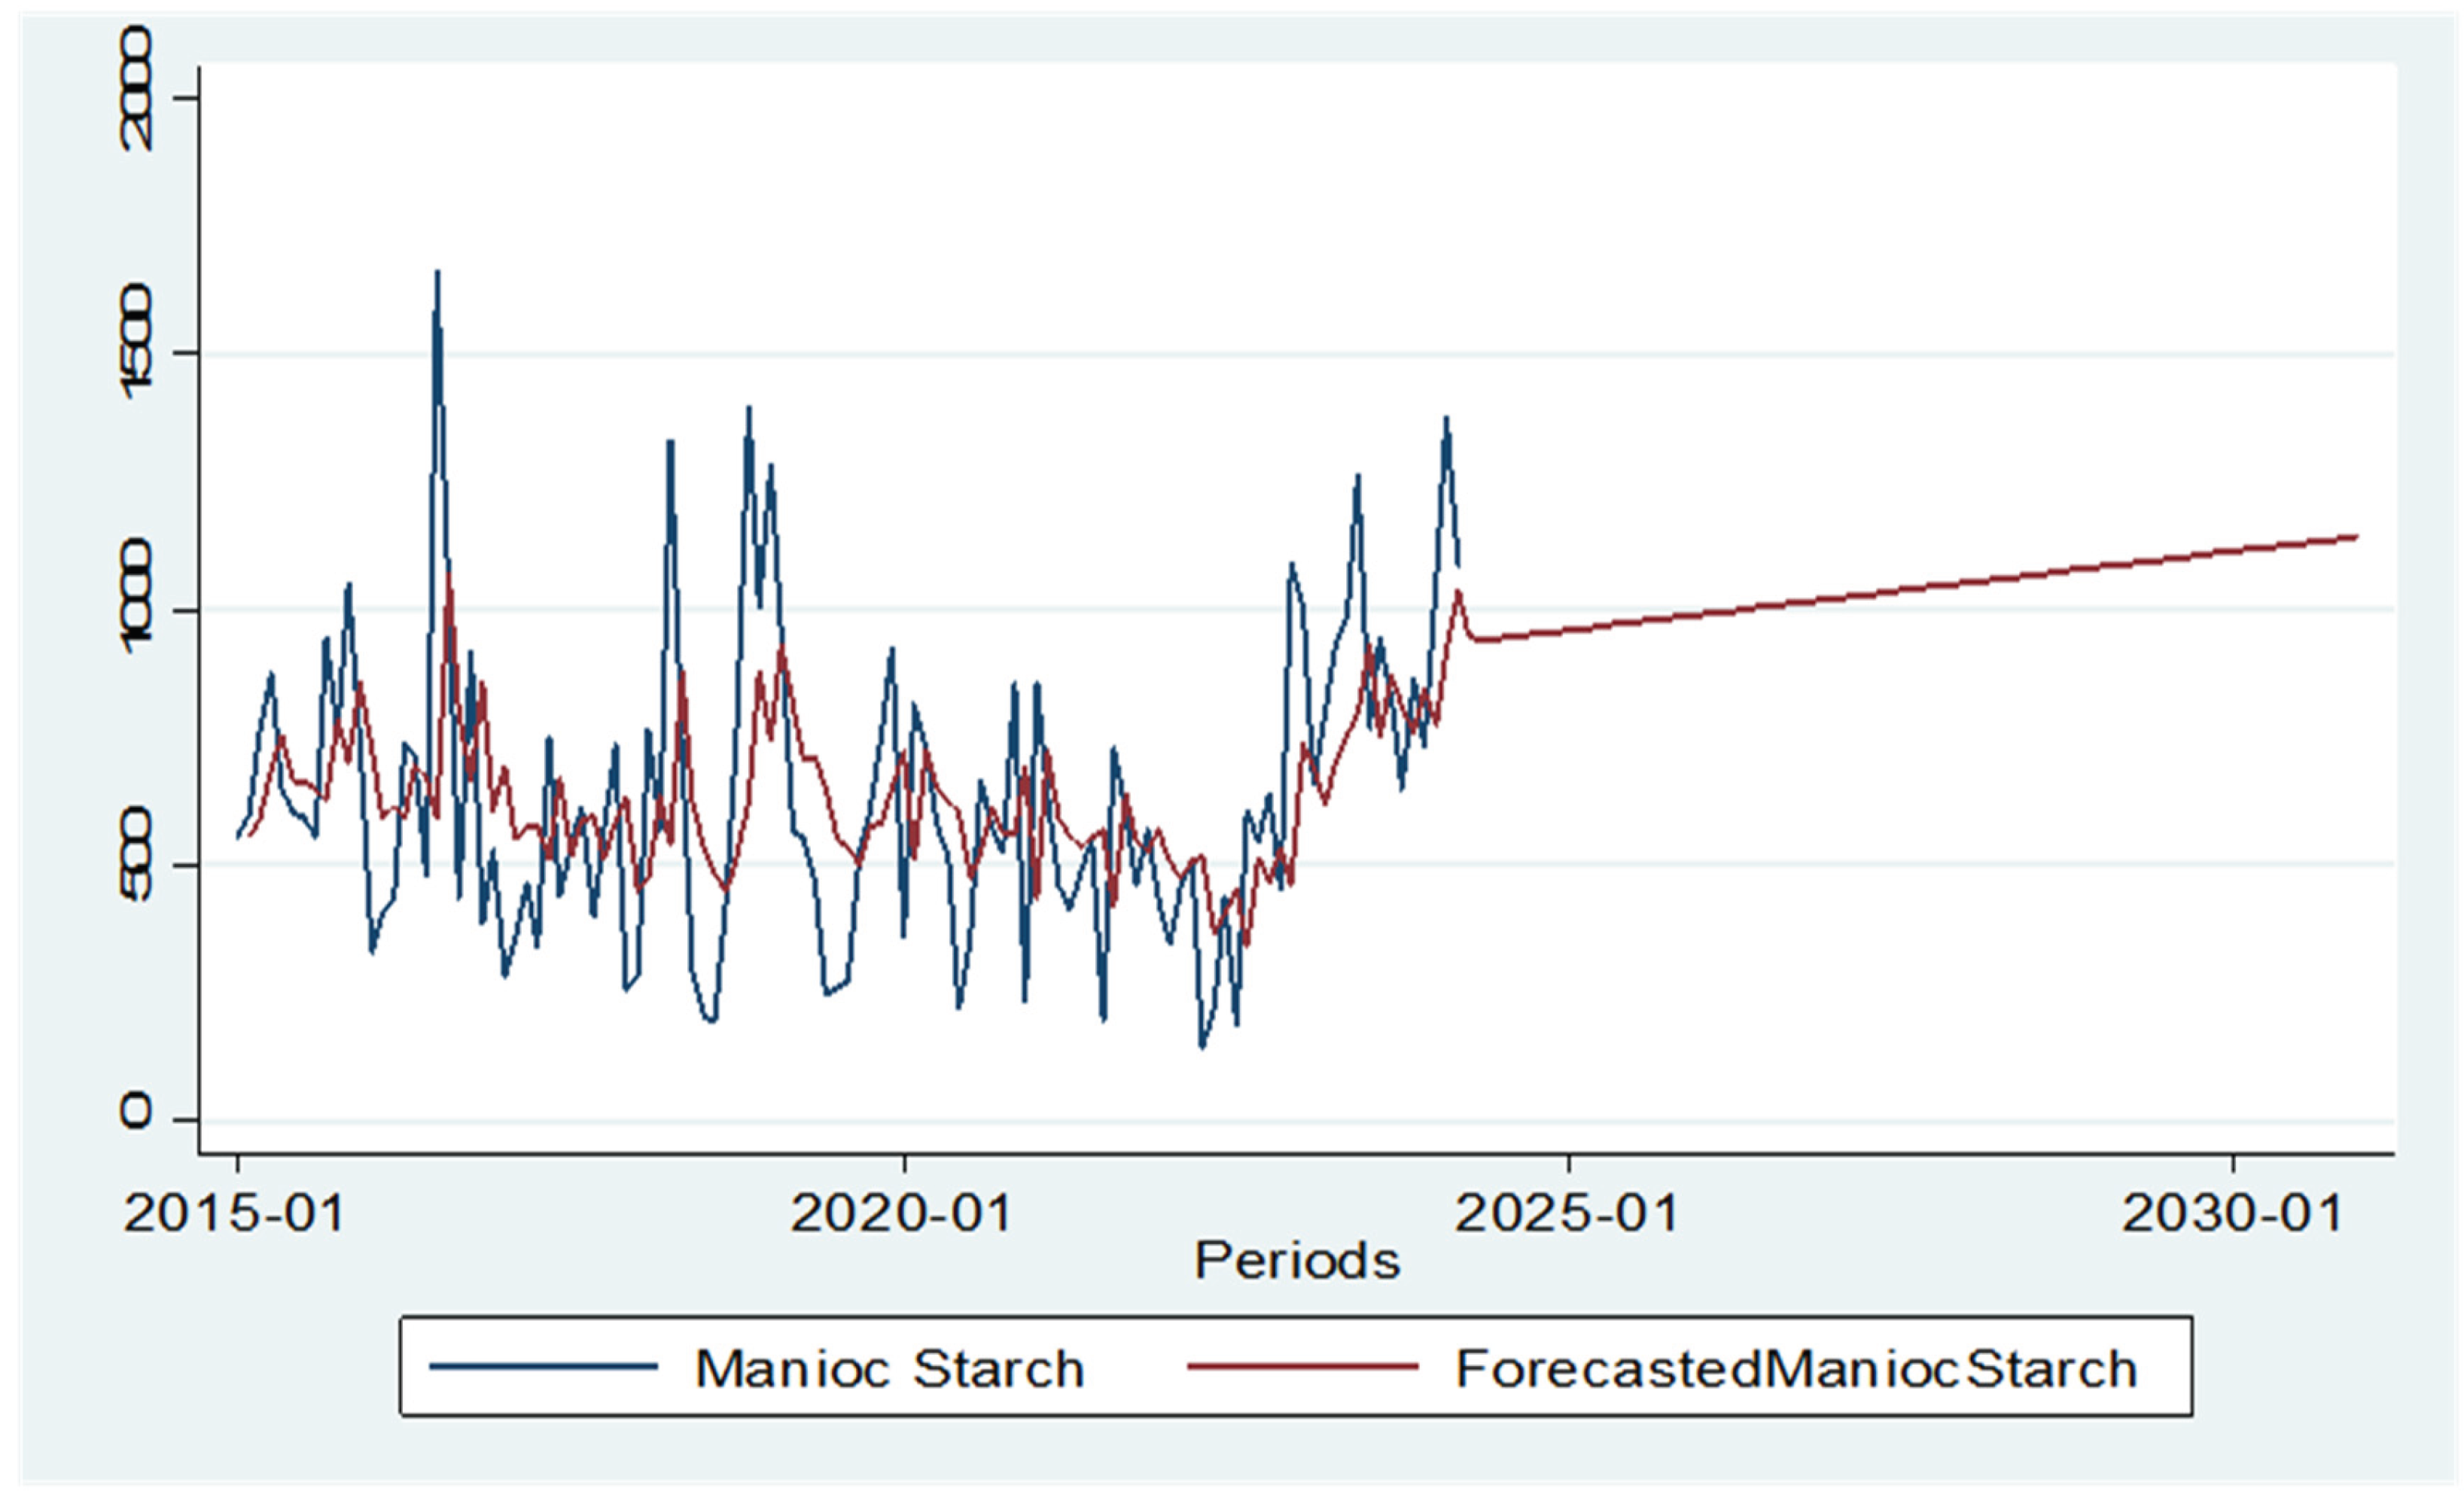

Table 1.
Results of Dickey-Fuller Test.
| Test-statistic | Probability* | |
|---|---|---|
| Augmented Dickey-Fuller test statistic | -4.589 | 0.0001 |
| Test critical values: 1% level | -3.507 | |
| 5% level | -2.889 | |
| 10% level | -2.579 |
*MacKinnon (1996) one-sided p-values. Source: Authors’ elaboration based on data extracted from ITC’s TradeMap database.
Table 2.
Tentative ARIMA models statistics for forecasting.
| ARIMA (0,1,1) | ARIMA (0,1,2) | ARIMA (0,1,4) | |
|---|---|---|---|
| R Squared | 1% | 1% | Not significant |
| Significant coefficients | 2 | 3 | 0 |
| AIC | 1 559.417 | 1 555.215 | 1 546.161 |
| BIC | 1 567.518 | 1 566.016 | 1 562.364 |
| HQC | -776.708 | -773.607 | -767.080 |
| Volatility | 281.384 | 272.849 | 253.916 |
AIC—Akaike Information Criterion; BIC—Bayesian Information Criterion; HQC—Hannan and Quin Information Criterion. Source: Authors’ elaboration based on data extracted from ITC’s TradeMap database.
Table 3.
South Africa’s annual forecasted cassava starch import demand.
| Year | Quantity (. |
|---|---|
| 2024 (April–December) | 8 535 |
| 2025 | 11 688 |
| 2026 | 12 059 |
| 2027 | 12 429 |
| 2028 | 12 800 |
| 2029 | 13 170 |
| 2030 | 13 541 |
| Total | 84 222 |
| Annual average | 12 032 |
Source: Authors’ elaboration based on data extracted from ITC’s TradeMap database.
Disclaimer/Publisher’s Note: The statements, opinions and data contained in all publications are solely those of the individual author(s) and contributor(s) and not of MDPI and/or the editor(s). MDPI and/or the editor(s) disclaim responsibility for any injury to people or property resulting from any ideas, methods, instructions or products referred to in the content. |
© 2026 by the authors. Licensee MDPI, Basel, Switzerland. This article is an open access article distributed under the terms and conditions of the Creative Commons Attribution (CC BY) license (http://creativecommons.org/licenses/by/4.0/).
Copyright: This open access article is published under a Creative Commons CC BY 4.0 license, which permit the free download, distribution, and reuse, provided that the author and preprint are cited in any reuse.