
Submitted:
17 July 2026
Posted:
17 July 2026
You are already at the latest version
Abstract
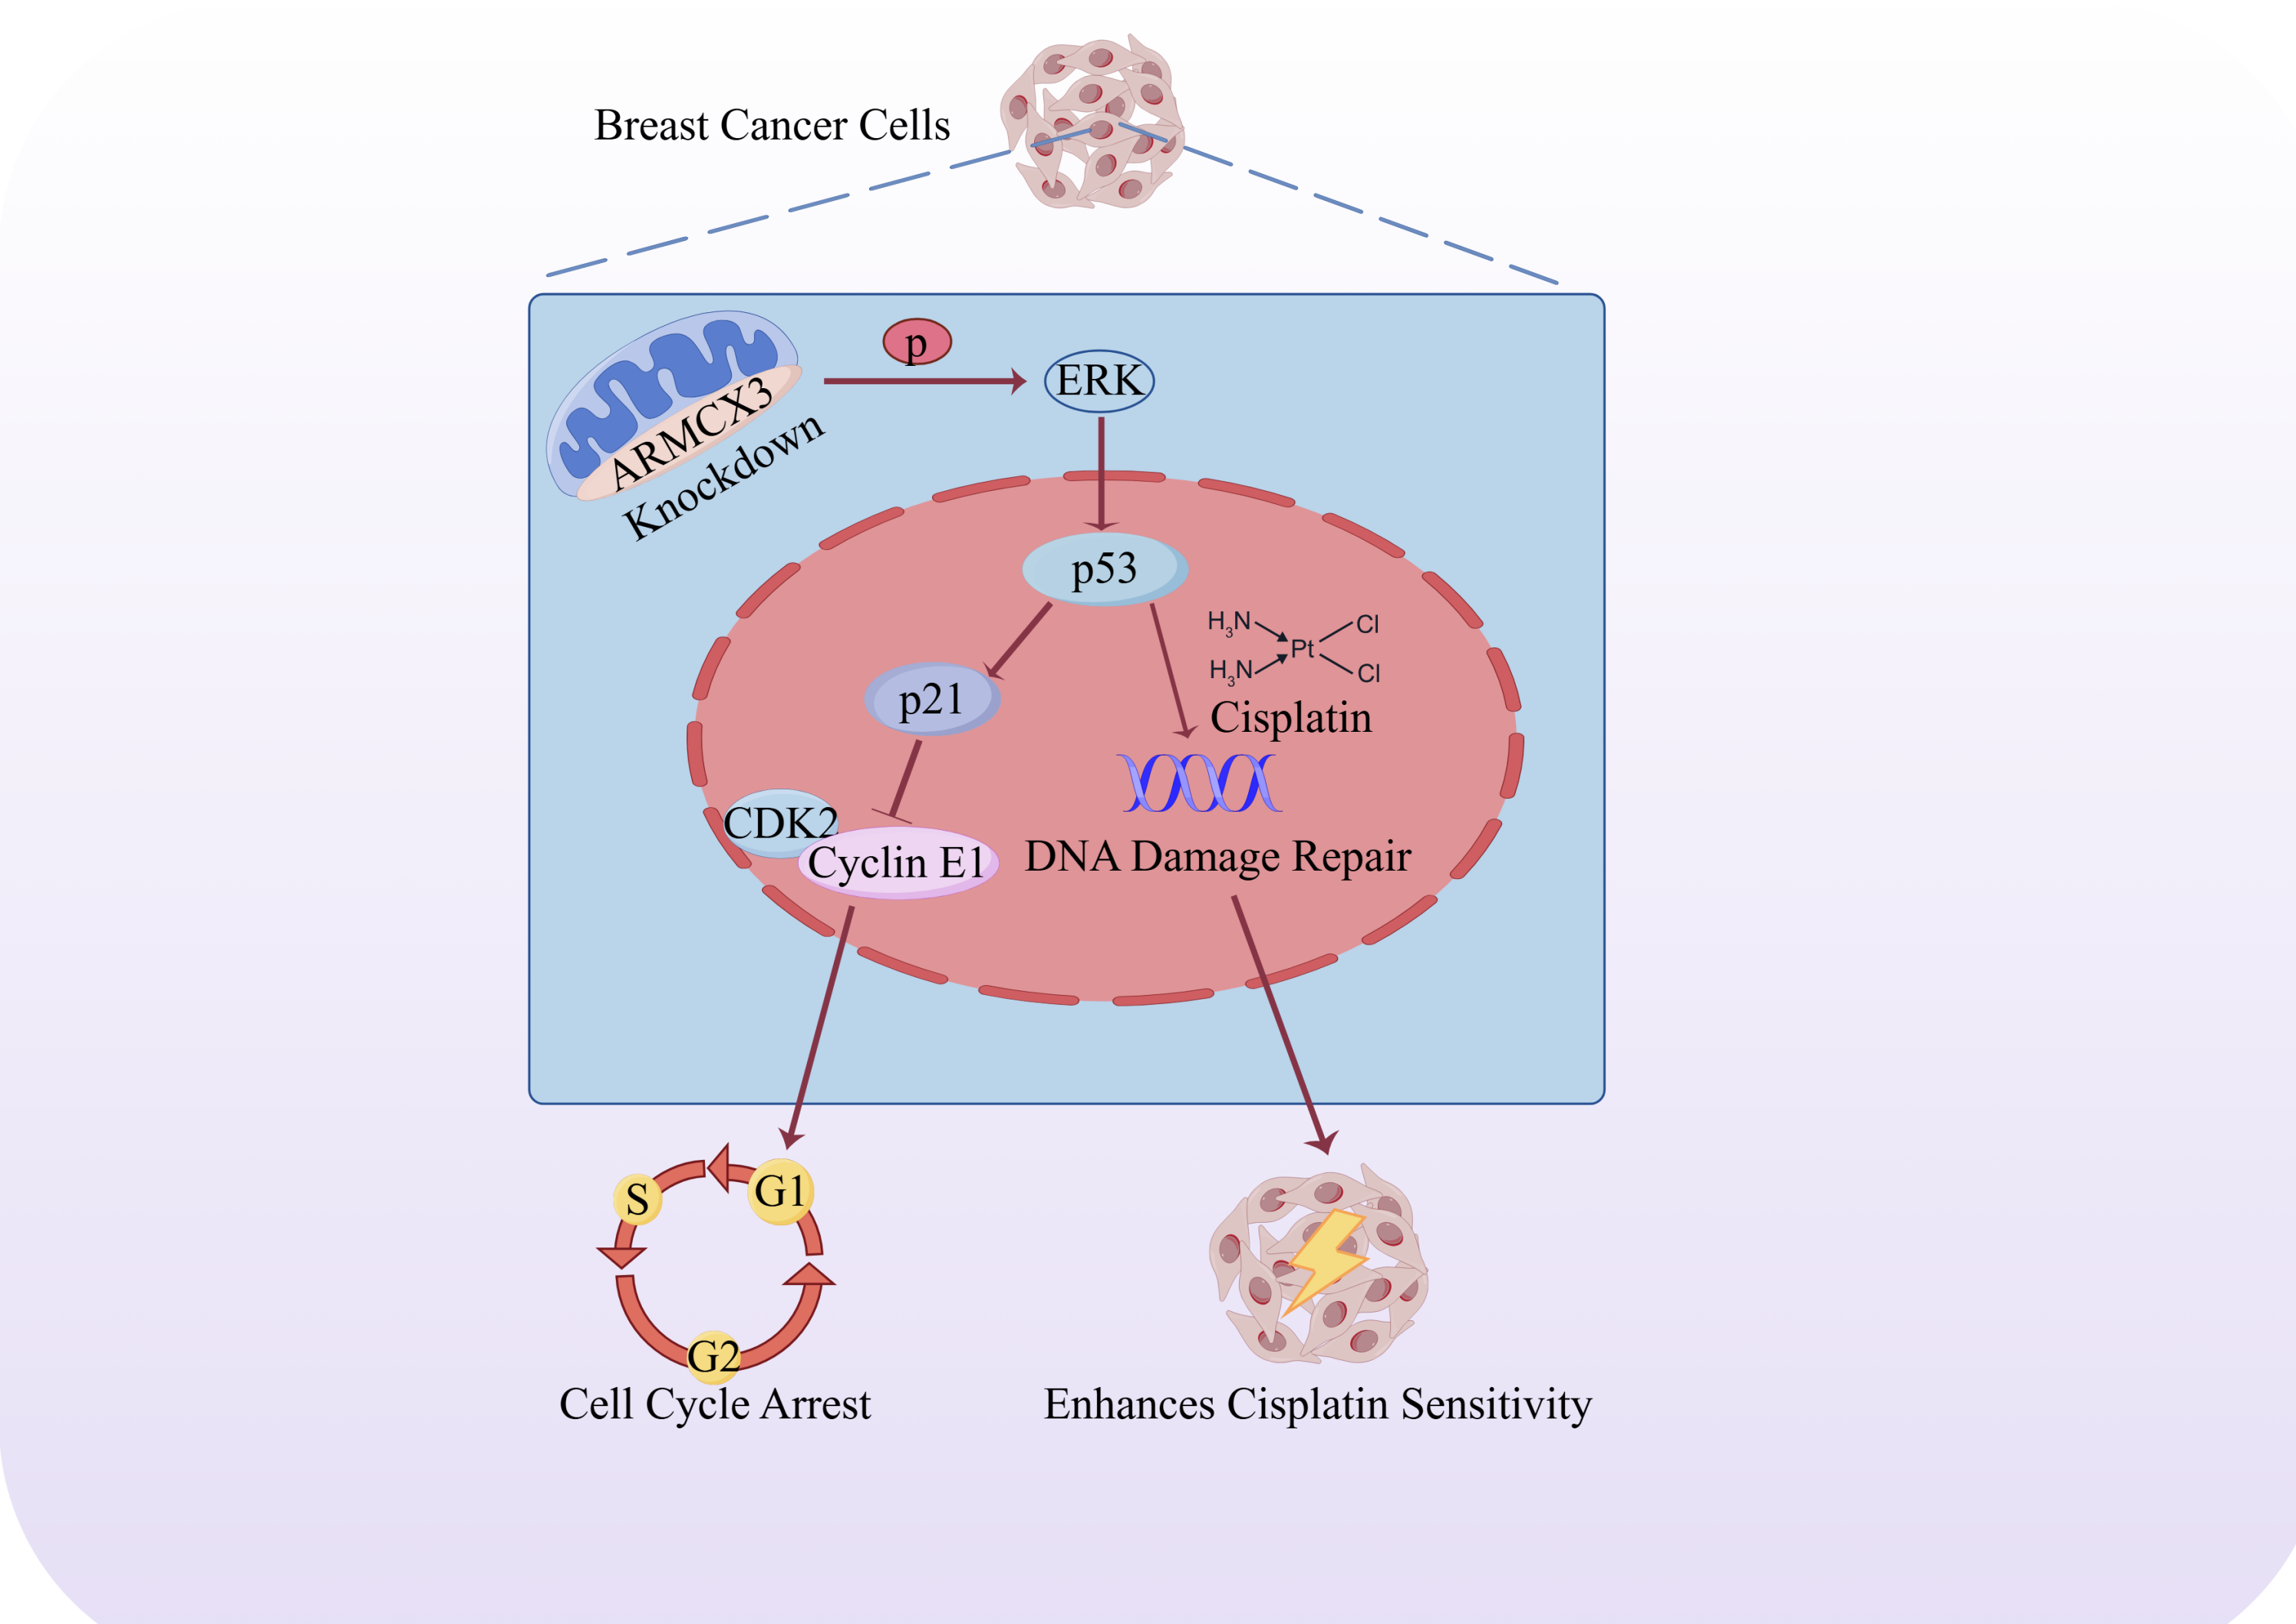
Breast cancer remains a leading cause of cancer-related death among women, and ac-quired cisplatin resistance limits the efficacy of chemotherapy. Although ARMCX3 has been implicated in breast cancer progression, its underlying regulatory mechanisms remain unclear. Building on our previous findings that ARMCX3 knockdown suppresses malignant phenotypes and enhances cisplatin sensitivity, we investigated the down-stream mechanisms involved. Transcriptomic analysis revealed activation of the p53 signaling pathway following ARMCX3 depletion. Inhibition of p53 using PFT-α largely reversed the effects of ARMCX3 knockdown on proliferation, migration, invasion, cell-cycle arrest, and cisplatin sensitivity, identifying p53 as a critical mediator of ARMCX3 function. Further analysis demonstrated that ERK signaling contributes to p53 activation following ARMCX3 depletion. ARMCX3 knockdown impaired DNA damage repair, increased DNA damage accumulation, and enhanced cisplatin-induced apoptosis, while these effects were partially attenuated by inhibition of ERK or p53 signaling. Xenograft experiments further confirmed the involvement of p53 in ARMCX3 knock-down-mediated tumor suppression. Collectively, these findings identify the p-ERK–p53 axis as an important mechanism underlying ARMCX3-mediated regulation of breast cancer progression and cisplatin response, suggesting ARMCX3 as a potential thera-peutic target for improving chemotherapy efficacy.
Keywords:
ARMCX3
; breast cancer
; p-ERK-p53 axis
; cisplatin sensitivity
; DNA damage repair
1. Introduction
Breast malignancies impose a substantial disease burden on the global female population and account for a considerable proportion of cancer-associated mortality [1]. Worldwide estimates for 2022 documented nearly 2.3 million newly diagnosed cases and approximately 670,000 related deaths [2]. Despite substantial advances in surgery, endocrine therapy, targeted therapy, and immunotherapy, chemotherapy remains an essential component of treatment for patients with advanced or metastatic breast cancer [3]. Cisplatin is widely used because it induces DNA damage and apoptosis in tumor cells. However, acquired chemoresistance in breast cancer cells markedly limits the therapeutic efficacy of cisplatin and remains a major obstacle to improving clinical outcomes [4,5,6]. Increasing evidence indicates that dysregulation of DNA damage responses and apoptotic signaling contributes to platinum resistance, yet the molecular mechanisms underlying these processes remain incompletely understood [7,8,9]. Therefore, identifying novel regulators of breast cancer progression and chemotherapy response may provide new opportunities for improving therapeutic efficacy.
ARMCX3 (Armadillo Repeat-Containing X-Linked Protein 3) is a highly conserved member of the ARMCX family that localizes predominantly to the outer mitochondrial membrane, where it participates in mitochondrial transport, dynamics, and cellular homeostasis [10,11,12]. Previous studies have implicated ARMCX3 in multiple biological processes, including neural development, Wnt/β-catenin signaling, and metabolic regulation [13,14]. Emerging evidence also suggests that ARMCX3 contributes to tumor progression. For example, ARMCX3 is upregulated in hepatocellular carcinoma, and its depletion suppresses tumor cell proliferation and migration [15]. In our earlier work, elevated ARMCX3 levels were detected in breast tumor specimens. Functional analyses further revealed that silencing ARMCX3 weakened the proliferative, migratory, and invasive properties of breast cancer cells and increased their responsiveness to cisplatin [16]. Nevertheless, the signaling events through which ARMCX3 produces these phenotypic changes have not yet been fully defined.
DNA damage responses are critical for maintaining genomic stability and determining cell fate following genotoxic stress. Among the key mediators of these responses, p53 is a central tumor suppressor that coordinates cell-cycle arrest, DNA repair, apoptosis, and cellular responses to genotoxic stress [17,18]. Loss of p53 function, most commonly caused by TP53 mutation, promotes tumor progression and therapeutic resistance [19,20,21]. Previous studies have also shown that ERK signaling can modulate p53 stability under stress conditions, suggesting potential crosstalk between these pathways during the DNA damage response [22,23,24]. However, whether ARMCX3, a protein predominantly localized to the outer mitochondrial membrane, participates in the regulation of DNA damage responses or p53 signaling in breast cancer has not been systematically investigated. Thus, in the present study, we sought to determine whether ARMCX3 influences breast cancer progression and cisplatin sensitivity through these signaling networks.
To explore this issue, RNA sequencing was initially used to characterize the transcriptional alterations induced by ARMCX3 depletion and to screen for candidate signaling networks associated with its function. The pathways identified from the sequencing data were subsequently examined through inhibitor-based intervention and a series of cellular and animal experiments. These approaches were used to determine how ARMCX3 influences tumor-associated behaviors and cellular responses to cisplatin. We proposed that ARMCX3 facilitates breast cancer development by affecting molecular programs governing cell-cycle progression and the DNA damage response. The present work was therefore designed to define the mechanistic role of ARMCX3 and to assess whether its modulation could offer a strategy for increasing the effectiveness of cisplatin treatment.
2. Materials and Methods
2.1. Public Database Analysis
ARMCX3 transcript abundance was compared between breast carcinoma specimens and nonmalignant mammary tissues using a combined dataset comprising the TCGA Breast Invasive Carcinoma cohort and the GTEx project. Protein-level differences were subsequently examined through the UALCAN web resource, which provides access to CPTAC proteomic profiles for primary breast tumors and corresponding normal tissues. The analysis was conducted without modification of the standard settings implemented in UALCAN.
ARMCX3 immunohistochemical staining data for nonmalignant mammary tissues and breast carcinoma specimens were retrieved from the Pathology and Tissue Atlas modules of the Human Protein Atlas (HPA; https://www.proteinatlas.org; accessed on June 13, 2025, organism: Homo sapiens). Detection of ARMCX3 was performed using the antibody HPA000967, which is listed by the HPA and supplied by Atlas Antibodies AB (Stockholm, Sweden). The staining level and proportion of positively stained cells were documented according to the classification criteria available on the HPA website. All representative micrographs were downloaded from the database and presented without post-acquisition image editing.
The prognostic relevance of ARMCX3 was further evaluated through the HPA Pathology Atlas using RNA-sequencing data derived from The Cancer Genome Atlas. The database-generated optimal cutoff was applied to stratify patients into groups with relatively higher or lower ARMCX3 transcript levels. Survival parameters, including the hazard ratio and log-rank P value, were taken directly from the HPA output. Apart from the standard analytical procedures implemented by the database, no independent normalization, cutoff adjustment, or secondary processing was conducted [25].
2.2. Cell Culture
The human breast cancer cell lines MCF-7 and MDA-MB-231, purchased from the Cell Bank of the Chinese Academy of Sciences, were cultured in high-glucose DMEM medium (Procell, Wuhan, China, PM150210), supplemented with 10% fetal bovine serum (Vivacell, Shanghai, China, C04001-500) and 1% penicillin-streptomycin solution (Biosharp, Beijing, China, BL505A). Cells were maintained at 37°C, 5% CO₂. Lentiviral vectors encoding ARMCX3 short hairpin RNA (shARMCX3) and the corresponding negative control (shControl) were designed, constructed, and packaged by HanHeng Biotechnology (Shanghai, China). The correct targeting sequence of shARMCX3 is the 19-nt sense strand 5′-GGC TTA AAG TAT ACA TGA A-3′. The validated shARMCX3 oligonucleotides used for vector construction were: Top strand: 5′-GAT CCG GCT TAA AGT ATA CAT GAA CTC GAG TTC ATG TAT ACT TTA AGC CTT TTT TG-3′; Bottom strand: 5′-AAT TCA AAA AAG GCT TAA AGT ATA CAT GAA CTC GAG TTC ATG TAT ACT TTA AGC CG-3′. All cells were incubated with the virus at 37°C for 24 h, after which the medium was replaced with fresh DMEM containing 5 μg/mL puromycin (Solarbio, Beijing, China, Cat#P8230). After 3 days of antibiotic selection, viable cells were expanded in 6-well plates and transferred into T25 flasks for subsequent experiments.
2.3. Bioinformatics
The transcriptomic dataset produced in the present work is publicly available through the Gene Expression Omnibus repository with the identifier GSE308702. Raw gene-level count data were analyzed in R (v4.3.1). Count normalization and statistical comparison between experimental groups were carried out with DESeq2. Following the criteria reported previously, genes showing an absolute log₂ fold change greater than 0.585, corresponding to an FC above 1.5 or below 0.67, together with an FDR below 0.05, were regarded as differentially expressed. Positive and negative log₂ fold-change values were used to classify the identified genes as upregulated and downregulated, respectively. The overall distribution of differential expression was illustrated with ggplot2 (v3.4.4), whereas expression patterns across samples were displayed using pheatmap (v1.0.12). For graphical presentation of individual gene abundance, normalized count values obtained from DESeq2 were converted using the formula log₂ (count + 1).
Functional characterization of the differentially expressed genes was carried out in R using clusterProfiler (v4.4.4). Enrichment of biological functions and signaling pathways was examined against the human Gene Ontology and KEGG annotation databases. A hypergeometric model was used to calculate enrichment, and the resulting P values were corrected for multiple testing by the Benjamini–Hochberg procedure. Enriched categories with an FDR-adjusted value of less than 0.05 were considered statistically meaningful. Results were displayed as bubble plots, with the enrichment factor, mapped gene number, and adjusted Q value used to describe the magnitude and significance of enrichment.
To assess the overall distribution of gene expression across samples, violin plots were generated using the ggplot2 package (v3.4.4) in R (v4.3.1), based on the log₂ (FPKM + 1) values of all detected genes in each sample. Pearson correlation coefficients were calculated from the FPKM expression matrix to evaluate sample consistency and biological reproducibility. Sample correlation heatmaps were generated using the pheatmap package (v1.0.12), with pairwise correlation coefficients displayed in the matrix. Principal component analysis (PCA) was performed using the prcomp function in base R, and PCA plots were generated using ggplot2 to evaluate sample clustering and potential batch effects.
Cellular RNA was isolated with TRIzol reagent supplied by Tiangen Biotech (Beijing, China; DP424). RNA quality was subsequently assessed by examining sample purity and integrity, and only qualified preparations were subjected to library construction. Messenger RNA libraries were prepared using the Hieff NGS Ultima Dual-mode mRNA Library Prep Kit for Illumina (Yeasen Biotechnology, Shanghai, China; 12301ES96) according to the protocol reported previously [26].
Poly(A)-containing transcripts were isolated from total RNA by capture with oligo(dT)-coated magnetic particles and then sheared to an appropriate length. The fragmented RNA served as the template for synthesis of the first cDNA strand using random hexamers. The complementary strand was subsequently generated with dNTPs; when a strand-specific protocol was applied, dTTP was replaced by dUTP at this step. After purification, the cDNA products underwent end repair, 3′ A-tailing, and attachment of sequencing adapters. Fragments of the required length were selected before library amplification. For strand-specific libraries, the dUTP-containing strand was enzymatically removed before PCR, thereby retaining information on transcript orientation. Preliminary library quantification was carried out with a Qubit 3.0 fluorometer (Invitrogen, USA), followed by qPCR-based determination of the amplifiable library concentration. Libraries that met the quality-control requirements were subjected to 150-bp paired-end sequencing on the NovaSeq 6000 system (Illumina, USA).
2.4. Reagents
Cell culture and experimental procedures were conducted using Dulbecco’s modified Eagle’s medium (DMEM; Procell, Wuhan, China; PM150210), fetal bovine serum (Vivacell, Shanghai, China; C04001-500), penicillin–streptomycin solution (Biosharp, Beijing, China; BL505A), and puromycin (Solarbio, Beijing, China; P8230). Protein extraction and immunoblotting were performed with RIPA lysis buffer (Beyotime, Shanghai, China), protease inhibitor cocktail (CWBIO, Beijing, China; CW2200S), phosphatase inhibitor cocktail (CWBIO; CW2383S), a bicinchoninic acid protein assay kit (Thermo Fisher Scientific, Waltham, MA, USA; 23225), and an enhanced chemiluminescence substrate (Millipore, Billerica, MA, USA). Additional reagents included Cell Counting Kit-8 reagent (Biosharp, Beijing, China; BS350A), crystal violet staining solution (Beyotime; C0121), Matrigel basement membrane matrix (Corning, NY, USA; 356234), propidium iodide/RNase A staining solution (KeyGEN BioTECH, Jiangsu, China; KGA9101-50), a comet assay kit (KeyGEN BioTECH, Jiangsu, China; KGA1302-100), paraformaldehyde (Servicebio, Wuhan, China; DF1035), and 3,3′-diaminobenzidine staining solution (Zhongshan Golden Bridge Biotechnology, Beijing, China; ZLI-9017).
2.5. Western Blotting
Cells were plated and exposed to PFT-α, trametinib, cisplatin, or the indicated combinations. At the end of treatment, total cellular protein was extracted using RIPA buffer supplemented with a protease inhibitor cocktail (CWBIO, Beijing, China; CW2200S) and a phosphatase inhibitor cocktail (CWBIO; CW2383S). Protein content was quantified with a bicinchoninic acid assay kit (Thermo Fisher Scientific, Waltham, MA, USA; 23225). Equal amounts of protein were denatured, separated by SDS–polyacrylamide gel electrophoresis, and electrotransferred onto polyvinylidene difluoride membranes. Nonspecific binding sites were blocked by incubating the membranes in 5% nonfat dry milk.
The membranes were then maintained at 4°C overnight with antibodies against β-actin (1:10,000; Abways, Shanghai, China), p53 (1:1,000; Abways), phospho-p53 (1:1,000; Abways), p21/CDKN1A (1:1,000; Abways), CDK2 (1:1,000; Abways), cyclin E1 (1:1,000; Abways), ERK1/2 (1:2,000; Proteintech, Wuhan, China), phospho-ERK1/2 (1:2,000; Cell Signaling Technology, Danvers, MA, USA), SAPK/JNK (1:1,000; Cell Signaling Technology), phospho-SAPK/JNK (1:1,000; Cell Signaling Technology), phospho-ATM (1:1,000; Cell Signaling Technology), p38/MAPK14 (1:1,000; Abcam, Cambridge, UK), phospho-p38 (1:1,000; Abcam), phospho-histone H2AX (1:1,000; Abcam), phospho-DNA-PKcs (1:5,000; Abcam), AKT (1:2,000; Proteintech), phospho-AKT (1:1,000; Abmart, Shanghai, China), N-cadherin (1:1,000; Abmart), and vimentin (1:1,000; Abmart).
After removal of unbound primary antibodies by washing, the membranes were exposed to the appropriate secondary antibodies (1:10,000; Abways) for 1 h at 37°C. Immunoreactive signals were visualized using an enhanced chemiluminescence substrate supplied by Millipore (Billerica, MA, USA). Each immunoblotting experiment was independently repeated no fewer than three times.
2.6. Cell Viability Assay
Exponentially growing cells were collected and dispensed into 96-well plates at 5 × 10⁴ cells/mL. After a 24-h attachment period under standard culture conditions (37°C and 5% CO₂), the indicated treatments were administered, and incubation was continued for 24, 48, or 72 h. At each designated endpoint, the spent medium was replaced with 100 μL of fresh culture medium supplemented with 10 μL of CCK-8 solution (Biosharp, Beijing, China; BS350A). Cell-free wells containing the same reaction mixture were included for background correction. Following a 2-h reaction at 37°C protected from light, optical density was recorded at 450 nm with a microplate spectrophotometer.
2.7. Transwell Cell Migration Assay
Seed breast cancer cells in the logarithmic growth phase, add the corresponding drug concentrations according to the experimental groups, and incubate the culture plates in a 37°C, 5% CO₂ incubator for 48 hours. After incubation, the chambers were fixed in 4% paraformaldehyde solution for 30 minutes, stained with 0.1% crystal violet (Beyotime, Shanghai, China, C0121) for 15 minutes, rinsed with distilled water to remove excess stain, and air-dried. Under a light microscope, photographs were taken of 5 randomly selected fields of view. The number of cells migrating to the lower surface of the chamber was counted using ImageJ software. The preparatory steps for the invasion assay were identical to those for the migration assay, with the addition of a step to coat the chambers with Matrigel matrix gel (Corning, NY, USA, 356234). Matrigel thawed overnight at 4°C, was evenly spread over the bottom surface of the upper chamber of the Transwell device. The device was placed in a 37°C incubator and left undisturbed for 3 hours until the Matrigel completely solidified, forming a uniform basement membrane. Subsequent cell seeding and incubation steps were the same as in the migration assay.
2.8. Cell Cycle Assay
Take 1 mL of the cell suspension and centrifuge again (300 × g, 5 min). Discard the supernatant, add 500 μL of pre-chilled 70% ethanol to the pellet, mix by pipette pipetting, and fix at -20°C overnight. After fixation, centrifuge at 300 × g for 5 min, discard the ethanol supernatant, wash the cells once with PBS (300 × g, 5 min), and collect the pellet. Calculate the total volume of staining working solution required based on 500 μL per sample. Freshly prepare the RNase A and PI working solution in a 1:9 ratio prior to staining. Add 500 μL of PI/RNase A (KeyGEN BioTECH, Jiangsu, China; KGA9101-50) staining solution to each tube, mix by pipetting up and down, and incubate at room temperature in the dark for 30–60 minutes. After staining, analyze the samples on a flow cytometer and record the red fluorescence signal at an excitation wavelength of 488 nm.
2.9. Detection of Cell Apoptosis Using Annexin V-PE/7-AAD Double Staining
Digest and collect cells using EDTA-free trypsin. Wash the cells twice with PBS (300× g, centrifuge for 5 min) and collect 1–5 × 10⁵ cells; add 500 μL of Binding Buffer and gently pipette to disperse into a single-cell suspension; add 1 μL of Annexin V-PE and 5 μL of 7-AAD, and mix gently; Incubate for 5–10 min at room temperature in the dark. Analyze by flow cytometry: Annexin V-PE (Ex=488 nm, Em=578 nm) emits orange-red fluorescence, detected via the PE channel (FL2). Fluorescence compensation adjustment: Use induced apoptotic cells as a control to perform fluorescence compensation adjustment to eliminate spectral overlap and set the cross-gate position.
2.10. Comet Assay
After adjusting the cells to the appropriate concentration, they were processed using the Comet Assay Kit (KeyGEN BioTECH, Jiangsu, China; KGA1302-100). The results were analyzed using Comet Score to assess comet morphology, measure tail moment, tail length, and the percentage of DNA in the tail, and evaluate cellular DNA damage.
2.11. Establishment of a Tumor-Bearing Mouse Model
BALB/c nude mice were obtained from China Jicui Yekang Biotechnology Co., Ltd. Following 7 days of acclimation, the animals were randomly allocated to the experimental groups and individually identified. They were maintained under specific environmental conditions, including an ambient temperature of 22 ± 2°C, relative humidity of 40–60%, and alternating 12-h light and 12-h dark periods. MCF-7 and MDA-MB-231 cells with stable ARMCX3 silencing were collected during exponential growth and suspended in an ice-cold 1:1 mixture of high-glucose DMEM basal medium (Procell, Wuhan, China; PM150210) and Matrigel (Corning, NY, USA; 356234). A total of 1 × 10⁷ cells in 100 μL were implanted subcutaneously into the right axillary region of each mouse. The inoculation area was inspected at intervals of 2–3 days, and palpable xenografts generally appeared approximately 1 week after implantation. Tumor dimensions were subsequently recorded at 3-day intervals. Xenograft volume was estimated as one-half of the product of the longest diameter and the square of the shortest diameter: V = L × W²/2. The animal procedures were reviewed and authorized by the Animal Ethics Committee of Chengdu Medical College under approval number Chengdu Medical College Ethics Committee [2026] No. 026.
2.12. Hematoxylin and Eosin Staining
Fixed tumor specimens were paraffin-embedded and sectioned for hematoxylin and eosin staining. Paraffin was removed by two successive 15-min incubations in xylene. Tissue sections were then hydrated sequentially in 100%, 95%, 85%, and 75% ethanol, with each step lasting 5 min, and subsequently washed in distilled water for 5 min. Nuclear staining was carried out with hematoxylin for 5 min, after which residual stain was removed by washing with distilled water. The slides were differentiated for 30 s and placed under running tap water for 5 min. Cytoplasmic counterstaining was then performed with eosin for 1 min, followed by removal of excess staining solution. Dehydration was achieved by rapidly passing the slides through 75%, 85%, 95%, and absolute ethanol I for 2–3 s per step, followed by a 1-min incubation in absolute ethanol II. Finally, the specimens underwent two 1-min xylene-clearing steps, were coverslipped with neutral mounting medium, and were examined under a light microscope.
2.13. Immunohistochemistry
Target tissues were collected from mice in each group, fixed in 4% paraformaldehyde (Regan Bio, Beijing, China; DF1035), subjected to gradient dehydration, and embedded in paraffin, followed by the preparation of 4-μm-thick serial sections. Remove the blocking solution and add the primary antibodies Ki67 (KeyGEN BioTECH, Jiangsu, China; KGA9402-50) and Cleaved-Caspase3 (CST, Danvers, MA, USA; 9661) separately, then incubate overnight at 4°C. The next day, add the secondary antibody and incubate at room temperature for 1 hour. Add DAB staining solution (Zhongshan Jinqiao, Shanghai, China; ZLI-9017), counterstain the cell nuclei with hematoxylin, and after dehydration and clearing, mount with neutral resin. Observe and capture images under a light microscope, randomly select multiple fields of view, and analyze the levels of positive protein expression.
2.14. Statistical Analysis
Statistical calculations and graphical preparation were carried out in GraphPad Prism 10.1.2. Quantitative data were reported as mean ± SEM and were obtained from no fewer than three independent biological experiments. For comparisons between two groups, a two-sided Student’s t-test was used when the data conformed to a normal distribution; otherwise, significance was assessed with the Mann–Whitney U test. Differences among three or more groups were examined by one-way analysis of variance followed by Tukey’s multiple-comparison test. Relationships between gene expression variables were evaluated using Spearman’s rank correlation coefficient. A P value below 0.05 was regarded as evidence of statistical significance.
3. Results
3.1. ARMCX3 Is Significantly Upregulated in Breast Cancer and Correlates with Adverse Prognostic Outcomes
Publicly accessible cancer datasets were used to evaluate the expression pattern and prognostic significance of ARMCX3 in breast malignancy. Integrated analysis of TCGA and GTEx data showed a marked elevation of ARMCX3 transcripts in tumor samples relative to nonmalignant breast tissues (Figure 1A). At the protein level, interrogation of CPTAC data through the UALCAN portal revealed a similar increase in breast carcinoma specimens (Figure 1B). This expression pattern was further supported by representative immunohistochemical sections obtained from the Human Protein Atlas, in which tumor tissues displayed more intense ARMCX3 staining than normal mammary tissues (Figure 1C). Survival analysis using Kaplan–Meier curves showed that elevated ARMCX3 expression was linked to reduced overall survival compared with lower expression levels (Figure 1D). Taken together, the concordant transcriptomic, proteomic, histological, and survival data suggest that aberrant ARMCX3 elevation is related to breast cancer development and adverse clinical outcome.
3.2. Knocking Down ARMCX3 Triggers p53 Pathway Activation in Breast Cancer Cells as Revealed by Transcriptomic Profiling
Given the elevated abundance of ARMCX3 in breast tumors and its relationship with adverse patient outcomes, we investigated the signaling events that may account for its tumor-promoting activity. Our earlier experiments showed that depletion of ARMCX3 curtailed cellular growth, motility, and invasive capacity and simultaneously increased the responsiveness of breast cancer cells to cisplatin. Nevertheless, the molecular mediators connecting ARMCX3 loss to these phenotypic alterations had not been defined. Stable MCF-7 and MDA-MB-231 models with lentivirus-mediated ARMCX3 silencing were therefore generated for mechanistic analyses (Figure 2A).
RNA sequencing was subsequently conducted in shControl and shARMCX3 cells to characterize transcriptional changes induced by ARMCX3 depletion. In MCF-7 cells, 3,446 genes showed significant expression alterations, of which 2,276 displayed increased expression and 1,170 displayed decreased expression (Figure 2B, C, F, G). In MDA-MB-231 cells, 1,568 genes met the differential-expression criteria, with 587 showing positive expression changes and 981 showing negative expression changes (Figure 2D–G).
Functional annotation of these gene sets was then carried out through Gene Ontology and Kyoto Encyclopedia of Genes and Genomes pathway analyses. The resulting enrichment profiles from both cell models highlighted the p53 signaling cascade as one of the most prominently altered pathways following ARMCX3 depletion (Figure 3A, B). Gene set enrichment analysis provided additional evidence for enhanced p53 pathway activity in MCF-7 and MDA-MB-231 cells lacking ARMCX3 (Figure 3C, D). In agreement with the sequencing-based results, immunoblot analysis showed increased activity of the p53 axis after ARMCX3 silencing (Figure 3E). Together, these findings identified the p53 signaling pathway as a major downstream pathway associated with ARMCX3 knockdown.
3.3. ARMCX3 Knockdown Inhibits the Activity of Breast Cancer Cells by Activating the p53 Signaling Pathway
We next investigated whether p53 mediates the suppressive effects of ARMCX3 knockdown on breast cancer progression. To this end, cells were treated with the p53 inhibitor PFT-α to pharmacologically block p53 signaling. CCK-8 assays showed that ARMCX3 knockdown significantly inhibited the proliferation of both MCF-7 and MDA-MB-231 cells, whereas PFT-α treatment largely restored cell proliferation (Figure 4A). Similarly, Transwell assays demonstrated that ARMCX3 depletion markedly reduced the migratory and invasive capacities of both breast cancer cell lines (Figure 4B, C). These inhibitory effects were substantially reversed following p53 inhibition, indicating that p53 activation is required for the suppression of breast cancer cell migration and invasion induced by ARMCX3 knockdown.
To further determine whether p53 contributes to ARMCX3-mediated regulation of epithelial–mesenchymal transition (EMT), the expression of EMT-related proteins was examined by Western blotting (Figure 4D). Compared with the control group, ARMCX3 knockdown increased E-cadherin expression while reducing N-cadherin and Vimentin expression, indicating inhibition of EMT. Following PFT-α treatment, these changes were largely reversed, with decreased E-cadherin expression and restored expression of the mesenchymal markers N-cadherin and Vimentin. These findings suggest that p53 activation contributes to ARMCX3 knockdown-induced suppression of EMT.
Because inhibition of cell proliferation is commonly associated with cell-cycle arrest, we next examined cell-cycle distribution by flow cytometry [27]. ARMCX3 knockdown significantly increased the proportion of cells in the G1 phase while reducing the S-phase population in both breast cancer cell lines (Figure 4E). Inhibition of p53 largely reversed these alterations, indicating that activation of p53 is required for ARMCX3 knockdown-induced G1-phase arrest. To further investigate the molecular basis of this phenotype, we examined key regulators of the G1/S transition. Western blot analysis showed that ARMCX3 knockdown markedly increased the expression of phosphorylated p53 and its downstream effector p21, whereas the levels of CDK2 and Cyclin E1 were substantially decreased (Figure 4F). These molecular changes were largely abolished following PFT-α treatment, confirming that ARMCX3 regulates the p21–CDK2–Cyclin E1 signaling cascade in a p53-dependent manner. Collectively, these findings demonstrate that activation of p53 is required for the inhibitory effects of ARMCX3 knockdown on breast cancer cell proliferation, migration, invasion, EMT progression, and G1/S cell-cycle transition, establishing p53 as a critical downstream mediator of ARMCX3 in breast cancer cells.
3.4. ARMCX3 Knockdown Enhances Cisplatin Sensitivity Through p53-Dependent Suppression of DNA Damage Repair
Cisplatin is a commonly used chemotherapeutic agent in breast cancer treatment [5,28]. We next investigated whether p53 also contributes to ARMCX3-mediated regulation of cisplatin sensitivity. Cells were treated with the p53 inhibitor PFT-α followed by cisplatin exposure to determine whether pharmacological inhibition of p53 could reverse the chemosensitizing effects induced by ARMCX3 depletion. Flow cytometric analysis showed that cisplatin treatment significantly increased apoptosis in both MCF-7 and MDA-MB-231 cells (Figure 5A, B). Notably, ARMCX3 knockdown further enhanced cisplatin-induced apoptosis compared with the corresponding control groups. In contrast, inhibition of p53 with PFT-α markedly attenuated apoptosis in ARMCX3-knockdown cells, whereas it had little effect on control cells. These findings indicate that activation of p53 is required for the enhanced apoptotic response induced by ARMCX3 depletion.
Because cisplatin primarily exerts its cytotoxic effect by inducing DNA double-strand breaks [29], we next evaluated DNA damage following p53 inhibition. Western blot analysis was performed to detect the phosphorylation of histone H2AX at serine 139 (γ-H2AX), a well-established marker of DNA double-strand breaks [30]. ARMCX3 knockdown significantly increased p-γ-H2AX expression after cisplatin treatment in both breast cancer cell lines (Figure 5E, F). Consistently, comet assays demonstrated markedly increased comet tail length and tail moment in ARMCX3-knockdown cells compared with control cells (Figure 5C, D), indicating more severe DNA damage. Importantly, treatment with PFT-α substantially reduced p-γ-H2AX expression and alleviated DNA damage in ARMCX3-depleted cells. These results suggest that p53 activation contributes to DNA damage accumulation following ARMCX3 knockdown.
To further investigate the mechanism underlying increased DNA damage, we examined the expression of proteins involved in the two major DNA double-strand break repair pathways, homologous recombination (HR) and non-homologous end joining (NHEJ) [31,32]. Western blot analysis showed that ARMCX3 knockdown markedly reduced the expression of p-ATM and p-DNA-PKcs following cisplatin treatment (Figure 5E, F), indicating impaired DNA damage repair capacity. In contrast, inhibition of p53 largely restored the expression of both repair-associated proteins in ARMCX3-knockdown cells. Collectively, these findings demonstrate that activation of p53 is required for ARMCX3 knockdown-induced cisplatin sensitization. Mechanistically, ARMCX3 depletion suppresses DNA damage repair through a p53-dependent mechanism, leading to increased DNA damage accumulation and enhanced apoptotic cell death following cisplatin treatment.
3.5. ARMCX3 Activates p53 and Downstream Effects in Breast Cancer Cells via ERK Signaling
To identify the upstream signaling mechanism responsible for p53 activation following ARMCX3 knockdown, we investigated the signaling mechanism that might drive its activation. Protein interaction network analysis placed MAPK1 and MAPK3, encoding ERK2 and ERK1, respectively, among the highest-ranking candidates associated with p53 (Figure 6A). Functional annotation of the RNA-sequencing dataset further showed an overrepresentation of genes linked to ERK signaling in ARMCX3-silenced cells (Figure 6B). These observations raised the possibility that ERK activity participates in the control of p53 after ARMCX3 loss.
Previous reports suggest that phosphorylated ERK can associate with p53 and protect it from ubiquitin-dependent proteolysis, thereby increasing p53 stability [33]. We therefore examined the phosphorylation status of ERK after ARMCX3 silencing. Immunoblotting revealed a pronounced elevation of phosphorylated ERK in both breast cancer cell models, while the overall abundance of ERK1/2 remained essentially unchanged (Figure 6C). Moreover, pharmacological blockade of MEK with trametinib diminished ERK phosphorylation and was accompanied by a reduction in p53 protein levels (Figure 6D). These results suggest that increased ERK activity contributes, at least in part, to the accumulation of p53 caused by ARMCX3 depletion.
To determine whether ERK signaling contributes to the biological effects regulated by ARMCX3, Transwell migration and invasion assays were performed following trametinib treatment. Consistent with our previous findings, ARMCX3 knockdown significantly reduced the migratory and invasive abilities of both MCF-7 and MDA-MB-231 cells (Figure 6E, F). Trametinib treatment significantly decreased migration and invasion in control cells. However, trametinib treatment did not further reduce migration or invasion in ARMCX3-knockdown cells. Following trametinib treatment, the migration and invasion capacities of ARMCX3-knockdown cells remained significantly higher than those of the corresponding control cells, except for the invasion ability of MDA-MB-231 cells.
We next evaluated whether ERK signaling contributes to ARMCX3-mediated regulation of epithelial–mesenchymal transition (EMT) by examining EMT-associated proteins (Figure 6G). Compared with control cells, ARMCX3 knockdown increased E-cadherin expression and reduced the expression levels of N-cadherin and Vimentin, indicating inhibition of EMT progression. In control cells, trametinib treatment significantly decreased the expression of N-cadherin and Vimentin, whereas E-cadherin expression was not significantly altered. In contrast, in ARMCX3-knockdown cells, trametinib treatment significantly reduced E-cadherin expression compared with ARMCX3 knockdown alone, while N-cadherin and Vimentin expression remained largely unchanged. Moreover, after trametinib treatment, the levels of the mesenchymal markers N-cadherin and Vimentin remained significantly higher in ARMCX3-knockdown cells than in control cells.
To further determine whether p-ERK, as an upstream regulator of p53, contributes to ARMCX3-mediated cisplatin sensitivity, we treated cells with the MEK inhibitor trametinib for validation. Consistent with the effects observed following PFT-α treatment, trametinib treatment produced similar phenotypic changes. Following cisplatin treatment alone, ARMCX3-knockdown cells exhibited significantly increased apoptosis, elevated levels of histone H2AX phosphorylation at serine 139 (γ-H2AX), and increased comet tail length and tail moment compared with control cells. In contrast, the expression levels of the DNA damage repair proteins p-ATM and p-DNA-PKcs were reduced in ARMCX3-knockdown cells. Following combined treatment with trametinib, these alterations were significantly reversed, including decreased apoptosis and DNA damage accumulation and restoration of p-ATM and p-DNA-PKcs expression (Figure S1). These results indicate that inhibition of ERK signaling attenuates the cisplatin sensitization induced by ARMCX3 depletion, further supporting the involvement of the p-ERK–p53 signaling axis in regulating chemotherapy response in breast cancer.
Collectively, these findings demonstrate that ARMCX3 knockdown activates ERK signaling, which contributes to subsequent p53 activation and regulates multiple downstream biological effects, including breast cancer cell migration, invasion, EMT progression, and cisplatin responsiveness.
3.6. ARMCX3 Knockdown Suppresses Breast Tumor Growth Through p53 Activation In Vivo
The contribution of p53 to the antitumor activity caused by ARMCX3 depletion was further examined in a mouse xenograft system. Breast cancer cells with stable ARMCX3 silencing were implanted subcutaneously, and tumor development was monitored. Relative to the shControl group, xenografts formed by ARMCX3-deficient cells showed a pronounced reduction in size and final mass (Figure 7A–F). Administration of PFT-α substantially weakened this growth suppression, as reflected by the recovery of both xenograft volume and weight compared with mice bearing ARMCX3-silenced tumors without PFT-α treatment.
We next performed histological and immunohistochemical analyses of xenograft tumors. Hematoxylin and eosin (H&E) staining revealed disrupted tumor architecture and reduced cellular density in tumors from the ARMCX3-knockdown group, whereas these histological alterations were partially alleviated following PFT-α treatment (Figure 7G, H). Consistent with the reduced tumor growth, immunohistochemical staining demonstrated that ARMCX3 knockdown markedly decreased the number of Ki67-positive proliferating cells while increasing Cleaved-Caspase-3-positive apoptotic cells. Inhibition of p53 largely reversed these changes, restoring tumor cell proliferation and reducing apoptosis toward levels observed in the control group. In summary, these findings demonstrate that p53 is required for the tumor-suppressive effects induced by ARMCX3 knockdown in vivo, further validating the pivotal role of the ARMCX3–p53 signaling axis in regulating breast cancer progression.
4. Discussion
Despite advances in systemic treatment, breast malignancy continues to account for substantial cancer mortality in women, while acquired resistance frequently compromises the clinical benefit of platinum-containing regimens [2,5]. Our earlier work showed that loss of ARMCX3 reduced the proliferative and metastatic properties of breast cancer cells and increased their susceptibility to cisplatin; however, the signaling events responsible for these phenotypic changes had not been defined. In the current investigation, transcriptome-wide analysis highlighted p53 signaling as the pathway most prominently affected by ARMCX3 depletion. Subsequent rescue assays showed that blocking p53 activity substantially reversed the inhibitory effects caused by ARMCX3 silencing, whereas ERK inhibition produced only a partial reversal. ARMCX3 loss also disrupted DNA repair capacity, promoted the accumulation of DNA damage, and strengthened cisplatin-triggered apoptosis in cultured cells. Xenograft experiments further demonstrated that p53 inhibition weakened the reduction in tumor growth caused by ARMCX3 depletion. Overall, our results suggest that ARMCX3 facilitates breast cancer progression and cisplatin resistance by maintaining ERK phosphorylation and restraining p53-dependent antitumor responses, although additional regulatory mechanisms may also contribute.
p53 functions as a key integrator of cellular stress signals and governs a broad range of biological processes, including cell-cycle control, programmed cell death, senescence, and the DNA damage response [34,35]. Earlier studies have established that p53 activation can restrain tumor development by promoting p21-dependent arrest at the G1/S checkpoint and by limiting metastatic traits through regulation of epithelial–mesenchymal transition-related programs [36,37]. In agreement with these findings, depletion of ARMCX3 elevated p53 and p21 levels, reduced the abundance of CDK2 and cyclin E1, and consequently induced G1/S-phase arrest. Moreover, pharmacological blockade of p53 with PFT-α substantially reversed the effects of ARMCX3 silencing on cell growth, motility, invasion, and EMT-associated protein expression. These results indicate that p53 serves as an important downstream mediator through which ARMCX3 influences the malignant behavior of breast cancer cells.
Beyond its role in cell-cycle regulation, p53 is also a key determinant of cellular responses to DNA-damaging chemotherapy. Following genotoxic stress, p53 coordinates the balance between DNA repair and apoptosis [38]. Moderate DNA damage may initially activate repair pathways, whereas persistent or excessive DNA damage promotes p53-dependent apoptotic signaling to eliminate damaged cell [39]. In the present study, ARMCX3 knockdown significantly reduced the expression of the DNA repair proteins p-ATM and p-DNA-PKcs, accompanied by increased γ-H2AX (Ser139) phosphorylation, greater DNA fragmentation in comet assays, and enhanced cisplatin-induced apoptosis. Importantly, these effects were largely reversed by PFT-α treatment, suggesting that impaired DNA repair following ARMCX3 depletion is primarily mediated through p53-dependent signaling. Collectively, these findings suggest that activation of p53 shifts the cellular response from DNA repair toward apoptosis, thereby increasing the in vitro sensitivity of breast cancer cells to cisplatin.
We next investigated the upstream mechanism responsible for p53 activation. ERK signaling has traditionally been regarded as a pro-survival pathway that promotes proliferation and tumor progression [40]. However, accumulating evidence indicates that sustained or excessive ERK activation may exert context-dependent tumor-suppressive functions [41]. Several studies have reported that activated ERK interacts with p53 and inhibits its ubiquitination-mediated degradation, thereby stabilizing p53 protein and enhancing its transcriptional activity [22,33]. Consistent with these reports, transcriptomic enrichment analysis and protein interaction prediction identified ERK signaling as a potential upstream pathway associated with ARMCX3 depletion. Western blot analysis further demonstrated increased p-ERK expression following ARMCX3 knockdown, whereas pharmacological inhibition of ERK reduced p53 protein levels. Nevertheless, trametinib only partially restored migration, invasion, EMT progression, DNA repair capacity, and cisplatin sensitivity, indicating that ERK contributes to, but is unlikely to be the sole regulator of, p53 activation. Because p53 integrates signals from multiple stress-responsive pathways, additional upstream regulators such as ATM, ATR, or other DNA damage-associated kinases may also participate in ARMCX3-mediated p53 activation.
An interesting observation in this study is that ARMCX3 knockdown activated p53 signaling in both MCF-7 cells carrying wild-type TP53 and MDA-MB-231 cells harboring the TP53 R280K missense mutation. Wild-type p53 primarily functions as a transcription factor that induces cell-cycle arrest and apoptosis, whereas mutant p53 frequently acquires oncogenic gain-of-function properties that promote tumor progression and therapeutic resistance [42,43]. Nevertheless, increasing evidence indicates that certain TP53 mutants may retain partial transcriptional activity or remain responsive to upstream post-translational regulation under specific cellular contexts [44,45,46]. Therefore, the increase in p53 signaling observed in MDA-MB-231 cells following ARMCX3 knockdown may reflect stabilization of residual mutant p53 activity or activation of compensatory transcriptional programs that overlap with canonical p53 signaling. Since the present study did not directly evaluate mutant p53 transcriptional activity, additional investigations will be required to clarify the precise mechanism by which ARMCX3 regulates p53 signaling in TP53-mutant breast cancer cells.
Several limitations should be acknowledged. First, although our data indicate that ERK contributes to p53 activation following ARMCX3 depletion, the molecular mechanism linking the mitochondrial protein ARMCX3 to cytoplasmic ERK signaling remains unclear. Given the established role of ARMCX3 in mitochondrial dynamics, it will be important to investigate how mitochondrial homeostasis communicates with kinase signaling cascades. Second, although xenograft experiments confirmed the p53-dependent suppression of tumor growth induced by ARMCX3 knockdown, the cisplatin-sensitizing effect was evaluated only in vitro and should be validated in animal models receiving cisplatin treatment. Third, only two breast cancer cell lines were examined in this study. Whether the ARMCX3–ERK–p53 signaling axis operates similarly in other molecular subtypes, particularly HER2-positive breast cancer, requires further investigation.
Based on our findings, we propose a working hypothesis regarding the context-dependent function of ERK signaling downstream of ARMCX3. Under physiological conditions, ARMCX3 may restrain ERK activation at a level that primarily supports proliferative signaling. Following ARMCX3 depletion, however, ERK activity may become sufficiently elevated to favor stabilization of p53 rather than classical mitogenic signaling, thereby shifting the overall biological output from tumor promotion toward growth suppression. Although this hypothesis requires further experimental validation, it may help explain why increased p-ERK was accompanied by inhibition, rather than promotion, of malignant phenotypes in the present study.
In conclusion, this study demonstrates that ARMCX3 promotes breast cancer progression and modulates cisplatin responsiveness through regulation of the p-ERK–p53 signaling axis. Our findings identify p53 as a critical downstream mediator of ARMCX3 and suggest that ERK contributes to p53 activation following ARMCX3 depletion. By impairing DNA damage repair and promoting apoptosis, ARMCX3 knockdown increases the in vitro sensitivity of breast cancer cells to cisplatin. These findings provide mechanistic insight into the biological function of ARMCX3 in breast cancer and suggest that targeting ARMCX3 may represent a potential therapeutic opportunity that warrants further in vivo validation.
5. Conclusions
In summary, the present study demonstrates that ARMCX3 promotes breast cancer progression and modulates cisplatin responsiveness through regulation of the p-ERK–p53 signaling axis. ARMCX3 knockdown suppressed breast cancer cell proliferation, migration, invasion, and tumor growth, while enhancing cisplatin sensitivity in vitro. Mechanistically, ARMCX3 depletion activated p53 signaling, with ERK contributing to p53 activation, leading to activation of the p21–CDK2–Cyclin E1 axis and G1-phase cell-cycle arrest. In addition, ARMCX3 knockdown reduced the activation of homologous recombination- and non-homologous end joining-associated DNA repair pathways, resulting in increased DNA damage accumulation and apoptosis following cisplatin treatment. Collectively, these findings provide mechanistic insight into the biological function of ARMCX3 in breast cancer and support further investigation of ARMCX3 as a potential therapeutic target for improving cisplatin responsiveness, which warrants additional validation in vivo.
Supplementary Materials
The following supporting information can be downloaded at the website of this paper posted on Preprints.org. Figure S1: ARMCX3 knockdown enhances cisplatin sensitivity via promoting DNA damage and apoptosis, which is reversed by trametinib treatment. Supplementary File S1: Original uncropped Western blot images.
Author Contributions
Conceptualization, F.G., H.Z. and J.W.; Data curation, X.D., J.Z. and H.M.; Formal analysis, H.M., J.Z. and X.H.; Investigation, X.D., H.M., J.Z. and M.C.; Methodology, H.M., J.Z. and X.H.; Supervision, F.G., H.Z. and J.W.; Visualization, X.D. and X.H.; Writing—original draft, X.D., H.M. and J.Z.; Writing—review & editing, F.G., H.Z. and J.W. All authors have read and agreed to the published version of the manuscript.
Funding
This work was supported by Chengdu Medical College Technology Program (grant number CYZZD24-09).
Institutional Review Board Statement
All animal experiments were conducted in accordance with the National Institutes of Health Guide for the Care and Use of Laboratory Animals and approved by the Chengdu Medical College Laboratory Animal Ethics Committee (Chengdu Medical College Ethics Committee [2026] No. 026).
Informed Consent Statement
Not applicable.
Data Availability Statement
The RNA-sequencing data generated in this study have been deposited in the NCBI Gene Expression Omnibus (GEO) database under accession number GSE308702. Publicly available data analyzed in this study were obtained from The Cancer Genome Atlas (TCGA), the Genotype-Tissue Expression (GTEx) project, the Clinical Proteomic Tumor Analysis Consortium (CPTAC) through the UALCAN portal, and the Human Protein Atlas (HPA). The remaining data supporting the findings of this study are available within the article and its Supplementary Materials. Additional data are available from the corresponding author upon reasonable request.
Acknowledgments
The authors acknowledge the use of Figdraw (www.figdraw.com, accessed on 14 July 2026) for creating the figures.
Conflicts of Interest
The authors declare no conflicts of interest.
References
- Bray, F.; Laversanne, M.; Sung, H.; Ferlay, J.; Siegel, R.L.; Soerjomataram, I.; et al. Global cancer statistics 2022: GLOBOCAN estimates of incidence and mortality worldwide for 36 cancers in 185 countries. CA Cancer J. Clin. 2024, 74, 229–263. [Google Scholar] [CrossRef] [PubMed]
- Kim, J.; Harper, A.; McCormack, V.; Sung, H.; Houssami, N.; Morgan, E.; et al. Global patterns and trends in breast cancer incidence and mortality across 185 countries. Nat. Med. 2025, 31, 1154–1162. [Google Scholar] [CrossRef] [PubMed]
- Shuai, Y.; Ma, Z.; Yue, J.; Li, C.; Ju, J.; Wang, X.; et al. MNX1-AS1 suppresses chemosensitivity by activating the PI3K/AKT pathway in breast cancer. Int. J. Biol. Sci. 2025, 21, 3689–3704. [Google Scholar] [CrossRef] [PubMed]
- Wang, H.; Guo, Q.; Shen, Y.; Ding, K.; Chen, Y.; Wang, X.; et al. ARTS Confers Chemoresistance of Breast Cancer by Inducing Apoptosis-Dependent Autophagy via Livin-MDM2-p53 Pathway. Research (Wash D C) 2026, 9, 1086. [Google Scholar] [CrossRef] [PubMed]
- Hashemi, M.; Khosroshahi, E.M.; Chegini, M.K.; Asadi, S.; Hamyani, Z.; Jafari, Y.A.; et al. Mechanistic insights into cisplatin response in breast tumors: Molecular determinants and drug/nanotechnology-based therapeutic opportunities. Mutat. Res. Rev. Mutat. Res. 2024, 794, 108513. [Google Scholar] [CrossRef] [PubMed]
- Zhang, J.; Cao, C.; Yang, H.; Yang, L.; Wang, M.; Liu, X.; et al. ATP6V0D2 drives triple-negative breast cancer progression and inhibits cisplatin sensitivity by promoting PHLPP2 lysosomal degradation. iScience 2025, 28, 113853. [Google Scholar] [CrossRef] [PubMed]
- Azizidoost, S.; Sheykhi-Sabzehpoush, M.; Dari, M.A.G.; Józkowiak, M.; Niebora, J.; Domagała, D.; et al. LncRNA-mediated regulation of cisplatin response in breast cancer. Pathol. Res. Pract. 2024, 264, 155716. [Google Scholar] [CrossRef] [PubMed]
- Saha, S.; Mahapatra, S.; Khanra, S.; Mishra, B.; Swain, B.; Malhotra, D.; et al. Decoding breast cancer treatment resistance through genetic, epigenetic, and immune-regulatory mechanisms: from molecular insights to translational perspectives. Cancer Drug Resist. 2025, 8, 36. [Google Scholar] [CrossRef] [PubMed]
- Li, H.; Sheng, J.J.; Zheng, S.A.; Liu, P.W.; Wu, N.; Zeng, W.J.; et al. Platinum-resistant ovarian cancer: From mechanisms to treatment strategies. Genes Dis. 2026, 13, 101801. [Google Scholar] [CrossRef] [PubMed]
- Huang, Y.; Jiang, Z.; Gao, X.; Luo, P.; Jiang, X. ARMC Subfamily: Structures, Functions, Evolutions, Interactions, and Diseases. Front Mol. Biosci. 2021, 8, 791597. [Google Scholar] [CrossRef] [PubMed]
- Serrat, R.; Mirra, S.; Figueiro-Silva, J.; Navas-Pérez, E.; Quevedo, M.; López-Doménech, G.; et al. The Armc10/SVH gene: genome context, regulation of mitochondrial dynamics and protection against Aβ-induced mitochondrial fragmentation. Cell Death Dis. 2014, 5, e1163. [Google Scholar] [CrossRef] [PubMed]
- López-Doménech, G.; Serrat, R.; Mirra, S.; D'Aniello, S.; Somorjai, I.; Abad, A.; et al. The Eutherian Armcx genes regulate mitochondrial trafficking in neurons and interact with Miro and Trak2. Nat. Commun. 2012, 3, 814. [Google Scholar] [CrossRef] [PubMed]
- Mirra, S.; Ulloa, F.; Gutierrez-Vallejo, I.; Martì, E.; Soriano, E. Function of Armcx3 and Armc10/SVH Genes in the Regulation of Progenitor Proliferation and Neural Differentiation in the Chicken Spinal Cord. Front Cell Neurosci. 2016, 10, 47. [Google Scholar] [CrossRef] [PubMed]
- Gavaldà-Navarro, A.; Mirra, S.; Manso, Y.; Sánchez-Infantes, D.; Giralt, M.; Soriano, E.; et al. The armadillo-repeat containing X-linked protein 3, ARMCX3, is a negative regulator of the browning of adipose tissue associated with obesity. Int. J. Obes. (Lond) 2022, 46, 1652–1661. [Google Scholar] [CrossRef] [PubMed]
- Mirra, S.; Gavaldà-Navarro, A.; Manso, Y.; Higuera, M.; Serrat, R.; Salcedo, M.T.; et al. ARMCX3 Mediates Susceptibility to Hepatic Tumorigenesis Promoted by Dietary Lipotoxicity. Cancers 2021, 13. [Google Scholar] [CrossRef] [PubMed]
- Huang, X.Y.; Ma, H.X.; Jiang, Z.Y.; et al. ARMCX3 regulates the proliferation, migration, and invasion of breast cancer cells. J. Chongqing Med. Univ. (in Chinese). 2025, 50, 1228–1235. [Google Scholar]
- Vogelstein, B.; Lane, D.; Levine, A.J. Surfing the p53 network. Nature 2000, 408, 307–310. [Google Scholar] [CrossRef] [PubMed]
- Martinez, J.D.; Mo, Q.; Xu, Y.; Qin, L.; Li, Y.; Xu, J. Common Genomic Aberrations in Mouse and Human Breast Cancers with Concurrent P53 Deficiency and Activated PTEN-PI3K-AKT Pathway. Int. J. Biol. Sci. 2022, 18, 229–241. [Google Scholar] [CrossRef] [PubMed]
- Muller, P.A.; Vousden, K.H. p53 mutations in cancer. Nat. Cell Biol. 2013, 15, 2–8. [Google Scholar] [CrossRef] [PubMed]
- Qayoom, H.; Haq, B.U.; Sofi, S.; Jan, N.; Jan, A.; Mir, M.A. Targeting mutant p53: a key player in breast cancer pathogenesis and beyond. Cell Commun. Signal. 2024, 22, 484. [Google Scholar] [CrossRef] [PubMed]
- Chung, J.Y.; Knutson, B.A. Bypassing the guardian: regulated cell death pathways in p53-mutant cancers. Cell Mol. Biol. Lett. 2025, 30, 68. [Google Scholar] [CrossRef] [PubMed]
- Persons, D.L.; Yazlovitskaya, E.M.; Pelling, J.C. Effect of extracellular signal-regulated kinase on p53 accumulation in response to cisplatin. J. Biol. Chem. 2000, 275, 35778–35785. [Google Scholar] [CrossRef] [PubMed]
- Klomp, J.E.; Diehl, J.N.; Klomp, J.A.; Edwards, A.C.; Yang, R.; Morales, A.J.; et al. Determining the ERK-regulated phosphoproteome driving KRAS-mutant cancer. Science 2024, 384, eadk0850. [Google Scholar] [CrossRef] [PubMed]
- Wang, M.; Ji, A.; Gao, R.; Hu, S. Coexistence of P53 and KRAS mutations enhances ERK1/2 signaling by inducing EGR1 expression through mutp53 and c-JUN interaction. Oncogene 2025, 44, 3787–3798. [Google Scholar] [CrossRef] [PubMed]
- Uhlén, M.; Fagerberg, L.; Hallström, B.M.; Lindskog, C.; Oksvold, P.; Mardinoglu, A.; et al. Proteomics. Tissue-based map of the human proteome. Science 2015, 347, 1260419. [Google Scholar] [CrossRef] [PubMed]
- Patel, M.; Singh, P.; Gandupalli, L.; Gupta, R. Identification and Evaluation of Survival-associated Common Chemoresistant Genes in Cancer. Biomed. Biotechnol. Res. Journal. 2024, 8, 320–327. [Google Scholar] [CrossRef]
- Mir, S.A.; Bhat, B.A.; Shenoy, P.S.; Hamid, L.; Nisar, N.; Dar, A.; et al. Naringenin Inhibits Cellular Proliferation, Arrests Cell Cycle and Induces Pro-Apoptotic Autophagy in MCF-7 Breast Cancer Cells. J. Cell Mol. Med. 2025, 29, e70747. [Google Scholar] [CrossRef] [PubMed]
- Izadi Nazar, A.H.; Safari Faramani, R.; Roushani Roudsari, Y.; Aghaz, F. Are hydrogels suitable for delivery of cisplatin to the microenvironment in breast cancer treatment: a meta-analysis. Ther. Deliv. 2025, 16, 963–974. [Google Scholar] [CrossRef] [PubMed]
- Cecati, M.; Pozzi, V.; Pompei, V.; Schiavoni, V.; Fumarola, S.; Romagnoli, A.; et al. Cisplatin as a Xenobiotic Agent: Molecular Mechanisms of Actions and Clinical Applications in Oncology. J. Xenobiot. 2026, 16. [Google Scholar] [CrossRef] [PubMed]
- Chiolo, I.; Altmeyer, M.; Legube, G.; Mekhail, K. Nuclear and genome dynamics underlying DNA double-strand break repair. Nat. Rev. Mol. Cell Biol. 2025, 26, 538–557. [Google Scholar] [CrossRef] [PubMed]
- Szmyd, R.; Casolin, S.; French, L.; Manjón, A.G.; Walter, M.; Cavalli, L.; et al. Homologous recombination promotes non-immunogenic mitotic cell death upon DNA damage. Nat. Cell Biol. 2025, 27, 59–72. [Google Scholar] [CrossRef] [PubMed]
- Luthman, A.J.; Chiruvella, K.K.; Kaminski, A.M.; Kunkel, T.A.; Pedersen, L.C.; Ramsden, D.A. Nonhomologous end-joining uses distinct mechanisms to repair each strand of a double strand break. Nat. Commun. 2025, 16, 11599. [Google Scholar] [CrossRef] [PubMed]
- Yan, H.; Wu, W.; Hu, Y.; Li, J.; Xu, J.; Chen, X.; et al. Regorafenib inhibits EphA2 phosphorylation and leads to liver damage via the ERK/MDM2/p53 axis. Nat. Commun. 2023, 14, 2756. [Google Scholar] [CrossRef] [PubMed]
- Andrysik, Z.; Espinosa, J.M. Harnessing p53 for targeted cancer therapy: new advances and future directions. Transcription 2025, 16, 3–46. [Google Scholar] [CrossRef] [PubMed]
- Liu, Y.; Stockwell, B.R.; Jiang, X.; Gu, W. p53-regulated non-apoptotic cell death pathways and their relevance in cancer and other diseases. Nat. Rev. Mol. Cell Biol. 2025, 26, 600–614. [Google Scholar] [CrossRef] [PubMed]
- Engeland, K. Cell cycle regulation: p53-p21-RB signaling. Cell Death Differ. 2022, 29, 946–960. [Google Scholar] [CrossRef] [PubMed]
- Khan, I.; Behera, A.; Babu, K.R.; Rehman, F.; Rehan, F.; Gupta, S.M.; et al. Epithelial-mesenchymal dynamics in cancer: Role of signalling pathways, stromal interactions and natural therapies. Admet Dmpk 2025, 13, 2836. [Google Scholar] [CrossRef] [PubMed]
- Lo, N.; Kim, H. Tilting the balance of life and death: navigating DNA replication stress in cancer therapy. Exp. Mol. Med. 2026, 58, 1721–1733. [Google Scholar] [CrossRef] [PubMed]
- Pandey, S.N.; Afzal, M.; Uikey, J.; Ganesan, S.; Mishra, S.; Bansal, P.; et al. ATM and p53 in aging and cancer: a double-edged sword in genomic integrity. Biogerontology 2025, 26, 102. [Google Scholar] [CrossRef] [PubMed]
- Abizadeh, E.; Berglas, E.; Abizadeh, A.; Glatman, J.; Lavi, A.B.; Spivak, M.; et al. Current and Emerging Therapies for Targeting the ERK1/2 & PI3K Pathways in Cancer. Int. J. Mol. Sci. 2025, 26. [Google Scholar] [CrossRef] [PubMed]
- Deschênes-Simard, X.; Malleshaiah, M.; Ferbeyre, G. Extracellular Signal-Regulated Kinases: One Pathway, Multiple Fates. Cancers 2023, 16. [Google Scholar]
- Wang, W.; Liu, X.; Liu, H.; Abolhassani, H.; Yan, H.; Zhang, H.; et al. p53, from understanding its structure to advances in therapeutic targeting. Signal Transduct. Target Ther. 2026, 11. [Google Scholar] [CrossRef] [PubMed]
- Xu, B.; Maimaitijiang, A.; Nuerbiyamu, D.; Su, Z.; Li, W. The Multifaceted Role of p53 in Cancer Molecular Biology: Insights for Precision Diagnosis and Therapeutic Breakthroughs. Biomolecules 2025, 15. [Google Scholar] [CrossRef] [PubMed]
- Klimovich, B.; Merle, N.; Neumann, M.; Elmshäuser, S.; Nist, A.; Mernberger, M.; et al. p53 partial loss-of-function mutations sensitize to chemotherapy. Oncogene 2022, 41, 1011–1023. [Google Scholar] [CrossRef] [PubMed]
- Rodriguez, L.; Leroy, B.; Toledo, F.; Funk, J.S.; Stiewe, T.; Baliakas, P.; et al. Low-penetrance TP53 variants are mainly hypomorphic: an underestimated issue with high clinical significance. npj Genom. Med. 2026, 11. [Google Scholar] [CrossRef] [PubMed]
- Vojsovič, M.; Kratochvilová, L.; Valková, N.; Šislerová, L.; El Rashed, Z.; Menichini, P.; et al. Transactivation by partial function P53 family mutants is increased by the presence of G-quadruplexes at a promoter site. Biochimie 2024, 216, 14–23. [Google Scholar] [CrossRef] [PubMed]
Figure 1.
ARMCX3 is upregulated in breast cancer and is associated with poor prognosis. (A) Comparison of ARMCX3 mRNA expression between normal breast tissues from the GTEx database and breast cancer tissues from the TCGA database. (B) Comparison of ARMCX3 protein expression between normal breast tissues and breast cancer tissues based on CPTAC proteomic data analyzed using the UALCAN platform. (C) Representative immunohistochemical staining images of ARMCX3 in normal breast tissues and breast cancer tissues obtained from the Human Protein Atlas (HPA) database. (D) Kaplan–Meier overall survival analysis of breast cancer patients stratified according to ARMCX3 expression. *P < 0.05; ****P < 0.0001.
Figure 1.
ARMCX3 is upregulated in breast cancer and is associated with poor prognosis. (A) Comparison of ARMCX3 mRNA expression between normal breast tissues from the GTEx database and breast cancer tissues from the TCGA database. (B) Comparison of ARMCX3 protein expression between normal breast tissues and breast cancer tissues based on CPTAC proteomic data analyzed using the UALCAN platform. (C) Representative immunohistochemical staining images of ARMCX3 in normal breast tissues and breast cancer tissues obtained from the Human Protein Atlas (HPA) database. (D) Kaplan–Meier overall survival analysis of breast cancer patients stratified according to ARMCX3 expression. *P < 0.05; ****P < 0.0001.

Figure 2.
Transcriptome profiling identifies ARMCX3 as a key regulator in breast cancer cells. (A) Western blot analysis confirming efficient knockdown of ARMCX3 protein expression in MCF-7 and MDA-MB-231 cells. (B-D) Volcano plots displaying differentially expressed genes (DEGs) in MCF-7 (B) and MDA-MB-231 (D) cells upon ARMCX3 knockdown. (C-E) Hierarchical clustering heatmaps showing the expression profiles of the top DEGs in MCF-7 (C) and MDA-MB-231 (E) cells. (F-G) Venn diagrams showing overlapping upregulated (F) and downregulated (G) DEGs between two cell lines. Data are presented as the mean ± SD. *P < 0.05; **P < 0.01; n.s. indicates no significant difference.
Figure 2.
Transcriptome profiling identifies ARMCX3 as a key regulator in breast cancer cells. (A) Western blot analysis confirming efficient knockdown of ARMCX3 protein expression in MCF-7 and MDA-MB-231 cells. (B-D) Volcano plots displaying differentially expressed genes (DEGs) in MCF-7 (B) and MDA-MB-231 (D) cells upon ARMCX3 knockdown. (C-E) Hierarchical clustering heatmaps showing the expression profiles of the top DEGs in MCF-7 (C) and MDA-MB-231 (E) cells. (F-G) Venn diagrams showing overlapping upregulated (F) and downregulated (G) DEGs between two cell lines. Data are presented as the mean ± SD. *P < 0.05; **P < 0.01; n.s. indicates no significant difference.

Figure 3.
GO/KEGG enrichment and validation of the p53 signaling pathway after ARMCX3 knockdown. (A-B) GO and KEGG enrichment analyses of upregulated genes in MCF-7 (A) and MDA-MB-231 (B) cells following ARMCX3 knockdown. (C-D) GSEA plots showing the enrichment of p53-related gene sets in MCF-7 (C) and MDA-MB-231 (D) cells upon ARMCX3 knockdown. (E) Western blot analysis showing the protein expression of p53 in shControl and shARMCX3 groups. Data are presented as mean ± SD. *P < 0.05.
Figure 3.
GO/KEGG enrichment and validation of the p53 signaling pathway after ARMCX3 knockdown. (A-B) GO and KEGG enrichment analyses of upregulated genes in MCF-7 (A) and MDA-MB-231 (B) cells following ARMCX3 knockdown. (C-D) GSEA plots showing the enrichment of p53-related gene sets in MCF-7 (C) and MDA-MB-231 (D) cells upon ARMCX3 knockdown. (E) Western blot analysis showing the protein expression of p53 in shControl and shARMCX3 groups. Data are presented as mean ± SD. *P < 0.05.

Figure 4.
PFT-α-mediated p53 inhibition rescues the tumor-suppressive phenotypes induced by ARMCX3 knockdown in breast cancer cells. (A) CCK-8 cell proliferation curves of shControl and shARMCX3 MCF-7 and MDA-MB-231 cells with or without PFT-α treatment at 0, 24, 48 and 72 h. (B-C) Representative Transwell staining images and quantitative statistics of migrated (B) and invaded (C) cells in four experimental groups (shControl, shControl + PFT-α, shARMCX3, shARMCX3 + PFT-α). Scale bar: 100 μm. (D) Western blot analysis of p53, E-cadherin, N-cadherin and Vimentin protein expression in shControl and shARMCX3 MCF-7 and MDA-MB-231 cells with or without PFT-α intervention. (E) Flow cytometric cell cycle distribution analysis and quantitative proportion statistics of G1, S and G2 phases in MCF-7 and MDA-MB-231 cells from four groups. (F) Western blot analysis of p53, p-p53, p21, CDK2 and Cyclin E1 protein expression in shControl and shARMCX3 MCF-7 and MDA-MB-231 cells with or without PFT-α intervention. Data are presented as mean ± SD. *P < 0.05, **P < 0.01, ***P < 0.001, ****P < 0.0001, ns, no significance.
Figure 4.
PFT-α-mediated p53 inhibition rescues the tumor-suppressive phenotypes induced by ARMCX3 knockdown in breast cancer cells. (A) CCK-8 cell proliferation curves of shControl and shARMCX3 MCF-7 and MDA-MB-231 cells with or without PFT-α treatment at 0, 24, 48 and 72 h. (B-C) Representative Transwell staining images and quantitative statistics of migrated (B) and invaded (C) cells in four experimental groups (shControl, shControl + PFT-α, shARMCX3, shARMCX3 + PFT-α). Scale bar: 100 μm. (D) Western blot analysis of p53, E-cadherin, N-cadherin and Vimentin protein expression in shControl and shARMCX3 MCF-7 and MDA-MB-231 cells with or without PFT-α intervention. (E) Flow cytometric cell cycle distribution analysis and quantitative proportion statistics of G1, S and G2 phases in MCF-7 and MDA-MB-231 cells from four groups. (F) Western blot analysis of p53, p-p53, p21, CDK2 and Cyclin E1 protein expression in shControl and shARMCX3 MCF-7 and MDA-MB-231 cells with or without PFT-α intervention. Data are presented as mean ± SD. *P < 0.05, **P < 0.01, ***P < 0.001, ****P < 0.0001, ns, no significance.

Figure 5.
ARMCX3 knockdown enhances cisplatin sensitivity by aggravating DNA damage and apoptosis, and this phenotype can be abrogated by PFT-α treatment. (A-B) Flow cytometric analysis of apoptosis in MCF-7 (A) and MDA-MB-231 (B) cells. (C-D) Comet assay results showing olive tail moment (OTM) in MCF-7 (C) and MDA-MB-231 (D) cells under different treatments. Scale bar: 50 μm. (E-F) Western blot analysis of p-γ-H2AX, p-ATM and p-DNA-PKcs in MCF-7 (E) and MDA-MB-231 (F) cells. Data are presented as mean ± SD. *P < 0.05, **P < 0.01, ***P < 0.001, ****P < 0.0001, ns, no significance.
Figure 5.
ARMCX3 knockdown enhances cisplatin sensitivity by aggravating DNA damage and apoptosis, and this phenotype can be abrogated by PFT-α treatment. (A-B) Flow cytometric analysis of apoptosis in MCF-7 (A) and MDA-MB-231 (B) cells. (C-D) Comet assay results showing olive tail moment (OTM) in MCF-7 (C) and MDA-MB-231 (D) cells under different treatments. Scale bar: 50 μm. (E-F) Western blot analysis of p-γ-H2AX, p-ATM and p-DNA-PKcs in MCF-7 (E) and MDA-MB-231 (F) cells. Data are presented as mean ± SD. *P < 0.05, **P < 0.01, ***P < 0.001, ****P < 0.0001, ns, no significance.

Figure 6.
ARMCX3 modulates p53 expression through regulating p-ERK signaling in breast cancer cells. (A) Protein-protein interaction (PPI) network showing TP53 as a core hub gene. (B) GO enrichment analysis indicating the ERK1/ERK2 cascade is significantly enriched. (C) Western blot analysis of ERK and p-ERK protein expression in shControl and shARMCX3 MCF-7 and MDA-MB-231 cells. (D) Western blot analysis of p-ERK and p53 protein expression in MCF-7 and MDA-MB-231 cells with or without trametinib intervention. (E) Representative images and quantification of Transwell migration assays in MCF-7 and MDA-MB-231 cells. (F) Representative images and quantification of Transwell invasion assays. (G) Western blot analysis of EMT-associated protein expression in MCF-7 and MDA-MB-231 cells under the indicated treatments. Data are presented as mean ± SD. *P < 0.05, **P < 0.01, ***P < 0.001, ****P < 0.0001, ns, no significance.
Figure 6.
ARMCX3 modulates p53 expression through regulating p-ERK signaling in breast cancer cells. (A) Protein-protein interaction (PPI) network showing TP53 as a core hub gene. (B) GO enrichment analysis indicating the ERK1/ERK2 cascade is significantly enriched. (C) Western blot analysis of ERK and p-ERK protein expression in shControl and shARMCX3 MCF-7 and MDA-MB-231 cells. (D) Western blot analysis of p-ERK and p53 protein expression in MCF-7 and MDA-MB-231 cells with or without trametinib intervention. (E) Representative images and quantification of Transwell migration assays in MCF-7 and MDA-MB-231 cells. (F) Representative images and quantification of Transwell invasion assays. (G) Western blot analysis of EMT-associated protein expression in MCF-7 and MDA-MB-231 cells under the indicated treatments. Data are presented as mean ± SD. *P < 0.05, **P < 0.01, ***P < 0.001, ****P < 0.0001, ns, no significance.

Figure 7.
ARMCX3 inhibits breast cancer xenograft growth via activating p53 signaling. (A, D) Representative images of xenograft tumors formed by MCF-7 (A) and MDA-MB-231 (D) cells in nude mice under different treatments. (B, E) Tumor weights of MCF-7 (B) and MDA-MB-231 (E) xenografts in each group. (C, F) Tumor volume growth curves of MCF-7 (C) and MDA-MB-231 (F) xenografts over time. (G, H) Representative images of HE staining, Ki67 and Cleaved-Caspase-3 immunohistochemical staining in MCF-7 (G) and MDA-MB-231 (H) xenograft tissues, with corresponding quantitative analysis. Scale bar: 50 μm. Data are presented as mean ± SD. *P < 0.05, **P < 0.01, ***P < 0.001, ****P < 0.0001, ns, no significance.
Figure 7.
ARMCX3 inhibits breast cancer xenograft growth via activating p53 signaling. (A, D) Representative images of xenograft tumors formed by MCF-7 (A) and MDA-MB-231 (D) cells in nude mice under different treatments. (B, E) Tumor weights of MCF-7 (B) and MDA-MB-231 (E) xenografts in each group. (C, F) Tumor volume growth curves of MCF-7 (C) and MDA-MB-231 (F) xenografts over time. (G, H) Representative images of HE staining, Ki67 and Cleaved-Caspase-3 immunohistochemical staining in MCF-7 (G) and MDA-MB-231 (H) xenograft tissues, with corresponding quantitative analysis. Scale bar: 50 μm. Data are presented as mean ± SD. *P < 0.05, **P < 0.01, ***P < 0.001, ****P < 0.0001, ns, no significance.

Disclaimer/Publisher’s Note: The statements, opinions and data contained in all publications are solely those of the individual author(s) and contributor(s) and not of MDPI and/or the editor(s). MDPI and/or the editor(s) disclaim responsibility for any injury to people or property resulting from any ideas, methods, instructions or products referred to in the content. |
© 2026 by the authors. Licensee MDPI, Basel, Switzerland. This article is an open access article distributed under the terms and conditions of the Creative Commons Attribution (CC BY) license (http://creativecommons.org/licenses/by/4.0/).
Copyright: This open access article is published under a Creative Commons CC BY 4.0 license, which permit the free download, distribution, and reuse, provided that the author and preprint are cited in any reuse.