
Preprint
Article

This version is not peer-reviewed.

Sustainable Management of Soil Carbon in a Sub-Tropical Vertisol Rice-Wheat System: A 25-Year Analysis of Fertilizer Impacts on Sequestration, Crop Productivity, and the Soil C 4 per Mille Initiative

Submitted:

17 July 2026

Posted:

17 July 2026

You are already at the latest version

Abstract
The rice-wheat cropping system under Vertisol in sub-tropical regions of India faces significant challenges in maintaining soil health and achieving sustainable yields. This is primarily due to climatic variability and intensive agricultural practices, which accelerate the loss of soil organic carbon (SOC) and lead to soil degradation. There is a pressing need to adopt sustainable nutrient management, that not only maximize crop yields but also support climate change mitigation through carbon (C) sequestration and soil health management. In this context, a long-term fertilizer management (25 years) study was undertaken to assess crop productivity, C fractions, sequestration potential to achieve soil C 4 per mille under rice-wheat cropping system in sub-tropical Vertisol. The experiment was based on ten different fertilizer treatments either alone or in combination with organics. Grain yield, system productivity, and the sustainable yield index (SYI) were significantly higher under the 150%NPK and NPK + Farmyard manure (FYM) treatments compared to the unfertilized control. Relying on imbalanced fertilization (N) is inadequate for long-term sustainability. Long-term application of 100% NPK+FYM increased SOC content by up to 16%, whereas it decreased by 34% under absolute control relative to the initial value. Integrated nutrient management (INM) significantly enhanced the SOC pools, with higher proportion (57%) of total SOC in passive C pools. The increase in SOC stock was significantly correlated (R2 = 0.76) with system productivity, requiring a minimum C input of 2.7 Mg C ha-1 yr-1 to maintain C equilibrium. The INM treatment achieved the highest C sequestration (2.27 Mg ha-1), potential (7.04 Mg ha-1) and rate (0.10 Mg C ha-1 yr-1) compared to NPK. In the present study, the C sequestration rate under NPK+FYM and 150%NPK surpassed the annual increment requirement of 0.4% SOC to achieve the target of the “4 per mille”. Over 25 years, application of 5 Mg ha-1 FYM with NPK proved to be the most sustainable practice for SOC management. In addition to enhancing SOC stock, this practice maximizes crop productivity, thereby highlighting the potential of soil management as an effective voluntary carbon sequestration pathway for climate-change mitigation strategy in sub-tropical regions.
Keywords: 
;  ;  ;  ;  

1. Introduction

Long-term fertilizer experiments (LTFEs) are crucial for evaluating how different nutrient management strategies affect soil health, crop productivity and environmental sustainability over time [1]. Maintaining the high productivity of the intensive rice-wheat system is challenged by imbalanced application of mineral fertilizers and limited use of organic manures due to declining availability [2]. The declining trends in crop productivity may also be linked to the loss of soil organic carbon (SOC) caused by long-term use of unrecommended nutrient management practices [3].
SOC is an important component that helps to maintain long-term sustainability and overall productivity of rice-wheat cropping system (RWCS) [4]. Research indicates that the indiscriminate use of chemical fertilizers negatively impacts SOC [5], whereas the adoption of Integrated Nutrient Management (INM) practices can improve it [6,7]. An improvement in SOC not only enhances crop production but is also considered a potential solution to mitigate climate change through soil carbon sequestration. The application of balanced nutrients enhances primary productivity (both economic yield and stalk biomass) by increasing CO2 assimilation in the crop, which creates a synergistic effect [5]. Many studies have indicated that a strong positive relationship exists between the amount of C incorporated into the soil and the total SOC content [8,9]. According to Bendi and Brar [10], the 25-year mean system productivity of rice–wheat was 7.2 Mg ha-1 yr-1 contributing to C input of 3.29 Mg C ha-1, of which rice contributed 1.93 Mg C ha-1 and wheat accounted for 1.37 Mg C ha-1. They further reported that one Mg increase in rice-wheat system productivity improved SOC by 0.38 g kg-1 soil. SOC can be separated into different fractions based on composition, which in turn influences its long-term stability and governs key processes such as soil quality, nutrient cycling, and C sequestration potential. The proportions and transformations of SOC fractions depend not only on the source of C inputs but also on nutrient management practices, which support sustainable crop productivity and soil resilience [1,11]. Soil can act as a sink or source of C depending on the dynamics of organic C storage and losses from agricultural soils, thereby affecting global climate change and crop productivity [4,13]. In India, agriculture accounts for nearly 14% of the country’s total greenhouse gas (GHG) emissions, with rice fields contributing about 17% [14]. Enhancement of SOC stock can help to reduce GHG emissions.
The soil C stock and sequestration can be enhanced by conservation tillage [15], diverse cropping systems [16], integrated nutrient management [17], along with the application of organic manures, improved grazing practices, and sustainable forest management [4]. Balanced and integrated nutrient management significantly contributes to SOC sequestration in sub-tropical regions [18,19]. Long-term experiments (25-40 years) demonstrated that the application of balanced fertilizers with 5-10 Mg ha−1 of organic manures can enhance the SOC by 10-20% of the initial SOC [20], by achieving a C sequestration rate of 0.13 to 0.27 Mg C ha−1 yr−1 in various rice-based cropping systems [18,21]. However, sequestering SOC remains a significant challenge in sub-tropical regions, mainly due to adverse climatic conditions and the inability of resource-limited farmers to consistently apply organic inputs and balanced fertilizers [12]. The high temperature in the tropics accelerates C mineralization while poor humification efficiency hinders the SOC sequestration [22].
Since soil serves as a potential C sink, containing up to three times more C than atmospheric pools, even a relatively small increase in soil C stocks could significantly contribute to mitigate GHG emissions. As per COP21 of the Paris Agreement of “4 per mille” initiative, the goal is to increase global SOC stocks by 4 per mille (approximately 2.5 Gt C yr−1) to offset anthropogenic GHG emissions [23,24]. Minasny et al. [25] reported that increasing C sequestration rate up to 0.4% of existing SOC stocks could potentially offset about 30% of global GHG emissions. This requires the implementation of long-term best management practices, including fertilizer management and low C emissions technologies that support the enhancement of SOC in agricultural soils [12,26]. Minasny et al. [25] reported that under best management practices, the 4 per mille C sequestration rate (or even higher up to 10 per mille) can be achieved for soil with an initially deficient SOC stock (topsoil less than 30 Mg C ha-1). However, achieving a 0.4% annual increase in SOC sequestration under farmers’ field conditions is a mountainous task due to regional climate conditions, removal of crop residues, intensive tillage and wide variability in nutrient management practices.
Several investigations have focused on determining the impacts of fertilization on crop yield, SOC stock and sequestration in diverse cropping systems globally and in India [1,3,6,7,10,27,28,29,30,31,32,33]. However, information is scarce about the impact of INM practices on sustainability, yield trends, magnitude of SOC changes, its allocation in different pools, the potential and rate of C sequestration on fulfilling the Soil C “4 per mille” criteria of the Paris Declaration, and critical C input needed to offset the SOC losses under predominant rice-wheat cropping systems in Vertisol. Therefore, we hypothesized that long-term INM practices can not only enhance crop productivity and SOC pools, but also achieve the aspirational target of “Soil C 4 per mille” in sub-tropical regions. Therefore, the present study was undertaken from a 25-year-old long-term fertilizer experiment with objectives (i) to evaluate the productivity and sustainability of RWCS (ii) to assess the C assimilation and storage, SOC fractions, stock, C sequestration and (iii) to work out critical C input required to maintain soil C equilibrium and to achieve “4 per mille” in a Vertisol of sub-tropical climate of India.

2. Materials and Methods

2.1. Experimental Site Descriptions

The present study was conducted as a part of the All India Coordinated Research Project (AICRP) on Long-Term Fertilizer Experiments (LTFE), initiated in 1999 at the Instructional cum Research Farm of Indira Gandhi Agricultural University, Raipur, Chhattisgarh, India, situated at 21°40’-N; 81°39’-E at an altitude of 234 m above mean sea level (MSL). The study area falls under the eastern plateau of agro-climatic zone and is characterized by sub-tropical climate, with an average annual precipitation of 1190 mm, out of which maximum (88%) is received during the rainy season (mid of June to September), while 12% during winter (December to February). The maximum temperature in summer ranges from 35 to 47°C, whereas the minimum temperature ranges from 12 to 25°C during winter. Other climatic characteristics during the study period are presented in Table 1. The experimental soil is fine montmorillonitic, hyperthermic, chromustert and comes under Vertisol soil order. These soils are deep, clayey, neutral to alkaline in reaction and calcareous in nature. The length of growing period (LGP) in the region is 150-180 days [34]. The initial soil properties of the experimental site are summarized in Table 2.

2.2. Experimental Design

The experiment comprised two crops annually, rice (July-November) and wheat (December-April), and included ten nutrient management treatments arranged in a randomized block design with four replications. Each treatment plot measured 200 m2 (20 m x 10 m). Fertilizer urea, single super phosphate (SSP), and muriate of potash (MOP) were used as sources of N, P, and K, respectively. Details of treatments applied during the experimental period are provided in Table 3. To minimize border effects, a net plot area of 5 m x 5 m was harvesting for the determination of grain and straw yields.

2.3. Crop Management

The field was first divided into replicated plots, followed by unform puddling to a depth of 10 cm. The rice cultivar ‘Rajeshwari’ and wheat cultivars ‘CG Amber Wheat’ were grown. Both crops were raised as per the standard agronomic package of practices given by Reddy and Reddy [35]. Farm yard manure (FYM) was applied at a rate of 5 Mg ha-1 to the respective treatment plots before puddling. The green manure (GM) crop Sunhemp (Crotalaria juncea L.) was sown in-situ two months before rice transplanting and incorporated into the soil in the respective treatment plots. Blue green algae (BGA) @ 10 kg ha-1 (dry culture) was only applied annually after one week of rice transplanting in the respective treatment plots. At harvest, the grain and straw yield data were recorded. To calculate the amount of C added to soil through green manure (GM), a 2 m x 2 m area was harvested in triplicate. The fresh weight was recorded, and a sub-sample was used to determine moisture and carbon content. Similarly, each year, a sub-sample from FYM was also drawn to determine the C content.

2.4. Soil Sampling and C Analysis

The initial soil samples from topsoil (0-20 cm) were collected in 1999 prior to the start of the experiment. The present study reported the analysis of soil samples collected from 0-20 cm depth after harvest of the 25th cropping cycle using a post-hole auger at five different points of each replicated plot. The samples from each plot were thoroughly mixed, homogenized and composited, followed by air-drying in shade, processed, and sieved to pass through a 2 mm sieve. Samples were analyzed for Walkley Black’s wet oxidation method (WBOC) [36]. The soil carbon fractions were determined as suggested by Chan et al. [37]. This method allows the separation of TOC in four different SOC fraction in the decreasing order of C oxidation. The C oxidized under 6 N H2SO4 was considered as very labile C fraction (VLC); the difference between organic C oxidized under 12 N and 6 N H2SO4 was considered as labile C fraction (LC); the difference between organic C oxidized under 18 N and 12 N H2SO4 was considered as less labile C fraction (LLC); and the difference between organic C oxidized under 24 N and 18 N H2SO4 was considered as recalcitrant C fraction (RC). The sum of VLC and LC considered as active C pool (AC) and the sum of LLC and RC considered as the passive C pool (PC) in soil. A soil core sampler (core diameter 7.5 cm and length 7.5 cm) was used to collect the sample for estimating soil bulk density (BD) [38]. The sum of very labile C (VLC) and labile C (LC) is considered active C pool (AC) and the sum of less labile C (LLC) and recalcitrant C (RC) is considered the passive C pool (PC) in soil. The total organic carbon (TOC) was analysed by using Thermo ScientificTM FLASHMART CHNS/O elemental analyser equipped with a flame photometric detector (FPD). Prior to analysis, soil samples were treated with 1 N HCl (1:1 soil: acid ratio) to remove the inorganic carbonates following the method described by Jha et al. [39] The acid treated samples were then oven-dried at 65°C, finely ground, and analysed for TOC content. The plant C was also estimated by Thermo ScientificTM FLASHMART CHNS/O elemental analyser.

2.4.1. SOC Stock

The SOC stock (SOC stock, Mg C ha-1) was calculated as follows:
SOC stock = SOC × BD × D × 10-1
where, the SOC is soil organic carbon content (g kg-1), BD is the soil bulk density (Mg m-3), D represents soil depth (cm) and 10-1 is a factor to adjust the units.

2.4.2. Carbon Sequestration (Cseq)

Carbon sequestration (Cseq in Mg ha-1) was calculated as the change in SOC stock from the inception of the experiment to the most recent year.
Cseq = SOC stockc - SOC stocki
where, the SOC stockc represents the SOC stock in the current year (2023) and SOC stocki the SOC stock in the initial year (1999) of the experiment.

2.4.3. Carbon Sequestration Rate (CSR)

The carbon sequestration rate (CSR, Mg C ha-1 yr-1) was calculated as follows:
CSR =Cseq/t
where, t represents the duration of the field experiment (year).

2.4.4. Soil C 4 per Mille

As per COP21 of Paris Agreement, the Soil C 4 per mille (Mg C ha-1 yr-1) was calculated as follows (Minasny et al., 2017)
Soil C 4 per mille = SOC stockc x 0.004
where, the SOC stockc is the SOC stock of the current year (Mg ha-1)

2.4.5. Total C Assimilation in Rice -Wheat and Total C Addition to Soil

The total biomass yield of rice and wheat, including grain, straw, stubble and roots was used to represent total carbon assimilation by crops. The grain and straw yields were recorded at harvest. Stubble biomass yield was estimated as 20% of the above-ground biomass, while the root biomass yield was estimated as 10% of total biomass [40]. The total annual C assimilated by rice and wheat was estimated as the sum of carbon content in all these biomass components.
The annual C input to soil was measured from the C content of residual biomass (root + stubble + rhizodeposition) and applied organic sources (FYM and GM). The contribution of C input through rhizodeposition was considered as 30% of total root C input [41]. During rice and wheat growth period, weeds were removed; therefore, C input from root and rhizodeposition by the weeds was not accounted for. The C content of FYM and green manure (GM) was 24.76% and 41.28%, respectively, on an oven-dry weight basis.

2.4.6. Critical Carbon Input to Maintain SOC

Rate constant of the C incorporation into SOM through annual C inputs (h) in the soil and decay rate constant (k) of native SOC were calculated from the following equation [42] assuming a single pool first order kinetic relationship between C-addition and change in storage of carbon in a given soil as follows:
δ C s Δ t = h A k C s
where, Cs is the SOC, t is the time and A is the annual C input to the soil. For computing A value, we assumed that entire amount of biomass C through stubbles and 80% of biomass C contributed by roots and rhizodeposition remained in 0-20 cm soil depth as some C could leach [43,44].

2.5. Plant Parameters

2.5.1. Sustainable Yield Index

The Sustainable yield index (SYI) is a quantitative measure to assess the sustainability of agricultural practices [45]. The SYI was calculated using following equation [46].
Sustainable   yield   index   ( SYI ) = Ym σ Ymax
where, Ym represents the mean yield (Mg ha-1) of a treatment, σ represents the standard deviation and Ymax is the maximum yield (Mg ha-1) in the experiment over the year obtained under any treatment.

2.5.2. Yield Trends

A simple linear regression analysis of grain yields (slopes and the p values) was carried out with their respective years to evaluate the yield trends (kg ha-1 yr-1)
Y = a + b t
where, Y is grain yield (Mg ha-1), a is constant, t is time (year) and b represents the slope or magnitude of the yield trend.

2.5.3. System Productivity (SP)

The SP was calculated as rice equivalent yield using the following formula:
SP (Mg ha-1) = [(Wheat yield (Mg ha-1) x Price of wheat)/Price of rice] + Rice yield (Mg ha-1)

2.6. Statistical Analysis

Analysis of variance (ANOVA) [47] was performed followed by Tukey’s HSD test at p=0.05 level of significance to determine the differences among treatments to quantify and evaluate the sources of variance for different parameters using R [48]. A simple linear regression analysis of yield of rice and wheat and SOC (slopes and the p values) over the years was conducted to evaluate the trends over the years. Furthermore, the Pearson’s correlation matrix and linear regression analysis were carried out between C fractions, sequestration with crop productivity using R [48].

3. Results

3.1. Grain Yield, System Productivity, Sustainable Yield Index (Syi), and Yield Trends

Results from the long-term fertilizer experiment after 25 crop cycles of rice and wheat indicated that the mean grain yield of rice increased from the initial year across the treatments, with a marginal increase in the control plot (Table 4). Similar findings were also reported for wheat, except in case of N treatment, which reduced the mean grain yield of wheat from the initial year. It was observed that the long-term application of super-optimal dose of fertilizer (150%NPK) and integrated nutrients management (INM viz; NPK+FYM) significantly increased the grain yield of both the crops over unfertilized control, 50%NPK and under balanced fertilization (NPK) (Table 4; Figure 1 and Figure 2). The 150%NPK recorded significantly higher grain yields of 5.80 and 3.03 Mg ha-1 in rice and wheat, respectively, which were closely followed by the respective yields under NPK+FYM (5.70 and 2.93 Mg ha-1 for rice and wheat, respectively) and proved equally beneficial in achieving higher yields. Furthermore, system productivity increased by 238% and 233% under 150%NPK and NPK+FYM treatments, respectively, compared with the unfertilized control. Results also highlight that no crop response was observed to the application of K, Zn and BGA as indicated by equivalent yield levels under NPK and NP, NPK and NPK+Zn and 50%NPK and 50%NPK+BGA treatments, respectively. The 50%NPK+GM (green manure) registered significantly higher yield than 50%NPK alone (Table 4). Furthermore, without fertilizer application, rice and wheat yield could be sustained an average of 2.28 and 1.08 Mg ha-1, respectively. Long-term application of 150%NPK increased grain yield by 154% and 181% followed by NPK+FYM; 150% and 171% and by NPK; 132% and 142% in rice and wheat, respectively, compared to control treatment.
The highest mean SYI (0.71 and 0.60, respectively, for rice and wheat) was recorded under 150%NPK followed by NPK+FYM (0.70 and 0.58 in rice and wheat, respectively) (Table 4). The significantly lowest SYI (0.28 and 0.20 for rice and wheat, respectively) was registered under no fertilization. Imbalanced fertilization (N) cannot be relied upon to sustain a yield in the long run. The SYI was significantly higher under 50%NPK+GM (0.58 for rice and 0.40 for wheat) than that of 50%NPK (0.51 for rice and 0.35 for wheat). The similar SYI values under 50%NPK and 50%NPK+ BGA indicated that the application of BGA did not affect yield sustainability.
The yield trends (Table 4, Figure 1 and Figure 2) declined most under 100%N with values being -12.50 and -18.30 kg ha-1 yr-1 followed by -12.40 and -15.30 kg ha-1 yr-1 under unfertilized control in rice and wheat, respectively. Positive yield trends were recorded for all other treatments. The higher positive yield trends were observed with 150%NPK, with values of 49.40 and 49.22 kg ha-1 yr-1, for rice and wheat, respectively, followed by NPK+FYM (48.70 and 46.30 kg ha-1 yr-1) and NPK (40.80 and 36.89 kg ha-1 yr-1) for rice and wheat, respectively.

3.2. Biomass Yield, C Assimilation and C Input to Soil

The biomass yield (straw, stubble and root) of rice and wheat varied considerably across treatments. For rice, straw yield ranged from 2.47 to 6.28 Mg ha-1, stubble from 0.95 to 2.42 Mg ha-1 and root from 0.57 to 1.45 Mg ha-1 (Table 5). In wheat, straw yield varied between 1.75 and 4.93 Mg ha-1, stubble between 0.57 and 1.59 Mg ha-1, and root between 0.34 and 0.96 Mg ha-1 (Table 6). The biomass yield followed the sequence of root < stubble < straw for both rice and wheat.
Among different fertilizer regimes, significantly highest biomass yield was recorded under 150%NPK followed by NPK+FYM and NPK for both the crops. The unfertilized control plot recorded the lowest biomass yield of rice and wheat.
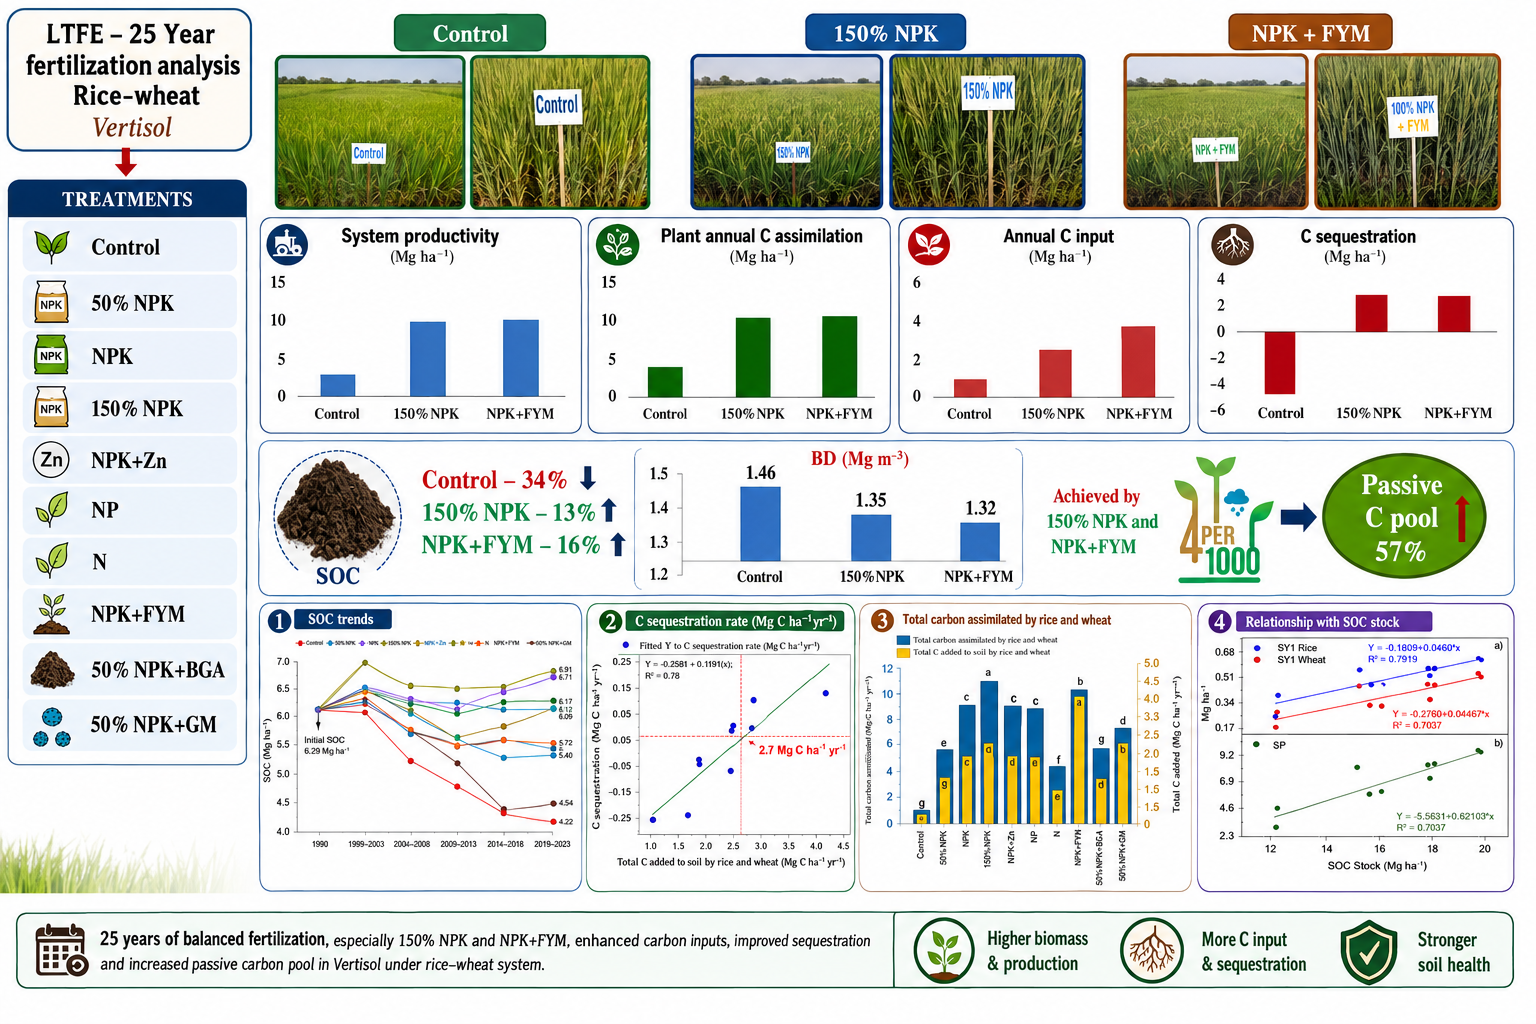
C assimilation follows similar trends to the biomass yield of both crops. The highest biomass C assimilated by rice and wheat straw (2.51 and 1.97 Mg ha-1, respectively) followed by grain (2.32 and 1.21 Mg ha-1, respectively) > stubble (0.96 and 0.64 Mg ha-1, respectively) > root (0.58 and 0.38 Mg ha-1, respectively) and lowest by rhizodeposition (0.17 and 0.11 Mg ha-1, respectively) under 150%NPK followed by NPK+FYM and NPK (Table 5 and Table 6). The total annual C assimilation ranged from 2.51 to 6.37 Mg ha-1 in rice and 1.49 to 4.20 Mg ha-1 in wheat, with the highest values under 150%NPK (6.37 and 4.20 Mg ha-1, respectively). This was followed by NPK+FYM (6.27 and 4.05 Mg ha-1) and by NPK (5.79 and 3.63 Mg ha-1) for rice and wheat, respectively. The lowest C assimilation was recorded under unfertilized control, with values of 2.51 in rice and 1.49 Mg ha-1 in wheat. For the combined rice-wheat system, the highest total annual C assimilation occurred under 150%NPK (10.58 Mg ha-1), followed by NPK+FYM (10.33 Mg ha-1), and NPK (9.34 Mg ha-1), while the lowest was observed under unfertilized control (4.00 Mg ha-1) (Figure 3).
The maximum total annual C input from rice through left over stubble at harvest, root in the plough layer, rhizodeposition, FYM and GM was recorded under NPK+FYM (2.93 Mg ha-1), followed by 50%NPK+GM (2.03 Mg ha-1) and 150%NPK (1.72 Mg ha-1), while unfertilized control recorded only 0.68 Mg ha-1 (Table 5). However, for wheat, maximum total annual C input was under 150%NPK (1.13 Mg ha-1), followed by NPK+FYM (1.09 Mg ha-1), NPK (0.98 Mg ha-1) and 50%NPK+GM (0.80 Mg ha-1); the control plot recorded 0.40 Mg ha-1 (Table 6). Across the rice-wheat system, the highest annual C input was under NPK+FYM (4.02 Mg ha-1), which was significantly higher than that under 150%NPK (2.85 Mg ha-1), followed by 50%NPK+GM (2.83 Mg ha-1), and NPK (2.54 Mg ha-1) (Figure 3).

3.3. Soil Carbon Fractions and Total Organic Carbon

The soil C fractions varied significantly under long-term nutrient management (Table 7). The very labile carbon (VLC) ranged from 0.88 g kg-1 to 2.00 g kg-1 and the labile carbon (LC) fractions from 2.06 g kg-1 to 3.00 g kg-1, with the highest value under INM treatment. Balanced fertilizer application significantly enhanced both VLC (1.57 g kg-1) and LC (2.71 g kg-1) compared to unfertilized control. The INM and 150%NPK treatments resulted in a marked increase in VLC and LC relative to NPK alone. The less-labile carbon (LLC) and recalcitrant carbon (RC) fractions also varied significantly, ranging from 0.62 to 1.67 g kg-1 and 2.96 to 4.89 g kg-1, respectively, across all treatments (Table 7). Furthermore, LLC and RC fractions recorded maximum under NPK+FYM (1.67 and 4.89 g kg-1 soil, respectively), which were comparable to 150%NPK. The incorporation of GM with 50% NPK significantly enhanced all C fractions compared to 50%NPK and 50%NPK+BGA treatments.
Across all treatments, the soil exhibited greater proportion of passive C (PC) pool (LLC+RC) than active C (AC) pool (VLC+ LC), with PC pool contributed 57% and AC 43% of the total SOC (Figure 4). The PC pool increased by 84% under NPK+FYM followed by 150%NPK (83%) and NPK (68.5%), compared to control. Similarly, the AC pool increased in order of NPK+FYM (70%) followed by 150%NPK (68%) and NPK (45.2%) over control. The change in C fractions was not uniform across nutrient management, with the most significant change recorded for VLC and RC compared to unfertilized plot, followed by the remaining two pools.
The total organic carbon (TOC) varied significantly, ranging from 6.49 to 11.62 g kg-1 as influenced by long-term nutrient management (Table 7). The maximum TOC was recorded under NPK+FYM (11.62 g kg-1), followed by 150%NPK (11.60 g kg-1), 50%NPK+GM (10.35 g kg-1) and NPK (10.30 g kg-1). The minimum TOC was observed in control (6.49 g kg-1), followed by 100%N (6.72 g kg-1). Both NPK+FYM and 150%NPK showed significantly higher TOC than NPK (10.30 g kg-1), which was significantly higher than unfertilized control and 50%NPK. The TOC under 50%NPK+GM was statistically comparable to NPK.

3.4. Soil Bulk Density, SOC Content and Stock

Long-term application of NPK+FYM after 25 cropping cycles of rice-wheat significantly decreased soil bulk density (BD) from an initial value of 1.35 to 1.32 Mg m-3, whereas no significant changes was observed under the 150%NPK and 50%NPK+GM treatments (Table 8). In contrast, BD increased relative to its initial value in all other treatments, with the highest BD recorded in the control plot (1.46 Mg m-3). The 150% NPK, NPK, and NPK+Zn treatments exhibited significantly lower BD than the control. A similar reduction in BD was observed under the 50% NPK+GM treatment. However, BD values under the N, NP, and 50% NPK treatments did not differ significantly from those recorded in the control plot.
The SOC content (Table 8) in 0-20 cm soil layer increased under NPK+FYM (7.20 g kg-1), followed by 150%NPK (7.00 g kg-1), NPK (6.36 g kg-1), 50%NPK+GM (6.35 g kg-1), and NPK+Zn (6.26 g kg-1) from initial SOC (6.20 g kg-1). For the remaining treatments, the SOC decreased remarkably from the initial status (Figure 5). The magnitude of such reduction was severe under unfertilized control (4.10 g kg-1) and N-only treatment (4.27 g kg-1). The external addition of 5 t ha-1 FYM with NPK recorded significantly highest SOC stock (19.01 Mg ha-1), followed by 150%NPK (18.89 Mg ha-1), NPK (17.30 Mg ha-1) and 50%NPK+GM (17.14 Mg ha-1) over control (11.97 Mg ha-1). The NPK+FYM, 150%NPK, NPK and 50%NPK+GM increased the SOC stock by 59%, 58%, 45%, and 43% over the control, respectively.

3.5. C Sequestration, C Sequestration Rate, and Climate Change (Paris Declaration)

The C sequestration (Cseq) and C sequestration rate (CSR) in 0-20 cm soil layer after 25 years of long-term fertilizer application was maximum under NPK+FYM (2.27 Mg ha-1 and 0.10 Mg C ha-1 yr-1, respectively) followed by 150%NPK (2.15 Mg ha-1 and 0.09 Mg C ha-1 yr-1, respectively) NPK (0.56 Mg ha-1 and 0.02 Mg C ha-1 yr-1, respectively) and 50%NPK+GM (0.40 Mg ha-1 and 0.02 Mg C ha-1 yr-1, respectively) respectively (Table 8). The minimum positive Cseq (0.30 Mg ha-1) and CSR (0.01 Mg C ha-1 yr-1) were observed under NPK+Zn treatment. For the rest of the treatments, both Cseq and CSR recorded negative values, indicating a net loss of SOC relative to their initial SOC stock (16.74 Mg ha-1). The maximum reduction in SOC stock was observed by unfertilized control (- 4.77 Mg ha-1; 29%), followed by N-only treatment (-4.71 Mg ha-1; 28%). The C build-up rate (CSR: 0.10 Mg C ha-1 yr-1) was maximum under NPK+FYM treatment.
The Paris Climate Agreement proposed for C sequestration of “4 per mille” during COP21 in 2015 as an aspirational goal to offset annual global GHG emissions and to keep the global temperature increase below 2ᵒC, thereby helping to mitigate climate change. In our study, the CSR values of 0.10 and 0.09 Mg C ha-1 yr-1 under NPK+FYM and 150%NPK, respectively, were higher than their corresponding values (0.08 Mg C ha-1 yr-1) according to Soil C “4 per mille” (Table 8). However, despite the positive CSR values under NPK, NPK+Zn, and 50%NPK+GM, these treatments failed to meet the Paris Declaration on Soil C “4 per mille” criteria to combat climate change.

4. Discussion

4.1. Grain Yield, System Productivity, and SYI

Rice-wheat productivity was highest after 25 years of long-term application of 150%NPK and NPK+FYM compared with other treatments. Balanced fertilization (NPK) ensures a consistent and adequate supply of readily available plant nutrients to crops. In our study, the long-term incorporation of 5 t ha-1 FYM added an extra 1.24 Mg C ha-1, which enhances total C input, SOC level, soil microbial biomass and enzymatic activity, thereby improving nutrient mineralization and its availability [32,49]. The synergetic effects of NPK with FYM enhanced nutrient retention, uptake and cycling, collectively contributing to higher yields and system productivity [33]. In the current rice-wheat system, FYM was applied before rice cultivation, having a greater direct impact on rice yield than on the following wheat crop. Therefore, the average rice productivity under long-term INM practice in the present LTFE is 1.98 times higher than the National average of 2.88 Mg ha-1. However, low temperatures during the wheat season compared to the rice season slow down manure decomposition, which impacts nutrient mineralization rates and consequently contributes to lower wheat productivity (Table 1). Despite this, the average wheat productivity recorded in long-term INM practice remained significantly higher than the regional average of 1.6 Mg ha-1. The findings demonstrate that INM practices help maximize crop yields, and the adoption of INM should be promoted among state farmers to enhance the regional yield average.
Application of 50% more NPK than the recommended dose resulted in significantly higher crop productivity. This highlights the necessity of reassessment of the existing fertilizer recommendations for rice and wheat. The consistently higher crop productivity under 150%NPK is attributed to enhanced supply of essential macronutrients to meet the optimum nutrient demands of the intensive rice-wheat cropping system. The adequate supply of essential nutrients (150%NPK) increased the photosynthetic rate, improved crop biomass and carbon accumulation, leading to higher yield potential. Similar findings were also reported by Dheri et al. [7]; Majhi et al. [49]; Dhawan et al. [50].
The sustainability of any management can be evaluated by examining how treatments affect SYI. The SYI of the rice-wheat cropping system was highest under 150%NPK, followed by NPK+FYM, indicating that crops under these treatments can better withstand abiotic and biotic stresses compared to other treatments. In the long run, crop sustainability cannot be maintained using imbalanced fertilization [32]. Irrespective of treatments, the higher SYI value for rice than for wheat over the years indicates that rice was more resilient to temporal changes, thus more sustainable than wheat [51].

4.2. Biomass C Assimilation and C Input to Soil

Field crops assimilated C from the atmosphere through photosynthesis and a part of that is transferred to soil through residual biomass (stubble + root + rhizodeposition). The integration of N with P and increasing the nutrient application dose from 100%NPK to 150%NPK resulted in increased biomass yield, leading to higher total annual C assimilation by crops [44,52]. The C assimilation became more prominent under NPK+FYM, which might be due to improved synchronized nutrient supply and demand of crops required for higher primary productivity [29,53]. The average total annual C assimilation by rice was 63% higher than that of wheat, which could be attributed to higher biomass yield recorded in rice.
The maximum C assimilation under NPK+FYM resulted maximum C input to the soil. The exogenous application of C through 5 Mg ha-1 FYM in NPK+FYM (1.24 Mg C ha-1 yr-1) and GM in 50%NPK+GM (0.61 Mg C ha-1 yr-1) adds additional C to soil compared to plant-derived C added under sole application of chemical fertilization. Rice contributed 65% of the total soil C input, compared to 35% from wheat, due to rice’s higher biomass productivity. Sub-tropical climatic conditions in the current study further accelerate the C turnover. Consequently, the large portion of C added to the soil was lost to the atmosphere through biological respiration and only a small fraction was retained by the soil. Stubble C contributed the most to annual soil C input, followed by root C, in both rice and wheat. The average total annual C assimilated by rice contributed 31% of total annual C input to soil, and that from wheat was 27%. The present findings are consistent with those of Bendi and Brar (2009), who estimated that annual C input through root biomass, stubble and rhizodeposition during 1981 to 2005 from rice (1.93 Mg ha-1) was higher than wheat (1.37 Mg ha-1) in an intensive rice-wheat cropping system.

4.3. Carbon Fraction and Total Organic Carbon

Carbon fractions are critical indicators of SOC dynamics, C sequestration potential and nutrient cycling in agricultural systems. The NPK+FYM treatment increased the VLC and LC by 127% and 45%, respectively, compared to control, and by 27% and 11%, respectively, compared to NPK. The high microbial biomass and presence of easily decomposable plant residue under NPK+FYM treatment stimulate microbial activity that increases SOC with a larger fraction of VLC and LC [7]. Rathod et al. [9] also reported that continuous use of FYM with NPK enhances microbial and root biomass, which are the primary contributors to the VLC fraction. Furthermore, Brar et al. [54] and Ghosh et al. [55] reported that inorganic N had a priming effect on decomposition of the freshly added organic material by promoting microbial activity. Similarly, Majumdar et al. [56] estimated that long-term (19 years) application of NPK+FYM in rice-wheat cropping system enhanced labile C fractions by 14%.
The passive C (PC viz. LLC and RC) pools represent a stable fraction of soil C, such as humified and mineral associated C, contributing to long-term C sequestration. The use of NPK+FYM significantly increased RC (66%) compared to control. This may be due to the presence of lignin and polyphenol in FYM and crop residues, which stabilize and polymerize labile C under submerged rice conditions, thereby reducing microbial decomposition [9,29]. The findings are supported by Dheri et al. [7] who reported that the NPK+FYM based treatment increases the RC due to resistance induced by biochemical properties of organic compounds present in it. Similarly, Ramteke et al. [44] studied that the higher microbial activity under NPK+FYM facilitates the transformation and stabilization of labile C fraction to the humus, resulting in more accumulation of recalcitrant C in INM based treatment.
The RC fraction (45%) contributed the most to TOC among the extracted C fractions, followed by LC (27%), VLC (15%), and LLC (13%), indicating that the most stable RC fraction comprises the most significant portion of TOC. The exogenous FYM and incorporation of crop residue with NPK were responsible for a higher stable RC fraction. Our study is in line with the findings of Anantha et al. [57], who reported that 40.5% of RC contributed to TOC in rice-rice cropping system. In the present study, the PC pools constituted a higher proportion (57%) of the TOC than the AC pools. The applied FYM consisted of well-decomposed dung, which was rich in lignin and polyphenol compounds. These recalcitrant compounds favoured the formation of stable organo-mineral complexes, making organic matter more resistant to microbial decomposition. Singh et al. [58] reported that the long-term application of NPK+FYM in maize-wheat cropping system promotes aliphatic groups, carboxylic structures and aromatic compounds in SOC, which impart stability to soil C. Similar were the findings of Anantha et al. [59] and Majumdar et al. [56], who observed that 67% and 63% C stabilized in the PC pool, under groundnut and rice-berseem cropping systems, respectively.

4.4. Soil Bulk Density and SOC

The rice-wheat cropping in sub-tropical Vertisol, in which continuous puddling in rice promotes soil compaction by breaking down soil aggregates and reducing macropores, leads to a denser soil matrix [60]. In the wheat season, the absence of puddling does not fully restore soil structure due to high clay content and swell-shrink nature of Vertisol. Such intensive cropping with limited organic inputs reduces SOC on long-term basis, which significantly increased soil BD under most treatments, except under NPK+FYM, 150%NPK, and 50%NPK+GM. Similarly, Bhatt et al. [51] reported increase in BD of soil after 29 years of rice-wheat cropping in sub-tropical India. A marginal decrease in BD under NPK+FYM treatment compared to the initial level may be attributed to regular addition of organic manures with NPK, which enhances SOC, improves aggregation and increases microbial activity, thereby creating more porous structure that slightly counteracts the compaction effects of puddling and intensive cropping [7,61].
The SOC content increased by 16% and 13% under NPK+FYM and 150%NPK, respectively, compared to the initial value. However, the observed increase in SOC was relatively modest, which may be attributed to sub-tropical climate of the study region, where a substantial portion of added C was lost (-0.324 Mg C ha-1 yr-1, Figure 6) through biological respiration resulting in the retention of a small C fraction. Furthermore, consistent puddling in rice fields causes soil compaction, damaging soil structure and creating an unfavourable environment that limits microbial activity and reduces SOC content [5,51,60]. Our results are in line with the findings of Pathak et al. [20], who reported that long-term experiments (25–40 years) with NPK and 5–10 Mg ha−1 of organic residues increased SOC by only 10–20% of the soil’s initial value under rice-based cropping systems. After 25 years of cultivation, the SOC increased by 76%, 71%, 56%, and 55% under NPK+FYM, 150%NPK, NPK and 50%NPK+GM treatments, respectively, compared with the control. This may be attributed to an increase in primary productivity, which contributed higher biomass-C input through stubble, root and rhizodeposition [54,62]. Similarly, Dheri et al. [7] reported a 67% increase in SOC relative to the control after 22 years of continuous rice–wheat cropping. Comparable to long-term increases in SOC were also documented by Wang et al. [63] in a 33-year experiment. The external application of FYM with NPK further increases SOC, which might be attributed to increased inputs of lignin and lignin-derived compounds, high decomposition rate, and reduced C/N ratio, all of which enhance organic matter turnover, resulting in higher C accumulation in the soil. These findings are consistent with earlier reports [1,3,5,9,27,28,29,32,64].

4.5. C Sequestration

Carbon sequestration (Cseq) under a cropping system is either positive or negative, primarily governed by the balance between C inputs and losses through decomposition and gaseous emissions. The rice-wheat cropping system over 25 years of LTFE demonstrated positive Cseq, particularly under NPK and INM practices. The INM practices were found to be most beneficial as it significantly increased the Cseq and CSR over all other treatments including NPK and 150%NPK. The Cseq and CSR was three and a half times higher under NPK+FYM over the NPK. The positive effects of organic manures on Cseq have been well established and might be attributed to higher amount of C added as endogenous crop residue ( 1.56, 0.94, and 0.28 Mg C ha-1 yr-1 by stubble, root, and rhizodeposition of rice and wheat, respectively) and exogenous FYM applications (1.24 Mg C ha-1 yr-1) resulting in greater accumulation of C per unit of biomass C addition [28,43]. The interaction of NPK with FYM accelerates the Cseq [65]. This finding is in line with Ramteke et al. [44], who reported that the higher lignin, polyphenol content and C:N ratio of FYM improved plant growth, root biomass C input and CO2 fixation which may have increased Cseq in the INM treatment. The negative values of Cseq and CSR under unfertilized control, N, NP, 50%NPK indicated that the amount of C added through plant residues in that respective treatment is not sufficient to sustain initial SOC level. The net gain in SOC is expected only when the amount of C added to soil is greater than the minimum threshold value (Figure 6). Our results are consistent with those reports [31,33].
The rate of Cseq under the treatments (INM and 150%NPK) was higher than that of Paris Declaration of 4 per mille initiative. This may be probably due to presence of greater proportion of PC pools (57%), which are more stable against microbial decomposition and thereby contribute to the higher rate of Cseq. Similarly, Minasny et al. [25] reported that under optimum management practices, the 4 per mille or even higher rates of Cseq can be accomplished. Results revealed that the long-term INM practices followed by 150%NPK play a vital role in sequestering significant amount of CO2. This, in turn, may help mitigate the adverse impacts of increasing GHG emissions by providing an effective voluntary C sequestration pathway for climate-change mitigation, while sustaining biomass productivity in the rice–wheat cropping system on Vertisol in subtropical regions.

4.6. Rate Constant (H) of Added Biomass C Incorporation into SOC and Critical C Input to Maintain SOC

The SOC content is generally positively correlated with the amount of C inputs to soils. Many studies reported a linear relationship between C inputs and soil Cseq [66,67]. Conversely, in some cases, the SOC content does not increase linearly with C addition to the soil [44]. This indicates that the soil Cseq not only depends on the amount of C inputs, but is also governed by management practices, climatic conditions, soil properties, and microbial dynamics. In this study, a significant positive correlation (R2 = 0.76; p <0.001) exists between CSR (Y) and total C input (X) to the soil (Figure 6).
The negative value of the intercept (-0.324 Mg C ha-1 yr-1) of the equation represents the annual loss of C from native SOC. Kundu et al. [52] reported that the annual C loss from sub-tropical climate of India was 888 kg C ha-1 yr-1, which was higher than the rate estimated in our study. The lower value of C loss suggests a relatively slow mineralization rate of SOC under long-term fertilization in rice-wheat cropping system. Equating this intercept with ‘k*Cs’ of the Jenkinson [42] equation and setting the initial SOC stock at 16.74 Mg C ha-1, the decay rate of native SOC was 0.0193. This indicates that C loss from native SOC over 25 years of cultivation was 1.98% of the initial SOC stock. It was also estimated that only 11.91% of the total annual C input contributed to an increase in SOC (Figure 6). This could be due to the sub-tropical climate; in this climate, most added C is lost from the soil, and only a small portion accumulates [43].
From the correlation between CSR and total C input (Figure 6), to maintain the equilibria (i.e. δCs/ δt = 0) in Vertisol under an intensive rice-wheat cropping system, the critical C input to soil was 2.7 Mg C ha-1 yr-1. This amount of C is required from different endogenous and exogenous sources to be incorporated in the soil to maintain the initial SOC. The estimated maintenance C input was comparable to 2.34 Mg C ha-1 yr-1 under a double rice cropping system in semi-arid southern India [65]. However, it was lower than the C input (3.0 Mg C ha-1 yr-1) under various sustainable cropping systems [68]. Mandal [19] reported that across different agro-ecological zones in India, maintenance of SOC equilibrium requires incorporation of 0.31 to 5.16 Mg C ha-1 yr-1 into the soil. Similar to our study, in a sub-tropical climate, the C mineralization rate is high and the humification efficiency is low [22]. Therefore, a high amount of C is required to maintain the equilibrium. In the present study, the NPK+FYM followed by 150%NPK and 50%NPK+GM were the only treatments that supplied annual C inputs of 4.02, 2.85, and 2.83 Mg C ha-1 yr-1, respectively, which exceeded the critical threshold. Results revealed that under sub-tropical Indian climate conditions, the application of 5 Mg ha-1 FYM with NPK annually was a sustainable way to maintain soil C equilibrium.

4.7. Relationship Between C Input, Fraction, Sequestration and Productivity

The correlation study revealed that the yields of rice and wheat, as well as the overall system productivity (SP), were positively and significantly correlated with different C fractions, SOC, SOC stock, Cseq, and TOC (Figure 7). The different C fractions were positively and significantly interrelated, suggesting their state of dynamic equilibrium. This equilibrium between C fractions plays an important role in enhancing SOC and TOC, thereby significantly increased the soil’s capacity for Cseq. However, the correlation analysis demonstrated that the soil BD was negatively and significantly correlated with different C fractions, viz. RC (r = -0.83**), LLC (r = -0.75*), LC (r = -0.76*), and VLC (r = -0.76*). Similarly, the BD was negatively and significantly correlated with SOC (-0.80**), SOC stock (-0.75*), TOC (r = -0.80**), Cseq (r = -0.75*), rice yield (r = -0.86**), wheat yield (r = -0.81**) and SP (r = -0.81**). These results indicate that increased soil compaction in terms of BD, impairs C stabilization and sequestration processes, thereby adversely affecting crop productivity and system sustainability.
The total annual C assimilation was positively and significantly correlated with cumulative C input (y= 0.83+2.23x, R2 = 0.76; p <0.001), explaining 76% of variability (Figure 8a), indicating that higher amount of C assimilation contributed to higher cumulative C input in the soil. A strong positive correlation was observed between cumulative C input and SOC (y = 2.96089+1.18065x, R2 = 0.80; p <0.001, Figure 8b) as well as SOC stock (y= 9.30139+2.73771x, R2 = 0.76; p = 0.002, Figure 8c) This relationship suggests that cumulative C input from both endogenous and exogenous sources, play a pivotal role in enhancing long-term C storage in soil. There was positive correlation between cumulative C input and SP (R2 = 0.79) (Figure 8d). The SOC stock was significantly correlated with SYI of rice (0.46 Mg ha-1 yr-1 Mg-1 of SOC) and the SYI of wheat (0.44 Mg ha-1 yr-1 Mg-1 of SOC) (Figure 9a). A similar trend was observed for SOC stock, which showed a strong positive correlation with SP, explaining 76% of the variability (Figure 9b). This relationship also indicates that increasing 1 Mg ha-1 in SOC stock enhanced the rice-wheat SP by approximately 76 kg ha-1, assuming other management inputs remain constant. Thus, under sub-tropical Vertisol, the effective C management characterized by equilibrium between stable and labile C fractions and enhanced C sequestration through INM and balanced application of 150%NPK contributed significantly to the long-term sustainability of rice-wheat cropping system.

5. Conclusions

The findings of the present study indicate that rice-wheat cropping without fertilizer applications reduced SOC stock by 28.5% from the initial level and resulted in the lowest crop productivity. Long-term use of imbalanced fertilization (N) was insufficient to achieve the potential yield, SYI and SOC stock compared to NPK. Each 1 Mg ha-1 increase in SOC stock enhanced the rice-wheat system productivity by approximately 76 kg ha-1, assuming other management inputs remain constant. Even after 25 crop cycles, the Vertisol may not be saturated with C and still has high potential for further C sequestration. The INM under rice-wheat cropping system led to a positive build-up of C in both AC and PC pools, with approximately 57% of TOC stabilized in the PC pool. A minimum C input of 2.7 Mg C ha-1 yr-1 was estimated to maintain soil C equilibrium. Application of 5 Mg ha-1 FYM with NPK is recommended for the rice-wheat system for SOC management and crop productivity in the sub-tropical Vertisol. The rate of C sequestration under INM was higher than that of the Paris declaration of soil C “4 per mille” initiative. Hence, the INM practice plays a crucial role in mitigating climate change in sub-tropical regions, ensuring long-term sustainability of rice-wheat cropping system. These outcomes highlight the potential to improve crop productivity and SOC sequestration in Vertisol of sub-tropical region. Thus, further region-specific investigations are required under various management practices, for different soil types and agricultural systems, to address the existing knowledge gap under the prevailing sub-tropical climatic conditions.

Author Contributions

Conceptualization, U.K., V.B., G.S.D. and L.K.S.; methodology, U.K., V.B. and A.N.; formal analysis, U.K., D.K. and L.K.S.; data curation, U.K. and V.B.; writing—original draft preparation, U.K.; writing—review and editing, V.B., G.S.D., R.H.W. and D.K.; visualization, G.S.D. and R.H.W.; validation, G.S.D. and R.H.W.; supervision, V.B. and L.K.S. All authors have read and agreed to the published version of the manuscript.

Funding

This research work received no external funding.

Institutional Review Board Statement

Not applicable.

Data Availability Statement

The data presented in this study are available as supplementary data.

Acknowledgments

Authors gratefully acknowledge the Indian Council of Agricultural Research, New Delhi and ICAR-Indian Institute of Soil Science, Bhopal for providing financial and technical support to conduct field experiment under All India Coordinated Research Project on Long-Term Fertilizer Experiment. The authors are also grateful to Indira Gandhi Krishi Vishwavidyalaya, Raipur for providing field and laboratory facilities during the course of investigation. Special acknowledgement is due to Mr. Vishnu Daheria, field assistant, for his meticulous care of the field experiment and Ms. Sunita Yadav, lab assistant, for soil analysis over the years.

Conflicts of Interest

Authors do not have any conflict of interest to declare.

References

  1. Gogoi, B.; Borah, N.; Baishya, A.; Dutta, S.; Nath, D.J.; Das, R.; Bhattacharyya, D.; Sharma, K.K.; Mishra, G.; Francaviglia, R. Yield trends, soil carbon fractions and sequestration in a rice–rice system of North-East India: Effect of 32 years of INM practices. Field Crops Res. 2021, 272, 108289. [Google Scholar] [CrossRef]
  2. Bi, L.; Xia, J.; Liu, K.; Li, D.; Yu, X. Effect of long-term chemical fertilization on trends of rice yield and nutrient use efficiency under double rice cultivation in subtropical China. Plant Soil Environ. 2014, 60, 537–543. [Google Scholar] [CrossRef]
  3. Ranjan, S.; Kumar, S.; Dutta, S.K.; Padhan, S.R.; Dayal, P.; Sow, S.; Roy, D.K.; Nath, D.; Baral, K.; Bharati, V. Influence of 36 years of integrated nutrient management on soil carbon sequestration, environmental footprint and agronomic productivity of wheat under rice–wheat cropping system. Front. Environ. Sci. 2023, 11, 1222909. [Google Scholar] [CrossRef]
  4. Lal, R. Soil carbon sequestration impacts on global climate change and food security. Science 2004, 304, 1623–1627. [Google Scholar] [CrossRef] [PubMed]
  5. Singh, M.; Wanjari, R.H.; Kumar, U.; Chaudhari, S.K. AICRP on long-term fertilizer experiments: Salient achievements and future directions. Indian J. Fertil. 2019, 15, 356–372. [Google Scholar]
  6. Qaswar, M.; Jing, H.; Ahmed, W.; Li, D.; Liu, S.; Lu, Z.; Cai, A.; Liu, L.; Xu, Y.; Zhang, J.; Gao, H.; Zhou, H. Yield sustainability, soil organic carbon sequestration and nutrient balance under long-term combined application of manure and inorganic fertilizers in acidic paddy soil. Soil Tillage Res. 2020, 198, 104569. [Google Scholar] [CrossRef]
  7. Dheri, G.S.; Nazir, G.; Singh, P.; Sharma, A. A 22-year effect of mineral fertilizer and organic amendments on soil fertility, carbon pools, and productivity of rice–wheat system. Cereal Res. Commun. 2025. [Google Scholar] [CrossRef]
  8. Paustian, K.; Lehmann, J.; Ogle, S.; Reay, D.; Robertson, G.P.; Smith, P. Climate-smart soils. Nature 2016, 532, 49–57. [Google Scholar] [CrossRef] [PubMed]
  9. Rathod, P.H.; Bhoyar, S.M.; Jadhao, S.D.; Konde, N.M.; Wanjari, R.H.; Sonune, B.A.; Mali, D.V. Effect of 32 years of manuring and fertilization on carbon budgeting and carbon pools under sorghum–wheat cropping sequence in Vertisol of central India. Plant Soil 2024. [Google Scholar] [CrossRef]
  10. Benbi, D.K.; Brar, J.S. A 25-year record of carbon sequestration and soil properties in intensive agriculture. Agron. Sustain. Dev. 2009, 29, 257–265. [Google Scholar] [CrossRef]
  11. Dheri, G.S.; Nazir, G. A review on carbon pools and sequestration as influenced by long-term management practices in a rice–wheat cropping system. Carbon Manag. 2021, 12, 559–580. [Google Scholar] [CrossRef]
  12. Lal, R. Beyond COP 21: Potential and challenges of the “4 per Thousand” initiative. J. Soil Water Conserv. 2016, 71, 20A–25A. [Google Scholar] [CrossRef]
  13. Li, B.Y.; Zhou, D.M.; Cang, L.; Zhang, H.L.; Fan, X.H.; Qin, S.W. Soil micronutrient availability to crops as affected by long-term inorganic and organic fertilizer applications. Soil Tillage Res. 2007, 96, 166–173. [Google Scholar] [CrossRef]
  14. Ministry of Environment; Forest and Climate Change (MoEFCC). India: Third Biennial Update Report to the United Nations Framework Convention on Climate Change; Government of India: New Delhi, India, 2021. [Google Scholar]
  15. Ogle, S.M.; Breidt, F.J.; Paustian, K. Agricultural management impacts on soil organic carbon storage under moist and dry climatic conditions of temperate and tropical regions. Biogeochemistry 2005, 72, 87–121. [Google Scholar] [CrossRef]
  16. Jagadamma, S.; Lal, R. Distribution of organic carbon in physical fractions of soils as affected by agricultural management. Biol. Fertil. Soils 2010, 46, 543–554. [Google Scholar] [CrossRef]
  17. Bhattacharyya, R.; Chandra, S.; Singh, R.D.; Kundu, S.; Srivastava, A.K.; Gupta, H.S. Long-term farmyard manure application effects on soil properties in a silty clay loam soil under irrigated wheat–soybean rotation. Soil Tillage Res. 2007, 94, 386–396. [Google Scholar] [CrossRef]
  18. Mandal, B.; Majumder, B.; Bandyopadhyay, P.K.; Hazra, G.C.; Gangopadhyay, A.; Samantaray, R.N.; Mishra, A.K.; Chaudhury, J.; Saha, M.N.; Kundu, S. The potential of cropping systems and soil amendments for carbon sequestration in soils under long-term experiments in subtropical India. Glob. Change Biol. 2007, 13, 357–369. [Google Scholar]
  19. Mandal, B. The 29th Professor J.N. Mukherjee–ISSS Foundation Lecture: Soil organic carbon research in India—a way forward. J. Indian Soc. Soil Sci. 2011, 59, S9. [Google Scholar]
  20. Pathak, H.; Byjesh, K.; Chakrabarti, B.; Aggarwal, P.K. Potential and cost of carbon sequestration in Indian agriculture: Estimates from long-term field experiments. Field Crops Res. 2011, 120, 102–111. [Google Scholar] [CrossRef]
  21. Mandal, B.; Majumder, B.; Adhya, T.K.; Bandyopadhyay, P.K.; Gangopadhyay, A.; Sarkar, D.; Kundu, M.C.; Choudhury, S.G.; Hazra, G.C.; Kundu, S.; Samantaray, R.N.; Misra, A.K. Potential of double-cropped rice ecology to conserve organic carbon under subtropical climate. Glob. Change Biol. 2008, 14, 2139–2151. [Google Scholar] [CrossRef]
  22. Ladha, J.K.; Pathak, H.; Padre, A.T.; Dawe, D.; Gupta, R.K. Productivity trends in intensive rice–wheat cropping systems in Asia. In Improving the Productivity and Sustainability of Rice–Wheat Systems: Issues and Impacts; Ladha, J.K., Hill, J.E., Duxbury, J.M., Gupta, R.K., Buresh, R.J., Eds.; ASA–CSSA–SSSA: Madison, WI, USA, 2003; pp. 45–76. [Google Scholar]
  23. United Nations Framework Convention on Climate Change (UNFCCC). United Nations Framework Convention on Climate Change: Informal Document; UNFCCC: Bonn, Germany, 2017. [Google Scholar]
  24. Rumpel, C.; Amiraslani, F.; Chenu, C.; Cardenas, M.G.; Kaonga, M.; Koutika, L.S.; Ladha, J.; Madari, B.; Shirato, Y.; Smith, P.; Soudi, B. Response to “The ‘4p1000’ initiative: A new name should be adopted” by Baveye and White (2019). Ambio 2020, 49, 363–364. [Google Scholar] [PubMed]
  25. Minasny, B.; Malone, B.P.; McBratney, A.B.; et al. Soil carbon 4 per mille. Geoderma 2017, 292, 59–86. [Google Scholar] [CrossRef]
  26. Jat, M.L.; Chakraborty, D.; Ladha, J.K.; Rana, D.S.; Gathala, M.K.; McDonald, A. Conservation agriculture for sustainable intensification in South Asia. Nat. Sustain. 2020, 3, 336–343. [Google Scholar] [CrossRef]
  27. Naher, U.A.; Haque, M.M.; Khan, F.H.; Sarkar, M.I.U.; Ansari, T.H.; Hossain, M.D.; Biswas, J.C. Effect of long-term nutrient management practices on soil health and paddy yield of rice–rice–fallow cropping system in tropical humid climate. Eur. J. Soil Biol. 2021, 107, 103362. [Google Scholar] [CrossRef]
  28. Huang, X.; Jia, Z.; Jiao, X.; Wang, J.; Huang, X. Long-term manure applications to increase carbon sequestration and macroaggregate-stabilized carbon. Soil Biol. Biochem. 2022, 174, 108827. [Google Scholar] [CrossRef]
  29. Anandakumar, S.; Malarkodi, M.; Bakhoum, N.; Chinnadurai, C.; Arulmozhiselvan, K.K.; Karthikeyan, S.; Balachandar, D. Impact of long-term nutrient management on sequestration and dynamics of soil organic carbon in a semi-arid tropical Alfisol of India. Appl. Soil Ecol. 2022, 177, 104549. [Google Scholar] [CrossRef]
  30. Singh, P.; Nazir, G.; Dheri, G.S. Influence of different management practices on carbon sequestration of agricultural soils: A review. Arch. Agron. Soil Sci. 2023, 69, 2471–2492. [Google Scholar]
  31. Nazir, M.J.; Li, G.; Nazir, M.M.; Zulfiqar, F.; Siddique, K.H.M.; Iqbal, B.; Du, D. Harnessing soil carbon sequestration to address climate change challenges in agriculture. Soil Tillage Res. 2024, 237, 105959. [Google Scholar] [CrossRef]
  32. Srinivasarao, C.; Kundu, S.; Dubey, D.P. Soil carbon sequestration and agronomic productivity as influenced by long-term organic and inorganic fertilisation under the upland rice–wheat system in Vertisol of central India. Anthr. Sci. 2024, 3, 81–94. [Google Scholar] [CrossRef]
  33. Kaur, M.; Dheri, G.S.; Walia, S.S.; Choudhary, O.P. Impact of 38-year integrated nutrient management on soil carbon sequestration and greenhouse gas emissions of a rice–wheat cropping system. Agric. For. Meteorol. 2025, 363, 110415. [Google Scholar] [CrossRef]
  34. Soil Survey Staff. Keys to Soil Taxonomy, 12th ed.; United States Department of Agriculture, Natural Resources Conservation Service: Washington, DC, USA, 2014. [Google Scholar]
  35. Reddy, S.R.; Reddy, Y.R. Agronomy of Field Crops, 4th ed.; Kalyani Publishers: Ludhiana, India, 2016. [Google Scholar]
  36. Walkley, A.; Black, I.A. An examination of the Degtjareff method for determining soil organic matter and a proposed modification of the chromic acid titration method. Soil Sci. 1934, 37, 29–39. [Google Scholar] [CrossRef]
  37. Chan, K.Y.; Bowman, A.; Oates, A. Oxidizable organic carbon fractions and soil quality changes in an oxic Paleustalf under different pasture leys. Soil Sci. 2001, 166, 61–67. [Google Scholar] [CrossRef]
  38. Richards, L.A. Diagnosis and Improvement of Saline and Alkali Soils; USDA Agriculture Handbook No. 60; United States Department of Agriculture: Washington, DC, USA, 1954. [Google Scholar]
  39. Jha, P.; Lakaria, B.L.; Biswas, A.K.; Srivastava, S.; Neenu, S.; Rashmi, I.; Subba Rao, A. A Manual on Soil Carbon Analysis; Indian Institute of Soil Science: Bhopal, India, 2013; pp. 1–41. [Google Scholar]
  40. Fageria, N.K.; dos Santos, A.B.; Coelho, A.M. Growth, yield and yield components of lowland rice as influenced by ammonium sulphate and urea fertilization. J. Plant Nutr. 2011, 34, 371–386. [Google Scholar] [CrossRef]
  41. Regmi, A.P. Long-Term Effects of Organic Amendment and Mineral Fertilizer on Soil Fertility in a Rice–Rice–Wheat Cropping System in Nepal. M.Sc. Thesis, University of the Philippines Los Baños, Los Baños, Philippines, 1994; pp. 58–64. [Google Scholar]
  42. Jenkinson, D.S. Soil organic matter and its dynamics. In Russell’s Soil Conditions and Plant Growth, 11th ed.; Wild, A., Ed.; Longman Group UK Limited: London, UK, 1988; pp. 564–607. [Google Scholar]
  43. Kundu, S.; Bhattacharyya, R.; Prakash, V.; Ghosh, V.; Gupta, H.S. Carbon sequestration and relationship between carbon addition and storage under rainfed soybean–wheat rotation in a sandy loam soil of the Indian Himalayas. Soil Tillage Res. 2007, 92, 87–95. [Google Scholar] [CrossRef]
  44. Ramteke, P.; Gabhane, V.; Kadu, P.; Kharche, V.; Jadhao, S.; Turkhede, A.; Gajjala, R.C. Long-term nutrient management effects on organic carbon fractions and carbon sequestration in Typic Haplusterts soils of central India. Soil Use Manag. 2023. [Google Scholar] [CrossRef]
  45. Singh, R.P.; Das, S.K.; Bhaskarrao, U.M.; Reddy, M.N. Sustainability Index under Different Management; Annual Report; CRIDA: Hyderabad, India, 1990. [Google Scholar]
  46. Wanjari, R.H.; Singh, M.V.; Ghosh, P.K. Sustainable yield index: An approach to evaluate the sustainability of long-term intensive cropping systems in India. J. Sustain. Agric. 2004, 24, 39–56. [Google Scholar] [CrossRef]
  47. Gomez, K.A.; Gomez, A.A. Statistical Procedures for Agricultural Research, 2nd ed.; John Wiley & Sons: New York, NY, USA, 1984; pp. 180–209. [Google Scholar]
  48. R Core Team. R: A Language and Environment for Statistical Computing; R Foundation for Statistical Computing: Vienna, Austria, 2020; Available online: https://www.R-project.org/ (accessed on 14 June 2026).
  49. Majhi, P.; Rout, K.K.; Nanda, G.; Singh, M. Long-term effects of fertilizer and manure application on productivity, sustainability and soil properties in a rice–rice system on Inceptisols of eastern India. Commun. Soil Sci. Plant Anal. 2021. [Google Scholar] [CrossRef]
  50. Dhawan, G.; Dheri, G.S.; Gill, A.A.S. Long-term use of balanced fertilization decreases nitrogen losses in a maize–wheat system on Inceptisol of north India. Arch. Agron. Soil Sci. 2021, 67, 1–18. [Google Scholar] [CrossRef]
  51. Bhatt, M.K.; Singh, D.K.; Raverkar, K.P.; Chandra, R.; Pareek, N.; Dey, P.; Pramanick, B.; Joshi, H.C.; Kumar, M.; Gaber, A.; Alsuhaibani, A.M.; Hossain, A. Effects of varied nutrient regimes on soil health and long-term productivity in a rice–wheat system: Insights from a 29-year study in the Mollisols of the Himalayan Tarai region. Front. Sustain. Food Syst. 2023, 7, 1206878. [Google Scholar] [CrossRef]
  52. Kundu, S.; Singh, M.; Saha, J.K.; Biswas, A.; Tripathi, A.K.; Acharya, C.L. Relationship between C addition and storage in a Vertisol under soybean–wheat cropping system in subtropical central India. J. Plant Nutr. Soil Sci. 2001, 164, 483–486. [Google Scholar] [CrossRef]
  53. Singh, M.; Wanjari, R.H. Balanced nutrient management: A key to sustain productivity and soil health on a long-term basis. Indian J. Fertil. 2013, 9, 72–81. [Google Scholar]
  54. Brar, B.S.; Singh, K.; Dheri, G.S.; Kumar, B. Carbon sequestration and soil carbon pools in a rice–wheat cropping system: Effect of long-term use of inorganic fertilizers and organic manure. Soil Tillage Res. 2013, 128, 30–36. [Google Scholar] [CrossRef]
  55. Ghosh, A.; Bhattacharyya, R.; Dwivedi, B.S.; Biswas, D.R.; Meena, M.C.; Sarkar, A.; Agarwal, B.K.; Mahapatra, P.; Shahi, D.K.; Agnihotri, R.; Sawlani, R. Depth dynamics of soil N contents and natural abundances of ^15N after 43 years of long-term fertilization and liming in subtropical Alfisol. Arch. Agron. Soil Sci. 2018, 64, 1290–1301. [Google Scholar] [CrossRef]
  56. Majumder, B.; Mandal, B.; Bandyopadhyay, P.K.; Gangopadhyay, A.; Mani, P.K.; Kundu, A.L.; Majumder, D. Organic amendments influence soil organic carbon pools and crop productivity in 19-year-old rice–wheat agroecosystems. Soil Sci. Soc. Am. J. 2008, 72, 775–785. [Google Scholar] [CrossRef]
  57. Anantha, K.C.; Majumder, S.P.; Badole, S.; Padhan, D.; Datta, A.; Mandal, B.; Sreenivas, C.H. Pools of organic carbon in soils under a long-term rice–rice system with different organic amendments in hot subhumid India. Carbon Manag. 2020, 11, 331–339. [Google Scholar] [CrossRef]
  58. Singh, P.; Dheri, G.S.; Nazir, G.; Kalia, A. Does long-term fertilization impact soil carbon functional group composition and its distribution in aggregates? J. Soil Sci. Plant Nutr. 2025. [Google Scholar] [CrossRef]
  59. Anantha, K.C.; Mandal, B.; Badole, S.; Majumder, S.P.; Datta, A.; Padhan, D.; Babu, M.V.S. Distribution of sequestered carbon in different pools in Alfisols under long-term groundnut system of hot arid region of India. Eur. J. Agron. 2022, 135, 126467. [Google Scholar] [CrossRef]
  60. Kumar, U.; Mishra, V.N.; Kumar, N.; Srivastava, L.K.; Tedia, K.; Bajpai, R.K.; Singh, M.; Mohanty, M. Assessing soil quality and their indicators for long-term rice-based cropping systems in a hot sub-humid eco-region of India. Soil Res. 2022, 60, 610–623. [Google Scholar] [CrossRef]
  61. Agbede, T.M.; Ojeniyi, S.O.; Adeyemo, A.J. Effect of poultry manure on soil physical and chemical properties, growth and grain yield of sorghum in southwest Nigeria. Eur. Asian J. Sustain. Agric. 2008, 2, 72–77. [Google Scholar]
  62. Tripathi, R.; Nayak, A.K.; Bhattacharyya, P.; Shukla, A.K.; Shahid, M.; Raja, R.; Panda, B.B.; Mohanty, S.; Kumar, A.; Thilagam, V.K. Soil aggregation and distribution of carbon and nitrogen in different fractions after 41 years of long-term fertilizer experiment in a tropical rice–rice system. Geoderma 2014, 213, 280–286. [Google Scholar] [CrossRef]
  63. Wang, J.; Wang, K.; Wang, X.; Ai, Y.; Zhang, Y.; Yu, J. Carbon sequestration and yields with long-term use of inorganic fertilizers and organic manure in a six-crop rotation system. Nutr. Cycl. Agroecosyst. 2018, 111, 87–98. [Google Scholar] [CrossRef]
  64. Ghosh, M.; Ashiq, W.; Vasava, H.; Gamage, D.N.V.; Patra, A.K.; Biswas, A. Short-term carbon sequestration and changes of soil organic carbon pools in rice under integrated nutrient management in India. Agriculture 2021, 11, 348. [Google Scholar] [CrossRef]
  65. Anantha, K.C.; Majumder, S.P.; Padhan, D.; Badole, S.; Datta, A.; Mandal, B.; Gade, K.R. Carbon dynamics, potential and cost of carbon sequestration in double rice cropping system in semi-arid southern India. J. Soil Sci. Plant Nutr. 2018, 18, 418–434. [Google Scholar] [CrossRef]
  66. Srinivasarao, C.; Kundu, S.; Kumpawat, B.S.; Kothari, A.K.; Sodani, S.N.; Sharma, S.K.; Yashavanth, B.S. Soil organic carbon dynamics and crop yields of maize (Zea mays)–black gram (Vigna mungo) rotation-based long-term manurial experimental system in semi-arid Vertisols of western India. Trop. Ecol. 2019, 60, 433–446. [Google Scholar] [CrossRef]
  67. Srinivasarao, C.; Singh, S.P.; Kundu, S.; Abrol, V.; Lal, R.; Abhilash, P.C.; Venkateswarlu, B. Integrated nutrient management improves soil organic matter and agronomic sustainability of semi-arid rainfed Inceptisols of the Indo-Gangetic Plains. J. Plant Nutr. Soil Sci. 2021, 184, 562–572. [Google Scholar] [CrossRef]
  68. Kong, A.Y.Y.; Six, J.; Bryant, D.C.; Denison, R.F.; van Kessel, C. The relationship between carbon input, aggregation, and soil organic carbon stabilization in sustainable cropping systems. Soil Sci. Soc. Am. J. 2005, 69, 1078–1085. [Google Scholar] [CrossRef]
Figure 1. Impact of long-term application of chemical fertilizer and organic manure on weighted mean grain yield of rice and wheat (1999-2023).
Preprints 223720 g001
Figure 2. Impact of long-term application of chemical fertilizer and organic manure on grain yield trends of rice and wheat (1999 to 2023).
Preprints 223720 g002
Figure 3. Impact of long-term application of chemical fertilizer and organic manure on total annual carbon assimilation by rice and wheat and total annual carbon input to soil. Different lowercase letters indicate significant difference among the treatment at p < 0.05 according to Tukey’s HSD test.
Preprints 223720 g003
Figure 4. Impact of long-term application of chemical fertilizer and organic manure on active and passive pool of carbon (g kg-1) over 25 years (1999 to 2023).
Preprints 223720 g004
Figure 5. Impact of long-term application of chemical fertilizer and organic manure on weighted mean soil organic carbon (1999-2023).
Preprints 223720 g005
Figure 6. Relationship between total annual carbon input to soil by rice and wheat and carbon sequestration rate to estimate critical carbon input.
Preprints 223720 g006
Figure 7. Pearson’s correlation matrix among rice, wheat yield, carbon fractions, carbon sequestration, SOC stock and system productivity of rice-wheat cropping system. Light blue and green are for positive correlation and dark blue is for negative ones. SP: system productivity; RC: recalcitrant C; VLC; very labile C; LC: labile C; LLC: less labile C; Cseq.: carbon sequestration; SOC- soil organic carbon; TOC: total organic carbon.
Preprints 223720 g007
Figure 8. Relationship between cumulative carbon input and a) total carbon assimilation; b) soil organic carbon (SOC); c) SOC stock and d) SP under long-term application of chemical fertilizer and organic manure. Data were pooled across the treatment. Points represent measurement, and the line represents the best fit to the linear function.
Preprints 223720 g008
Figure 9. Relationship between SOC stock and a) crop yields; b) SYI of rice and wheat under long-term application of chemical fertilizer and organic manure. Data were pooled across the treatment. Points represent measurement, and the line represents the best fit to the linear function.
Preprints 223720 g009
Table 1. Mean climatic parameters of rice and wheat growing seasons over the experimental period (1999-2023).
Months Mean Temperature (°C) Rainfall (mm) Mean RH (%) Evaporation (mm day-1) Sunshine (h)
Rice growing season
July 28 348.5 81.6 114.7 2.9
August 28 311.0 84.2 98.0 2.9
September 28 223.7 81.5 99.2 4.9
October 27 41.8 71.7 104.2 7.3
November 23 7.1 63.4 90.3 8.0
Wheat growing season
December 20 10.3 61.4 83.4 7.2
January 20 13.3 60.4 86.8 7.3
February 23 18.0 57.2 108.1 8.2
March 27 10.4 47.6 174.4 8.4
April 32 17.7 37.5 254.4 8.8
*Source of data: Department of Agro-meteorology, IGKV, Raipur.
Table 2. Initial soil physico-chemical characteristics of long-term fertilizer experiment in a Vertisol.
Soil characteristics Values
Bulk density (Mg m-3) 1.35
Textural Class Clayey
pH (soil: water, 1.25) 7.7
EC (dS m-1) 0.20
Soil organic carbon (g kg-1) 6.2
Sand (%) 20
Silt (%) 34
Clay (%) 46
CEC (cmol (p+) kg-1) 38
Available N (kg ha-1) 236
Available P (kg ha-1) 16
Available K (kg ha-1) 474
DTPA Extractable Zn (mg kg-1) 1.2
Table 3. Treatment details of the long-term fertilizer experiment (1999-2023) under rice-wheat cropping systems in a Vertisol.
Treatment details Treatment
notation
Rice Wheat
Control (No manure and fertilizer) Control
(No manure and fertilizer)
Control
50%NPK 50%NPK 50%NPK
100%NPK 100%NPK NPK
150%NPK 150%NPK 150%NPK
100%NPK + Zn (ZnSO4 @ 10 kg ha-1) 100%NPK NPK+Zn
100%NP 100% NP NP
100%N 100% N N
100%NPK+FYM (@ 5 Mg ha-1 annually before rice transplanting) 100%NPK NPK+FYM
50%NPK+BGA @ 10 kg ha-1 (dry culture) was only applied annually after one week of rice transplanting 50%NPK 50%NPK+BGA
50%NPK+GM (was sown in-situ 2 months before rice transplanting and incorporated) 50%NPK 50%NPK+GM
Note: 100%NPK - 100 N: 60 P2O5: 40 K2O kg ha-1 since 1999 to 2018, and 120 N: 60 P2O5: 40 K2O kg ha-1 since 2019 to 2023, FYM- Farmyard manure, BGA- Blue green algae, GM – Green manure (Sunhemp – Crotalaria Juncea).
Table 4. Grain yield, sustainable yield index (SYI), yield trends and system productivity (SP) of rice and wheat as influenced by long-term application of chemical fertilizer and organic manure (1999-2023).
Treatments Mean (1999-2023)
grain yield
(Mg ha-1)
Magnitude of Change in yield over control (%) SYI Yield trends
(kg ha-1 yr-1)
SP
(Mg ha-1)
Rice Wheat Rice Wheat Rice Wheat Rice Wheat
Control 2.28f 1.08g - - 0.28f 0.20f -12.40 - 14.20 2.93f
50%NPK 4.15d 1.84e 82 70 0.51d 0.35d +15.30 +29.00 6.04d
NPK 5.29b 2.61c 132 142 0.64b 0.51b +40.80 +36.89 8.60b
150%NPK 5.80a 3.03a 154 181 0.71a 0.60a +49.40 +49.22 9.88a
NPK+Zn 5.22b 2.97c 129 175 0.63b 0.51b +31.50 +36.82 8.42b
NP 5.20b 2.56c 128 137 0.63b 0.50b +32.00 +36.94 8.29b
N 3.60e 1.64f 58 52 0.44e 0.31e -12.50 - 18.11 4.64e
NPK+FYM 5.70a 2.93b 150 171 0.70a 0.58a +48.70 +46.43 9.75a
50%NPK+BGA 4.14d 1.91e 82 77 0.51d 0.36d +6.13 +24.29 5.84d
50%NPK+GM 4.77c 2.12d 109 96 0.58c 0.40c +2.00 +45.02 7.20c
Value followed by the same letter within a column are not significant different at p < 0.05 according to Tukey’s HSD test.
Table 5. Biomass yield, biomass C, estimated total annual C assimilation and total annual C input by rice as influenced by long-term application of chemical fertilizer and organic manure (1999-2023).
Treatment Biomass yield (Mg ha-1) Biomass C (Mg ha-1) Total annual C Assimilated (Mg ha-1) Carbon added to soil by FYM and GM (Mg ha-1) Total
annual C input
to soil (Mg ha-1)
Straw Stubble Root Grain Straw Stubble Root Rhizo-
deposition
Control 2.47f 0.95f 0.57f 0.91f 0.99f 0.38f 0.23f 0.07f 2.51f - 0.68g
50%NPK 4.50d 1.73d 1.04d 1.66d 1.80d 0.69d 0.41d 0.12d 4.57d - 1.23e
NPK 5.70b 2.19b 1.32b 2.11b 2.28b 0.88b 0.53b 0.16b 5.79b - 1.56d
150%NPK 6.28a 2.42a 1.45a 2.32a 2.51a 0.96a 0.58a 0.17a 6.37a - 1.72c
NPK+Zn 5.65b 2.17b 1.30b 2.09b 2.26b 0.87b 0.52b 0.15b 5.73b - 1.55d
NP 5.63b 2.16b 1.30b 2.08b 2.25b 0.87b 0.52b 0.15b 5.71b - 1.54d
N 3.91e 1.50e 0.90e 1.44e 1.56e 0.60e 0.36e 0.10e 3.97e - 1.07f
NPK+FYM 6.18a 2.38a 1.43a 2.28a 2.47a 0.95a 0.57a 0.17a 6.28a 1.24 2.93a
50%NPK+BGA 4.48d 1.72d 1.03d 1.66d 1.80d 0.70d 0.41d 0.12d 4.55d - 1.23e
50%NPK+GM 5.16c 1.99c 1.19c 1.91c 2.06c 0.79c 0.48c 0.14c 5.24c 0.61 2.03b
Biomass grain yield of rice is presented in Table 4. Abbreviations: FYM – Farm yard manure, GM – green manure. Values followed by the same letter within a column are not significantly different at p < 0.05 according to Tukey’s HSD test.
Table 6. Biomass yield, biomass C, estimated total annual C assimilation and total annual C input by wheat as influenced by long-term application of chemical fertilizer and organic manure (1999-2023).
Treatment Biomass yield (Mg ha-1) Biomass C (Mg ha-1) Total annual C assimilated
(Mg ha-1)
Total annual C input to soil
(Mg ha-1)
Straw Stubble Root Grain Straw Stubble Root Rhizo-
deposition
Control 1.75g 0.57g 0.34g 0.43g 0.70g 0.23g 0.14g 0.04g 1.49g 0.40g
50%NPK 3.06e 0.99e 0.59e 0.75e 1.22e 0.40e 0.23e 0.07e 2.60e 0.70e
NPK 4.27c 1.38c 0.82c 1.05c 1.70c 0.55c 0.31c 0.10c 3.63c 0.98c
150%NPK 4.93a 1.59a 0.96a 1.21a 1.97a 0.64a 0.38a 0.11a 4.20a 1.13a
NPK+Zn 4.25c 1.37c 0.82c 1.04c 1.70c 0.55c 0.33c 0.09c 3.62c 0.98c
NP 4.18c 1.35c 0.81c 1.02c 1.67c 0.54c 0.32c 0.09c 3.56c 0.96c
N 2.68f 0.87f 0.52f 0.65f 1.07f 0.35f 0.21f 0.06f 2.28f 0.62f
NPK+FYM 4.75b 1.53b 0.92b 1.16b 1.90b 0.61b 0.37b 0.11b 4.05b 1.09b
50%NPK+BGA 3.14e 1.01e 0.60e 0.77e 1.25e 0.40e 0.24e 0.07e 2.67e 0.72e
50%NPK+GM 3.50d 1.13d 0.68d 0.86d 1.40d 0.45d 0.27d 0.08d 2.98d 0.80d
Biomass grain yield of rice is presented in Table 4. Values followed by the same letter within a column are not significantly different at p < 0.05 according to Tukey’s HSD test.
Table 7. Soil organic carbon fractions (g kg-1) and total organic carbon (TOC) (g kg-1) as influenced by long-term application of chemical fertilizer and organic manure (1999-2023).
Treatment Active carbon (AC) pool Passive carbon (PC) pool TOC
Very labile C (VLC) Labile
C (LC)
Less labile
C (LLC)
Recalcitrant
C (RC)
Control 0.88d 2.06d 0.62e 2.96d 6.49d
50%NPK 1.27c 2.34c 1.10c 4.06c 8.81c
NPK 1.57b 2.71b 1.38b 4.63b 10.30b
150%NPK 1.96a 2.98a 1.66a 4.87a 11.60a
NPK+Zn 1.61b 2.70b 1.30b 4.56b 10.14b
NP 1.32c 2.36c 0.88d 4.07c 8.64c
N 0.95d 2.13d 0.63e 3.01d 6.72d
NPK+FYM 2.00a 3.00a 1.67a 4.89a 11.62a
50%NPK+BGA 1.29c 2.40c 1.15c 4.10c 8.93c
50%NPK+GM 1.64b 2.64b 1.41b 4.62b 10.35b
Values followed by the same letter within a column are not significantly different at p < 0.05 according to Tukey’s HSD test.
Table 8. Soil organic carbon stock, carbon sequestration, sequestration rate and soil C 4 per mille as influenced by long-term application of chemical fertilizer and organic manure (1999-2023).
Treatment Bulk density
(Mg m-3)
SOC
(g kg-1)
SOC stock
(Mg ha-1)
Cseq
(Mg ha-1)
CSR
(Mg C ha-1 yr-1)
Soil C 4 per mille
(Mg C ha-1 yr-1)
Control 1.46a 4.10d 11.97f -4.77f -0.20f 0.05f
50%NPK 1.42ab 5.44c 15.44de -1.30de -0.06de 0.06de
NPK 1.36ab 6.36b 17.30bc 0.56bc 0.02bc 0.07bc
150%NPK 1.35b 7.00a 18.89ab 2.15ab 0.09ab 0.08ab
NPK+Zn 1.36ab 6.26b 17.04cd 0.30cd 0.01cd 0.07cd
NP 1.37ab 5.34c 14.63e -2.11e -0.09e 0.06e
N 1.41ab 4.27d 12.03f -4.71f -0.20f 0.05f
NPK+FYM 1.32b 7.20a 19.01a 2.27a 0.10a 0.08a
50%NPK+BGA 1.38ab 5.53c 15.05e -1.69e -0.07e 0.06e
50%NPK+GM 1.35b 6.35b 17.14c 0.40c 0.02c 0.07c
Initial 1.35 6.20 16.74
SOC- Soil organic carbon, Cseq – Carbon sequestration, CSR - Carbon sequestration rate. Values followed by the same letter within a column are not significantly different at p < 0.05 according to Tukey’s HSD test.
Disclaimer/Publisher’s Note: The statements, opinions and data contained in all publications are solely those of the individual author(s) and contributor(s) and not of MDPI and/or the editor(s). MDPI and/or the editor(s) disclaim responsibility for any injury to people or property resulting from any ideas, methods, instructions or products referred to in the content.
Copyright: This open access article is published under a Creative Commons CC BY 4.0 license, which permit the free download, distribution, and reuse, provided that the author and preprint are cited in any reuse.