

Submitted:
16 July 2026
Posted:
17 July 2026
You are already at the latest version
Abstract
Inadequate sleep is common, with up to 40% of adults worldwide getting less than 7 h of sleep per night. Inadequate sleep increases the risk of glucose intolerance, a precursor to type 2 diabetes. While most laboratory studies have focused on severe sleep loss (< 5 h per night), the impact of moderate sleep loss (< 7 h per night), a pattern more representative of modern society, on glucose tolerance has received less attention. Emerging evidence suggests that sleep-loss-induced glucose intolerance may partly result from alterations in mitochondrial characteristics, although direct mechanistic evidence remains limited. It is also unclear whether these changes persist or can be reversed by recovery sleep, during which adequate sleep is restored. This review summarises the effects of varying severities of inadequate sleep on glucose tolerance and highlights current evidence linking alterations in mitochondrial characteristics and changes in glucose tolerance to periods of inadequate sleep. We also discuss whether recovery sleep may restore mitochondrial characteristics and improve glucose tolerance and investigate the potential role of allostasis in these changes. Understanding these mechanisms is critical for assessing the potential reversibility of sleep-loss-induced changes in glucose tolerance and informing strategies to mitigate the adverse health effects associated with inadequate sleep.
Keywords:
insulin sensitivity
; sleep deprivation
; sleep restriction
; recovery sleep
; allostasis
1. Introduction
Adequate sleep is a fundamental requirement for maintaining good health in almost all species, including humans [1]. The many functions of sleep include, but are not limited to, promoting growth in children and adolescents, learning and cognitive development, maintaining immunity, and regulating metabolism [2]. The definition of what is considered adequate sleep changes throughout life, with current recommendations that children (5 - 13 y) sleep 9 to 11 h per night, youths (13 - 18 y) sleep 8 to 10 h per night, adults (18 - 64 y) sleep 7 to 9 h per night, and that older adults (≥ 65 y) acquire a sleep of time 7 to 8 h per night [3].
In recent years, there has been increased research into the influence of sleep on health. However, one of the challenges when interpreting the published literature is the lack of consistent terminology. This review focuses specifically on sleep duration and applies the following definitions throughout: total sleep deprivation - more than 24 h of continuous wakefulness; sleep restriction - consecutive periods of experimentally reduced sleep duration below habitual levels; inadequate sleep or sleep loss - less than the recommended amount of sleep; adequate sleep - sleep duration within the recommended range for age; and excessive sleep - sleep duration greater than the recommended amount. Both inadequate sleep and sleep restriction can be further described as severe (< 5 h per night) or moderate (> 5 h but < 7 h per night) [4] (Figure 1, Supplementary Table S1).
Despite current sleep recommendations, inadequate sleep is highly prevalent worldwide. This increasing prevalence has been driven by factors such as shift work, social and occupational demands, stress, and the increasing incidence of sleep disorders [5]. Across regions, approximately 17–54% of adults report sleeping less than 7 h per night, with particularly high prevalence observed in Asia (33% to 54%) [6,7], Sub-Saharan Africa (43%) [8], the United States (35%) [9], and Australia (40%) [10]. This inadequate sleep is associated with a range of adverse outcomes, including impaired alertness and work performance [11], increased accident risk [11], and greater prevalence of chronic conditions such as hypertension, cardiovascular disease, obesity, and type 2 diabetes (T2D) [12], as well as higher all-cause mortality [13]. Among these, the relationship between inadequate sleep and T2D is especially well documented [14]. Given the concurrent rise in both inadequate sleep [9] and T2D [15] in recent decades, understanding the relationship between these two factors has become an important area of investigation and is the focus of this review.
2. Sleep Loss, Glucose Tolerance, and Diabetes
Evidence continues to accumulate regarding the critical influence of sleep on metabolic health, particularly concerning its role in regulating glucose metabolism [14,16]. Both a single night [17] and multiple consecutive nights of inadequate sleep [18] are increasingly recognised as significant contributors to impaired glucose tolerance, a primary characteristic of T2D. There are several methods commonly utilised to assess glucose tolerance, each capturing distinct aspects of glycaemic regulation (Figure 2, Supplementary Table S2). These assessments have often been employed interchangeably within sleep studies, providing complementary yet distinct information about the influence of sleep on glucose metabolism.
Epidemiological evidence consistently links inadequate sleep with an increased risk of T2D (Figure 3). A meta-analysis of 10 cross-sectional studies including 482,502 participants reported that, relative to 7 hours of sleep per night, the pooled relative risk of T2D was 1.09 (95% CI, 1.04–1.15) for each 1-hour reduction in sleep duration below 7 hours and 1.14 (95% CI, 1.03–1.26) for each 1-hour increase above 7 hours [14]. Although excessive sleep is also associated with elevated T2D risk, the underlying mechanisms are likely distinct and may reflect factors such as comorbid disease or reduced physical activity [22]. Collectively, these findings suggest that deviation from the recommended sleep duration is associated with a greater risk of T2D.
2.1. Total Sleep Deprivation and Glucose Tolerance
In addition to epidemiological evidence, laboratory-controlled interventional studies also support a direct link between inadequate sleep and impaired glucose regulation. One night of total sleep deprivation has been shown to increase glucose area under the curve (AUC) compared with one night of 8.5 h sleep [23], with this finding supported by several further studies also reporting reduced glucose tolerance or insulin sensitivity following one night of sleep deprivation, as assessed by an OGTT or insulin suppression tests [24,25,26]. Extreme periods of sleep deprivation (e.g., 120 h of wakefulness) are reported to increase fasting glucose levels, compared to three nights of ‘normal’ sleep (duration not specified) [27]. Another study showed that after 60 h of sleep deprivation, participants had increased fasting insulin levels and greater insulin responses during an OGTT compared with one night of 7 h TIB [28]. Therefore, substantial evidence exists linking periods of total sleep deprivation to impaired glucose tolerance (Supplementary Table S3).
2.2. Severe Sleep Restriction and Glucose Tolerance
Responses in glucose tolerance to periods of total sleep deprivation are unlikely to be representative of the sleep habits that more commonly occur in modern society. Several experimental studies have therefore examined the effects of severe sleep loss (< 5 h of sleep per night) on glucose tolerance. One of the initial studies that demonstrated an influence of severe sleep restriction on glucose tolerance was conducted by Speigel et al. [16]. In this study, 11 healthy young participants underwent 6 nights of 4 h TIB; this resulted in an increase in glucose levels during an IVGTT when compared to 6 nights of recovery sleep (average total sleep time of 9 h and 3 min per night) [16]. These findings have been supported by several subsequent studies (Supplementary Table S4), which observed that participants who underwent a period of severe sleep restriction demonstrated a decline in glucose tolerance and/or insulin sensitivity [17,18,29,30,31,32,33,34,35,36]. Therefore, there is also significant evidence linking periods of severe sleep restriction to impaired glucose tolerance.
2.3. Moderate Sleep Restriction and Glucose Tolerance
The occurrence of moderate sleep loss (> 5 h but < 7 h per night) is perhaps the most common form of sleep loss in modern society [37]. Despite this, relatively few laboratory studies have examined the effect of moderate sleep loss on glucose metabolism. However, the evidence available suggests that moderate sleep restriction also impairs glucose tolerance, with 5.5 h time in bed (TIB) for 14 nights shown to increase insulin resistance and reduce glucose tolerance compared with 8.5 h TIB, when assessed via an IVGTT [38,39]. Similarly, restricting sleep to 6.5 h TIB for 3 nights reduced insulin responses during an OGTT relative to an 8.5 h TIB condition [40]. Collectively, these findings suggest that even moderate sleep loss may impair glucose tolerance (Supplementary Table S5). Although compared with more severe sleep loss interventions, there is comparably little evidence regarding the impact of this degree of sleep loss on glucose tolerance. This is an important area of future research, given that the physiological effects of total sleep deprivation and severe sleep loss are likely not representative of the changes in glucose tolerance that occur with moderate levels of sleep loss, which are more prevalent in society.
2.4. Summary of Inadequate Sleep on Glucose Tolerance
Collectively, these studies provide convincing evidence linking varying levels of inadequate sleep to the development of glucose intolerance. Despite this, the potential mechanisms linking inadequate sleep to changes in glucose tolerance remain poorly understood. Previous studies have proposed that inadequate sleep may cause alterations to inflammation, insulin signalling pathways, altered metabolic hormone profiles, endothelial function, and circadian misalignment that may contribute to glucose intolerance [12]. However, an emerging hypothesis is that impaired glucose metabolism due to sleep loss may be linked to altered mitochondrial characteristics in skeletal muscle [41].
3. Skeletal Muscle Mitochondrial Characteristics and Glucose Tolerance
3.1. Mitochondrial Structure and Function in Skeletal Muscle
Mitochondria are double-membraned organelles with a diverse range of functions. For example, they generate ATP through oxidative phosphorylation (supplying usable energy for many biological processes), regulate metabolism, synthesise signalling molecules, and control cell survival through apoptosis [42]. Given these many roles and functions, mitochondria have been strongly linked to health and disease [43]. Most notably for this review, due to their role in glucose metabolism, altered mitochondrial characteristics have been linked to the development of insulin resistance [44].
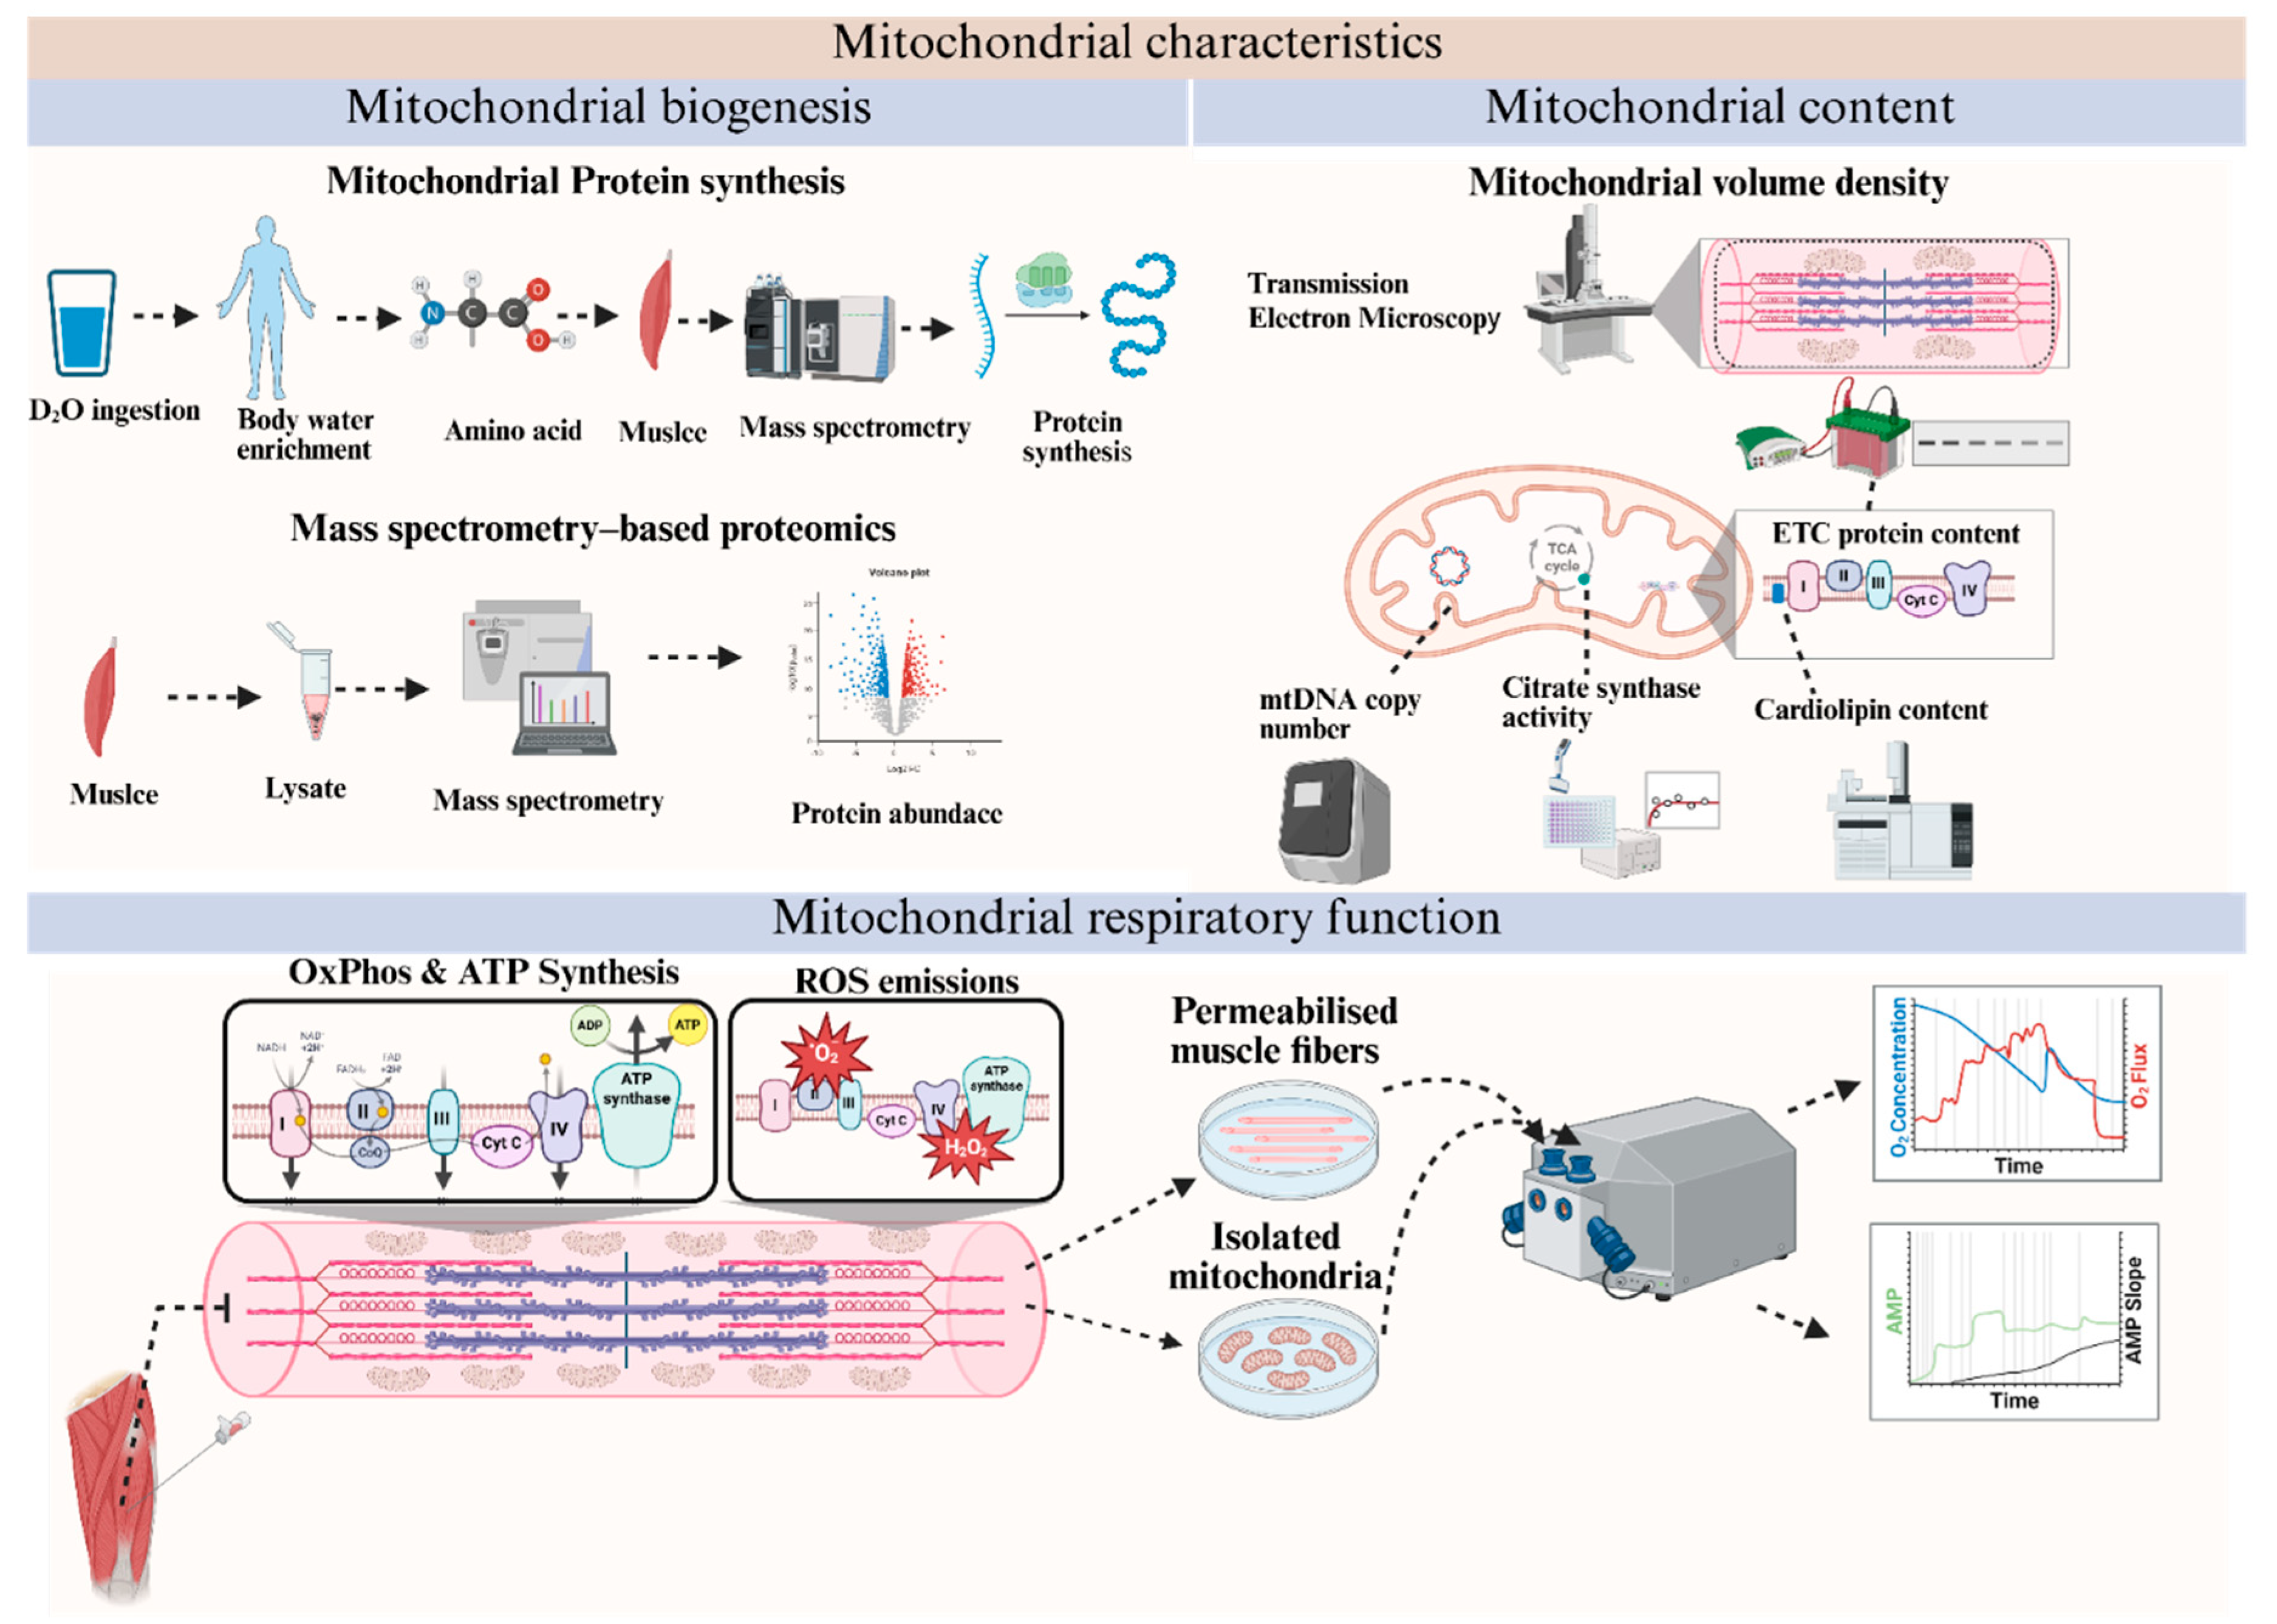
Mitochondrial characteristics include cell-dependent phenotypes, features, activities, functions, and behaviours. There is a broad spectrum of potential mitochondrial measures used to assess cell-dependent phenotypes (e.g., mitochondrial mass or content), features (quantifiable structural attributes, such as cristae density and morphology), activities (enzyme activities of single proteins, e.g., citrate synthase, and multiprotein complexes, e.g., isolated electron transport chain complex activities), functions (conversion of macronutrients or their derivatives to ATP via oxidative phosphorylation), and behaviours (whole-organelle dynamics and inter-organelle interactions) [42,45]. Given that relatively few of these mitochondrial characteristics have been investigated in the context of sleep loss, this review will focus on the most studied aspects - mitochondrial biogenesis, mitochondrial content, and mitochondrial respiratory function (as described Figure 4, and Supplementary Table S6) and how they have been implicated in the control of glucose tolerance.
3.2. Mitochondrial Biogenesis and Glucose Tolerance
Measuring the rate of mitochondrial protein synthesis is considered the best method for assessing mitochondrial biogenesis – the process of generating new mitochondrial components through increased translation of mitochondrial proteins [46]. There is evidence suggesting that individuals with glucose intolerance exhibit reduced rates of mitochondrial protein synthesis in their skeletal muscle compared with those without glucose intolerance [47]. For example, one study reported that mitochondrial protein synthesis is lower in individuals with obesity and insulin resistance than in lean individuals [47]. Another study reported that diabetic rats exhibited a 50 to 60% reduction in skeletal muscle mitochondrial protein synthesis in vitro compared with non-diabetic rats, but insulin treatment restored their mitochondrial protein synthesis rate [48]. These studies support the hypothesis that changes in glucose tolerance are linked with changes in mitochondrial biogenesis.
To further understand the relationship between glucose intolerance and mitochondrial biogenesis, studies often examine changes in the expression of genes and proteins regulating mitochondrial biogenesis, particularly in individuals with impaired glucose tolerance or T2D. Mitochondrial biogenesis is tightly regulated and relies on transcription factors, such as peroxisome proliferator-activated receptor-gamma coactivator 1-alpha (PGC-1α). Studies have shown reduced mRNA levels of these crucial regulatory proteins in individuals with T2D or insulin resistance [49,50]. However, it is important to note that alterations in mRNA expression do not necessarily lead to corresponding changes in the encoded proteins [51]. Nonetheless, a human study comparing insulin-sensitive and insulin-resistant individuals found that PGC-1α protein abundance was reduced in the brown adipose tissue of insulin-resistant subjects [52]. Collectively, this evidence suggests that the development of glucose intolerance and diabetes can be linked to a reduced abundance of key transcriptional factors, which may compromise mitochondrial biogenesis.
3.3. Mitochondrial Content and Glucose Tolerance
Mitochondrial content is governed by the balance between mitochondrial biogenesis and breakdown (termed mitophagy) [53]. Transmission electron microscopy (TEM) is considered the ‘gold standard’ for measuring mitochondrial content, but indirect methods, such as citrate synthase (CS) activity, also strongly correlate with TEM-derived measurements [54]. Other indirect measures, such as mitochondrial DNA copy number, are considered to have low validity [54].
Using a combination of these methods, several studies have reported lower mitochondrial content in individuals with T2D compared with those without T2D. For example, one study found that participants with T2D showed a 35% decrease in skeletal muscle mitochondrial content, as determined by either TEM or CS activity, when compared with a lean healthy group [55]. These conclusions have been corroborated by multiple subsequent studies, which have shown that individuals with diabetes often exhibit a decrease in skeletal muscle mitochondrial content (as determined by TEM) compared with the control group [56,57]. Collectively, these studies suggest that T2D is often associated with reduced skeletal muscle mitochondrial content.
3.4. Mitochondrial Respiratory Function and Glucose Tolerance
In addition to mitochondrial “quantity” or content, the “quality” or function of mitochondria is also important, especially as it can vary independently from mitochondrial content [58]. An essential function of mitochondria is oxidative phosphorylation - the critical respiratory process responsible for generating ATP to meet cellular energy demands. A respirometer is the most widely used direct method for measuring mitochondrial respiration, while indirect measurements, such as ³¹P magnetic resonance spectroscopy (MRS), demonstrate a strong correlation with respirometer measurements [59]. Evidence suggests that individuals with T2D exhibit a reduced maximal ADP-stimulated respiration in their skeletal muscle compared to non-diabetic individuals [60,61]. Additional studies using various measurements, such as the phosphocreatine (PCr) recovery rate, have consistently shown that individuals with T2D exhibit reduced mitochondrial respiratory function compared with a lean group [62].
In addition to their role in oxidative phosphorylation, mitochondria are central to fatty acid oxidation (a pathway essential for energy production), and impaired fatty acid oxidation is strongly associated with insulin resistance [44]. In this pathway, fatty acids are converted in the cytosol to form fatty acyl-CoA, transported into the mitochondria via the carnitine shuttle, and then undergo β-oxidation in the mitochondrial matrix. When fatty acids are transported into mitochondria, elevated rates of incomplete fatty acid oxidation, marked by the accumulation of acylcarnitines, are believed to contribute to the development of insulin resistance [44]. These elevated rates of incomplete fatty acid oxidation may disrupt insulin signalling, glucose uptake, and potentially mitochondrial respiration [63,64]. Evidence suggests that individuals with poorly controlled T2D, characterised by higher fasting glucose levels, and impaired glucose handling during glucose tolerance testing, exhibit elevated levels of incomplete fatty acid oxidation and the accumulation of acylcarnitines within the mitochondrial matrix [65]. This may be caused, at least in part, by increased levels of beta-hydroxyacyl-CoA dehydrogenase (β-HAD) content and activity without a proportional up-regulation of the tricarboxylic acid cycle, leading to the accumulation of acylcarnitines [65]. Collectively, this evidence links impaired FAO to the development of glucose intolerance and T2D.
3.5. Skeletal Muscle Mitochondrial Characteristics and Glucose Tolerance: Inconsistent Evidence and Confounding Factors
Not all studies support a direct or consistent relationship between skeletal muscle mitochondrial characteristics and glucose tolerance or T2D. It is important to note that alterations in glucose tolerance and the development of T2D are likely underpinned by multiple mechanistic factors (e.g., genetic and environmental factors), rather than altered mitochondrial characteristics alone [66]. This is reflected in studies that report no association between mitochondrial characteristics and glucose tolerance. For example, mitochondrial and sarcoplasmic protein synthesis rates (often used as an indicator of mitochondrial protein synthesis) have been reported to be similar between lean individuals and people with T2D [67]. Several studies have also found that individuals with T2D and those with obesity have no significant differences in mitochondrial content, when assessed using TEM, mtDNA copy number, or CS activity [56,60,68]. More recent evidence supports that skeletal muscle mitochondrial content may not differ between individuals with obesity-related insulin resistance and those with T2D, despite differences in glucose regulation [69]. There are also inconsistent findings regarding the relationship between mitochondrial respiratory function and glucose tolerance. Although some studies report reduced oxidative capacity in people with T2D, these differences are often attenuated or no longer evident when respiration is normalised to mitochondrial content, suggesting that apparent functional impairments may partly reflect differences in mitochondrial abundance rather than intrinsic mitochondrial defects [70]. Other studies have reported no clear differences in mitochondrial respiration between individuals with type 2 diabetes, impaired glucose tolerance, obesity-related insulin resistance, and healthy controls when participants are appropriately matched for age, body mass, BMI, or cardiorespiratory [69,71]. The inconsistencies in these findings may also be partly explained by methodological differences, as studies using ³¹P-MRS and high-resolution respirometry assess distinct aspects of mitochondrial function and therefore may produce different findings [72].
The studies described in the previous section highlight a potential relationship between mitochondrial characteristics and glucose tolerance. However, these findings should be interpreted with caution because physical activity independently influences both mitochondrial characteristics and glucose metabolism [73,74]. Changes in physical activity or differences in physical activity between cohorts may therefore confound observed associations between mitochondrial content, respiration, and glucose tolerance, adding a further layer of complexity to the relationship [44,75]. Indeed, exercise is a potent stimulus for increasing mitochondrial content, mitochondrial respiratory function, and glucose tolerance [76]. Conversely, reductions in physical activity can negatively affect these same outcomes. For example, bed-rest studies (ranging from 4 to 55 days in duration) report reductions in mitochondrial respiration, mitochondrial content, and insulin sensitivity, alongside increased lipid accumulation near mitochondria [75,77,78]. Although these parallel changes are consistent with the hypothesis that impaired mitochondrial characteristics may contribute to insulin resistance, they do not establish causality. Thus, reduced physical activity may simultaneously impair mitochondrial characteristics and insulin sensitivity, and should be considered when interpreting the relationship between mitochondrial characteristics and glucose tolerance.
3.6. Summary of Findings Between Mitochondria and Glucose Tolerance
In summary, there is significant evidence of an association between compromised mitochondrial characteristics in skeletal muscle and the development of glucose intolerance and diabetes, although this link is not always consistent [69,72]. Importantly, variability in the methods used to assess mitochondrial characteristics, including differences in markers of content, function, and tissue specificity, likely contributes to these inconsistent findings, as does the potential confounding influence of physical activity patterns. While further research is needed to establish a direct, causal link between altered mitochondrial characteristics and impaired glucose tolerance, a clear relationship exists between these two important factors.
4. Sleep Loss, Mitochondrial Characteristics, and Glucose Tolerance
Given the evidence linking skeletal muscle mitochondrial characteristics to changes in glucose tolerance, it is plausible that altered mitochondrial characteristics may be a mechanism by which sleep loss impairs glucose tolerance. In support of this, Cedernaes et al. reported that one night of total sleep deprivation downregulated gene expression in human skeletal muscle in pathways related to oxidative phosphorylation, alongside increased fasting plasma insulin levels, higher postprandial glucose concentrations, and lower insulin sensitivity [23]. Despite this, the abundance of mitochondrial respiratory complex subunits (assessed via western blot) remained unchanged, suggesting a complex molecular response following a night of sleep deprivation [23]. Other human studies also suggest that sleep deprivation can alter mitochondrial characteristics, with 120 h of sleep deprivation reducing CS, malate dehydrogenase, and glycerol-3-phosphate dehydrogenase activities [27], and 24 h of total sleep deprivation increasing several plasma acylcarnitines - indicative of disrupted mitochondrial fatty acid metabolism [79]. Additional evidence from animal studies similarly reports impaired mitochondrial characteristics following sleep deprivation, including reduced brain mitochondrial respiratory enzyme activities in sleep-deprived rodents [80,81] and increased reactive oxygen species (ROS) accumulation, along with reduced mitochondrial respiration, in Drosophila models [82]. Collectively, these studies suggest that total sleep deprivation can adversely affect mitochondrial characteristics, although further evidence from human participants would strengthen this link (Supplementary Table S7).
There have also been several studies that link sleep restriction to altered mitochondrial characteristics and changes in glucose tolerance. For example, one night of severe sleep restriction (4 h TIB per night) was associated with elevated plasma acylcarnitines (indicative of reduced mitochondrial fatty acid oxidation), alongside increased peripheral insulin resistance (assessed via an HIEG clamp) [83]. In addition, another study reported that five nights of sleep restriction (4 h TIB) led to reductions in glucose tolerance, concomitant reductions in skeletal muscle mitochondrial respiration, and lower sarcoplasmic protein synthesis (an indirect marker of mitochondrial protein synthesis), despite no significant change in citrate synthase activity [18]. This same study also demonstrated that performing three sessions of high-intensity interval exercise during the sleep restriction period prevented the declines in sarcoplasmic protein synthesis, mitochondrial respiratory function, and glucose tolerance; these results further support the potential link between changes in mitochondrial characteristics and glucose tolerance with sleep loss. Another study reported that mtDNA copy number was decreased in a monozygotic twin who slept < 7 h per night for 14 days, compared with their monozygotic twin who slept 7-9 h per night [84]. Animal studies further show that chronic sleep restriction (< 4 h for 2 months) reduces mitochondrial cristae density, cytochrome c oxidase concentration, ATP levels, and mitochondrial membrane potential [85]. These findings suggest that not only total sleep deprivation but also sleep restriction can have detrimental effects on some mitochondrial characteristics and that these changes may be linked to the development of impaired glucose tolerance (Supplementary Table S8).
4.1. Summary and Future Directions: Sleep Loss, Mitochondrial Characteristics, and Glucose Tolerance
Although existing evidence links sleep loss to altered mitochondrial characteristics, the extent to which these changes contribute to impaired glucose tolerance remains unclear and appears to be context dependent. Future research should therefore use more direct and comprehensive assessments of skeletal muscle mitochondrial characteristics, including mitochondrial gene and protein expression (utilising ‘omics approaches), content, structure, respiration, and protein synthesis, rather than relying on single surrogate markers such as citrate synthase activity or mtDNA copy number alone. This is particularly important because existing studies suggest that different mitochondrial outcomes may respond differently to sleep loss, with some studies reporting changes in respiratory function or mitochondrial-related pathways despite no change in CS activity [18,23,27]. Future studies should also determine whether the effects of sleep loss depend on the type, severity, and duration of the sleep intervention, as acute total sleep deprivation and repeated sleep restriction may produce distinct mitochondrial and metabolic responses.
Finally, studies that assess mitochondrial characteristics and glucose tolerance are needed to clarify whether altered skeletal muscle mitochondrial characteristics directly contribute to inadequate sleep-induced impairments in glucose regulation, or whether mitochondrial changes and glucose intolerance occur in parallel, but distinctly, with inadequate sleep. For example, inadequate sleep may influence both mitochondrial characteristics and glucose regulation separately through shared upstream mechanisms, such as increased cortisol exposure, circadian disruption, altered sympathetic activity, or changes in appetite-regulating hormones. Therefore, mitochondrial changes should be interpreted as being associated with, rather than definitively driving, impaired glucose tolerance unless causality is directly tested. This is particularly important given that the limited human evidence available suggests a potential mechanistic link between sleep restriction, impaired skeletal muscle mitochondrial respiration, and reduced glucose tolerance, but direct evidence remains insufficient, especially for more commonly experienced forms of inadequate sleep.
5. Recovery Sleep
Given the many negative effects of inadequate sleep, it is crucial to develop strategies to try and mitigate these consequences. One widely used approach is to increase the duration of sleep following a period of sleep loss. For example, population-based studies indicate that 50% to 60% of adults extend their sleep duration on weekends in an attempt to compensate for inadequate sleep accumulated during the work week [86,87]. However, there is still only limited research that has investigated the time course of recovery in glucose tolerance following periods of inadequate sleep, and how long the consequences of inadequate sleep persist is currently somewhat ambiguous.
Recovery sleep has been shown to improve glucose regulation following prior sleep restriction, with two nights of recovery sleep (12 h on night one and 10 h TIB on night two) restoring insulin sensitivity after four nights of 4.5 h TIB [88]. Furthermore, another study demonstrated that five nights of 9 h TIB restored glucose tolerance after three nights of 5 h TIB [89]. Weekend recovery sleep (10 h TIB) has also been associated with improved glucose tolerance in individuals with habitual short sleep (< 6.5 h total sleep time) [90]. However, other studies found that insulin sensitivity did not return to baseline after either two nights (10 h TIB) or five nights (9 h TIB) of recovery sleep following five nights of sleep restriction (5 h TIB per night) [89,91], suggesting that periods of recovery sleep are not always adequate to restore glucose tolerance.
Differences in study findings may reflect both the methods used to assess insulin sensitivity (e.g., IVGTT vs OGTT) [89,91], the duration of the recovery sleep, and the severity of the prior sleep loss. Overall, the available evidence suggests that recovery sleep should be conceptualised as a dose-dependent and context-dependent intervention, rather than as a uniform restorative condition. Studies allowing longer recovery opportunities, such as 12 h and 10 h TIB after four nights of 4.5 h TIB, reported restoration of insulin sensitivity [88], whereas studies providing more modest recovery opportunities, such as < 9 h or < 8 h TIB, failed to show similar improvements after five nights of 5 h TIB or four nights of 4 h TIB [89,92]. However, because incomplete recovery has also been reported after relatively long recovery sleep opportunities, the effects of recovery sleep may depend not only on the absolute amount of sleep provided, but also on the preceding sleep debt and assessment method used to assess the changes in glucose tolerance. Collectively, these findings suggest that recovery sleep may need to exceed the standard recommended range of 7 – 9 h to fully reverse the metabolic consequences of prior sleep restriction (Supplementary Table S9). Further research is therefore needed to determine the duration of recovery sleep required to fully restore glucose tolerance and how different glucose tolerance assessment methods influence the interpretation of these findings.
Most existing studies assess metabolic outcomes only before and after the recovery period at single timepoints; therefore, little is known about the transient nature of the recovery itself. Repeated or continuous metabolic assessments (such as CGM) may help clarify how glucose tolerance and insulin sensitivity recover following inadequate sleep. In addition, no study to our knowledge has examined whether recovery sleep also restores mitochondrial characteristics, or whether such changes occur in parallel to improvements in glucose tolerance. Demonstrating concurrent recovery of mitochondrial characteristics and glucose regulation would strengthen the hypothesis that sleep loss–induced alterations in mitochondria contribute to impaired glucose tolerance. Such an approach may also help to disentangle whether mitochondrial changes following sleep loss directly contribute to alterations in glucose tolerance, or whether both outcomes reflect parallel but independent responses to sleep restriction and subsequent recovery sleep.
6. Inadequate Sleep and Allostasis
Even in the absence of recovery sleep, some components of human physiology may be able to adapt (at least temporarily) to persistent inadequate sleep. This effect is known as allostasis [93,94], which has been defined as a flexible response that anticipates an organism's future needs and prepares it for upcoming challenges in order to increase its chances of survival [93]. When inadequate sleep persists, repeated activation of these adaptive physiological responses may contribute to an increased allostatic load, defined as the cumulative physiological burden associated with chronic stress exposure [95]. In the context of recurrent sleep loss, the accumulation of allostatic load may detrimentally impact several physiological systems including the neuroendocrine, metabolic, cardiovascular, and immune systems [96]. If sustained over time, these adaptive responses may become maladaptive and result in allostatic overload, characterised by dysregulation of physiological systems and increased risk of metabolic disease, such as T2D [96].
There is some evidence of adaptive allostasis in response to sleep restriction, as reflected in changes in glucose tolerance. Robertson et al. compared habitual sleep (~ 8 h TST per night) with sleep restriction (habitual sleep minus 1.5 h per night) over three weeks, with participants living in their normal home environment, and found that insulin sensitivity was reduced during the first week of sleep restriction. However, there was no longer a difference in insulin sensitivity between groups after two and three weeks of continued sleep restriction (B) [97]. This pattern may suggest an adaptive allostatic response during prolonged sleep restriction, although it remains unclear whether similar adaptations occur during long-term habitual inadequate sleep and how such responses reconcile with epidemiological evidence linking long-term inadequate sleep with increased risk of T2D and other adverse health outcomes.
Figure 5.
Sleep allostasis, and allostatic overload: linking healthy sleep habits to stress and disease. A. Data demonstrating a potential relationship between inadequate sleep, glucose tolerance, and allostasis adapted from [97]. Changes in insulin sensitivity, assessed by the hyperinsulinemic-euglycemic clamp, are shown relative to baseline in the habitual sleep group (black circles) and sleep restriction group (habitual sleep minus 1.5 h/night; yellow circles). # indicates a significant between-group difference (p < 0.05). B. Represents skeletal muscle gene expression changes in six MitoCarta3.0-annotated mitochondrial genes following one night of total sleep deprivation (TSD) and five nights of sleep restriction (SR). Changes are expressed as log₂ fold change relative to the corresponding control condition, with blue indicating downregulation, white indicating little or no change, and red indicating upregulation. The two sleep-loss conditions produced distinct gene-specific response patterns: PDK4 and CPT1A were upregulated, whereas MPST, ATAD3A, MACROD1, and ACSL6 were downregulated to varying degrees. The generally larger and statistically significant changes observed after TSD (indicated by*), compared with the more modest responses following repeated SR (no genes were significantly differently compared to control for the SR dataset) may reflect differences in the magnitude and temporal pattern of the transcriptional allostatic response to acute versus recurrent sleep loss. Figure based on data obtained from Lin et al [98] and Cedernaes et al. [23].
Figure 5.
Sleep allostasis, and allostatic overload: linking healthy sleep habits to stress and disease. A. Data demonstrating a potential relationship between inadequate sleep, glucose tolerance, and allostasis adapted from [97]. Changes in insulin sensitivity, assessed by the hyperinsulinemic-euglycemic clamp, are shown relative to baseline in the habitual sleep group (black circles) and sleep restriction group (habitual sleep minus 1.5 h/night; yellow circles). # indicates a significant between-group difference (p < 0.05). B. Represents skeletal muscle gene expression changes in six MitoCarta3.0-annotated mitochondrial genes following one night of total sleep deprivation (TSD) and five nights of sleep restriction (SR). Changes are expressed as log₂ fold change relative to the corresponding control condition, with blue indicating downregulation, white indicating little or no change, and red indicating upregulation. The two sleep-loss conditions produced distinct gene-specific response patterns: PDK4 and CPT1A were upregulated, whereas MPST, ATAD3A, MACROD1, and ACSL6 were downregulated to varying degrees. The generally larger and statistically significant changes observed after TSD (indicated by*), compared with the more modest responses following repeated SR (no genes were significantly differently compared to control for the SR dataset) may reflect differences in the magnitude and temporal pattern of the transcriptional allostatic response to acute versus recurrent sleep loss. Figure based on data obtained from Lin et al [98] and Cedernaes et al. [23].
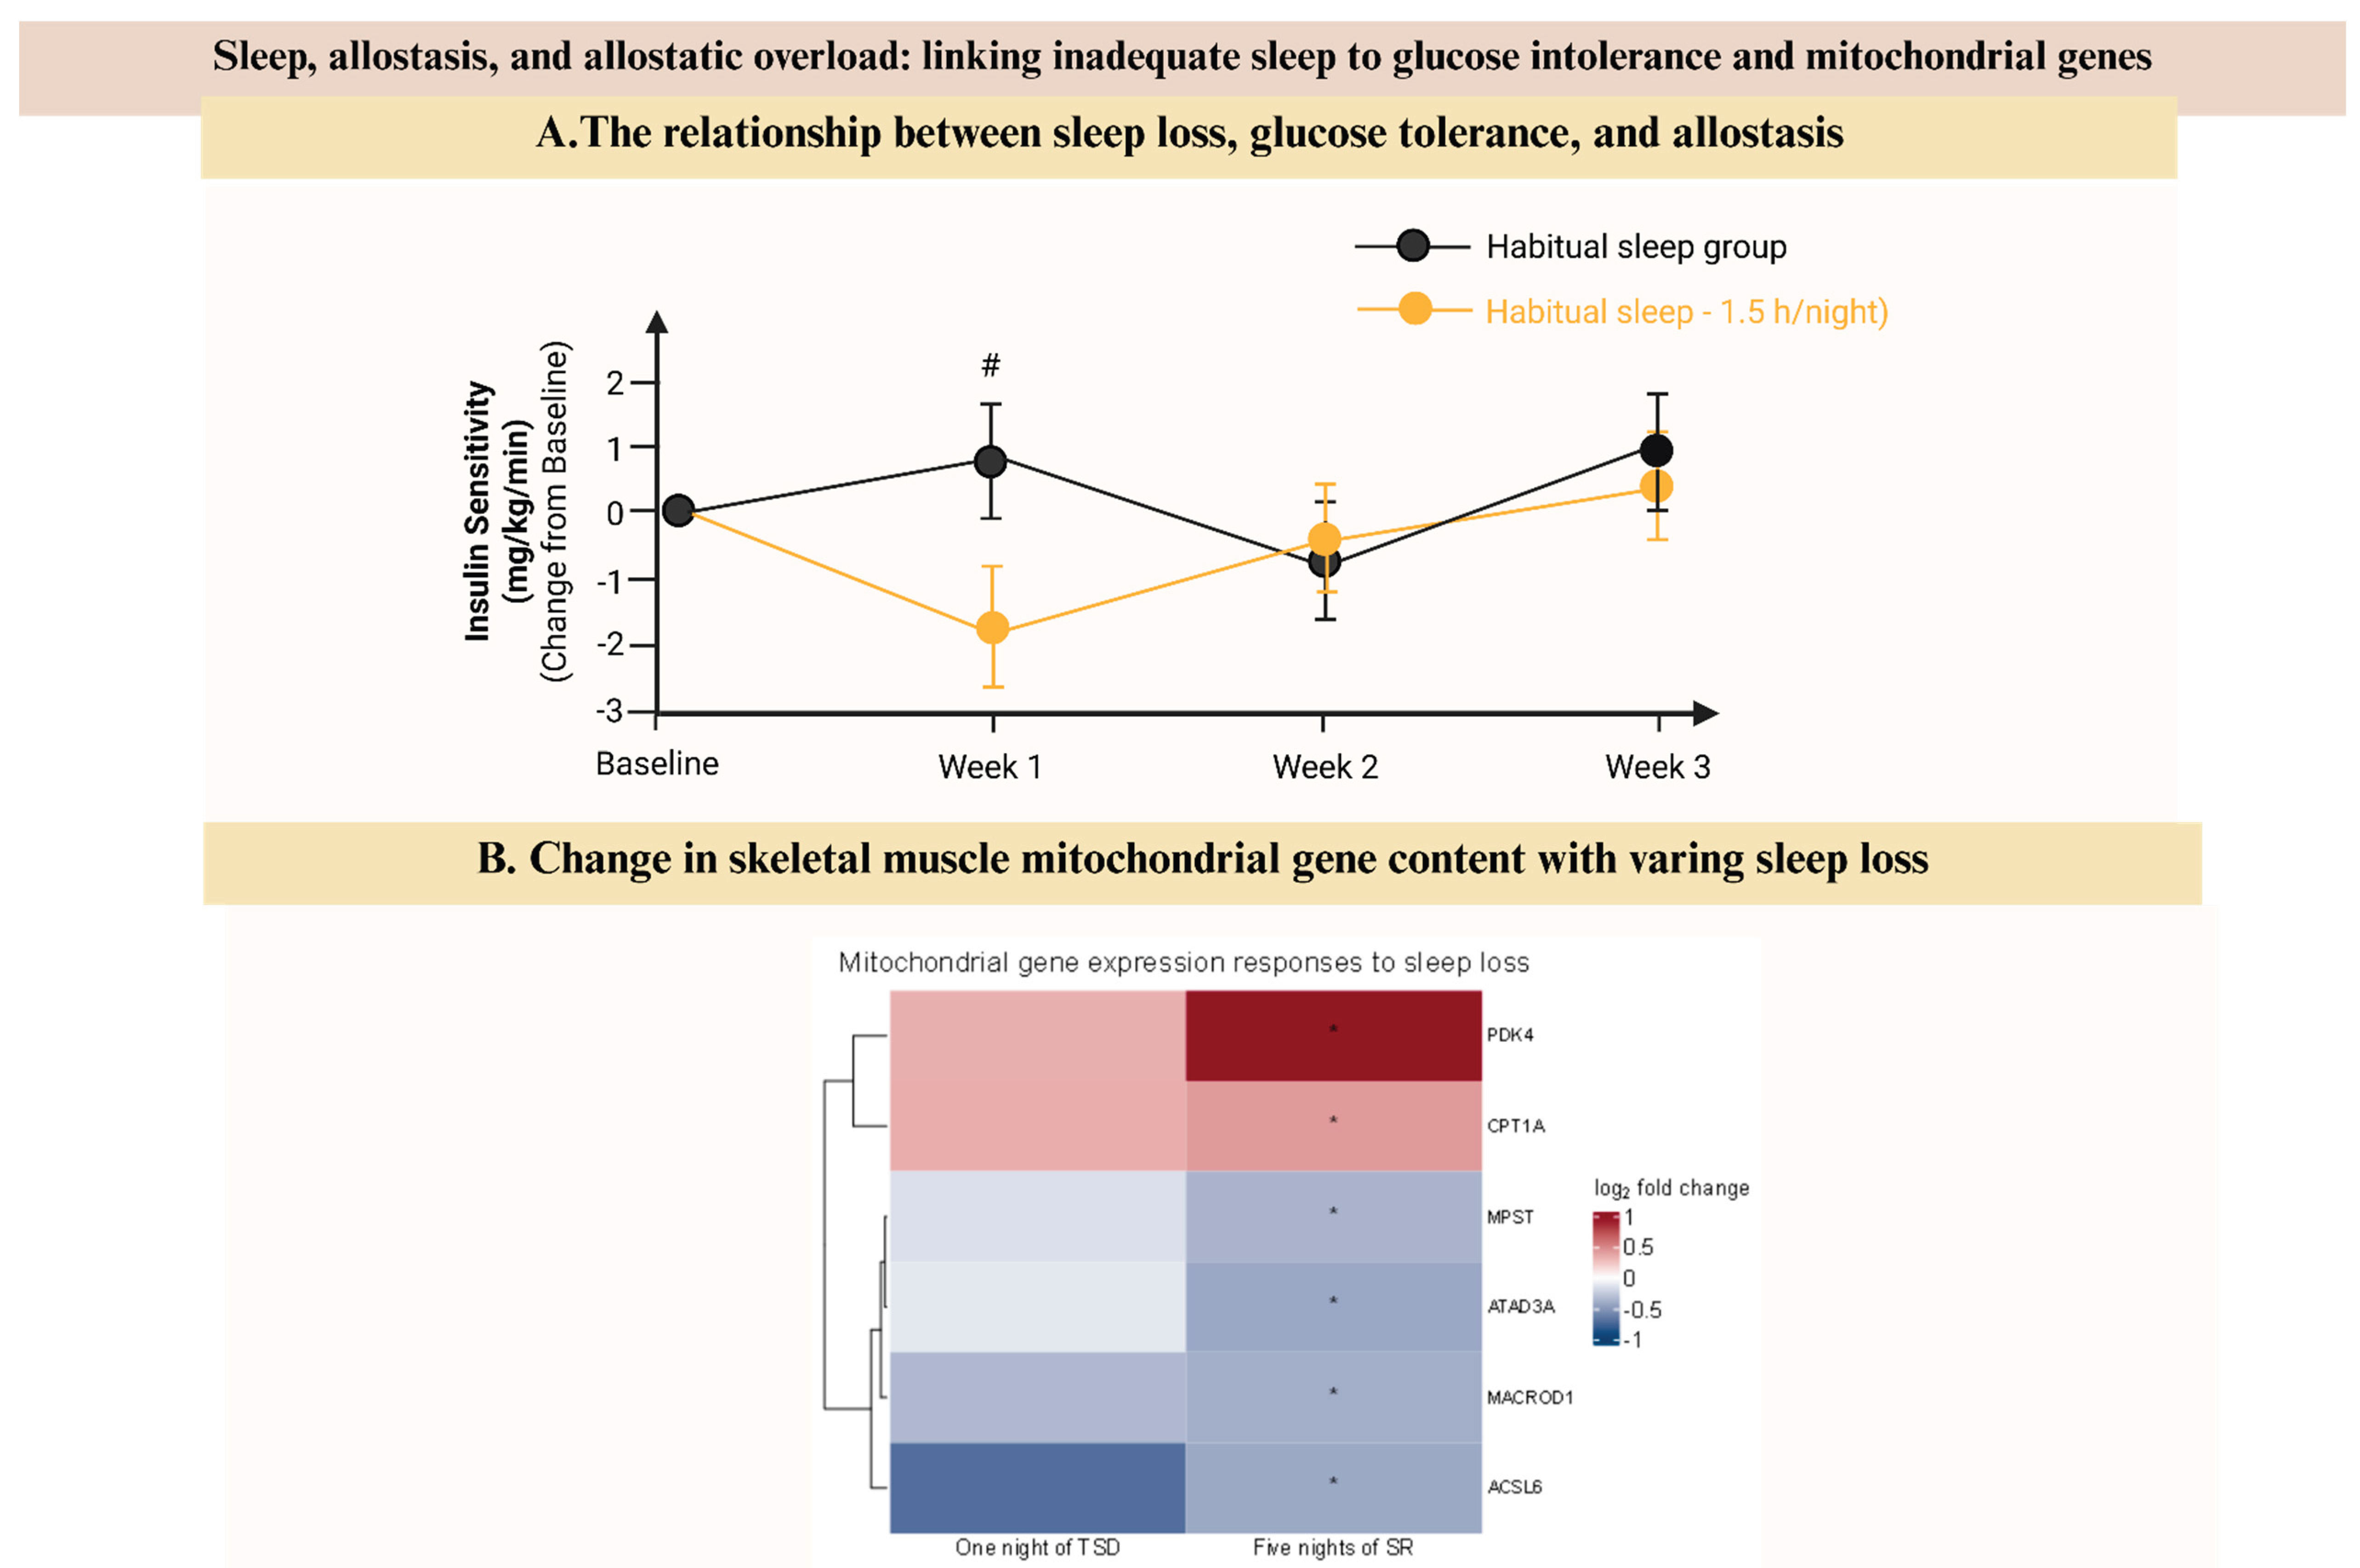
Additional evidence of adaptive allostasis may be observed in skeletal muscle responses to sleep loss. One study reported that a night of total sleep deprivation altered the expression of 117 genes in human skeletal muscle, including the downregulation of genes associated with oxidative phosphorylation [23], whereas a separate study found no significant changes in the skeletal muscle transcriptome following five consecutive nights of severe sleep restriction (4 h TIB per night) (C) [98]. These findings raise the possibility that molecular responses, including changes in mitochondrial-related gene expression, may be transient and adapt to recurrent sleep loss. This interpretation, however, is limited because the effect of a single night of severe sleep restriction on skeletal muscle transcripts remains unknown, making it difficult to distinguish the effects of the intervention duration and severity of the sleep loss protocol. Overall, these preliminary observations suggest that initial changes in glucose tolerance and mitochondrial gene expression may subsequently adapt with continued periods of inadequate sleep. However, further research is needed to specifically address this initial hypothesis and determine whether allostatic responses should be considered while interpreting the time course of changes of glucose tolerance and mitochondrial characteristics in response to sleep intervention.
7. Conclusions
This review highlights a potential link between inadequate sleep, altered mitochondrial characteristics, and impaired glucose tolerance. Although severe sleep loss appears to negatively affect mitochondrial characteristics and glucose metabolism, evidence for an effect of moderate sleep loss remains limited. It is therefore unclear whether moderate sleep restriction reduces key mitochondrial characteristics, such as respiration and content, whether these changes contribute directly to impaired glucose tolerance, and whether both can be reversed by recovery sleep. This review also considers the possibility that persistent sleep loss may trigger compensatory physiological responses consistent with allostasis; however, the point at which these responses become maladaptive and contribute to allostatic load remains unclear. Addressing these gaps may improve understanding of how sleep loss contributes to the development of glucose intolerance and help inform targeted strategies, such as exercise and optimised recovery sleep, to reduce the risk of T2D.
Practice Points
• Inadequate sleep is associated with impaired glucose tolerance and reduced insulin sensitivity.
• Skeletal muscle mitochondria may be affected by inadequate sleep, and there is evidence linking altered mitochondrial characteristics with impaired glucose tolerance. However, current evidence remains insufficient to establish whether these mitochondrial changes directly cause sleep loss-induced impairments in glucose regulation.
• Recovery sleep interventions provide an opportunity to determine whether sleep loss-induced changes in glucose regulation and skeletal muscle mitochondrial characteristics are reversible. This requires repeated assessment across the sleep-loss and recovery period to determine whether these outcomes return toward baseline or persist after recovery sleep.
• Allostasis may help explain why some physiological responses to repeated inadequate sleep appear to adapt over time, even when metabolic stress remains present
Research Agenda
• Future studies should determine whether inadequate sleep, particularly sleep interventions representative of modern sleep habits, induces parallel changes in skeletal muscle mitochondrial characteristics and glucose tolerance under tightly controlled laboratory conditions
• Further research is needed to clarify whether altered mitochondrial characteristics directly contribute to impaired glucose tolerance following inadequate sleep, or whether both outcomes reflect independent responses to sleep restriction.
• Recovery sleep studies are needed to determine whether glucose tolerance and skeletal muscle mitochondrial characteristics recover together, recover at different rates, or remain impaired after sleep restriction, which may help clarify whether altered mitochondrial characteristics contribute mechanistically to sleep restriction-induced impairments in glucose regulation.
• Studies should examine whether repeated exposure to inadequate sleep produces allostatic adaptations in skeletal muscle mitochondrial characteristics, glucose regulation, or related metabolic pathways.
• Future studies should consider multiple levels of mitochondrial regulation and distinct mitochondrial characteristics, including mitochondrial respiration, mitochondrial content, gene expression, protein-level adaptations, and glucose metabolism, to better understand the metabolic consequences of inadequate sleep.
Supplementary Materials
The following supporting information can be downloaded at the website of this paper posted on Preprints.org.
Funding
This work was supported by funding from the Australian Government National Health and Medical Research Council (NHMRC) Grant (GNT2013427) to DB and funding from the Victorian Medical Research Acceleration Fund to NS. The authors gratefully acknowledge the financial support provided to HL by the China Scholarship Council (CSC).
Acknowledgments
The authors also thank Dr Jujiao Kuang for her valuable feedback on the manuscript and Dr Matthew J. C. Lee for his assistance with figure preparation.
Abbreviations
| BMI | body mass index |
| CS | citrate synthase activity |
| ETC | electron transport chain |
| FAO | fatty acid oxidation |
| HbA1c | haemoglobin A1C |
| HIEC | hyperinsulinaemic-euglycaemic clamp |
| HOMA-IR | homeostasis model assessment of insulin resistance |
| iAUC | incremental area under the curve |
| IFG | impaired fasting glucose tolerance |
| IGT | impaired glucose tolerance |
| IVGTT | intravenous glucose tolerance test |
| mRNA | messenger ribonucleic acid |
| mtDNA | mitochondria DNA |
| OGTT | oral glucose tolerance test |
| OxPhos | oxidative phosphorylation |
| PCr | phosphocreatine |
| PGC-1α | peroxisome proliferator-activated receptor-γ coactivator-1α |
| RNA-seq | RNA sequencing |
| ROS | reactive oxygen species |
| SarcPS | sarcoplasmic protein synthesis |
| T2D | Type 2 diabetes |
| TCA | tricarboxylic acid cycle |
| TEM | transmission electron microscopy |
| TIB | time in bed |
| TSD | total sleep deprivation |
| TST | total sleep time |
References
- Siegel, J.M. Do all animals sleep? . Trends Neurosci. 2008, 31(4), 208–13. [Google Scholar] [CrossRef] [PubMed]
- Medic, G.; Wille, M.; Hemels, M.E. Short- and long-term health consequences of sleep disruption . Nat. Sci. Sleep 2017, 9, 151–161. [Google Scholar] [CrossRef] [PubMed]
- Hirshkowitz, M.; et al. National Sleep Foundation's sleep time duration recommendations: methodology and results summary . Sleep Health 2015, 1(1), 40–43. [Google Scholar] [CrossRef] [PubMed]
- Grandner, M.A.; et al. Problems associated with short sleep: bridging the gap between laboratory and epidemiological studies . Sleep Med. Rev. 2010, 14(4), 239–47. [Google Scholar] [CrossRef] [PubMed]
- Chattu, V.K.; et al. The Global Problem of Insufficient Sleep and Its Serious Public Health Implications . In Healthcare (Basel); 2018; 1, p. 7. [Google Scholar]
- Yoon, J.E.; et al. Longitudinal Trends in Sleep and Related Factors Among South Korean Adults From 2009 to 2018 . J. Clin. Neurol. 2023, 19(4), 392–401. [Google Scholar] [CrossRef] [PubMed]
- Zhang, W.; et al. Self-reported sleep status and influencing factors: a web-based national cross-sectional survey in China . Ann. Med. 2023, 55(2), 2287706. [Google Scholar] [CrossRef] [PubMed]
- Morgan, I.; et al. Sleep disturbances and quality of life in Sub-Saharan African migraineurs . J. Headache Pain 2015, 16, 18. [Google Scholar] [CrossRef] [PubMed]
- Ford, Earl S.; et al. Trends in Self-Reported Sleep Duration among US Adults from 1985 to 2012 . Sleep 2015, 38(5), 829–832. [Google Scholar] [CrossRef] [PubMed]
- Gupta, C.C.; et al. The Discrepancy between Knowledge of Sleep Recommendations and the Actual Sleep Behaviour of Australian Adults . Behav. Sleep Med. 2021, 19(6), 828–839. [Google Scholar] [CrossRef] [PubMed]
- Banks, S.; Dinges, D.F. Behavioral and physiological consequences of sleep restriction . J. Clin. Sleep Med. 2007, 3(5), 519–28. [Google Scholar] [CrossRef] [PubMed]
- Schmid, S.M.; Hallschmid, M.; Schultes, B. The metabolic burden of sleep loss . Lancet Diabetes Endocrinol. 2015, 3(1), 52–62. [Google Scholar] [CrossRef] [PubMed]
- Cappuccio, F.P.; et al. Sleep duration and all-cause mortality: a systematic review and meta-analysis of prospective studies . Sleep 2010, 33(5), 585–92. [Google Scholar] [CrossRef] [PubMed]
- Shan, Z.; et al. Sleep duration and risk of type 2 diabetes: a meta-analysis of prospective studies . Diabetes Care 2015, 38(3), 529–37. [Google Scholar] [CrossRef] [PubMed]
- Saeedi, P.; et al. Global and regional diabetes prevalence estimates for 2019 and projections for 2030 and 2045: Results from the International Diabetes Federation Diabetes Atlas, 9(th) edition . Diabetes Res. Clin. Pract. 2019, 157, 107843. [Google Scholar] [CrossRef] [PubMed]
- Spiegel, K.; Leproult, R.; Van Cauter, E. Impact of sleep debt on metabolic and endocrine function . The Lancet 1999, 354(9188), 1435–1439. [Google Scholar] [CrossRef]
- Wilms, B.; et al. Timing Modulates the Effect of Sleep Loss on Glucose Homeostasis . J. Clin. Endocrinol. Metab. 2019, 104(7), 2801–2808. [Google Scholar] [CrossRef] [PubMed]
- Saner, N.J.; et al. Exercise mitigates sleep-loss-induced changes in glucose tolerance, mitochondrial function, sarcoplasmic protein synthesis, and diurnal rhythms . Mol. Metab. 2021, 43, 101110. [Google Scholar] [CrossRef] [PubMed]
- Wang, Q.; et al. Insulin resistance and systemic metabolic changes in oral glucose tolerance test in 5340 individuals: an interventional study . BMC Med. 2019, 17(1), 217. [Google Scholar] [CrossRef] [PubMed]
- Gastaldelli, A. Measuring and estimating insulin resistance in clinical and research settings . Obesity 2022, 30(8), 1549–1563. [Google Scholar] [CrossRef] [PubMed]
- Sorensen, L.P.; et al. Basal and Insulin Mediated VLDL-Triglyceride Kinetics in Type 2 Diabetic Men . Diabetes 2011, 60(1), 88–96. [Google Scholar] [PubMed]
- Patel, S.R.; et al. Correlates of long sleep duration . Sleep 2006, 29(7), 881–9. [Google Scholar] [CrossRef] [PubMed]
- Cedernaes, J.; et al. Acute sleep loss results in tissue-specific alterations in genome-wide DNA methylation state and metabolic fuel utilization in humans . Sci. Adv. 2018, 4(8), eaar8590. [Google Scholar] [CrossRef] [PubMed]
- Gonzalez-Ortiz, M.; et al. Effect of sleep deprivation on insulin sensitivity and cortisol concentration in healthy subjects . Diabetes Nutr. Metab. 2000, 13(2), 80–3. [Google Scholar] [PubMed]
- de Souza, J.F.T.; et al. High-Intensity Interval Training Attenuates Insulin Resistance Induced by Sleep Deprivation in Healthy Males . Front Physiol. 2017, 8, 992. [Google Scholar] [CrossRef] [PubMed]
- Cedernaes, J.; et al. Acute Sleep Loss Induces Tissue-Specific Epigenetic and Transcriptional Alterations to Circadian Clock Genes in Men . J. Clin. Endocrinol. Metab. 2015, 100(9), E1255–61. [Google Scholar] [CrossRef] [PubMed]
- Vondra, K.; et al. Effects of sleep deprivation on the activity of selected metabolic enzymes in skeletal muscle . Eur. J. Appl. Physiol. Occup. Physiol. 1981, 47(1), 41–6. [Google Scholar] [CrossRef] [PubMed]
- VanHelder, T.; Symons, J.D.; Radomski, M.W. Effects of sleep deprivation and exercise on glucose tolerance . Aviat. Space Env. Med. 1993, 64(6), 487–92. [Google Scholar]
- Rao, M.N.; et al. Subchronic sleep restriction causes tissue-specific insulin resistance . J. Clin. Endocrinol. Metab. 2015, 100(4), 1664–71. [Google Scholar] [CrossRef] [PubMed]
- Broussard, J.L.; et al. Impaired insulin signaling in human adipocytes after experimental sleep restriction: a randomized, crossover study . Ann. Intern Med. 2012, 157(8), 549–57. [Google Scholar] [CrossRef] [PubMed]
- Klingenberg, L.; et al. Acute Sleep Restriction Reduces Insulin Sensitivity in Adolescent Boys . Sleep 2013, 36(7), 1085–1090. [Google Scholar] [CrossRef] [PubMed]
- Tajiri, E.; et al. Effect of sleep curtailment on dietary behavior and physical activity: A randomized crossover trial . Physiol. Behav. 2018, 184, 60–67. [Google Scholar] [CrossRef] [PubMed]
- Benedict, C.; et al. Gut microbiota and glucometabolic alterations in response to recurrent partial sleep deprivation in normal-weight young individuals . Mol. Metab. 2016, 5(12), 1175–1186. [Google Scholar] [CrossRef] [PubMed]
- Donga, E.; et al. A single night of partial sleep deprivation induces insulin resistance in multiple metabolic pathways in healthy subjects . J. Clin. Endocrinol. Metab. 2010, 95(6), 2963–8. [Google Scholar] [CrossRef] [PubMed]
- Sweeney, E.L.; et al. Impaired Insulin Profiles Following a Single Night of Sleep Restriction: The Impact of Acute Sprint Interval Exercise . Int. J. Sport Nutr. Exerc. Metab. 2020, 30(2), 139–144. [Google Scholar] [CrossRef] [PubMed]
- Sweeney, E.L.; et al. Impairments in glycaemic control do not increase linearly with repeated nights of sleep restriction in healthy adults: a randomised controlled trial . Appl. Physiol. Nutr. Metab. 2021, 46(9), 1091–1096. [Google Scholar] [CrossRef] [PubMed]
- Coutrot, A.; et al. Reported sleep duration reveals segmentation of the adult life-course into three phases . Nat. Commun. 2022, 13(1), 7697. [Google Scholar] [CrossRef] [PubMed]
- Nedeltcheva, A.V.; et al. Exposure to recurrent sleep restriction in the setting of high caloric intake and physical inactivity results in increased insulin resistance and reduced glucose tolerance . J. Clin. Endocrinol. Metab. 2009, 94(9), 3242–50. [Google Scholar] [CrossRef] [PubMed]
- Nedeltcheva, A.V.; Imperial, J.G.; Penev, P.D. Effects of sleep restriction on glucose control and insulin secretion during diet-induced weight loss . Obesity 2012, 20(7), 1379–86. [Google Scholar] [CrossRef] [PubMed]
- Wang, X.; et al. Short-Term Moderate Sleep Restriction Decreases Insulin Sensitivity in Young Healthy Adults . Sleep Health 2016, 2(1), 63–68. [Google Scholar] [CrossRef] [PubMed]
- Saner, N.J.; Bishop, D.J.; Bartlett, J.D. Is exercise a viable therapeutic intervention to mitigate mitochondrial dysfunction and insulin resistance induced by sleep loss? . Sleep Med. Rev. 2018, 37, 60–68. [Google Scholar] [CrossRef] [PubMed]
- Monzel, A.S.; Enriquez, J.A.; Picard, M. Multifaceted mitochondria: moving mitochondrial science beyond function and dysfunction . Nat. Metab. 2023, 5(4), 546–562. [Google Scholar] [CrossRef] [PubMed]
- Rossmann, M.P.; et al. Mitochondrial function in development and disease . Dis. Model. Mech. 2021, 14(6). [Google Scholar] [CrossRef] [PubMed]
- Genders, A.J.; Holloway, G.P.; Bishop, D.J. Are Alterations in Skeletal Muscle Mitochondria a Cause or Consequence of Insulin Resistance? . Int. J. Mol. Sci. 2020, 21(18). [Google Scholar] [CrossRef] [PubMed]
- Bishop, D.J.; Lee, M.J.C.; Picard, M. Exercise as Mitochondrial Medicine: How Does the Exercise Prescription Affect Mitochondrial Adaptations to Training? . Annu. Rev. Physiol. 2025. 87, 107–129. [Google Scholar] [CrossRef]
- Miller, B.F.; Hamilton, K.L. A perspective on the determination of mitochondrial biogenesis . Am. J. Physiol. Endocrinol. Metab. 2012, 302(5), E496–9. [Google Scholar] [CrossRef] [PubMed]
- Guillet, C.; et al. Changes in basal and insulin and amino acid response of whole body and skeletal muscle proteins in obese men . J. Clin. Endocrinol. Metab. 2009, 94(8), 3044–50. [Google Scholar] [CrossRef] [PubMed]
- Rinehart, R.W.; Roberson, J.; Beattie, D.S. The Effect of Diabetes on Protein-Synthesis and the Respiratory-Chain of Rat Skeletal-Muscle and Kidney Mitochondria . Arch. Biochem. Biophys. 1982, 213(2), 341–352. [Google Scholar] [CrossRef] [PubMed]
- Patti, M.E.; et al. Coordinated reduction of genes of oxidative metabolism in humans with insulin resistance and diabetes: Potential role of PGC1 and NRF1 . Proc. Natl. Acad. Sci. U S A 2003, 100(14), 8466–71. [Google Scholar] [CrossRef] [PubMed]
- Heilbronn, L.K.; et al. Markers of mitochondrial biogenesis and metabolism are lower in overweight and obese insulin-resistant subjects . J. Clin. Endocrinol. Metab. 2007, 92(4), 1467–1473. [Google Scholar] [CrossRef] [PubMed]
- Bishop, D.J.; et al. Discordant skeletal muscle gene and protein responses to exercise . Trends Biochem Sci. 2023. [Google Scholar] [CrossRef] [PubMed]
- Hammarstedt, A.; et al. Reduced expression of PGC-1 and insulin-signaling molecules in adipose tissue is associated with insulin resistance . Biochem Biophys. Res. Commun. 2003, 301(2), 578–82. [Google Scholar] [CrossRef] [PubMed]
- Ploumi, C.; Daskalaki, I.; Tavernarakis, N. Mitochondrial biogenesis and clearance: a balancing act . Febs J. 2017, 284(2), 183–195. [Google Scholar] [PubMed]
- Larsen, S.N.; Hansen, J.; Nielsen, C.N.; Wibrand, L.B.; Stride, F.; Schroder, N.; Boushel, H.D.; Helge, R.; Dela, J.W. Biomarkers of mitochondrial content in skeletal muscle of healthy young human subjects . J. Physiol. 2012, 590, 3349–3360. [Google Scholar] [CrossRef] [PubMed]
- Kelley, D.E.; et al. Dysfunction of mitochondria in human skeletal muscle in type 2 diabetes . Diabetes 2002, 51(10), 2944–50. [Google Scholar] [CrossRef] [PubMed]
- Chomentowski, P.; et al. Skeletal muscle mitochondria in insulin resistance: differences in intermyofibrillar versus subsarcolemmal subpopulations and relationship to metabolic flexibility . J. Clin. Endocrinol. Metab. 2011, 96(2), 494–503. [Google Scholar] [CrossRef] [PubMed]
- Ritov, V.B.; et al. Deficiency of subsarcolemmal mitochondria in obesity and type 2 diabetes . Diabetes 2005, 54(1), 8–14. [Google Scholar] [CrossRef] [PubMed]
- Picard, M.; McEwen, B.S. Psychological Stress and Mitochondria: A Systematic Review . Psychosom. Med. 2018, 80(2), 141–153. [Google Scholar] [CrossRef] [PubMed]
- Layec, G.; et al. Accuracy and precision of quantitative 31P-MRS measurements of human skeletal muscle mitochondrial function . Am. J. Physiol. Endocrinol. Metab. 2016, 311(2), E358–66. [Google Scholar] [CrossRef] [PubMed]
- Mogensen, M.; et al. Mitochondrial respiration is decreased in skeletal muscle of patients with type 2 diabetes . Diabetes 2007, 56(6), 1592–9. [Google Scholar] [CrossRef] [PubMed]
- Phielix, E.; et al. Exercise training increases mitochondrial content and ex vivo mitochondrial function similarly in patients with type 2 diabetes and in control individuals . Diabetologia 2010, 53(8), 1714–1721. [Google Scholar] [CrossRef] [PubMed]
- Meex, R.C.; et al. Restoration of muscle mitochondrial function and metabolic flexibility in type 2 diabetes by exercise training is paralleled by increased myocellular fat storage and improved insulin sensitivity . Diabetes 2010, 59(3), 572–9. [Google Scholar] [PubMed]
- Bonen, A.; et al. Extremely rapid increase in fatty acid transport and intramyocellular lipid accumulation but markedly delayed insulin resistance after high fat feeding in rats . Diabetologia 2015, 58(10), 2381–91. [Google Scholar] [CrossRef] [PubMed]
- Koves, T.R.; et al. Mitochondrial overload and incomplete fatty acid oxidation contribute to skeletal muscle insulin resistance . Cell Metab. 2008, 7(1), 45–56. [Google Scholar] [CrossRef] [PubMed]
- Gavin, T.P.; et al. High Incomplete Skeletal Muscle Fatty Acid Oxidation Explains Low Muscle Insulin Sensitivity in Poorly Controlled T2D . J. Clin. Endocrinol. Metab. 2018, 103(3), 882–889. [Google Scholar] [PubMed]
- James, D.E.; Stockli, J.; Birnbaum, M.J. The aetiology and molecular landscape of insulin resistance . Nat. Rev. Mol. Cell Biol. 2021, 22(11), 751–771. [Google Scholar] [CrossRef] [PubMed]
- Halvatsiotis, P.; et al. Synthesis rate of muscle proteins, muscle functions, and amino acid kinetics in type 2 diabetes . Diabetes 2002, 51(8), 2395–404. [Google Scholar] [CrossRef] [PubMed]
- Nielsen, J.; et al. Increased subsarcolemmal lipids in type 2 diabetes: effect of training on localization of lipids, mitochondria, and glycogen in sedentary human skeletal muscle . Am. J. Physiol. Endocrinol. Metab. 2010, 298(3), E706–13. [Google Scholar] [CrossRef] [PubMed]
- Whytock, K.L.; et al. Comprehensive interrogation of human skeletal muscle reveals a dissociation between insulin resistance and mitochondrial capacity . Am. J. Physiol. Endocrinol. Metab. 2023. [Google Scholar] [CrossRef] [PubMed]
- R Boushel, E.G.; Schjerling, P.; Skovbro, M.; Kraunsøe, R.; Dela, F. Patients with type 2 diabetes have normal mitochondrial function in skeletal muscle . Diabetologia 2007, 50(4), 790–6. [Google Scholar] [CrossRef]
- De Feyter, H.M.; et al. Early or advanced stage type 2 diabetes is not accompanied by in vivo skeletal muscle mitochondrial dysfunction . Eur. J. Endocrinol. 2008, 158(5), 643–53. [Google Scholar] [CrossRef] [PubMed]
- Gottlieb, D.; et al. Muscle mitochondrial function is impaired in adults with type 1 diabetes . J. Diabetes Its Complicat. 2024, 38(8). [Google Scholar] [CrossRef]
- Cefis, M.; et al. Impact of physical activity on physical function, mitochondrial energetics, ROS production, and Ca(2+) handling across the adult lifespan in men . Cell Rep. Med. 2025. 6, 2, 101968. [Google Scholar] [CrossRef]
- Healy, G.N.; et al. Objectively measured light-intensity physical activity is independently associated with 2-h plasma glucose . Diabetes Care 2007, 30(6), 1384–9. [Google Scholar] [CrossRef] [PubMed]
- Larsen, S.; et al. Four days of bed rest increases intrinsic mitochondrial respiratory capacity in young healthy males . Physiol. Rep. 2018, 6(18), e13793. [Google Scholar] [CrossRef] [PubMed]
- Little, J.P.; et al. Low-volume high-intensity interval training reduces hyperglycemia and increases muscle mitochondrial capacity in patients with type 2 diabetes . J. Appl. Physiol. (1985) 2011, 111(6), 1554–60. [Google Scholar] [CrossRef] [PubMed]
- Dirks, M.L.; et al. Short-term bed rest-induced insulin resistance cannot be explained by increased mitochondrial H2 O2 emission . J. Physiol.-Lond. 2020, 598(1), 123–137. [Google Scholar] [CrossRef] [PubMed]
- Eggelbusch, M.; et al. The impact of bed rest on human skeletal muscle metabolism . Cell Rep. Med. 2024, 5(1). [Google Scholar] [CrossRef] [PubMed]
- Davies, S.K.; et al. Effect of sleep deprivation on the human metabolome . Proc. Natl. Acad. Sci. USA 2014, 111(29), 10761–10766. [Google Scholar] [CrossRef] [PubMed]
- Chanana, P.; Kumar, A. GABA-BZD Receptor Modulating Mechanism of Panax quinquefolius against 72-h Sleep Deprivation Induced Anxiety like Behavior: Possible Roles of Oxidative Stress, Mitochondrial Dysfunction and Neuroinflammation . Front Neurosci. 2016, 10, 84. [Google Scholar] [CrossRef] [PubMed]
- Andreazza, A.C.; et al. Impairment of the mitochondrial electron transport chain due to sleep deprivation in mice . J. Psychiatr. Res. 2010, 44(12), 775–80. [Google Scholar] [CrossRef] [PubMed]
- Vaccaro, A.; et al. Sleep Loss Can Cause Death through Accumulation of Reactive Oxygen Species in the Gut . Cell 2020, 181(6), 1307–1328 e15. [Google Scholar] [CrossRef] [PubMed]
- van den Berg, R.; et al. A single night of sleep curtailment increases plasma acylcarnitines: Novel insights in the relationship between sleep and insulin resistance . Arch. Biochem Biophys. 2016, 589, 145–51. [Google Scholar] [CrossRef] [PubMed]
- Wrede, J.E.; et al. Mitochondrial DNA Copy Number in Sleep Duration Discordant Monozygotic Twins . Sleep 2015, 38(10), 1655–8. [Google Scholar] [CrossRef] [PubMed]
- Zhao, H.; et al. Frontal cortical mitochondrial dysfunction and mitochondria-related beta-amyloid accumulation by chronic sleep restriction in mice . Neuroreport 2016, 27(12), 916–22. [Google Scholar] [CrossRef] [PubMed]
- Yao, N.; et al. Relationship between weekends catch-up sleep and risk of aging . PLoS ONE 2025, 20(10), e0332584. [Google Scholar] [CrossRef] [PubMed]
- Kim, D.J.; et al. Beneficial effects of weekend catch-up sleep on metabolic syndrome in chronic short sleepers . Sleep Med. 2020, 76, 26–32. [Google Scholar] [CrossRef] [PubMed]
- Broussard, J.L.; et al. Two Nights of Recovery Sleep Reverses the Effects of Short-term Sleep Restriction on Diabetes Risk . Diabetes Care 2016, 39(3), e40–1. [Google Scholar] [CrossRef] [PubMed]
- Eckel, R.H.; et al. Morning Circadian Misalignment during Short Sleep Duration Impacts Insulin Sensitivity . Curr. Biol. 2015, 25(22), 3004–10. [Google Scholar] [CrossRef] [PubMed]
- Killick, R.; et al. Metabolic and hormonal effects of 'catch-up' sleep in men with chronic, repetitive, lifestyle-driven sleep restriction . Clin. Endocrinol. (Oxf) 2015, 83(4), 498–507. [Google Scholar] [CrossRef] [PubMed]
- Ness, Kelly M.; et al. Two nights of recovery sleep restores the dynamic lipemic response, but not the reduction of insulin sensitivity, induced by five nights of sleep restriction . Am. J. Physiol. Regul. Integr. Comp. Physiol. 2019, 6(316), R697–R703. [Google Scholar] [CrossRef]
- van Leeuwen, W.M.; et al. Prolonged sleep restriction affects glucose metabolism in healthy young men . Int. J. Endocrinol. 2010, 108641. [Google Scholar] [PubMed]
- Sterling P, E.J. Allostasis: a new paradigm to explain arousal pathology . In Allostasis: a new paradigm to explain arousal pathology; R.J. Fisher, S., Ed.; John Wiley & Sons: New York, 1988. [Google Scholar]
- McEwen, B.S.; Karatsoreos, I.N. Sleep Deprivation and Circadian Disruption: Stress, Allostasis, and Allostatic Load . Sleep Med. Clin. 2015, 10(1), 1–10. [Google Scholar] [CrossRef] [PubMed]
- Christensen, D.S.; et al. Sleep and allostatic load: A systematic review and meta-analysis . Sleep Med. Rev. 2022, 64, 101650. [Google Scholar] [CrossRef] [PubMed]
- Bobba-Alves, N.; Juster, R.P.; Picard, M. The energetic cost of allostasis and allostatic load . Psychoneuroendocrinology 2022, 146, 105951. [Google Scholar] [CrossRef] [PubMed]
- Robertson, M.D.; et al. Effects of three weeks of mild sleep restriction implemented in the home environment on multiple metabolic and endocrine markers in healthy young men . Metabolism 2013, 62(2), 204–11. [Google Scholar] [CrossRef] [PubMed]
- Lin, W.T.; et al. The Effect of Sleep Restriction, With or Without Exercise, on Skeletal Muscle Transcriptomic Profiles in Healthy Young Males . Front. Endocrinol. 2022, 13. [Google Scholar] [CrossRef]
Figure 1.
Diagrammatic representation of sleep definitions and recommended sleep durations for adults. The National Sleep Foundation recommends that adults obtain 7–9 h of sleep per night [3], with < 7 h sleep considered inadequate, 5 – 7 h classified as moderate sleep loss, < 5 h as severe sleep loss, and > 24 h of continuous wakefulness defined as total sleep deprivation.
Figure 1.
Diagrammatic representation of sleep definitions and recommended sleep durations for adults. The National Sleep Foundation recommends that adults obtain 7–9 h of sleep per night [3], with < 7 h sleep considered inadequate, 5 – 7 h classified as moderate sleep loss, < 5 h as severe sleep loss, and > 24 h of continuous wakefulness defined as total sleep deprivation.
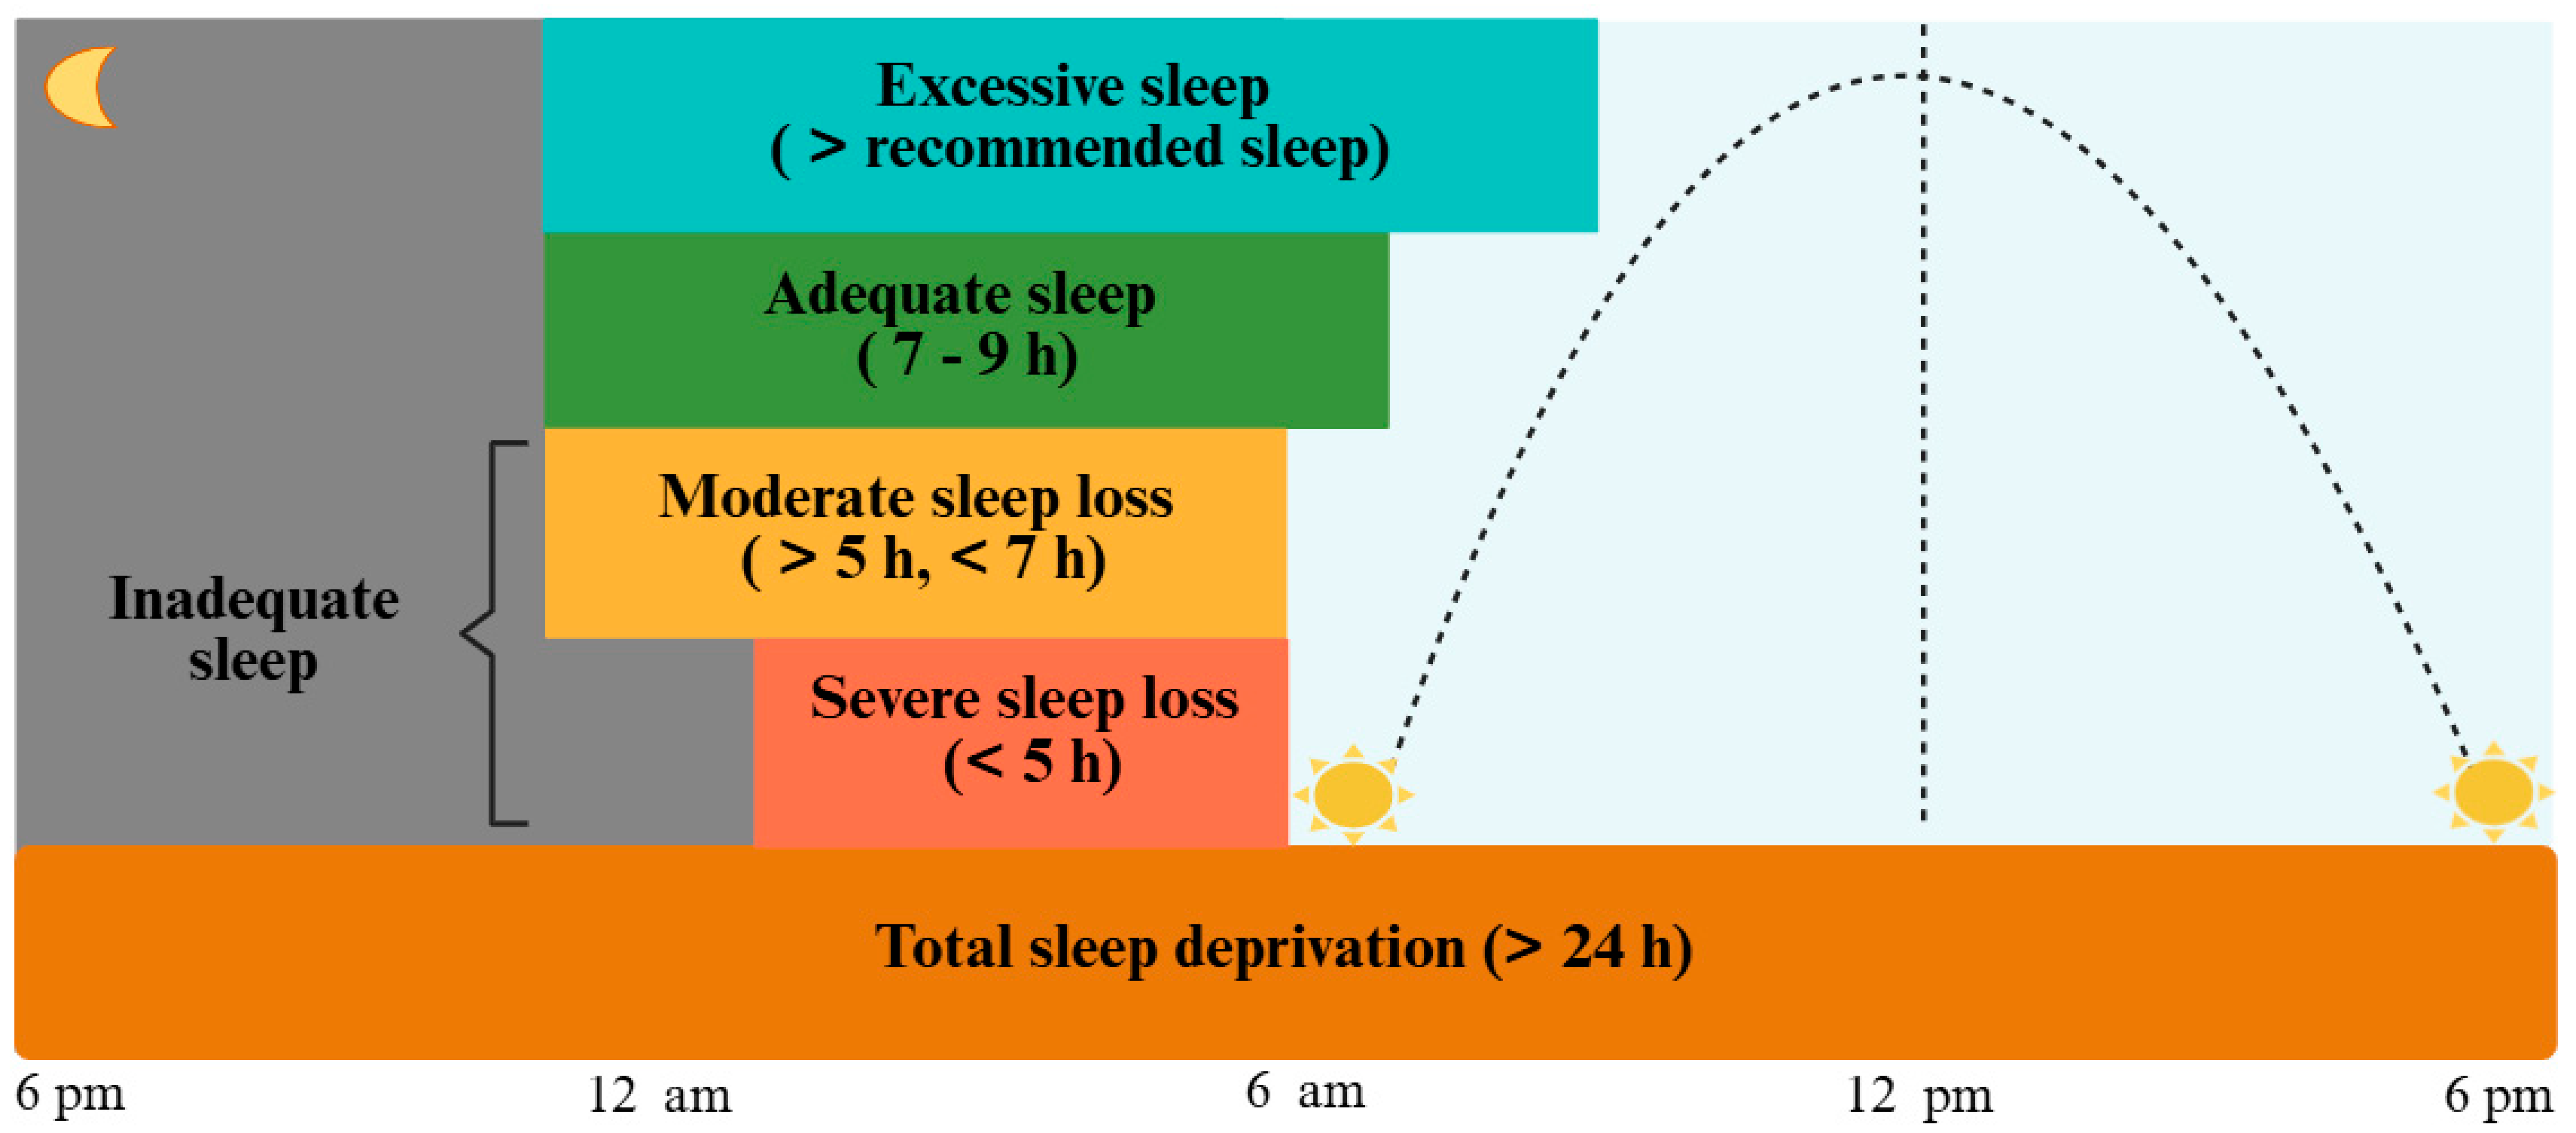
Figure 2.
An illustration of the different methods for the measurement of glucose tolerance and insulin sensitivity. The figure shows typical response patterns for individuals with normal glucose tolerance (green line), impaired glucose tolerance (yellow line) or insulin resistance, and type 2 diabetes (red line) in response to A. Oral glucose tolerance test (OGTT) [19], B. Hyperinsulinemic-euglycemic clamp (HIEC) [20,21], C. Intravenous glucose tolerance test (IVGTT) [20], D. Continuous glucose monitoring, E. Other measures: an insulin suppression test, haemoglobin A1C (HbA1C), fasting glucose.
Figure 2.
An illustration of the different methods for the measurement of glucose tolerance and insulin sensitivity. The figure shows typical response patterns for individuals with normal glucose tolerance (green line), impaired glucose tolerance (yellow line) or insulin resistance, and type 2 diabetes (red line) in response to A. Oral glucose tolerance test (OGTT) [19], B. Hyperinsulinemic-euglycemic clamp (HIEC) [20,21], C. Intravenous glucose tolerance test (IVGTT) [20], D. Continuous glucose monitoring, E. Other measures: an insulin suppression test, haemoglobin A1C (HbA1C), fasting glucose.
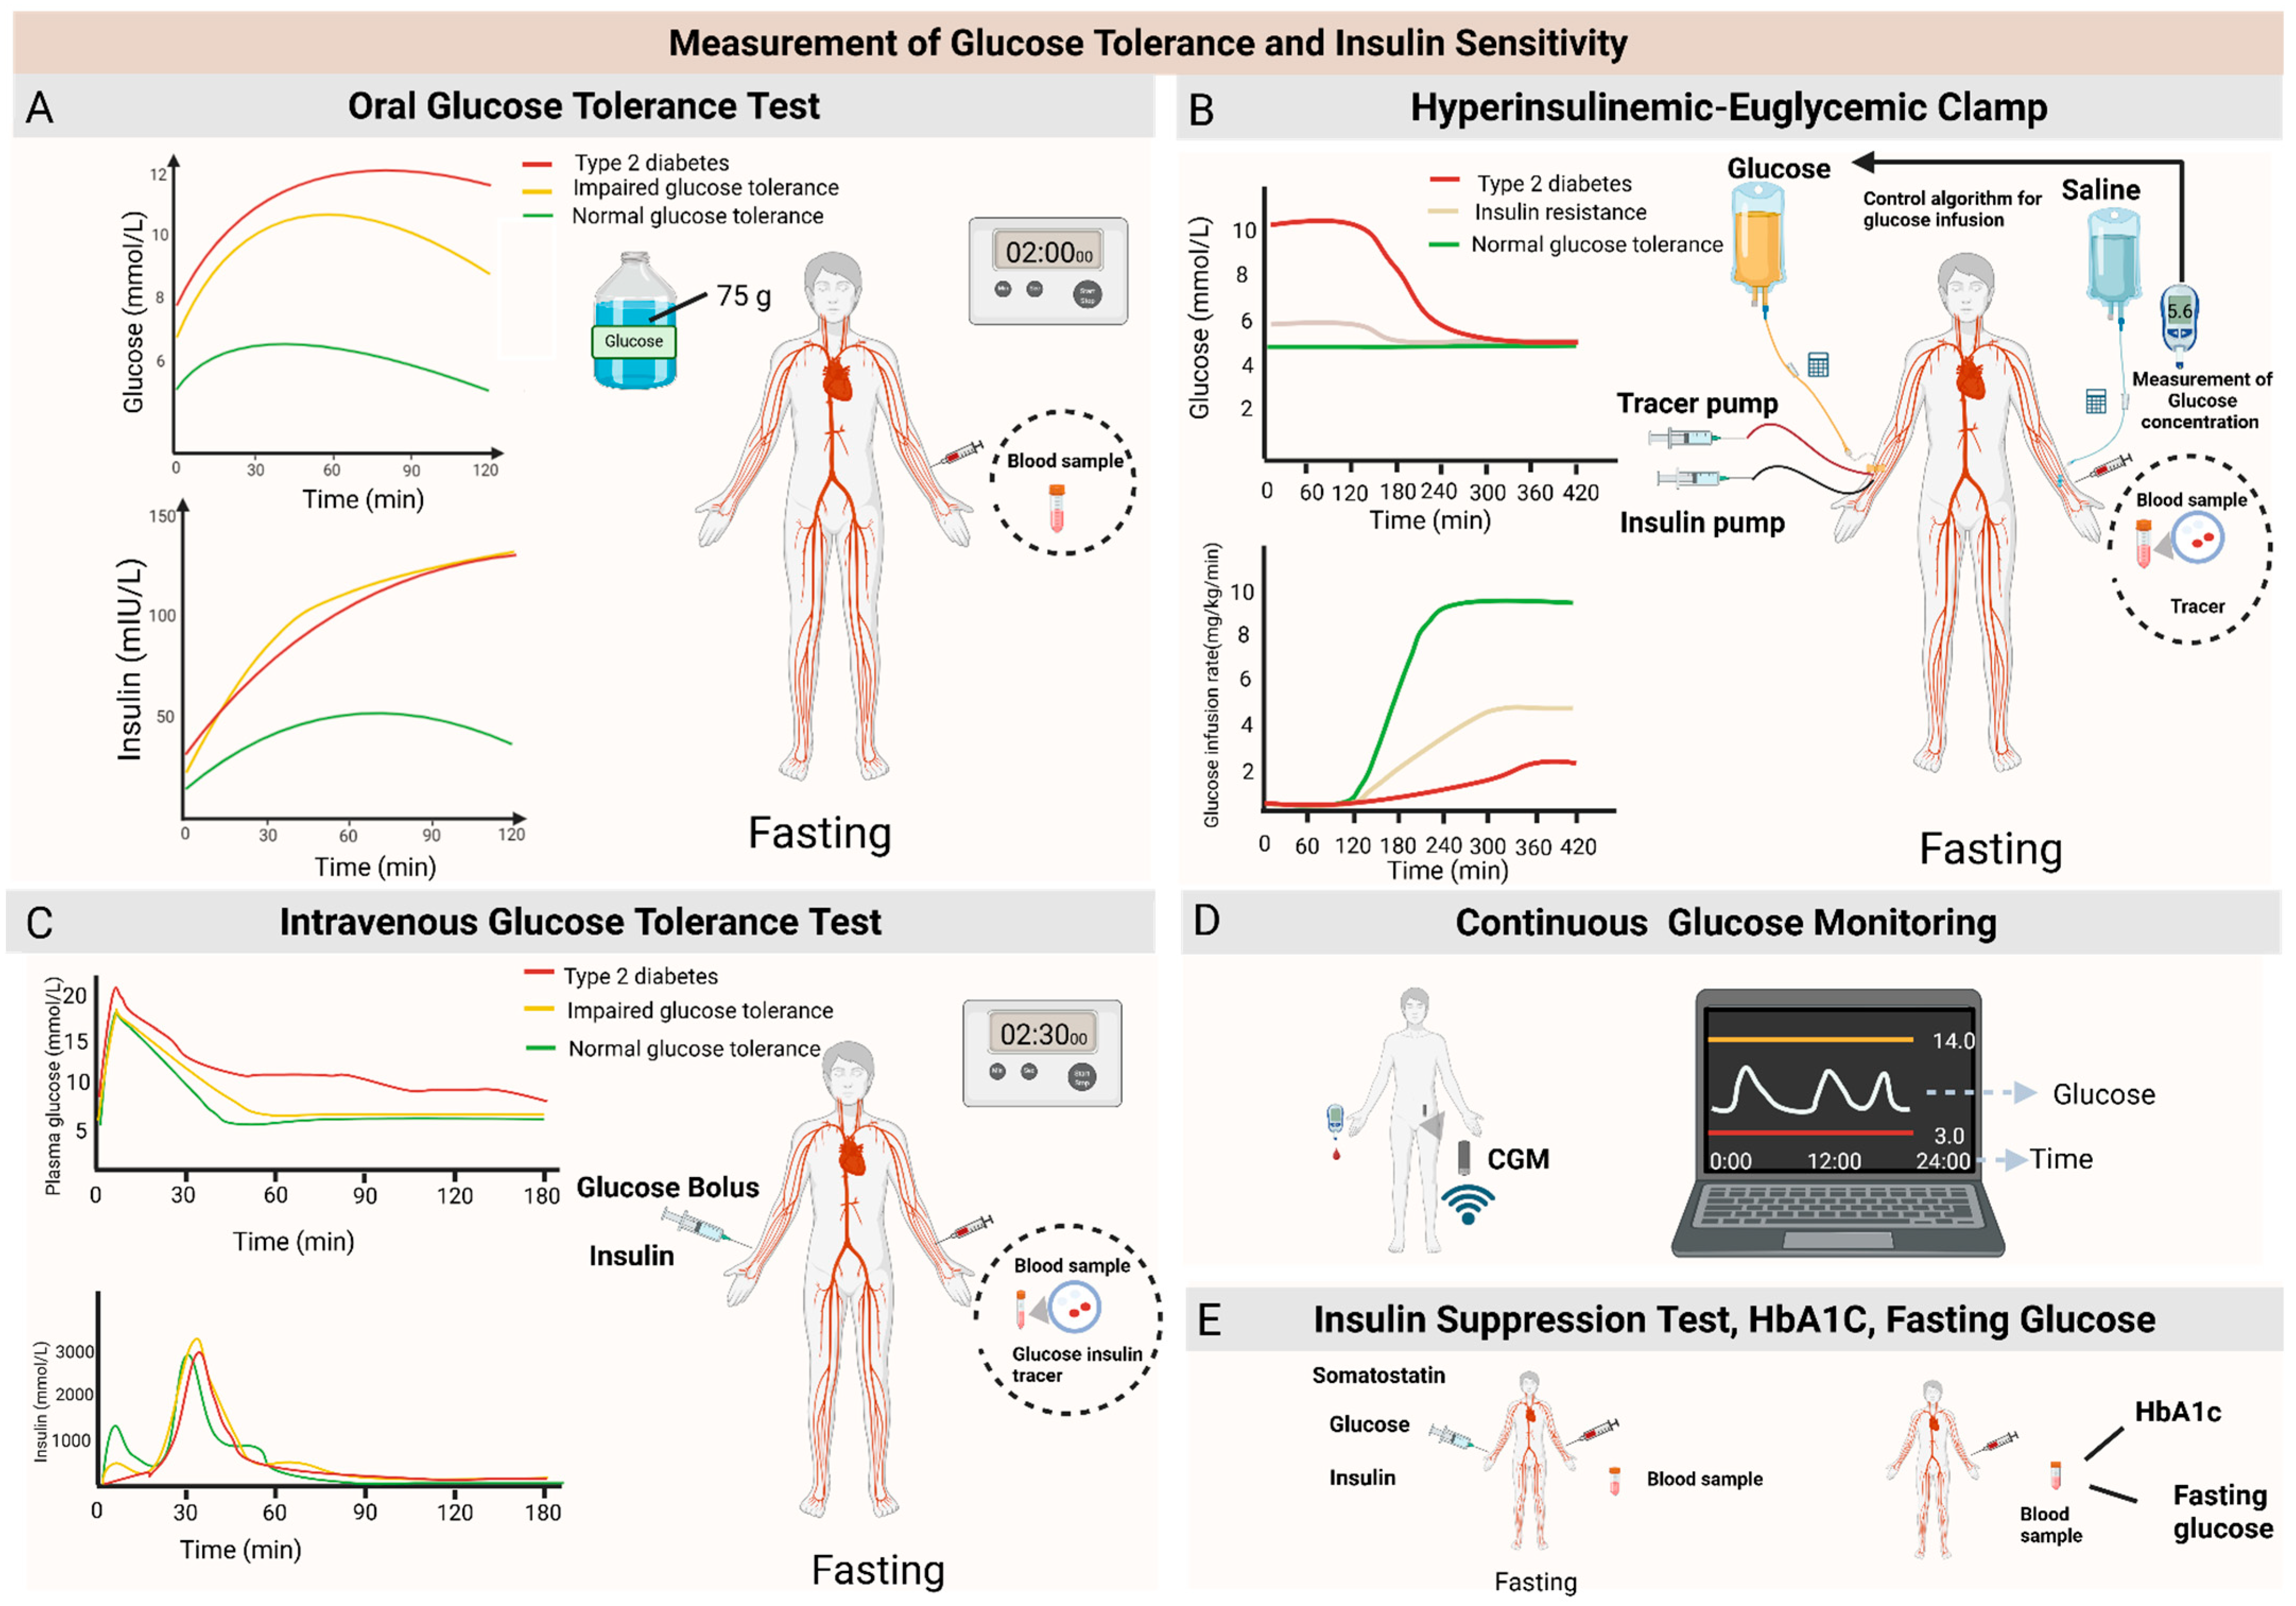
Figure 3.
Association between sleep duration and risk of type 2 diabetes, Orange indicates severe sleep loss, yellow indicates moderate sleep loss, light green indicates adequate sleep, and teal indicates excessive sleep. Data are shown as point estimates with 95% confidence intervals across sleep duration categories, with the lowest risk observed at 7–8 h and higher risk at both shorter and longer durations. Adapted from a published meta-analysis [14].
Figure 3.
Association between sleep duration and risk of type 2 diabetes, Orange indicates severe sleep loss, yellow indicates moderate sleep loss, light green indicates adequate sleep, and teal indicates excessive sleep. Data are shown as point estimates with 95% confidence intervals across sleep duration categories, with the lowest risk observed at 7–8 h and higher risk at both shorter and longer durations. Adapted from a published meta-analysis [14].
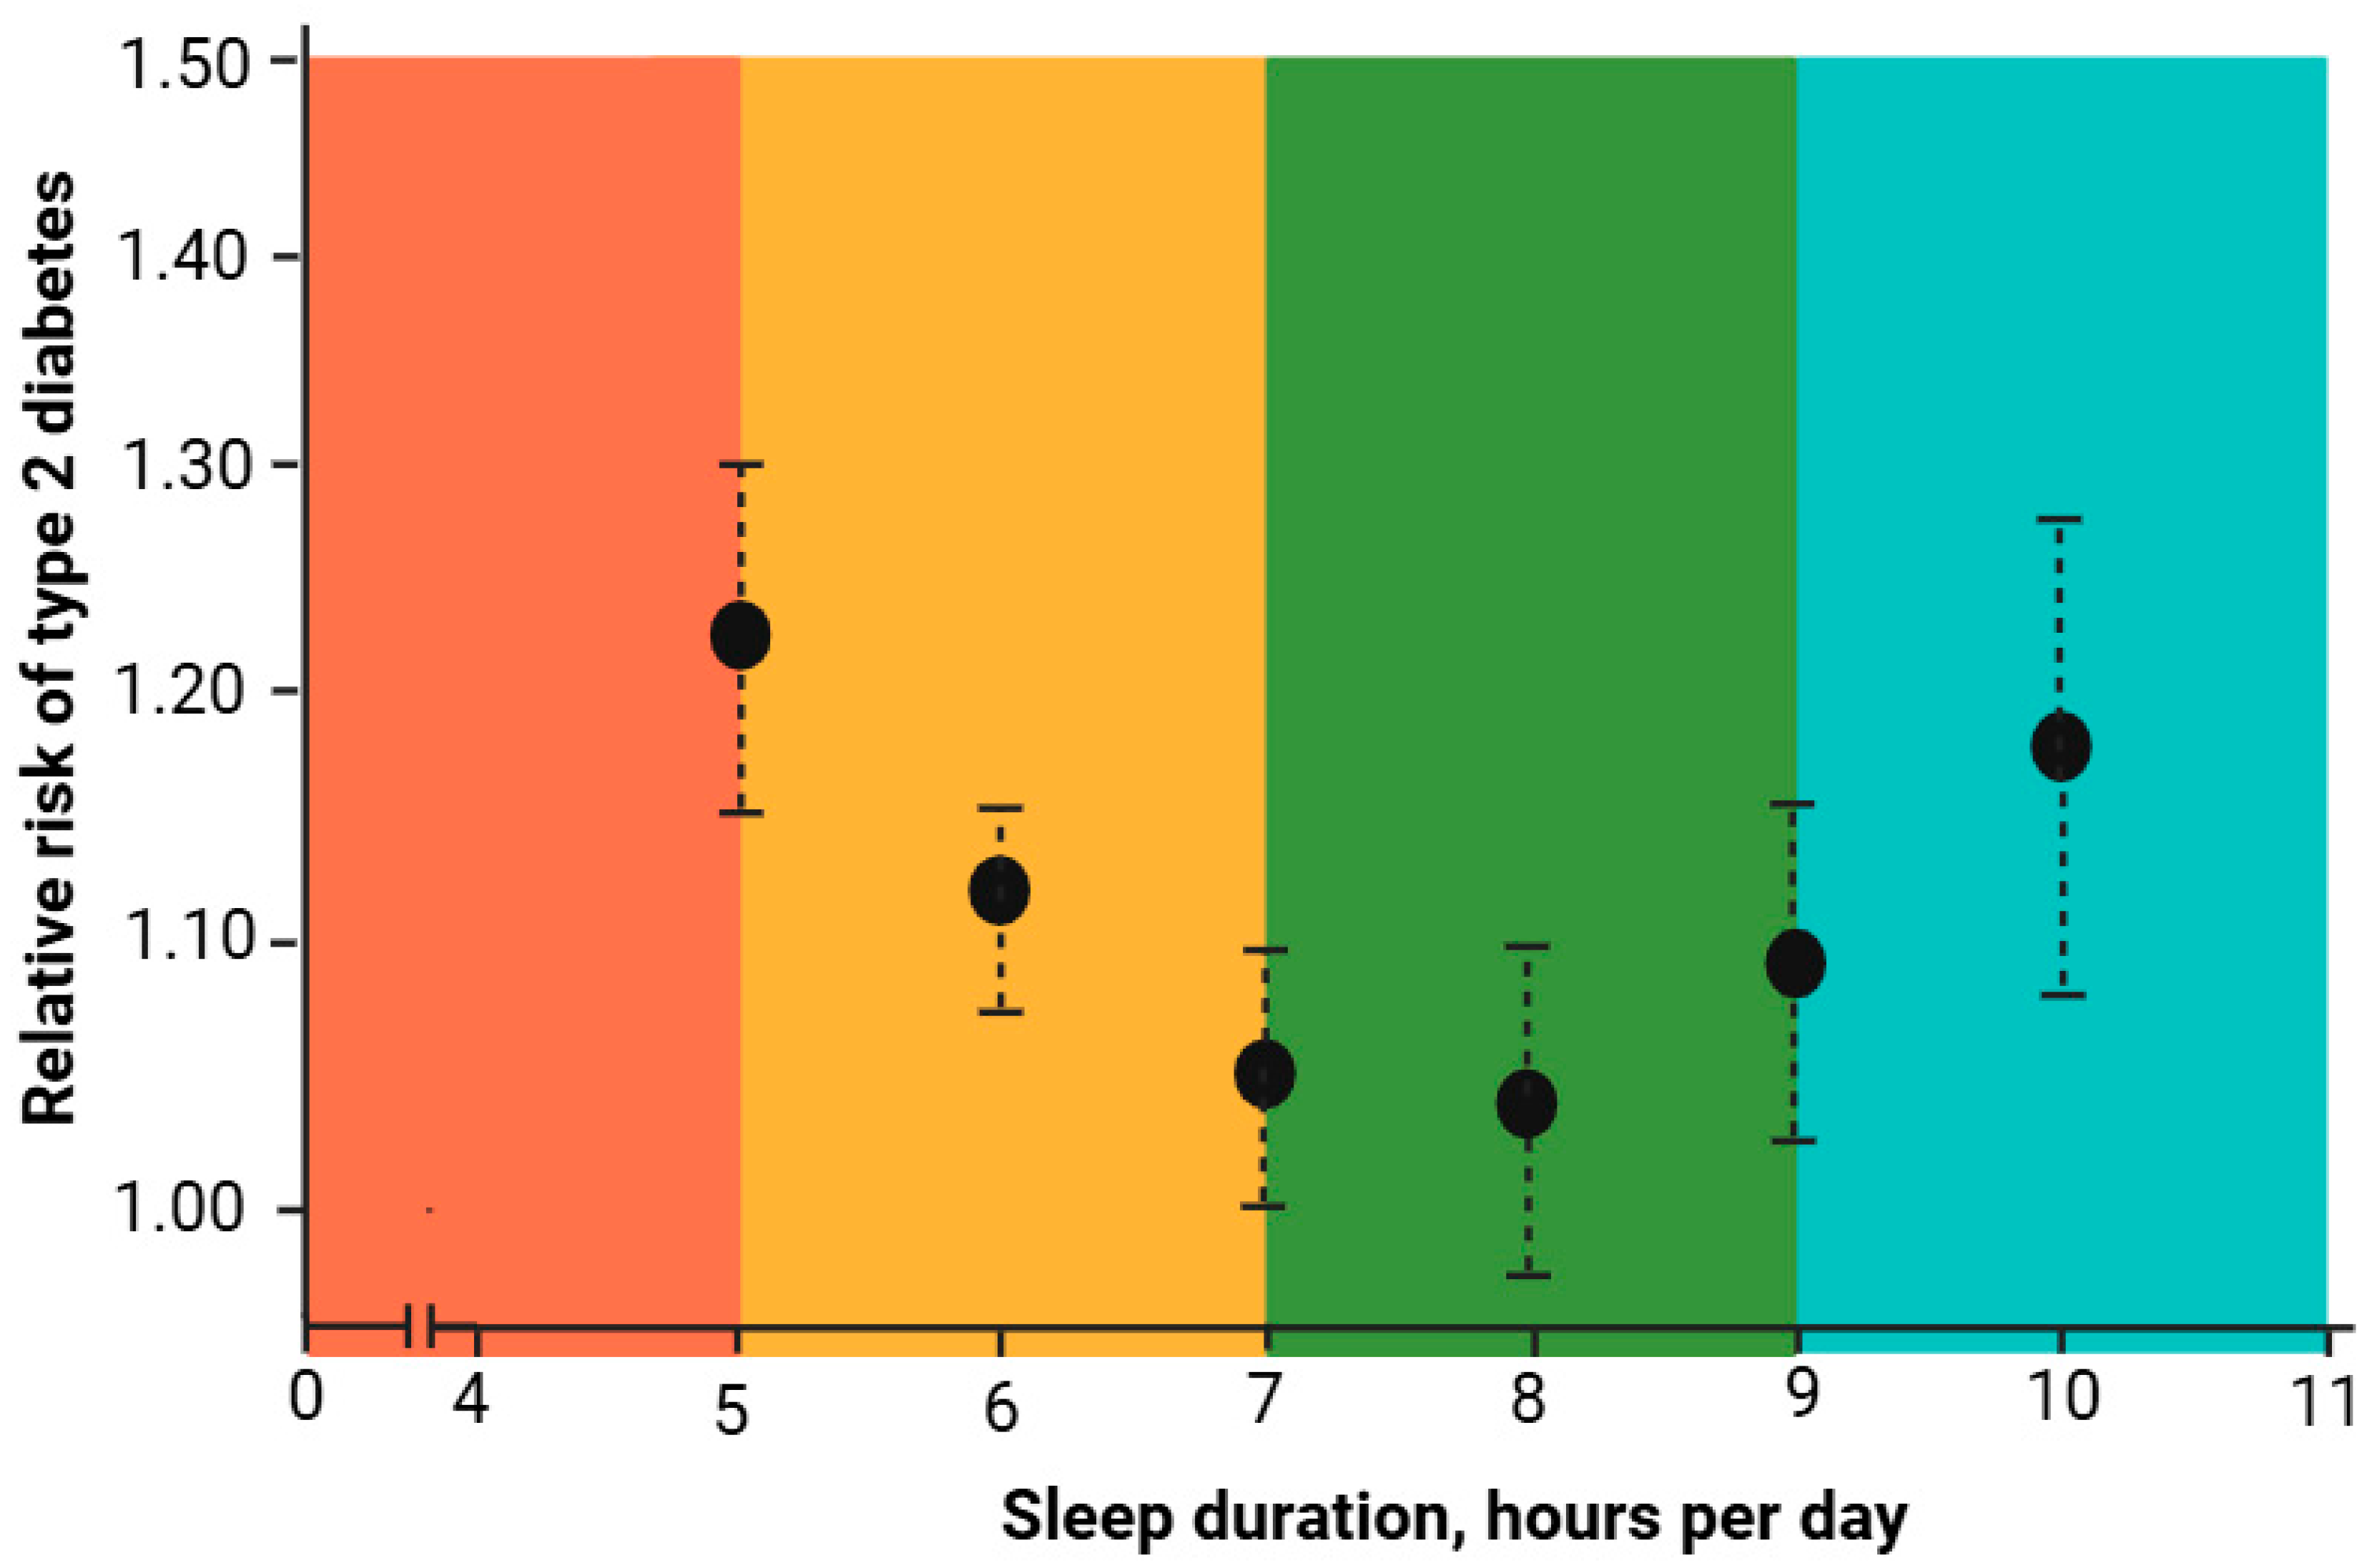
Figure 4.
Terms related to mitochondrial characteristics and their associated measurement methods. ROS = reactive oxygen species, ETC = electron Transport Chain, PCr = phosphocreatine, Pi = inorganic Phosphate, OxPhos = oxidative phosphorylation, mtDNA copy number (mitochondrial DNA copy number). Figure adapted from Bishop et al., 2025 [45].
Figure 4.
Terms related to mitochondrial characteristics and their associated measurement methods. ROS = reactive oxygen species, ETC = electron Transport Chain, PCr = phosphocreatine, Pi = inorganic Phosphate, OxPhos = oxidative phosphorylation, mtDNA copy number (mitochondrial DNA copy number). Figure adapted from Bishop et al., 2025 [45].
Disclaimer/Publisher’s Note: The statements, opinions and data contained in all publications are solely those of the individual author(s) and contributor(s) and not of MDPI and/or the editor(s). MDPI and/or the editor(s) disclaim responsibility for any injury to people or property resulting from any ideas, methods, instructions or products referred to in the content. |
© 2026 by the authors. Licensee MDPI, Basel, Switzerland. This article is an open access article distributed under the terms and conditions of the Creative Commons Attribution (CC BY) license (http://creativecommons.org/licenses/by/4.0/).
Copyright: This open access article is published under a Creative Commons CC BY 4.0 license, which permit the free download, distribution, and reuse, provided that the author and preprint are cited in any reuse.


