

Submitted:
15 July 2026
Posted:
17 July 2026
You are already at the latest version
Abstract
Supraphysiological levels of oxygen are often used as therapy for acute respiratory distress and other severe pulmonary morbidities but can cause excessive generation of reactive O2 and nitrogen species resulting in oxidative and inflammatory injury. Aurothioglucose (ATG), a FDA approved, gold-containing pharmaceutical, potently and irreversibly inhibits TrxR1 and in adult and neonatal mice, ATG treatment preserves reduced glutathione levels, and attenuates hyperoxic lung injury. Adult C3H mice were treated with saline or ATG and exposed to room air or >95% O2. All mice had succumbed or were euthanized at 200h of hyperoxia exposure and lung tissues were collected. Metabolomic analyses were conducted and comparisons were performed between room air and >95% O2 exposure, saline and ATG treatment, and male and female sex. Profound differences in survival between sexes with and without ATG treatment with ATG-treated females surviving longer than all other hyperoxia-exposed groups. Comparisons between groups identified metabolites in the glutathione pathway as significantly different. Metabolomic analysis revealed keratin sulfate (KS) biosynthesis and glycosphingolipid (GSL) biosynthesis as the primary pathways in the saline O2 vs ATG O2 comparison. Carnitine shuttle was identified as the primary pathway between sexes both with ATG and O2. The current data suggests that the improved survival of hyperoxia-exposed ATG-treated female C3H mice is likely driven by enhanced glutathione synthesis, energy production, and metabolism resulting in decreased lung injury through modulation of KS and GSL levels. These findings may provide direction for further research to improve outcomes after hyperoxia exposure.
Keywords:
lung
; hyperoxia
; aurothioglucose
; sex differences
; metabolomics
1. Introduction
Supraphysiological levels of oxygen are often used as therapy for acute respiratory distress and other severe pulmonary morbidities. Pulmonary oxygen (O2) toxicity is mediated through excessive generation of reactive O2 and nitrogen species that cause oxidative and inflammatory injury. Our earlier work identified thioredoxin reductase inhibition as a protective intervention for hyperoxia-induced lung injury in C3H/HeN (C3H) adult mice.[1] Further mechanistic studies revealed that TrxR inhibition enhanced endogenous nuclear factor E2-related factor 2-dependent antioxidant responses.[1,2,3,4,5,6] Aurothioglucose (ATG), a FDA approved, gold-containing pharmaceutical, clinically indicated for treatment of rheumatoid arthritis, potently and irreversibly inhibits TrxR1 and is used experimentally to inhibit TrxR1 in animal models.[7] In adult and neonatal mice, ATG treatment was well tolerated, preserves GSH levels, and attenuates hyperoxic lung injury.[4,5,8] Further, administration of ATG attenuated hyperoxia-induce alveolarization deficits in a newborn model of hyperoxic lung injury. [2,9]
Sex differences in susceptibility to lung pathologies are well established. [10] Females have more robust immune responses likely due to estrogen responses in inflammatory genes, which manifest as more severe symptoms. [11] For example, females are more likely to develop asthma or acute respiratory distress syndrome than are males. [12,13,14] Our previous studies using metabolomic analyses indicated significant differences in hyperoxic tolerance between sexes in C3H and C57Bl/6 (C57B) strains at baseline.[4] The current studies in C3H adult mice exposed to >95% O2 identified profound differences in survival between sexes with and without ATG treatment with ATG-treated females surviving longer than all other hyperoxia-exposed groups. In order to understand these differences, we utilized untargeted metabolomic analyses of lungs.
2. Materials and Methods
2.1. Animal model
C3H/HeN (C3H) adult mice (6-8 weeks old) were purchased from Harlan (Indianapolis, IN). After acclimation, mice were exposed to hyperoxia and euthanized and lung tissues snap-frozen and stored at -80 °C until needed. A total 12 mouse lungs were analyzed; sexes (males (M), females (F)), and control and treatment with ATG. As such we had n=3 for each of the 4 groups, including C3HM, C3HF, control and ATG treated. Animal protocols were approved by the Institutional Animal Care and Use Committee at the University of Alabama at Birmingham (IACUC #20001). Studies were conducted in accordance with ARRIVE guidelines.
Hyperoxic exposures were performed in a custom-made plexiglass chamber with O2 controlled using a BioSpherix ProOx P110 controller (Parish, NY). All treatments and exposures were performed in parallel. Eight to twelve week C3H mice received single intraperitoneal injection at time 0 of either saline or 25 mg/kg of ATG in saline. Mice were allowed to remain in room air (21%) or were placed in sealed Plexiglas containers with a continuous flow of oxygen (10 L/min) to sustain >95% O2. Oxygen levels were measured twice daily (Hudson RCI, Temecula, CA). Soda lime (Fisher Scientific, Fair Lawn,NJ) was placed in the hyperoxia exposure chamber, to prevent accumulation of CO2. Mice were euthanized with ketamine/xylazine (200/20 mg/kg, i.p.) at 72 hours after ATG administration and hyperoxia exposure, tissues were flash frozen in liquid nitrogen and stored at −80 °C for metabolomic analysis.
2.2. Right lung to body weight
2.3. High-resolution metabolomics
Samples were prepared as described in our previous report. [16] Metabolites were extracted from approximately 20-30mg of lung tissue by homogenization in a mixture of acetonitrile:water (15 µL/mg of 2:1ratio) which also contained our in-house mixture of stable isotope-labeled internal standards.[17] These extracts were incubated on ice for 30 min and then centrifuged (20,817 x rcf at 4° C for 10 min) to remove precipitates and stored at 80 °C until metabolomics analyses was initiated. The samples were analyzed using an Orbitrap Fusion Tribrid Mass Spectrometer (Thermo Scientific, Waltham, MA, USA) coupled to a Thermo Dionex Ultimate 3000 liquid chromatography system. Paired-dual column was utilized, with the hydrophilic interaction liquid chromatography column (HILIC; ThermoFisher Scientific, Accucore, 50x2.1mm, 2.6μm) operated in parallel to a C18-reverse phase column (C18; Higgins Analytical, 50x2.1mm, 2.6 μm) for simultaneous analytical separation on one column while flushing of the other. Dual electrospray ionization (ESI) was also used, with positive ESI for analysis with the HILIC column (HILIC+), and negative ESI was used with the C18 column (C18-). In triplicate, samples were injected for analysis on each column (10 µL). For HILIC+, the flow rates were maintained at 0.35 mL/min until 1.5 min, increased to 0.4 mL/min at 4 min and held for 1 min, resulting in a total analytical run time of 5 min. Mobile Phases A and B consisted of water and acetonitrile (LCMS grade). Mobile phase C was comprised of formic acid (2%; v/v) in water. Conditions for the mobile phases were held at 22.5% A, 75% B, 2.5% C for 1.5 min, then a linear gradient was applied to 77.5% A, 20% B, 2.5% C at 4 min, and held for 1 min. We then flushed the HILIC column for 5 min with a wash solution comprised of 77.5% A, 20% B, 2.5% C. For the C18-column, the flow rates were set to 0.4 mL/min for 1.5 min and was then increased to 0.5 mL/min at 2 min and held constant for 3 min. The C18- mobile phases (A and B) were composed of LCMS grade water and acetonitrile, respectively. Mobile phase C was 10 mM ammonium acetate in water. Conditions for the mobile phases for C18- were 60% A, 35% B, 5% C for 0.5 min, with a linear gradient to 0% A, 95% B, 5% C starting at 1.5 min, and held for 3.5 min, resulting in a total runtime of 5 min. We then flushed the C18 column with 0% A, 95% B, 5% C for 2.5 min, and re-equilibrated the column with a solution of 60% A, 35% B, 5% C for the remaining 2.5 min. Conditions for the Fusion included spray voltage, 3500 (V); capillary temperature, 300 °C; sheath gas flow, 45 (arbitrary units); auxillary gas flow, 25 (arbitrary units); spare gas flow, 1 (arbitrary units); max spray current, 100 (μA); and probe heater temperature, 200 °C. Data were acquired as accurate mass-to-charge ratio (m/z) in scan range 85-1275.
2.4. Data Processing and Selection of Metabolic Features
Mass spectral files were generated in .raw format and were converted to .cdf files using XCalibur file converter software (Thermo Fisher, Waltham, MA). Mass spectral data were then extracted and collated into a feature table using the R software apLCMS [18] and xMSanalyzer [19], developed previously by the Jones group. The spectral intensities from the feature table were log2 transformed and quantile normalized for statistical analyses. Filtering criteria of the spectral features included retention if they were present in 80% of the classifier groups, and the features must have been detected in 20% of the samples from the overall study. For the HILIC+ feature table, after filtering, 16,120 features were retained for differential expression analysis using the linear models for microarray data (limma) package in R [20] using xmsPANDA version 1.9.44 (https://github.com/kuppal2/xmsPANDA) in R (4.1.0). False discovery correction (Benjamini-Hochberg false discovery method, FDR) [21] was applied to account for multiple hypothesis testing correction (q <0.05; q<0.2). Two-way hierarchical clustering analysis (HCA; hclust()) plots were used to identify patterns of selected features in an unsupervised manner. Principal component analysis (PCA) was performed using the pca function implemented in the R package pcaMethods.
2.5. Metabolic Pathway Enrichment Analysis
Pathway enrichment analyses were performed on the differentially expressed features identified above using mummichog 2.2 [22]. Selected thresholds for significance were set to a p-value <0.05, detection of the primary metabolite ion (M+H), a 5 ppm drift tolerance, and 1000 permutation tests in order to protect from Type I error, and to increase accurate metabolic annotation. Using corrplot in R, bubble plots of the significant metabolic pathways were generated, using both the size and the color of the bubble to represent the pathway significance level based on the -log10 P value.
2.6. Statistics
Non-metabolomic data are expressed as means ± SE. Data were analyzed using Prism 6.0 (GraphPad, La Jolla, CA). All data were tested for homogeneity of variances, logarithmically transformed when indicated, and analyzed by two-way ANOVA with Tukey’s post hoc test. Significance was accepted at p < 0.05.
3. Results
3.1. ATG increases survival in females.
Male and female mice were treated with saline or ATG and exposed to >95% O2. In saline-treated males, 100% death occurred at 124 h and in ATG-treated males at 146h. Females were more resistant than males to hyperoxia exposure with saline-treated females surviving to 191 h and ATG-treated females surviving greater than 200 h, the time point at which the experiment was terminated (Figure 1A,B).
3.2. Hyperoxia increases right lung/body weight ratios at 96hrs.
Right lung to body weight ratios were calculated as a measure of pulmonary edema. Hyperoxia exposure caused minimal increases in right lung to body weight ratios with only a statistical increase in saline-treated females (Figure 1C).
3.3. Differentially expressed metabolites between treatment/exposure and sex.
Metabolomic data was analyzed using MWAS, comparing treatment, exposure, and sex independently using LIMMA. A value of 0.05 was used for raw data (p<0.05) and FDR corrected data (q<0.05, except where indicated). Table 1 provides a summary of the analyses with the number of significant features (FDR) and raw metabolite numbers.
3.3.1. Analyses by treatment/exposure
Analyses of differentially expressed metabolites due to oxygen exposure alone caused a change in the expression levels of 1876 metabolites with p<0.05 and 1160 metabolites with q<0.05 (Figure 2A). 512 metabolites increased and 647 metabolites decreased in oxygen exposure as indicated by the heatmap in Figure 2B. An OPLS-DA plot demonstrates significant separation between exposure groups with more variability in the saline/O2 group than the saline/RA group (Figure 2C). Individual metabolites of the GSH and selenocysteine pathways were selected for further analyses. Metabolites associated with redox pathways, specifically glutathione and selenocysteine were identified and graphed using raw intensity levels. Two-way ANOVA with Tukey’s posthoc indicated increases in homocysteine and selenocystathionine with oxygen exposure (Figure 2D).
Analyses of differentially expressed metabolites due to saline or ATG treatment in addition to oxygen exposure yielded 583 metabolites with p<0.05 but only four metabolites with a value of q<0.2 (Figure 3A). 285 metabolites increased and 298 metabolites decreased with ATG treatment in oxygen as indicated by the heatmap in Figure 3B. The OPLS-DA plot indicates that separation between groups is similar to other treatment/exposure comparisons but the within group variability is less than other comparisons (Figure 3C). Analyses of individual redox metabolites indicated only minor differences between groups (Figure 3D).
Analyses of differentially expressed metabolites due to ATG treatment with and without exposure to oxygen yielded 1101 metabolites with p<0.05 and 381 metabolites with q<0.05 (Figure 4A). 564 metabolites increased and 537 metabolites decreased as demonstrated in the heatmap (Figure 4B). The OPLS-DA plot indicated similar divergence between groups and variability within groups as observed with other treatment/exposure comparisons. This would imply that many of the differentially expressed metabolites are driven by oxygen exposure (Figure 4C). Analyses of individual metabolites indicated that ATG/O2 exposures were associated with decrease in γ-glutamylcysteine, cystathionine, and selenocystathionine (Figure 4D)
3.3.2. Analyses by sex
Analyses of differentially expressed metabolites due to sex with and without exposure to oxygen or ATG treatment yielded 2467 metabolites with p<0.05 and 176 metabolites with q<0.05 (Figure 5A). Of these significant metabolites, 1216 metabolites were increased either by sex or by treatment, and 1427 metabolites were decreased as a result of sex or treatment, as demonstrated in the heatmap (Figure 5B). Overall, the males have more metabolites that are decreased than the females. The OPLS-DA plot indicated significantly greater divergence between groups and greater variability within females than observed other treatment/exposure comparisons. This would imply that differentially expressed metabolites are vastly different between sexes and that females have substantially more variability in expression (Figure 5C). Analyses of individual metabolites indicated that females had greater levels of homocysteine and selenocystathionine in response to oxygen exposure than did males (Figure 5D).
3.4. Pathway Analyses
Mummichog (v2) pathway analysis (Figure 6) indicates metabolic pathways differentially expressed between exposure groups. Only three pathways were modestly different in the saline treated, RA vs O2 exposure comparison. Interestingly 13 pathways were dramatically different in the saline vs ATG with O2 exposure comparison. This would imply that ATG causes disruption in several glycosphingolipid and carbohydrate pathways. Six pathways were identified as different in the comparison between RA and O2 in the presence of ATG. This included several amino acid pathways and several redox regulatory pathways such as glutathione and methionine and cysteine. This would imply that ATG treatment in the presence of O2 exposure may invoke redox pathways to provide protective effects.
Further analysis compared sexes with both O2 exposure and ATG treatment. ATG treatment and O2 exposure caused dramatic differences in the carnitine shuttle pathway. This might imply differences in energy metabolism as carnitine is responsible for shuttling lipids to the mitochondria. O2 exposure also caused modest differences in vitamin K, bile acid biosynthesis, and arachidonic acid pathways.
Discussion
Oxygen is an essential therapeutic for treating pulmonary disease or injury but exposure to hyperoxia can have deleterious effects. Our previous studies identified therapeutic value in ATG administration to lessen the injurious effects of hyperoxia in models.[5] The current studies investigated the mechanisms by which ATG attenuated hyperoxia-induced lung injury using a metabolomic comparison between males and females. Our new data indicate that metabolic differences are observed in response to O2 exposure or ATG treatment, and that the effects of sex are significant.
Many years of research has demonstrated that females have more robust immune responses than males, including a faster clearance of pathogens and greater responses to vaccines but an increased susceptibility to inflammatory and autoimmune diseases (reviewed by Klein and Flanagan).[11,23] Females also have a greater likelihood of developing lung pathologies such as ARDS, asthma, and more robust responses to COVID-19. [12,13,24] Coarfa et al. investigated neonatal male versus female responses to hyperoxia. [25] Using RNA seq with Gene Set Enrichment Analyses, distinct transcriptomic responses were identified and differentially expressed genes including Nrf2, Ap1, NFkB and HIF-1α, which are redox regulated transcription factors.[25]
Our initial data indicated that hyperoxia exposure and ATG treatment caused profound differences in survival between sexes (Figure 1). Hyperoxia-exposed females survived far longer than hyperoxia-exposed males with the majority of ATG-treated females still alive at the termination of the experiment at 200 h. In order to better understand the influence of sex as a biological variable on our observed outcomes, we performed metabolomic analyses on lung tissues collected at 72 h of exposure, prior to the onset of observed mortality in our experimental groups.
For initial comparisons, we grouped males and females together and evaluated impacts of ATG treatment and/or hyperoxia exposure on lung tissue metabolite expression. The metabolomic comparison between RA and hyperoxia exposure revealed the greatest number of differentially expressed metabolites (Table 1 and Figure 2A). Similar numbers of metabolites increased or decreased due to oxygen exposure (Figure 2B) and oxygen exposure caused a greater divergence in expression than was observed in RA exposed mice (Figure 2C). Homocystine and selenocystathionine were elevated in lungs from hyperoxia-exposed animals suggestive of a potential upregulation of glutathione and/or selenoprotein synthesis (Figure 2D), both of which may be protective against oxidant injury. The fewest differentially expressed metabolites were observed in the comparison between saline or ATG-treated mice exposed to hyperoxia (Table 1 and Figure 3A). The heatmap in Figure 3B further demonstrated a less distinct pattern of differences and the OPLS plot in Figure 3C indicated less divergence between the groups. Further analyses of individual metabolites indicated that only selenocystathionine was statistically different between saline-treated males and females exposed to hyperoxia (Figure 3D). This observation implies that hyperoxia exposure has a greater influence on metabolic changes than does ATG treatment. Comparison of the effects of ATG treatment in the setting of either RA or hyperoxia exposure revealed a high number of differentially expressed metabolites compared to ATG or saline treatment in lungs from hyperoxia-exposed mice (Table 1 and Figure 4A) with equal numbers of metabolites increased or decreased (Figure 4B). The OPLS plot indicated a greater divergence in the metabolites from ATG/hyperoxia-exposed lungs compared to ATG-treated mice in RA (Figure 4C). Our data revealed that the expression of the selected metabolites, γ-glutamylcysteine, cystathionine, and selenocystathionine, were lower in the longest surviving groups, the ATG-treated mice exposed to hyperoxia compared to the more susceptible ATG/RA group (Figure 4D). Collectively, the comparisons between each of these individual treatments or exposures does not account for significant differences in survival observed between males and females.
To define the impact of sex on lung metabolites in our groups, a final comparison was performed using metabolomic analyses of lung tissues from ATG or saline treated males or females exposed to hyperoxia. While the number of significant features was less than observed in our other comparisons (Table 1 and Figure 5A), the heatmap indicated differences in all groups especially between male and female mice (Figure 5B). The OPLS plot indicated dramatic differences in the distribution of metabolites in females that were not observed in males. We interpret these data to indicate that the differential response to ATG treatment and hyperoxia exposure in lungs from female mice contributes to lower mortality in females (Figure 5C). The expression of significant metabolites indicated substantially greater expression of γ-glutamylcysteine and modestly greater expression of selenocystathionine and very low expression cystathionine in females compared to males (Figure 5D). γ-glutamylcysteine is a precursor to glutathione synthesis and greater expression would imply that females ATG-treated females are more capable of glutathione synthesis upregulation than ATG-treated males. These findings are consistent with our previous report that ATG-mediated pulmonary protection, which was lost with concomitant administration of the γ-glutamylcysteine inhibitor buthionine sufoximine, is glutathione-dependent.[1] Our findings of differential enhancement of glutathione synthesis in females vs males in response to ATG are consistent with the findings of Coarfa et al. who demonstrated that redox transcriptomic responses were regulated in the opposite directions for males vs females in response to hyperoxia exposure.[25]
Metabolomic pathway analysis for each of the comparisons revealed the greatest differences between lungs from hyperoxia-exposed animals treated with saline vs ATG (Figure 6). These differences were most profound in metabolites belonging to the keratin sulfate (KS) and glycosphingolipid (GSL) biosynthesis pathways. KS refers to several sulfated glycosaminoglycans that are large, highly hydrated molecules. Typically, they are found in the cornea, cartilage, and bone and can act as a cushion to absorb mechanical shock [26]. GSLs are a large group of bioactive lipids that play major roles in membrane structure, regulation of receptors and ion transporters, and cell-cell communication [27,28,29]. GSLs consist of a hydrophobic ceramide backbone and glucosidic carbohydrate. The subgroups are distinguished by the specific carbohydrate bound or the addition of other moieties. Both KSs and GSLs are formed in the endoplasmic reticulum and then trafficked to the Golgi for the addition of other functional groups. The species formed depends upon the substates available and the specific enzyme acting upon the core molecule moiety. In the lung, KSs are expressed in the interstitial, subepithelial tissues, bronchial walls, and in airway secretions. Gao, et al. demonstrated that L4, a specific KS, is protective in a mouse model of COPD by decreasing the number of inflammatory cells, cytokines, and MMP expression [30]. Alternatively, sphingolipids are essential to the interaction of leukocytes with the blood vessel wall during inflammation and are involved in production of reactive oxygen species and airway remodeling in both bronchopulmonary dysplasia and COPD [28,29]. Within the cell, GSLs can interact with several receptors including epidermal growth factor receptor, platelet derived growth factor receptor, fibroblast growth factor receptor, and insulin receptor. We proposed that ATG-mediated differences in KS and GSL levels in hyperoxia may significantly dampen inflammatory responses and enhance repair processes in our experimental model. In the setting of hyperoxia, increases in KS and GSL may account for improved survival of ATG-treated mice.
A substantial difference was indicted between male and female mice in carnitine shuttle both with oxygen exposure or ATG treatment (Figure 6). Carnitine shuttle is associated with lipid metabolism and transport to the mitochondria for energy production. This observation would indicate that energy metabolism is substantially different between males and females in the setting of oxidant stress. Other than carnitine shuttle, there were no other shared pathway discrepancies identified between ATG treatment and hyperoxia exposure when comparing male and female mice.
5. Conclusions
Our data add to our body of work demonstrating the protective effects of ATG pre-treatment on O2 tolerance in mice. Cumulatively, our work suggests that the improved survival of hyperoxia-exposed ATG-treated female C3H mice is likely driven by enhanced glutathione synthesis, energy production, and metabolism resulting in decreased lung injury through modulation of KS and GSL levels. These findings may provide direction for further research to improve outcomes after hyperoxia exposure.
6. Patents
This section is not mandatory but may be added if there are patents resulting from the work reported in this manuscript.
Author Contributions
Conceptualization, T.E.T., and K.D-R.; methodology, K.D-R., and V.T.; formal analysis, M.R.S. and H.Z.; investigation, K.D-R., V.L., M.S., S.B.M.; resources, T.E.T, D.P.J.; writing—original draft preparation, J.F., K.D-R., and L.K.R.; writing—review and editing, L.K.R. and T.E.T.; funding acquisition, T.E.T. All authors have read and agreed to the published version of the manuscript.
Funding
This work was supported by grants from The American Thoracic Society Foundation Research Program (T.E.T.), the National Institutes of Health R01HL119280 (T.E.T.), and US Department of Veterans Affairs 1IK2BX005913-01A2 (M.R.S.).
Institutional Review Board Statement
The animal study protocol was approved by the Institutional Animal Care and Use Committee at the University of Alabama Birmingham (IACUC # 20001). All procedures were carried out according to the approved protocol and meet the American Veterinary Medical Association Guidelines (2020). Additionally, studies were conducted in accordance with ARRIVE guidelines.
Informed Consent Statement
Not applicable.
Data Availability Statement
The metabolomic data presented in this study are available in Metabolomics Workbench [http://dev.metabolomicsworkbench.org:22222/data/DRCCMetadata.php?Mode=Study&StudyID=ST002264&Access=MzxA3369] at [http://dx.doi.org/10.21228/M8T70R].
Acknowledgments
The authors acknowledge Vivian Lin, Mary Silverberg, Stephanie B. Moore, Jolyn Fernanades for their technical assistance.
Conflicts of Interest
The authors declare no conflicts of interest.
Abbreviations
The following abbreviations are used in this manuscript:
| ATG | Aurothioglucose |
| GSH | Reduced glutathione |
| OPLS-DA | Orthogonal least partial squares discriminant analyses |
| FDR | False discovery rate |
References
- Britt, R.D., Jr.; Velten, M.; Locy, M.L.; Rogers, L.K.; Tipple, T.E. The thioredoxin reductase-1 inhibitor aurothioglucose attenuates lung injury and improves survival in a murine model of acute respiratory distress syndrome. Antioxid. Redox Signal 2014, 20, 2681–91. [Google Scholar] [CrossRef] [PubMed]
- Li, Q.; Li, R.; Wall, S.B.; Dunigan, K.; Ren, C.; Jilling, T.; Rogers, L.K.; Tipple, T.E. Aurothioglucose does not improve alveolarization or elicit sustained Nrf2 activation in C57BL/6 models of bronchopulmonary dysplasia. Am. J. Physiol. Lung Cell Mol. Physiol. 2018, 314, L736–L42. [Google Scholar] [CrossRef] [PubMed]
- Dunigan, K.; Li, Q.; Li, R.; Locy, M.L.; Wall, S.; Tipple, T.E. The thioredoxin reductase inhibitor auranofin induces heme oxygenase-1 in lung epithelial cells via Nrf2-dependent mechanisms. Am. J. Physiol. Lung Cell Mol. Physiol. 2018, 315, L545–L52. [Google Scholar] [CrossRef] [PubMed]
- Wall, S.B.; Wood, R.; Dunigan, K.; Li, Q.; Li, R.; Rogers, L.K.; Tipple, T.E. Thioredoxin Reductase-1 Inhibition Augments Endogenous Glutathione-Dependent Antioxidant Responses in Experimental Bronchopulmonary Dysplasia. Oxid. Med. Cell Longev. 2019, 2019, 7945983. [Google Scholar] [CrossRef] [PubMed]
- Li, Q.; Wall, S.B.; Ren, C.; Velten, M.; Hill, C.L.; Locy, M.L.; Rogers, L.K.; Tipple, T.E. Thioredoxin Reductase Inhibition Attenuates Neonatal Hyperoxic Lung Injury and Enhances Nrf2 Activation. Am. J. Respir. Cell Mol. Biol. 2016. [Google Scholar] [CrossRef] [PubMed]
- Locy, M.L.; Rogers, L.K.; Prigge, J.R.; Schmidt, E.E.; Arner, E.S.; Tipple, T.E. Thioredoxin Reductase Inhibition Elicits Nrf2-Mediated Responses in Clara Cells: Implications for Oxidant-Induced Lung Injury. Antioxid. Redox Signal 2012. [Google Scholar] [CrossRef] [PubMed]
- Gromer, S.; Arscott, L.D.; Williams, C.H., Jr.; Schirmer, R.H.; Becker, K. Human placenta thioredoxin reductase. Isolation of the selenoenzyme, steady state kinetics, and inhibition by therapeutic gold compounds. J. Biol. Chem. 1998, 273, 20096–101. [Google Scholar] [CrossRef] [PubMed]
- Tipple, T.E.; Welty, S.E.; Rogers, L.K.; Hansen, T.N.; Choi, Y.E.; Kehrer, J.P.; Smith, C.V. Thioredoxin-related mechanisms in hyperoxic lung injury in mice. Am. J. Respir. Cell Mol. Biol. 2007, 37, 405–13. [Google Scholar] [CrossRef] [PubMed]
- Li, Q.; Wall, S.B.; Ren, C.; Velten, M.; Hill, C.L.; Locy, M.L.; Rogers, L.K.; Tipple, T.E. Thioredoxin Reductase Inhibition Attenuates Neonatal Hyperoxic Lung Injury and Enhances Nuclear Factor E2-Related Factor 2 Activation. Am. J. Respir. Cell Mol. Biol. 2016, 55, 419–28. [Google Scholar] [CrossRef] [PubMed]
- Tondo, P.; Meschi, C.; Mantero, M.; Scioscia, G.; Siciliano, M.; Bradicich, M.; Stella, G.M. Italian Respiratory Society TFoGM: Sex and gender differences during the lung lifespan: unveiling a pivotal impact. Eur. Respir. Rev. 2025, 34. [Google Scholar]
- Klein, S.L.; Flanagan, K.L. Sex differences in immune responses. Nat. Rev. Immunol. 2016, 16, 626–38. [Google Scholar] [CrossRef] [PubMed]
- Zein, J.G.; Erzurum, S.C. Asthma is Different in Women. Curr. Allergy Asthma Rep. 2015, 15, 28. [Google Scholar] [CrossRef] [PubMed]
- Heffernan, D.S.; Dossett, L.A.; Lightfoot, M.A.; Fremont, R.D.; Ware, L.B.; Sawyer, R.G.; May, A.K. Gender and acute respiratory distress syndrome in critically injured adults: a prospective study. J. Trauma 2011, 71, 878-83; discussion 83-5. [Google Scholar] [CrossRef]
- McNicholas, B.A.; Madotto, F.; Pham, T.; Rezoagli, E.; Masterson, C.H.; Horie, S.; Bellani, G.; Brochard, L.; Laffey, J.G. Investigators LS, the ETG: Demographics, management and outcome of females and males with acute respiratory distress syndrome in the LUNG SAFE prospective cohort study. Eur. Respir. J. 2019, 54. [Google Scholar]
- Heyob, K.M.; Rogers, L.K.; Tipple, T.E.; Welty, S.E. Riboflavin supplementation does not attenuate hyperoxic lung injury in transgenic (spc-mt)hGR mice. Exp. Lung Res. 2011, 37, 155–61. [Google Scholar] [PubMed]
- Fernandes, J.; Dunigan-Russell, K.; Zhong, H.; Lin, V.; Silverberg, M.; Moore, S.B.; Tran, V.; Jones, D.P.; Vitiello, P.F.; Rogers, L.K.; Tipple, T.E. Transcriptomic-Metabolomic Profiling in Mouse Lung Tissues Reveals Sex- and Strain-Based Differences. Metabolites 2022, 12. [Google Scholar] [CrossRef] [PubMed]
- Liu, K.H.; Nellis, M.; Uppal, K.; Ma, C.; Tran, V.; Liang, Y.; Walker, D.I.; Jones, D.P. Reference Standardization for Quantification and Harmonization of Large-Scale Metabolomics. Anal. Chem. 2020, 92, 8836–44. [Google Scholar] [CrossRef] [PubMed]
- Yu, T.; Park, Y.; Johnson, J.M.; Jones, D.P. apLCMS--adaptive processing of high-resolution LC/MS data. Bioinformatics 2009, 25, 1930–6. [Google Scholar] [CrossRef] [PubMed]
- Uppal, K.; Soltow, Q.A.; Strobel, F.H.; Pittard, W.S.; Gernert, K.M.; Yu, T.; Jones, D.P. xMSanalyzer: automated pipeline for improved feature detection and downstream analysis of large-scale, non-targeted metabolomics data. BMC Bioinform. 2013, 14, 15. [Google Scholar] [CrossRef]
- Ritchie, M.E.; Phipson, B.; Wu, D.; Hu, Y.; Law, C.W.; Shi, W.; Smyth, G.K. limma powers differential expression analyses for RNA-sequencing and microarray studies. Nucleic Acids Res. 2015, 43, e47. [Google Scholar] [CrossRef] [PubMed]
- Benjamini, Y.; Hochberg, Y. Controlling the False Discovery Rate: A Practical and Powerful Approach to Multiple Testing. J. R. Stat. Soc. Ser. B (Methodological) 1995, 57, 289–300. [Google Scholar] [CrossRef]
- Li, S.; Park, Y.; Duraisingham, S.; Strobel, F.H.; Khan, N.; Soltow, Q.A.; Jones, D.P.; Pulendran, B. Predicting network activity from high throughput metabolomics. PLoS Comput. 2013, 9, e1003123. [Google Scholar] [CrossRef]
- Giefing-Kroll, C.; Berger, P.; Lepperdinger, G.; Grubeck-Loebenstein, B. How sex and age affect immune responses, susceptibility to infections, and response to vaccination. Aging Cell 2015, 14, 309–21. [Google Scholar] [CrossRef] [PubMed]
- Kharroubi, S.A.; Diab-El-Harake, M. Sex-differences in COVID-19 diagnosis, risk factors and disease comorbidities: A large US-based cohort study. Front Public Health 2022, 10, 1029190. [Google Scholar] [CrossRef] [PubMed]
- Coarfa, C.; Zhang, Y.; Maity, S.; Perera, D.N.; Jiang, W.; Wang, L.; Couroucli, X.; Moorthy, B.; Lingappan, K. Sexual dimorphism of the pulmonary transcriptome in neonatal hyperoxic lung injury: identification of angiogenesis as a key pathway. Am. J. Physiol. Lung Cell Mol. Physiol. 2017, 313, L991–L1005. [Google Scholar] [CrossRef] [PubMed]
- Caterson, B.; Melrose, J. Keratan sulfate, a complex glycosaminoglycan with unique functional capability. Glycobiology 2018, 28, 182–206. [Google Scholar] [CrossRef] [PubMed]
- Hannun, Y.A.; Merrill, A.H., Jr.; Luberto, C. The bioactive sphingolipid playbook. A primer for the uninitiated as well as sphingolipidologists. J. Lipid Res. 2025, 66, 100813. [Google Scholar] [CrossRef] [PubMed]
- Thomas, J.M.; Sudhadevi, T.; Basa, P.; Ha, A.W.; Natarajan, V.; Harijith, A. The Role of Sphingolipid Signaling in Oxidative Lung Injury and Pathogenesis of Bronchopulmonary Dysplasia. Int. J. Mol. Sci. 2022, 23. [Google Scholar] [CrossRef] [PubMed]
- Koike, K.; Berdyshev, E.V.; Bowler, R.P.; Scruggs, A.K.; Cao, D.; Schweitzer, K.S.; Serban, K.A.; Petrache, I. Bioactive Sphingolipids in the Pathogenesis of Chronic Obstructive Pulmonary Disease. Ann. Am. Thorac. Soc. 2018, 15, S249–S52. [Google Scholar] [CrossRef] [PubMed]
- Gao, C.; Fujinawa, R.; Yoshida, T.; Ueno, M.; Ota, F.; Kizuka, Y.; Hirayama, T.; Korekane, H.; Kitazume, S.; Maeno, T.; Ohtsubo, K.; Yoshida, K.; Yamaguchi, Y.; Lepenies, B.; Aretz, J.; Rademacher, C.; Kabata, H.; Hegab, A.E.; Seeberger, P.H.; Betsuyaku, T.; Kida, K.; Taniguchi, N. A keratan sulfate disaccharide prevents inflammation and the progression of emphysema in murine models. Am. J. Physiol. Lung Cell Mol. Physiol. 2017, 30 312, L268–L76. [Google Scholar] [CrossRef]
Figure 1.
Survival in C3H/HeN male and female mice treated with saline or ATG and exposed to 95% O2. A) Survival was assessed up to 200 h at which time the experiment was terminated. Survival curves were analyzed by Mantel-Cox log rank, p<0.0001. B) The median survival time for each treatment group and sex is provided. C) Body weight and right lung weight were assessed at euthanasia and ratios are presented as means and SEM. Data were analyzed by one-way ANOVA with Tukey’s multiple comparisons post hoc.
Figure 1.
Survival in C3H/HeN male and female mice treated with saline or ATG and exposed to 95% O2. A) Survival was assessed up to 200 h at which time the experiment was terminated. Survival curves were analyzed by Mantel-Cox log rank, p<0.0001. B) The median survival time for each treatment group and sex is provided. C) Body weight and right lung weight were assessed at euthanasia and ratios are presented as means and SEM. Data were analyzed by one-way ANOVA with Tukey’s multiple comparisons post hoc.
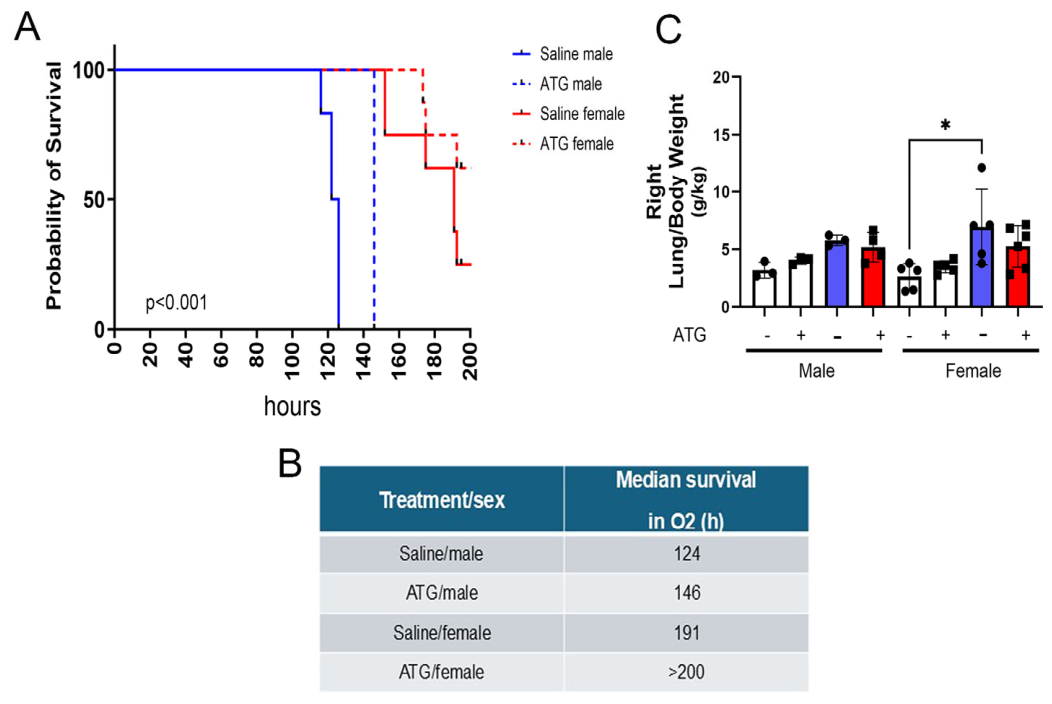
Figure 2.
Metabolomic data was analyzed using log2 transformed spectral intensities. Differential expression analysis used linear models generated from limma package in R using xmsPANDA. Differentially expressed metabolites due to RA or O2 exposure yielded changes in metabolite expression levels. A) Manhattan plot displaying the distribution of -log10(p) values against mass-to-charge ratio (mz). With color intensity corresponding to the -log10(p) value as indicated by the color scale on the right. The red dashed horizontal line and blue dashed horizontal line represent the significance threshold p=0.05 and threshold q=0.05 respectively. B) Two-way hierarchal heatmap of the significant metabolite features between saline treated, RA or O2 exposed conditions. The normalized z-score is represented by a color gradient from blue to red, indicating downregulated and upregulated values respectively. C) OPLS-DA scores plot illustrates the separation between two experimental groups: saline treated, RA or O2 exposed. Circles and triangles represent female and male mice respectively. Separation is 27.7% on x-axis and 15.6% on y-axis. D) Differentially expressed glutathione and selenoprotein metabolites were plotted as individual graphs. Data were analyzed by two-way ANOVA with Tukey’s post hoc. *p<0.05, **p<0.005, ***p<0.001.
Figure 2.
Metabolomic data was analyzed using log2 transformed spectral intensities. Differential expression analysis used linear models generated from limma package in R using xmsPANDA. Differentially expressed metabolites due to RA or O2 exposure yielded changes in metabolite expression levels. A) Manhattan plot displaying the distribution of -log10(p) values against mass-to-charge ratio (mz). With color intensity corresponding to the -log10(p) value as indicated by the color scale on the right. The red dashed horizontal line and blue dashed horizontal line represent the significance threshold p=0.05 and threshold q=0.05 respectively. B) Two-way hierarchal heatmap of the significant metabolite features between saline treated, RA or O2 exposed conditions. The normalized z-score is represented by a color gradient from blue to red, indicating downregulated and upregulated values respectively. C) OPLS-DA scores plot illustrates the separation between two experimental groups: saline treated, RA or O2 exposed. Circles and triangles represent female and male mice respectively. Separation is 27.7% on x-axis and 15.6% on y-axis. D) Differentially expressed glutathione and selenoprotein metabolites were plotted as individual graphs. Data were analyzed by two-way ANOVA with Tukey’s post hoc. *p<0.05, **p<0.005, ***p<0.001.
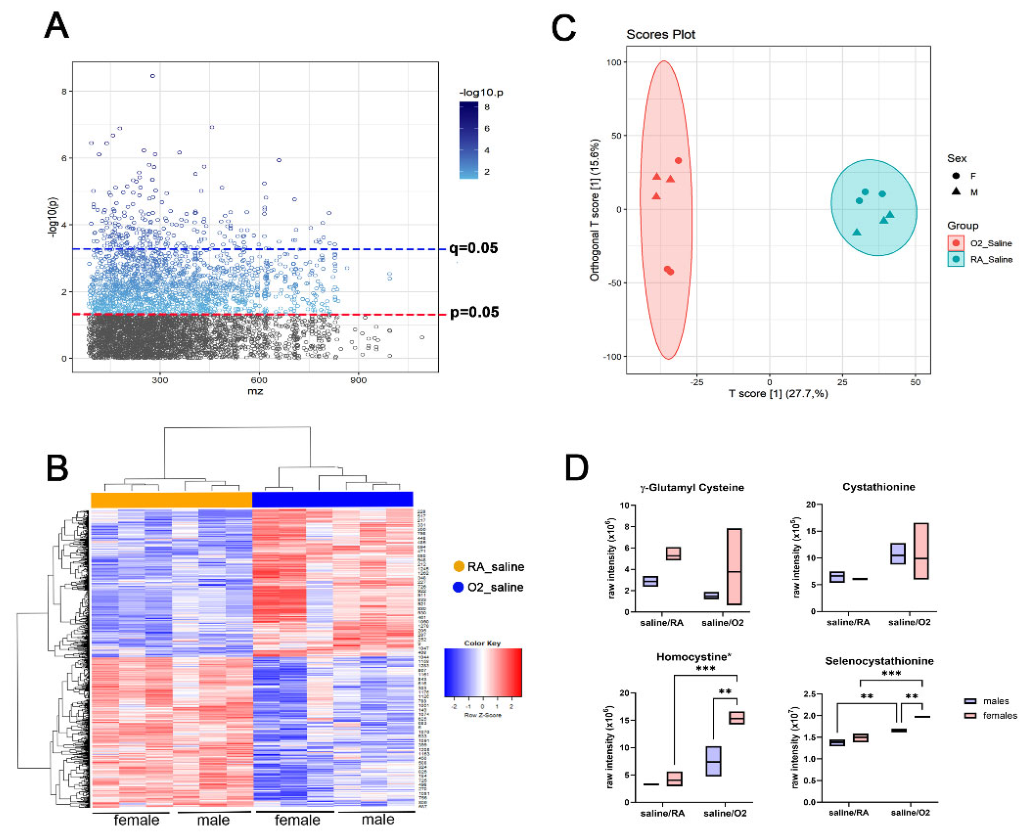
Figure 3.
Metabolomic data was analyzed using log2 transformed spectral intensities. Differential expression analysis used linear models generated from limma package in R using xmsPANDA. Differentially expressed metabolites due to saline or ATG treatment with O2 exposure caused changes in metabolite expression levels. A) Manhattan plot displaying the distribution of -log10(p) values against mass-to-charge ratio (mz). With color intensity corresponding to the -log10(p) value as indicated by the color scale on the right. The red dashed horizontal line and blue dashed horizontal line represent the significance threshold p=0.05 and threshold q=0.05 respectively. B) Two-way hierarchal heatmap of the significant metabolite features between saline or ATG treated, O2 exposed conditions. The normalized z-score is represented by a color gradient from blue to red, indicating downregulated and upregulated values respectively. C) OPLS-DA scores plot illustrating the separation between two experimental groups: saline or ATG treated, O2 exposed. Circles and triangles represent female and male respectively. Separation is along with 14.3% on x-axis and 19.7% on y-axis. D) Differentially expressed glutathione and selenoprotein metabolites were plotted as individual graphs. Data were analyzed by two-way ANOVA with Tukey’s post hoc. *p<0.05, **p<0.005, ***p<0.001.
Figure 3.
Metabolomic data was analyzed using log2 transformed spectral intensities. Differential expression analysis used linear models generated from limma package in R using xmsPANDA. Differentially expressed metabolites due to saline or ATG treatment with O2 exposure caused changes in metabolite expression levels. A) Manhattan plot displaying the distribution of -log10(p) values against mass-to-charge ratio (mz). With color intensity corresponding to the -log10(p) value as indicated by the color scale on the right. The red dashed horizontal line and blue dashed horizontal line represent the significance threshold p=0.05 and threshold q=0.05 respectively. B) Two-way hierarchal heatmap of the significant metabolite features between saline or ATG treated, O2 exposed conditions. The normalized z-score is represented by a color gradient from blue to red, indicating downregulated and upregulated values respectively. C) OPLS-DA scores plot illustrating the separation between two experimental groups: saline or ATG treated, O2 exposed. Circles and triangles represent female and male respectively. Separation is along with 14.3% on x-axis and 19.7% on y-axis. D) Differentially expressed glutathione and selenoprotein metabolites were plotted as individual graphs. Data were analyzed by two-way ANOVA with Tukey’s post hoc. *p<0.05, **p<0.005, ***p<0.001.
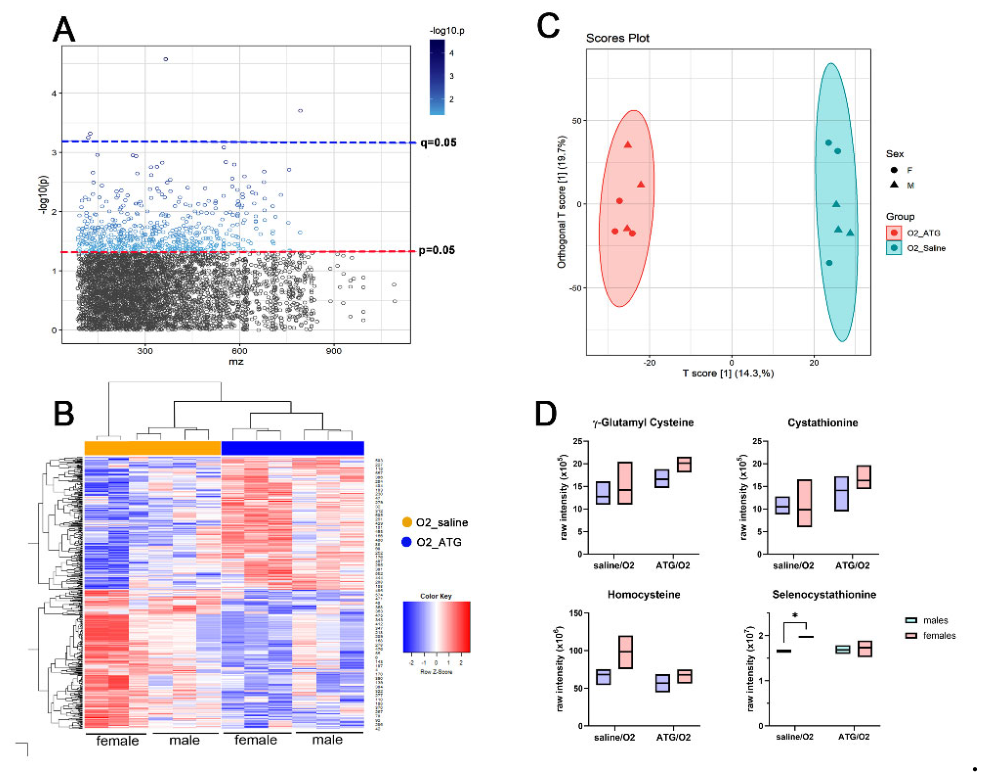
Figure 4.
Metabolomic data was analyzed using log2 transformed spectral intensities. Differential expression analysis used linear models generated from limma package in R using xmsPANDA. Differentially expressed metabolites due to ATG treatment with RA or O2 exposure caused changes in metabolite expression levels. A) Manhattan plot displaying the distribution of -log10(p) values against mass-to-charge ratio (mz). With color intensity corresponding to the -log10(p) value as indicated by the color scale on the right. The red dashed horizontal line and blue dashed horizontal line represent the significance threshold p = 0.05 and threshold q = 0.05 respectively. B) Two-way hierarchal heatmap of the significant metabolite features between ATG treated, RA or O2 exposed conditions. The normalized z-score is represented by a color gradient from blue to red, indicating downregulated and upregulated values respectively. C) OPLS-DA scores plot illustrating the separation between two experimental groups: ATG treated. RA or O2 exposed. Circle and triangle represent female and male respectively. Separation is along with 18.7% on x-axis and 19.4% on y-axis. D) Differentially expressed glutathione and selenoprotein metabolites were plotted as individual graphs. Data were analyzed by two-way ANOVA with Tukey’s post hoc. *p<0.05, **p<0.005, ***p<0.001.
Figure 4.
Metabolomic data was analyzed using log2 transformed spectral intensities. Differential expression analysis used linear models generated from limma package in R using xmsPANDA. Differentially expressed metabolites due to ATG treatment with RA or O2 exposure caused changes in metabolite expression levels. A) Manhattan plot displaying the distribution of -log10(p) values against mass-to-charge ratio (mz). With color intensity corresponding to the -log10(p) value as indicated by the color scale on the right. The red dashed horizontal line and blue dashed horizontal line represent the significance threshold p = 0.05 and threshold q = 0.05 respectively. B) Two-way hierarchal heatmap of the significant metabolite features between ATG treated, RA or O2 exposed conditions. The normalized z-score is represented by a color gradient from blue to red, indicating downregulated and upregulated values respectively. C) OPLS-DA scores plot illustrating the separation between two experimental groups: ATG treated. RA or O2 exposed. Circle and triangle represent female and male respectively. Separation is along with 18.7% on x-axis and 19.4% on y-axis. D) Differentially expressed glutathione and selenoprotein metabolites were plotted as individual graphs. Data were analyzed by two-way ANOVA with Tukey’s post hoc. *p<0.05, **p<0.005, ***p<0.001.
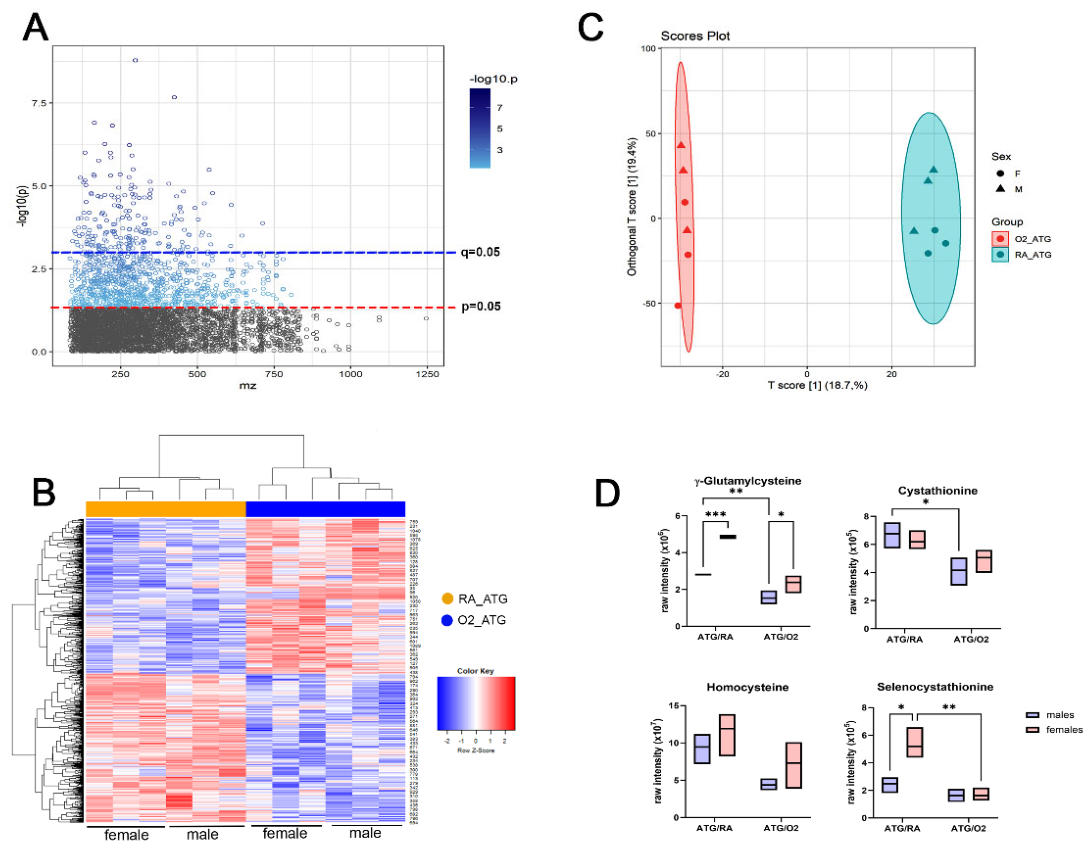
Figure 5.
Metabolomic data was analyzed using log2 transformed spectral intensities. Differential expression analysis used linear models generated from limma package in R using xmsPANDA. Differentially expressed metabolites due to saline or ATG treatment with O2 exposure caused changes in metabolite expression levels. A) Manhattan plot displaying the distribution of -log10(p) values against mass-to-charge ratio (mz). The red dashed horizontal line and blue dashed horizontal line represent the significance threshold p = 0.05 and threshold q = 0.05 respectively. B) Two-way hierarchal heatmap of the significant metabolite features between saline or ATG treated, O2 exposed, males or females. The normalized z-score is represented by a color gradient from blue to red, indicating downregulated and upregulated values respectively. C) OPLS-DA scores plot illustrating the separation between experimental groups: saline or ATG, O2 exposed, males and females. Circle and triangle represent female and male respectively. Separation is along with 16.4% on x-axis and 18.4% on y-axis. D) Differentially expressed glutathione and selenoprotein metabolites were plotted as individual graphs. Data were analyzed by two-way ANOVA with Tukey’s post hoc. *p<0.05, **p<0.005, ***p<0.001.
Figure 5.
Metabolomic data was analyzed using log2 transformed spectral intensities. Differential expression analysis used linear models generated from limma package in R using xmsPANDA. Differentially expressed metabolites due to saline or ATG treatment with O2 exposure caused changes in metabolite expression levels. A) Manhattan plot displaying the distribution of -log10(p) values against mass-to-charge ratio (mz). The red dashed horizontal line and blue dashed horizontal line represent the significance threshold p = 0.05 and threshold q = 0.05 respectively. B) Two-way hierarchal heatmap of the significant metabolite features between saline or ATG treated, O2 exposed, males or females. The normalized z-score is represented by a color gradient from blue to red, indicating downregulated and upregulated values respectively. C) OPLS-DA scores plot illustrating the separation between experimental groups: saline or ATG, O2 exposed, males and females. Circle and triangle represent female and male respectively. Separation is along with 16.4% on x-axis and 18.4% on y-axis. D) Differentially expressed glutathione and selenoprotein metabolites were plotted as individual graphs. Data were analyzed by two-way ANOVA with Tukey’s post hoc. *p<0.05, **p<0.005, ***p<0.001.
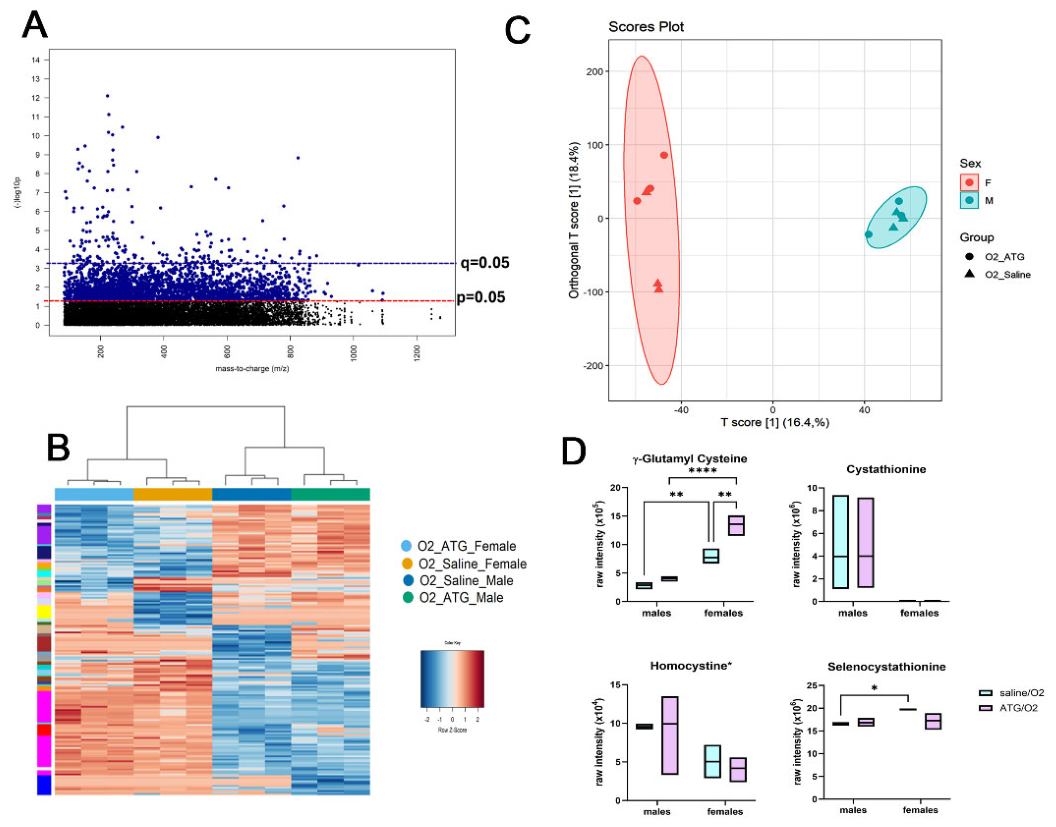
Figure 6.
Pathway enrichment analyses were performed on the differentially expressed features identified above using mummichog 2.2. Selected thresholds for significance were set to a p-value <0.05. Bubble plots of the significant metabolic pathways were generated, using both the size and the color of the bubble to represent the pathway significance level based on the -log10 P value.
Figure 6.
Pathway enrichment analyses were performed on the differentially expressed features identified above using mummichog 2.2. Selected thresholds for significance were set to a p-value <0.05. Bubble plots of the significant metabolic pathways were generated, using both the size and the color of the bubble to represent the pathway significance level based on the -log10 P value.
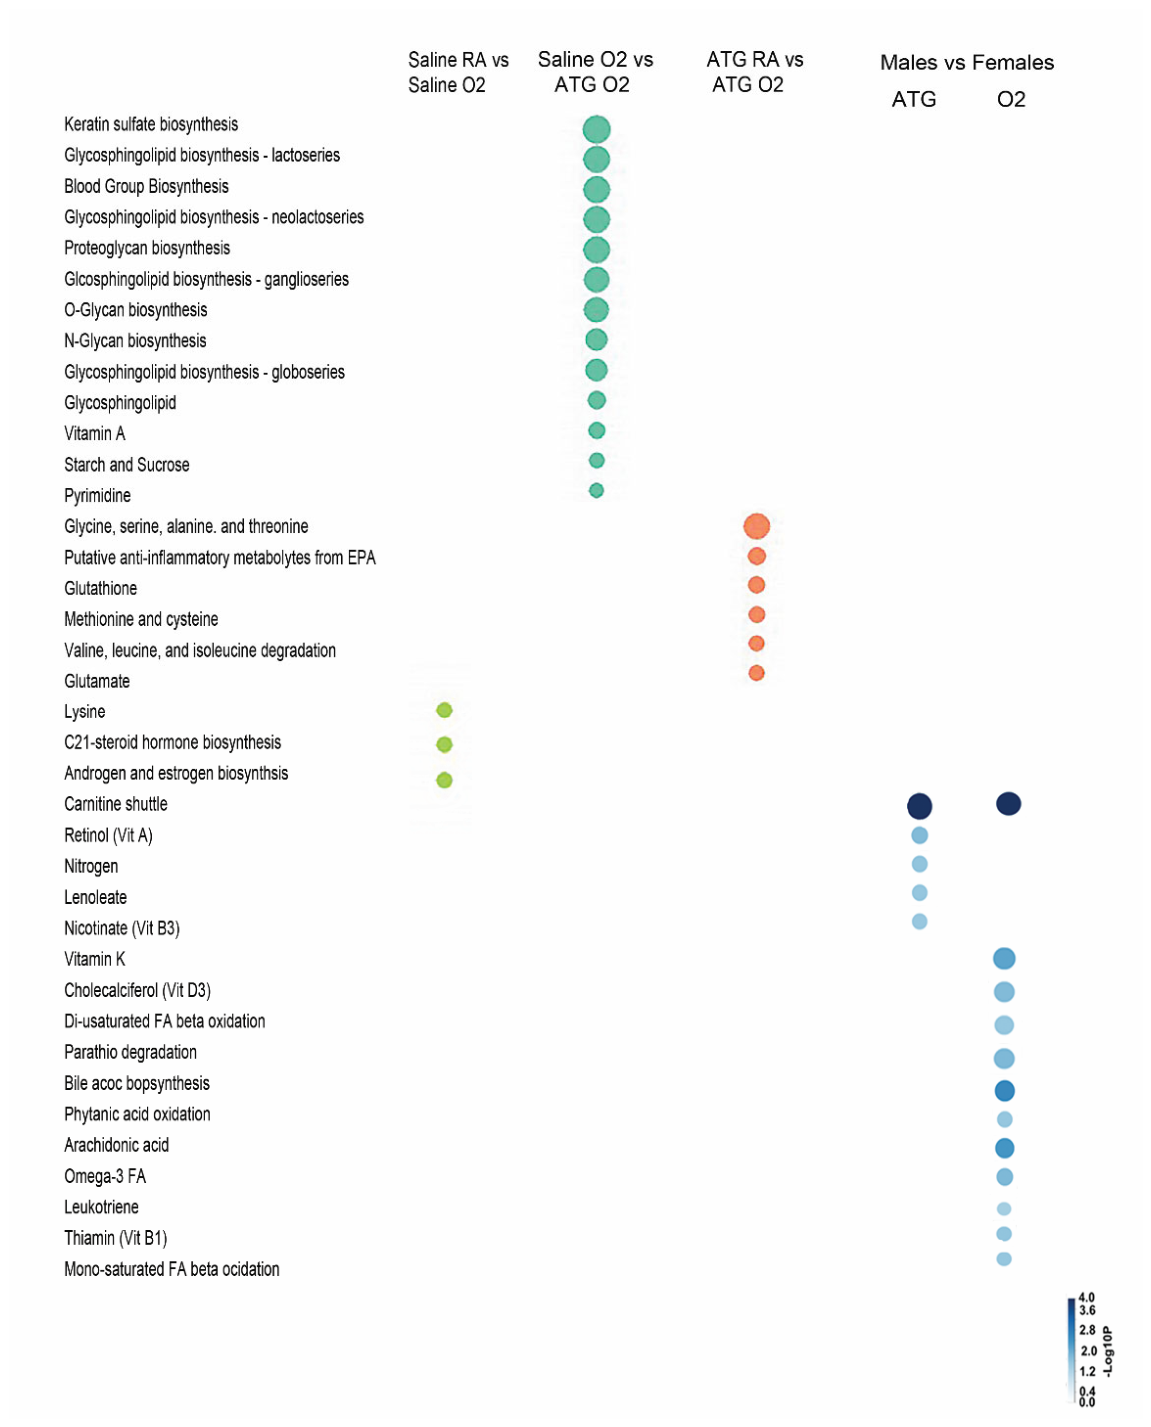

Table 1.
Results of treatment/exposure in C3H and C57B mice with ATG and/or O2.
| Comparison | FDR (BH),Q= | p-Value |
Significant Features:raw |
|
| Saline RA vs saline O2 | 0.05 | 0.05 | 1160;1876 | |
| Saline O2 vs ATG O2 | 0.20 | 0.05 | 1;583 | |
| ATG RA vs ATG O2 | 0.05 | 0.05 | 381;1101 | |
| MvF vs O2 vs ATG | 0.05 | 0.05 | 176; 2467 | |
Disclaimer/Publisher’s Note: The statements, opinions and data contained in all publications are solely those of the individual author(s) and contributor(s) and not of MDPI and/or the editor(s). MDPI and/or the editor(s) disclaim responsibility for any injury to people or property resulting from any ideas, methods, instructions or products referred to in the content. |
© 2026 by the authors. Licensee MDPI, Basel, Switzerland. This article is an open access article distributed under the terms and conditions of the Creative Commons Attribution (CC BY) license (http://creativecommons.org/licenses/by/4.0/).
Copyright: This open access article is published under a Creative Commons CC BY 4.0 license, which permit the free download, distribution, and reuse, provided that the author and preprint are cited in any reuse.


