

Submitted:
16 July 2026
Posted:
17 July 2026
You are already at the latest version
Abstract
Bahrain relies heavily on centralized seawater desalination, driven by minimal rainfall (70–80mm/year), high evaporation (>2,000 mm/year), and depleted groundwater, while conventional reverse osmosis and multi-stage-flash systems demand 3–22kWh/m³ and grid scale infrastructure. This paper presents the thermal design, analytical modeling, experimental validation and performance evaluation of a passive single slope solar still adapted to Bahrain's climate. Using energy balance equations and Dunkle's correlation for internal heat and mass transfer, hourly simulation under representative summer conditions (G=850W/m², Ta = 40°C, Vw=3m/s) predicts a baseline productivity of 2.05L/m²/day at 34% thermal efficiency. Experimental measurements obtained from a fabricated prototype showed good agreement with the model. Sensitivity analyses across water depth (0.02–0.15m) and glass tilt (15°–35°) identify design tradeoffs, and three enhancement strategies; latent heat recovery, basin fins, and an external air cooled condenser raise productivity to 2.93L/m²/day (+43%) in combination. The design projects 720L/m²/year at a fabrication cost of ~68BHD, supporting a viable commercial deployment pathway aligned with Bahrain Vision 2030 and the United Nations Sustainable Development Goals (SDGs) 6 (Clean Water and Sanitation), 7 (Affordable and Clean Energy), 9 (Industry, Innovation and Infrastructure), and 13 (Climate Action).
Keywords:
solar still
; passive desalination
; Bahrain
; thermal analysis
; Dunkle correlation
; freshwater productivity
; solar energy
I. Introduction
Bahrain is classified as one of the most water stressed nations globally. Annual rainfall averages 70–80mm while evaporation exceeds 2,000mm/year, and the Dammam aquifer, Bahrain’s primary historical freshwater source has experienced chloride concentrations above 4,000mg/L, far exceeding the WHO limit of 250mg/L [1]. Renewable freshwater availability has fallen below 5m³/person/year, well under the UN absolute scarcity threshold of 500m³/person/year [2]. Bahrain currently meets potable water demand almost entirely through desalination, at energy intensities of 3.0–22kWh/m³ [3,4].
Passive solar distillation offers zero electricity, zero chemical alternative for small scale and off-grid freshwater production. A single slope solar still uses solar radiation to evaporate saline water inside a black coated basin; vapor condenses on a cooler inclined glass cover and drains into a collection trough as purified water. While typical productivities of 2–4 L/m²/day are modest to industrial plants, the technology is appropriate for remote communities, agricultural support, and emergency water supply [5,6].
While passive solar stills have been studied extensively worldwide, their performance under Bahrain's specific combination of high humidity, high ambient temperature, and coastal wind conditions has not been systematically characterized.
II. Literature Review
Still performance is governed by four heat transfer mechanisms: solar absorption at the basin and water layer, internal convection–evaporation–radiation between the water surface and glass cover, external convection–radiation from the glass to ambient air, and conduction losses through the basin walls [5,7]. Single slope stills remain the simplest and most field proven passive configuration, with typical yields of 2–3L/m²/day; double slope designs reduce orientation sensitivity (2.5–3.5L/m²/day); hemispherical/tubular designs reach 4–5.5L/m²/day at higher fabrication cost; wick type systems (2–4L/m²/day) are prone to salt fouling; and multi effect stepped stills (4–10L/m²/day) add complexity and cost. Single slope geometry was selected here for its balance of simplicity, cost, and suitability for small scale deployment in Bahrain [6,8,9].
Table I compiles reported yields from Gulf region passive single slope solar stills under comparable climatic conditions, ranging from 2.85L/m²/day in Muscat to 4.30L/m²/day in Kafrelsheikh [10,11,12,13,14,15,16,17]. Bahrain's relatively high coastal humidity during summer (40–65% RH) reduces the vapor pressure driving force relative to drier inland sites. The predicted baseline productivity of 2.05 L/m²/day falls below the range reported for passive Gulf region solar stills, consistent with elevated coastal humidity of Bahrain, which explains why the present study targets the conservative but realistic value of ≥ 2.0 L/m²/day.
The novelty of this study lies in developing and experimentally validating a Bahrain specific thermal model for a passive single slope solar still, incorporating local climatic conditions, an annual productivity projection, and a comparative assessment of passive enhancement strategies. Unlike previous Gulf region studies that report performance under different climatic or geometric conditions, this work establishes a localized performance baseline for Bahrain and identifies practical design tradeoffs for low cost decentralized freshwater production.
III. Design Specification and Thermal Methodology
The design parameters were selected based on the literature review, material availability in Bahrain, and manufacturing simplicity. Table II summarizes the final specifications adopted. The resulting basin cross section is shown in Figure 1.
Thermal Model
The thermal behavior is described using two coupled energy balance equations, representing the saline water layer and the glass cover; the basin liner is treated as thermally lumped with the water layer, with conduction losses through the basin and side walls represented by the overall loss coefficient Ub.. For the water layer:
where qc, qe, and qr represent convective, evaporative, and radiative heat fluxes from water surface to glass cover, respectively. The glass cover balance is:
mw Cp,w (dTw/dt) = αw,eff G(t)Ab−(qc+qe+qr)Ab−Ub(Tw−Ta)Awalls
mg Cp,g (dTg/dt) = αg G(t)Ag+(qc+qe+qr)Ab−(qc,g-a + qr,g-sky)Ag
Heat Transfer Correlations
The internal convective heat transfer coefficient between the water surface and the glass cover is estimated using Dunkle's empirical correlation [5]
hc,w-g = 0.884[(Tw−Tg)+(Pw−Pg)(Tw+273.15)/(268,900−Pw)]^(1/3)
The evaporative heat-transfer coefficient is as follows [5]:
with Pw and Pg obtained from the saturation vapor-pressure relation:
he,w-g = 16.273×10⁻³ · hc,w-g · (Pw−Pg)/(Tw−Tg)
P(T) = 1000 · exp(20.386−5132/(T+273.15)) [Pa]
These coefficients define the convective, evaporative, and radiative fluxes qc, qe, and qr in Eqs. (1)–(2), and give the hourly freshwater mass production rate:
ṁew = he,w-g · (Tw−Tg) · Ab / Lv [kg/s]
External convective loss from the glass surface is estimated using the McAdams correlation: hc,g-a = 5.7 + 3.8Vw = 17 W/(m²·K) at the Bahrain mean wind speed of 3 m/s [21]. Radiative heat loss from the glass employs sky temperature relations from the literature [22,23].
The resulting saturation vapor pressure difference driving evaporative mass transfer is plotted against water temperature in Figure 2.
Hourly calculations were performed in Microsoft Excel using an Euler time stepping scheme from 06:00 to 22:00 (16 operating hours) under representative Bahrain summer conditions: peak solar irradiance G =850 W/m² at noon, ambient temperature Ta = 40°C, relative humidity RH = 55%, and wind speed Vw =3 m/s. Monthly calculations used NASA POWER irradiance data for Bahrain to project annual performance [24].
IV. Results and Discussion
A. Baseline Diurnal Performance
Under representative summer conditions, the bulk water temperature is predicted to rise from near ambient at sunrise to a peak of approximately 73°C near 13:00, while the glass cover temperature peaks lower, at approximately 53°C, a differential of up to 20°C that sustains continuous condensation through the afternoon (Figure 3). Productivity continues at a reduced rate into the evening as sensible heat stored in the basin is released, giving an estimated daily freshwater productivity of 2.05 L/m²/day at an overall thermal efficiency of 34%. The thermal efficiency is calculated using the equation (7)
where is the daily distillate mass (kg), is the latent heat of vaporization. G is the solar irradiance (W/m²), A is the basin area (m²) and is the time interval (s). The lower productivity relative to drier Gulf region sites (2.85–4.30L/m²/day; Table I) is attributable primarily to Bahrain's elevated coastal humidity (55% RH), which reduces the saturation vapor pressure difference (Pw−Pg) between the water surface and glass cover and thereby limits the evaporative driving force consistent with Al-Hinai et al. [11], who identified humidity as the dominant climatic variable reducing productivity in coastal Gulf applications.
B. Energy Balance
The daily energy balance analysis shows that approximately 76% of incident solar radiation is absorbed by the basin water system. Of the absorbed energy: 32% drives evaporation (useful output), 22% is transferred by internal convection, 25% by internal radiation, and approximately 10% is lost through basin walls and insulation, with the remainder stored as sensible heat. The 34% thermal efficiency is within the accepted range for passive single slope stills operating without enhancement systems [7,25].
The corresponding breakdown of the daily energy balance is presented in Figure 4.
C. Sensitivity Analysis: Water Depth
The estimated daily freshwater yield decreases from approximately 2.45L/m²/day at a water depth of 0.02m to approximately 1.32L/m²/day at a depth of 0.15m. Increasing water depth increases the thermal mass of the basin water, reducing its heating rate and consequently lowering the evaporation rate. Although the shallowest depth provides the highest productivity, a design depth of 0.05m was selected as a practical compromise between thermal performance, operational stability, and resistance to dry out under Bahrain summer conditions [7,25,26].

Table III.
Effect of Water Depth on Daily Freshwater Productivity.
| Depth (m) | Yield (L/m²/day) |
|---|---|
| 0.02 | 2.45 |
| 0.03 | 2.28 |
| 0.05 | 2.05 |
| 0.07 | 1.86 |
| 0.10 | 1.62 |
| 0.12 | 1.48 |
| 0.14 | 1.36 |
| 0.15 | 1.32 |
D. Sensitivity Analysis: Glass Cover Tilt
Glass cover tilt was varied from 15° to 35° while keeping all other parameters constant. As shown in Figure 5, the productivity curve exhibits a broad optimum between approximately 20° and 27°, with the highest predicted yield occurring near Bahrain’s latitude [19]. Although the absolute maximum occurs above 20°, the difference within the 20°–27° range is relatively small. Therefore, a fixed tilt angle of 20° was selected for the final design as a practical compromise between near optimum annual productivity, simple fabrication, effective condensate drainage, and compact system geometry.
E. Enhancement Strategies
The baseline design has an estimated fabrication cost of 68 BHD, based on locally available Bahraini materials and fabrication services, with the largest individual contributions coming from the tempered glass cover, fabrication labor, and basin materials. The estimated fabrication cost breakdown is presented in Table IV. Three enhancement strategies were evaluated against the 2.05L/m²/day baseline Table V. The external air cooled condenser gave the largest individual gain (+22%) by lowering glass temperature and increasing the vapor pressure differential (Pw−Pg) [27]. Latent heat recovery (+16%) recycles condensation energy to pre heat incoming feed, raising thermal efficiency [28], while basin side fins (+10%) improve internal convection through added heat exchange area [8]. Combined, the three strategies raise yield to 2.93L/m²/day (+43%) for an incremental cost of 65 BHD. The levelized cost of water for each configuration, together with the marginal cost of each enhancement, is quantified in Table V and discussed below.
To place these costs in context, the levelized cost of water (LCOW) was estimated for the baseline and fully enhanced configurations, assuming a five year system life and capital costs only. The baseline configuration (68 BHD, 432 L/year) yields an LCOW of approximately 31.5 fils/L, while the fully enhanced configuration (133 BHD, ≈617 L/year) yields approximately 43.1 fils/L. Both remain below the prevailing Bahrain retail rate for bulk delivered potable water (≈50–53 fils/L for 18.9 L refill bottles) [29], though the margin narrows substantially once the enhancements are added. Notably, the marginal cost of the enhancement package itself, 65 BHD for the additional ≈927 L delivered over five years, is approximately 70.1 fils/L, above this retail benchmark. On a pure cost per liter basis the enhancements are therefore not self justifying at this system life; their value lies in higher absolute throughput and improved thermal reliability rather than in a lower unit cost of water. Latent heat recovery offers the most cost effective incremental gain (53.4 fils/L), while the external condenser, despite delivering the largest single yield improvement, is the least cost effective enhancement on a marginal basis (73.8 fils/L). These estimates are indicative only; a full assessment incorporating O&M costs, discount rate, and salvage value is identified as future work in Section V.
F. Annual Productivity Projection
Monthly calculations using NASA POWER irradiance data for Manama (26.2°N) give an annual baseline productivity of approximately 720 L/m²/year (432 L/year for the 0.6 m² basin), ranging from 0.97 L/m²/day in December to 2.32 L/m²/day in June (Figure 6). This estimate carries an uncertainty of ±10–12%, reflecting assumptions in the heat transfer correlations, dust accumulation, and inter annual climatic variability.
Table VI.
Summary of Model Validation Results.
| Parameter | Predicted | Experimental | Error % |
|---|---|---|---|
| Peak water temperature °C | 73 | 70 | 4.1 |
| Peak glass temperature °C | 53 | 50 | 5.7 |
| Daily Productivity (L/m²/day) | 2.05 | 1.98 | 3.4 |
| Average MAPE (%) | -- | -- | 4.0 |
Note: the peak value errors above are point comparisons at a single time step, whereas the Average MAPE (4.0%) is computed from the complete hourly temperature dataset (Eq. 8) across the full test day, and is not a simple average of the three point errors shown.
G. Experimental Validation
A prototype of the proposed single slope solar still was fabricated to evaluate the accuracy of the analytical thermal model. The prototype incorporated the same geometric and material specifications used in the simulation, including a basin area of 0.60 m², a 4 mm tempered glass cover inclined at 20°, a matt black coated absorber surface, and 30 mm polyurethane insulation. The experimental trials were conducted under outdoor climatic conditions representative of Bahrain during the summer season. Solar irradiance, ambient temperature, wind speed, basin water temperature, glass cover temperature, and freshwater yield were monitored throughout the testing period. Measurements were recorded at hourly intervals from 06:00 to 22:00 h and compared directly with the analytical predictions generated using the energy balance model and Dunkle’s heat transfer correlation
Figure 7 compares the predicted and measured water and glass cover temperatures during a representative test day. Both datasets exhibited similar trends, with temperatures increasing steadily during the morning period, reaching peak values near solar noon, and gradually decreasing during the evening hours. The maximum measured water temperature was 70°C, compared with a predicted value of 73°C. Similarly, the maximum measured glass cover temperature was 50°C, compared with the predicted value of approximately 53 °C. The Mean Absolute Percentage Error (MAPE), calculated using equation 8 from the measured and predicted temperature data, was approximately 4%, indicating good agreement between the analytical model and prototype measurements and confirming the suitability of the model for engineering performance prediction under Bahrain climatic conditions.
where and represent the experimental and predicted values respectively.
The experimentally measured daily freshwater productivity was 1.98L/m²/day, while the analytical model predicted a productivity of 2.05L/m²/day. The corresponding percentage difference was 3.4%. The relatively small discrepancy can be attributed to unavoidable environmental factors not fully represented in the analytical model, including fluctuations in solar irradiance, varying wind conditions, dust accumulation on the glass surface, and measurement uncertainties associated with field testing. These factors are commonly reported in previous solar still studies and contribute to deviations between theoretical and experimental performance.
The experimental results generally confirmed the trends predicted by the analytical model. Both simulation and testing showed that productivity increases with higher solar irradiance and larger temperature differences between the basin water and glass cover. The measured data also supported the selection of a 50 mm water depth and a 20° glass cover inclination as practical operating conditions for Bahrain. Minor discrepancies were primarily associated with transient weather conditions and simplifications adopted in the thermal model.
V. Conclusion and Future Work
This study presented the design, thermal modelling, experimental validation, and performance evaluation of a passive single slope solar desalination unit developed for Bahrain climatic conditions. The analytical model, based on energy balance equations and Dunkle’s heat and mass transfer correlations, predicted a baseline freshwater productivity of 2.05 L/m²/day and an overall thermal efficiency of approximately 34%. Experimental testing of the fabricated prototype demonstrated good agreement with the analytical predictions. The maximum measured basin water temperature reached approximately 70°C, compared with a predicted value of 73°C, confirming that the developed model provides a realistic representation of the thermal behavior of the solar still under Bahrain operating conditions. The observed differences between measured and predicted values were attributed primarily to environmental fluctuations and unavoidable heat losses not fully represented in the analytical model.
The sensitivity analyses showed that water depth and glass cover inclination significantly influence freshwater production. Although shallower water depths produced higher instantaneous productivity, a depth of 0.05 m was selected as a practical compromise between thermal performance and operational stability. Similarly, a glass cover inclination of 20° provided near optimum annual performance while maintaining design simplicity.
Among the enhancement strategies investigated, the external air cooled condenser produced the largest individual improvement in productivity. When combined with latent heat recovery and basin fins, freshwater productivity increased from 2.05L/m²/day to approximately 2.93L/m²/day, corresponding to a 43% improvement over the baseline design.
Overall, the study confirms that passive solar desalination is technically feasible under Bahrain climatic conditions and offers a sustainable, low energy solution for decentralized freshwater production [30]. Future work should focus on extended outdoor testing, integration of thermal energy storage materials, CFD analysis of internal heat and mass transfer processes, and comprehensive life cycle economic assessment to support large scale deployment.
Author Contributions
Conceptualization, Wajid Ali Khan, Fawaz Jalal and Faisal Al-Harbi; Validation, Wajid Ali Khan; Formal analysis, Fawaz Jalal; Investigation, Wajid Ali Khan and Faisal Al-Harbi; Resources, Fawaz Jalal; Data curation, Wajid Ali Khan and Faisal Al-Harbi; Writing – original draft, Faisal Al-Harbi; Writing – review & editing, Fawaz Jalal and Faisal Al-Harbi; Visualization, Faisal Al-Harbi; Supervision, Wajid Ali Khan; Project administration, Wajid Ali Khan.
Funding
This research received no external funding.:
Data Availability Statement
The original contributions presented in this study are included in the article. Further inquiries can be directed to the corresponding author.
Conflicts of Interest
The authors declare no conflicts of interest.
References
- World Health Organization. Guidelines for Drinking-water Quality, 4th ed.; WHO: Geneva, 2022. [Google Scholar]
- United Nations. The United Nations World Water Development Report 2023; UNESCO: Paris, 2023. [Google Scholar]
- Electricity and Water Authority (EWA). Annual Water Statistics Report; Manama, Bahrain, 2024. [Google Scholar]
- IRENA, Renewable Energy Market Analysis: GCC 2024; IRENA: Abu Dhabi, 2024.
- Garg, H. P.; Prakash, J. Solar Energy: Fundamentals and Applications; Tata McGraw-Hill: New Delhi, 2000. [Google Scholar]
- Muftah, F.; Alghoul, M. A.; Fudholi, A.; Abdul-Majeed, M. M.; Sopian, K. Factors affecting basin type solar still productivity: A detailed review. Renew. Sustain. Energy Rev. 2014, vol. 32, 430–447. [Google Scholar] [CrossRef]
- Tiwari, G. N.; Tiwari, A. Solar Distillation Practice for Water Desalination Systems; Anamaya: New Delhi, 2008. [Google Scholar]
- Kabeel, M. A.; Abdelgaied, A. Improving the performance of solar still by using fins and external condenser. Energy Convers. Manag. 2015, vol. 90, 1–9. [Google Scholar]
- Younis; Hussein, A. K.; Attia, M. E. H.; Aljibori, H. S. S.; Kolsi, L.; Togun, H.; Ali, B.; Abderrahmane, A.; Subkrajang, K.; Jirawattanapanit, A. Comprehensive review on solar stills—latest developments and overview. Sustainability 2022, vol. 14(no. 16), 10136. [Google Scholar]
- Khalifa, J. N.; Hamood, A. A. Performance correlations for basin-type solar stills. Desalination 2009, vol. 249(no. 1), 24–28. [Google Scholar] [CrossRef]
- Al-Hinai, H.; Al-Nassri, M. S.; Jubran, B. A. Effect of climatic conditions on the yield of a simple solar still. Energy Convers. Manag. 2002, vol. 43(no. 13), 1639–1650. [Google Scholar] [CrossRef]
- Hamadou; Chikh, S.; Aidaoui, A. Thermal performance analysis of passive solar stills in arid climates. Desalination 2011, vol. 273(no. 2–3), 289–297. [Google Scholar]
- Al-Karaghouli; Kazmerski, L. Energy consumption and water production cost of conventional and renewable-energy-powered desalination processes. Renew. Sustain. Energy Rev. 2013, vol. 24, 343–356. [Google Scholar] [CrossRef]
- Eltawil, M.; Zhengming, Z. Wind-energy-assisted solar desalination system. Desalination 2013, vol. 324, 86–98. [Google Scholar]
- Al-Hayek; Badran, O. O. The effect of using different designs of solar stills on water distillation. Desalination 2004, vol. 169(no. 2), 121–127. [Google Scholar] [CrossRef]
- Abdullah, S. Improving the performance of solar stills using enhanced condensation techniques. Renew. Energy 2014, vol. 68, 746–751. [Google Scholar]
- Sharshir, S. W.; Peng, G.; Yang, N.; Eltawil, M. A.; Ali, M. K. A.; Kabeel, A. E. Enhancing the performance of solar stills using nanofluids and cooling techniques. Appl. Therm. Eng. 2016, vol. 100, 104–112. [Google Scholar]
- Kalogirou, S. A. Solar Energy Engineering: Processes and Systems, 2nd ed.; Academic Press: Amsterdam, 2014. [Google Scholar]
- Othman, M. Y. H.; Yatim, B.; Sopian, K.; Bakar, M. N. A. Optimum tilt angle for solar collectors in the Gulf region. Renew. Energy 1999, vol. 18(no. 2), 203–209. [Google Scholar]
- Tiwari, G. N.; Dwivedi, V. K. Effect of water depth on heat and mass transfer in a passive solar still. Desalination 1998, vol. 116(no. 3), 307–317. [Google Scholar]
- McAdams, W. H. Heat Transmission, 3rd ed.; McGraw-Hill: New York, 1954. [Google Scholar]
- Incropera, F. P.; DeWitt, D. P.; Bergman, T. L.; Lavine, A. S. Fundamentals of Heat and Mass Transfer, 7th ed.; Hoboken: Wiley, 2011. [Google Scholar]
- Tsilingiris, P. T. Thermophysical and transport properties of humid air at 0–100°C. Energy Convers. Manag. 2008, vol. 49(no. 5), 1098–1110. [Google Scholar] [CrossRef]
- NASA POWER Project, “NASA Prediction of Worldwide Energy Resources,” NASA Langley Research Center, 2025. Available online: https://power.larc.nasa.gov/.
- Garg, H. P. Treatise on Solar Energy: Fundamentals of Solar Energy; Wiley: New York, 1982; vol. 1. [Google Scholar]
- El-Sebaii, A. Effect of basin water depth on passive solar still productivity. Energy Convers. Manag. 2004, vol. 45(no. 5), 821–836. [Google Scholar]
- Kabeel, M. A.; Khalil, A.; Elsayed, S. A. Enhancement of solar still productivity using external condenser. Desalination 2016, vol. 379, 1–9. [Google Scholar] [CrossRef]
- Kabeel, E.; Abdelgaied, M. Improving solar still performance using latent heat thermal energy storage. Desalination 2011, vol. 280(no. 1–3), 400–404. [Google Scholar]
- Author market survey of retail and bulk-delivered bottled water pricing in Bahrain, 2026.
- Kingdom of Bahrain, Sustainable Energy Authority, Bahrain National Energy Strategy and Water Sustainability Reports. Manama, 2024.
Figure 1.
Cross section of the proposed single slope solar still, showing the tempered glass cover, saline water layer, black coated basin liner, and side/base insulation.
Figure 1.
Cross section of the proposed single slope solar still, showing the tempered glass cover, saline water layer, black coated basin liner, and side/base insulation.
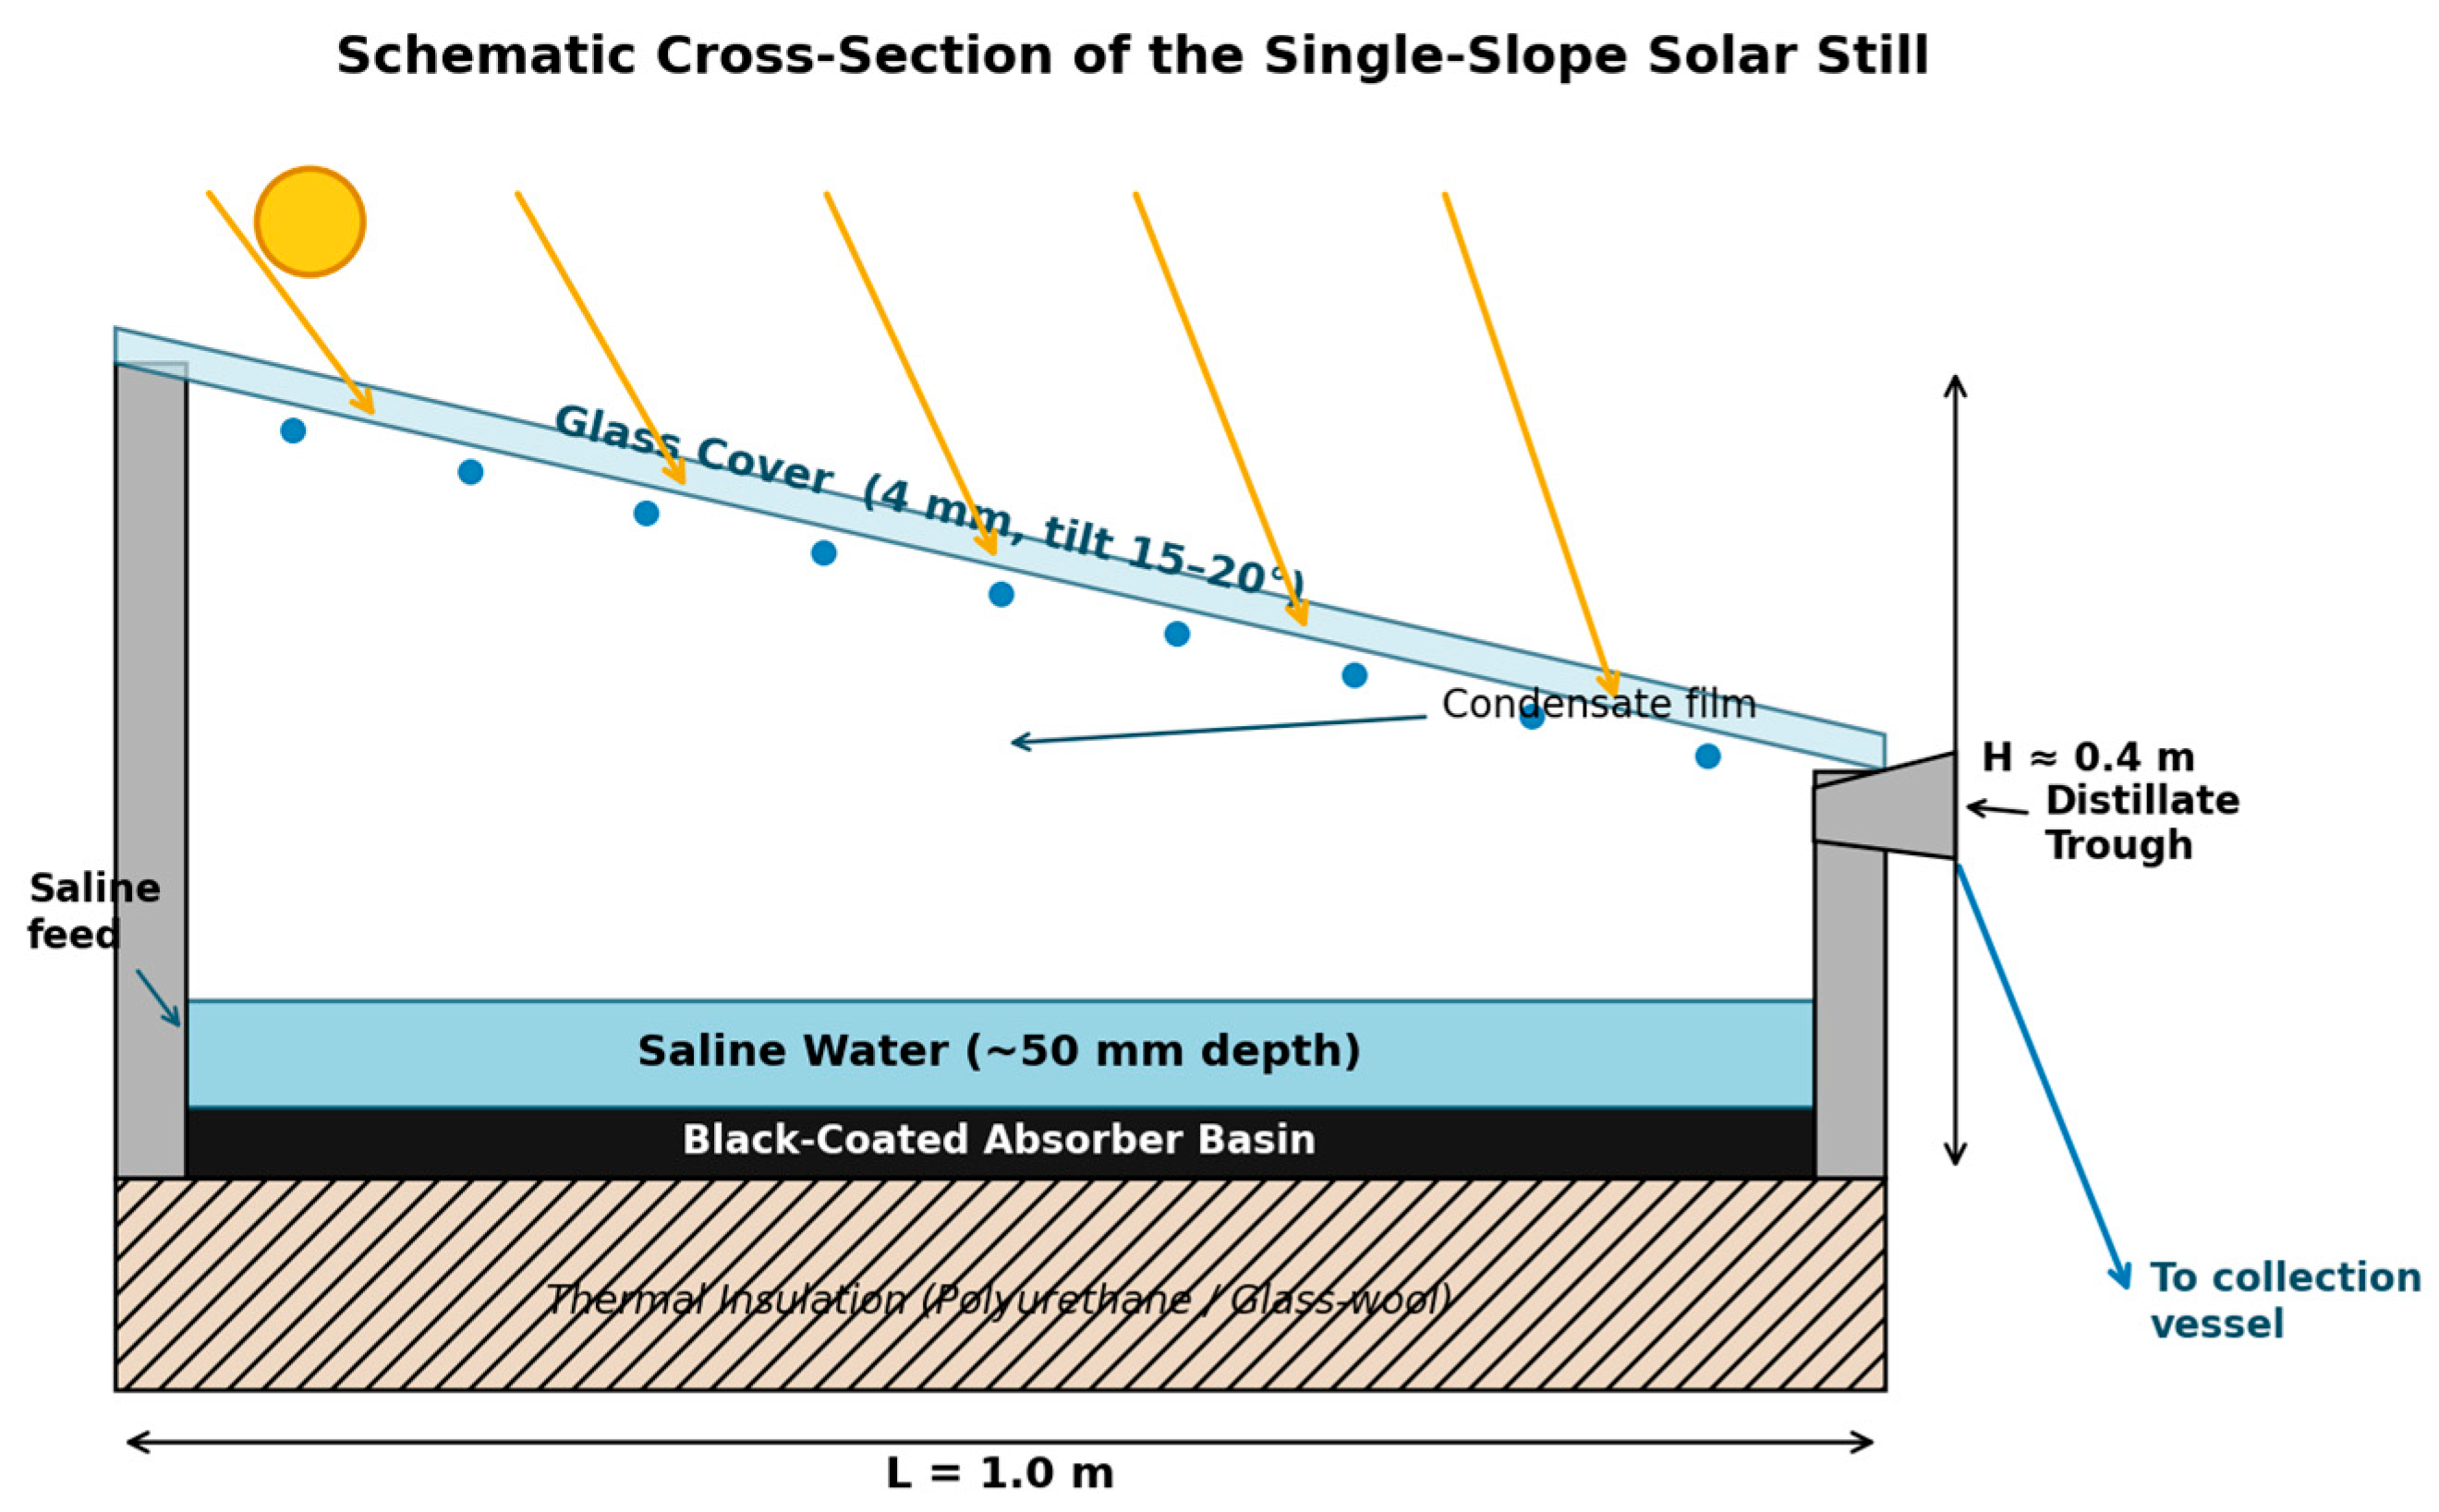
Figure 2.
Variation of saturation vapor pressure difference (Pw − Pg) with water temperature, illustrating the evaporative driving force used in Eqs. (3)–(4).
Figure 2.
Variation of saturation vapor pressure difference (Pw − Pg) with water temperature, illustrating the evaporative driving force used in Eqs. (3)–(4).
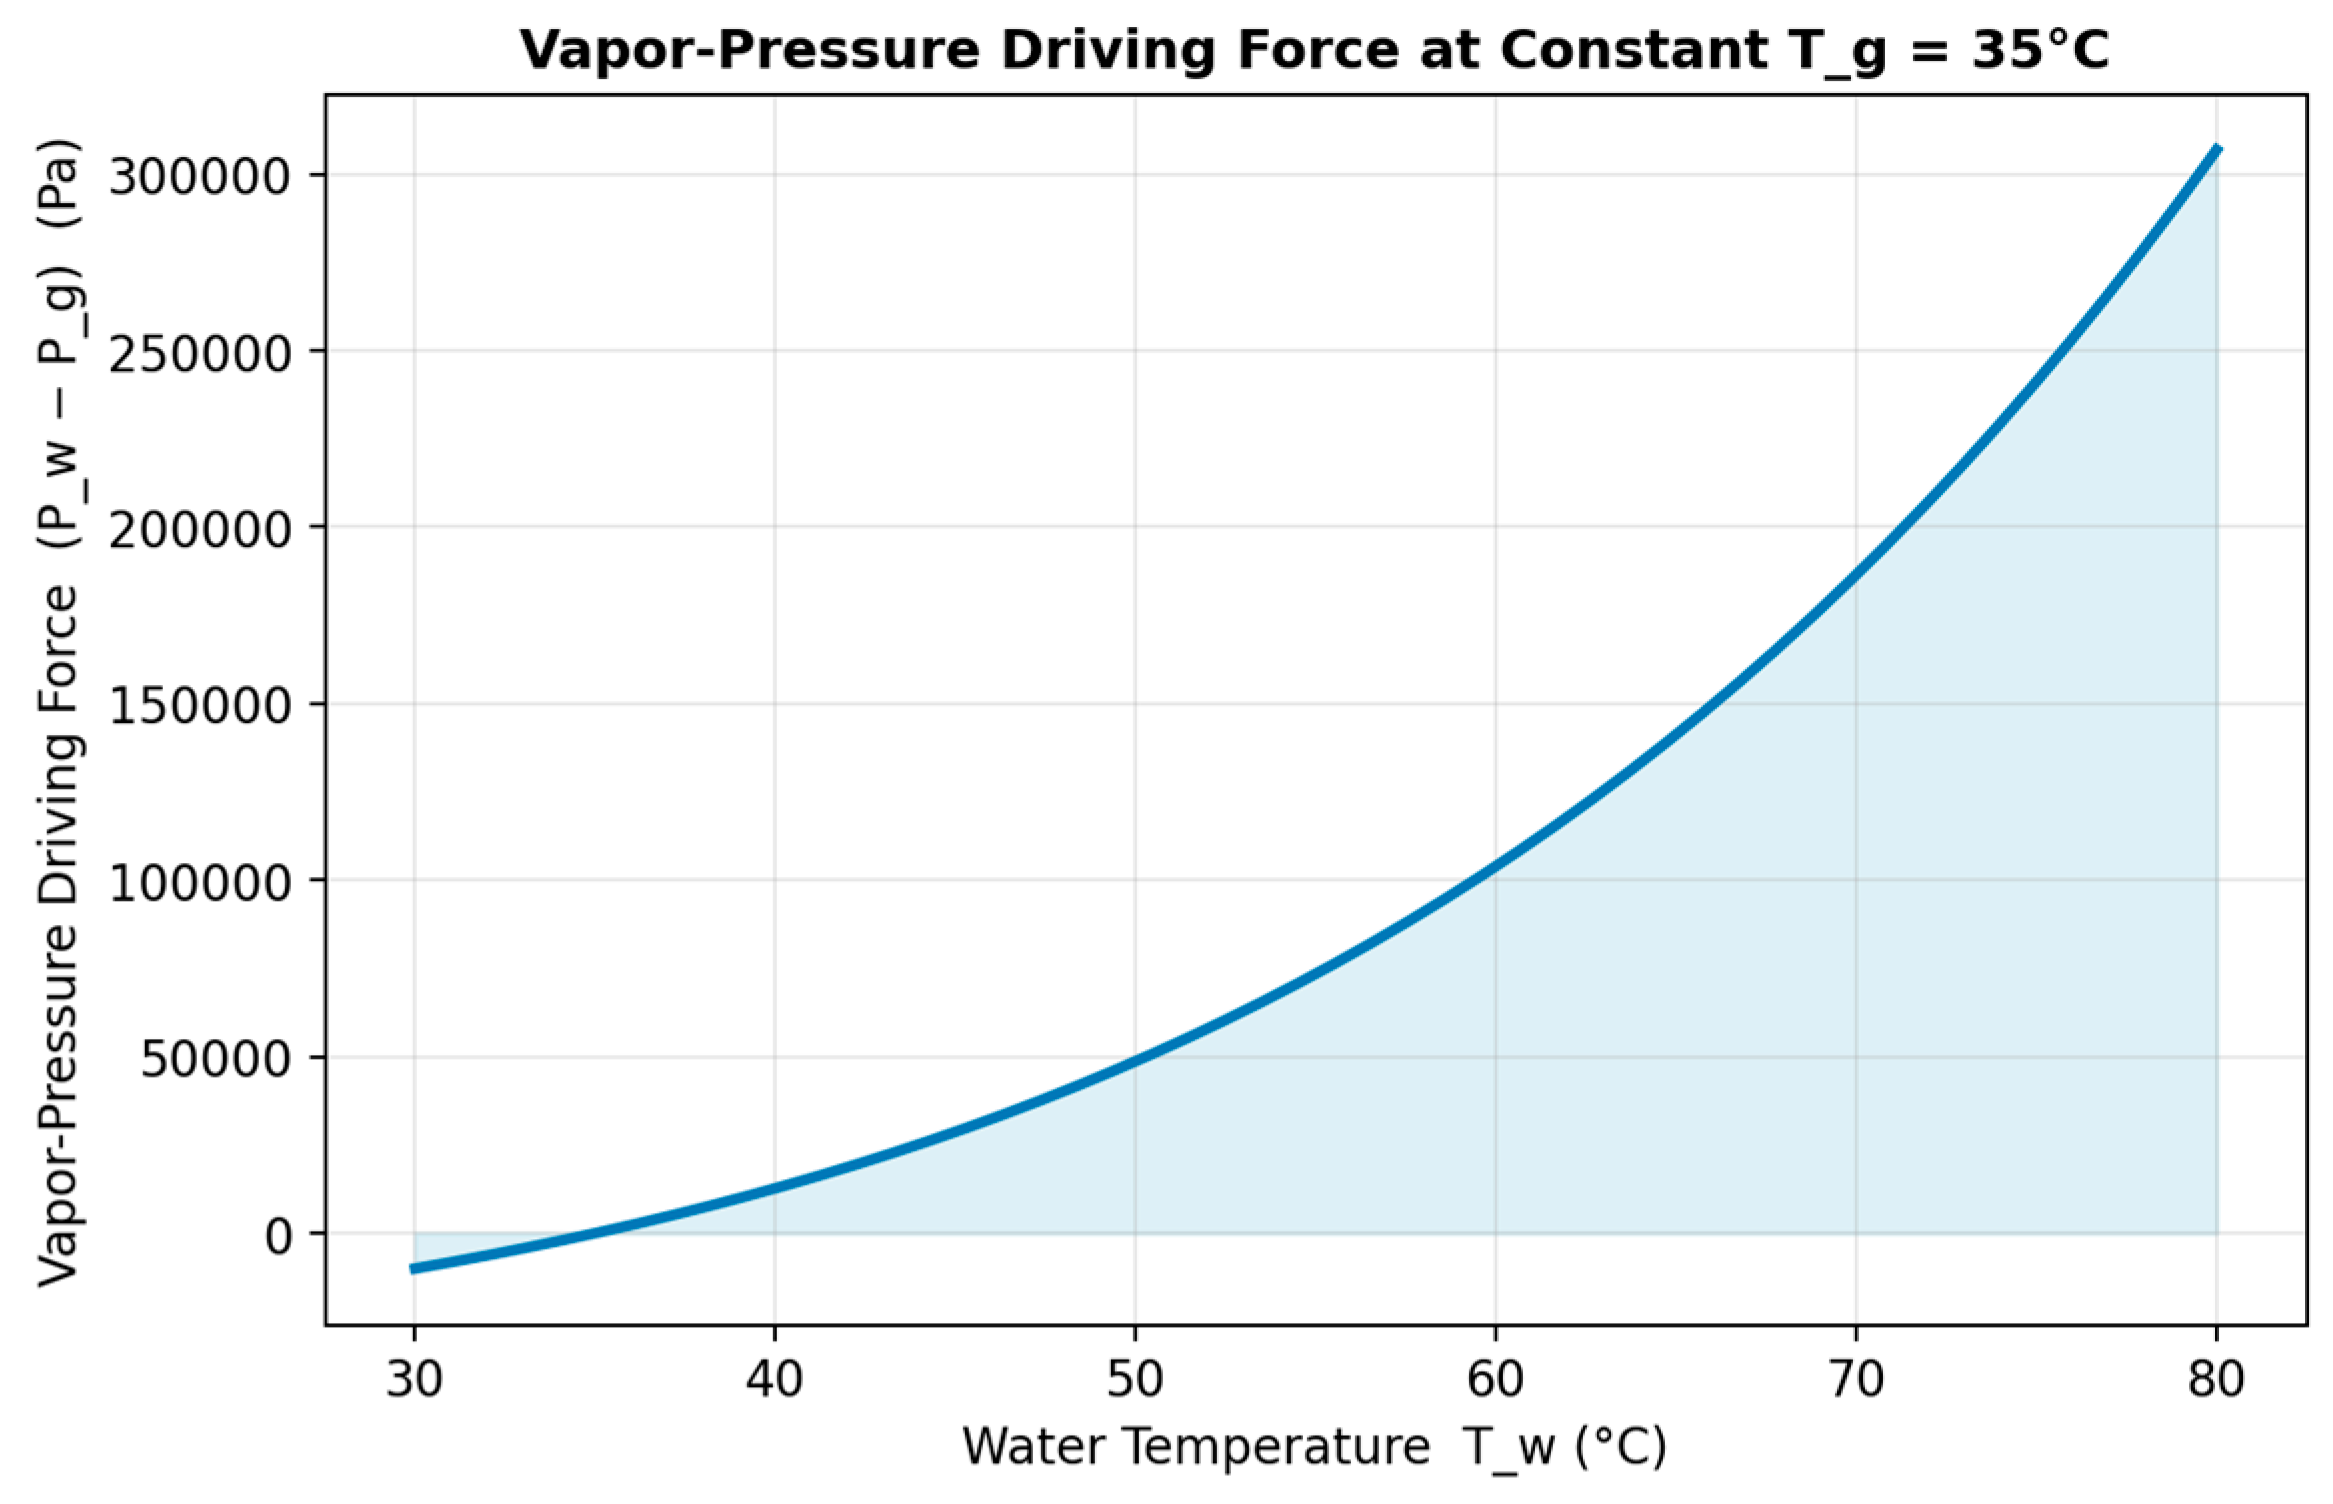
Figure 3.
Predicted hourly variation of water and glass cover temperatures during a representative summer day (15 June), showing the sustained temperature gradient that drives condensation.
Figure 3.
Predicted hourly variation of water and glass cover temperatures during a representative summer day (15 June), showing the sustained temperature gradient that drives condensation.
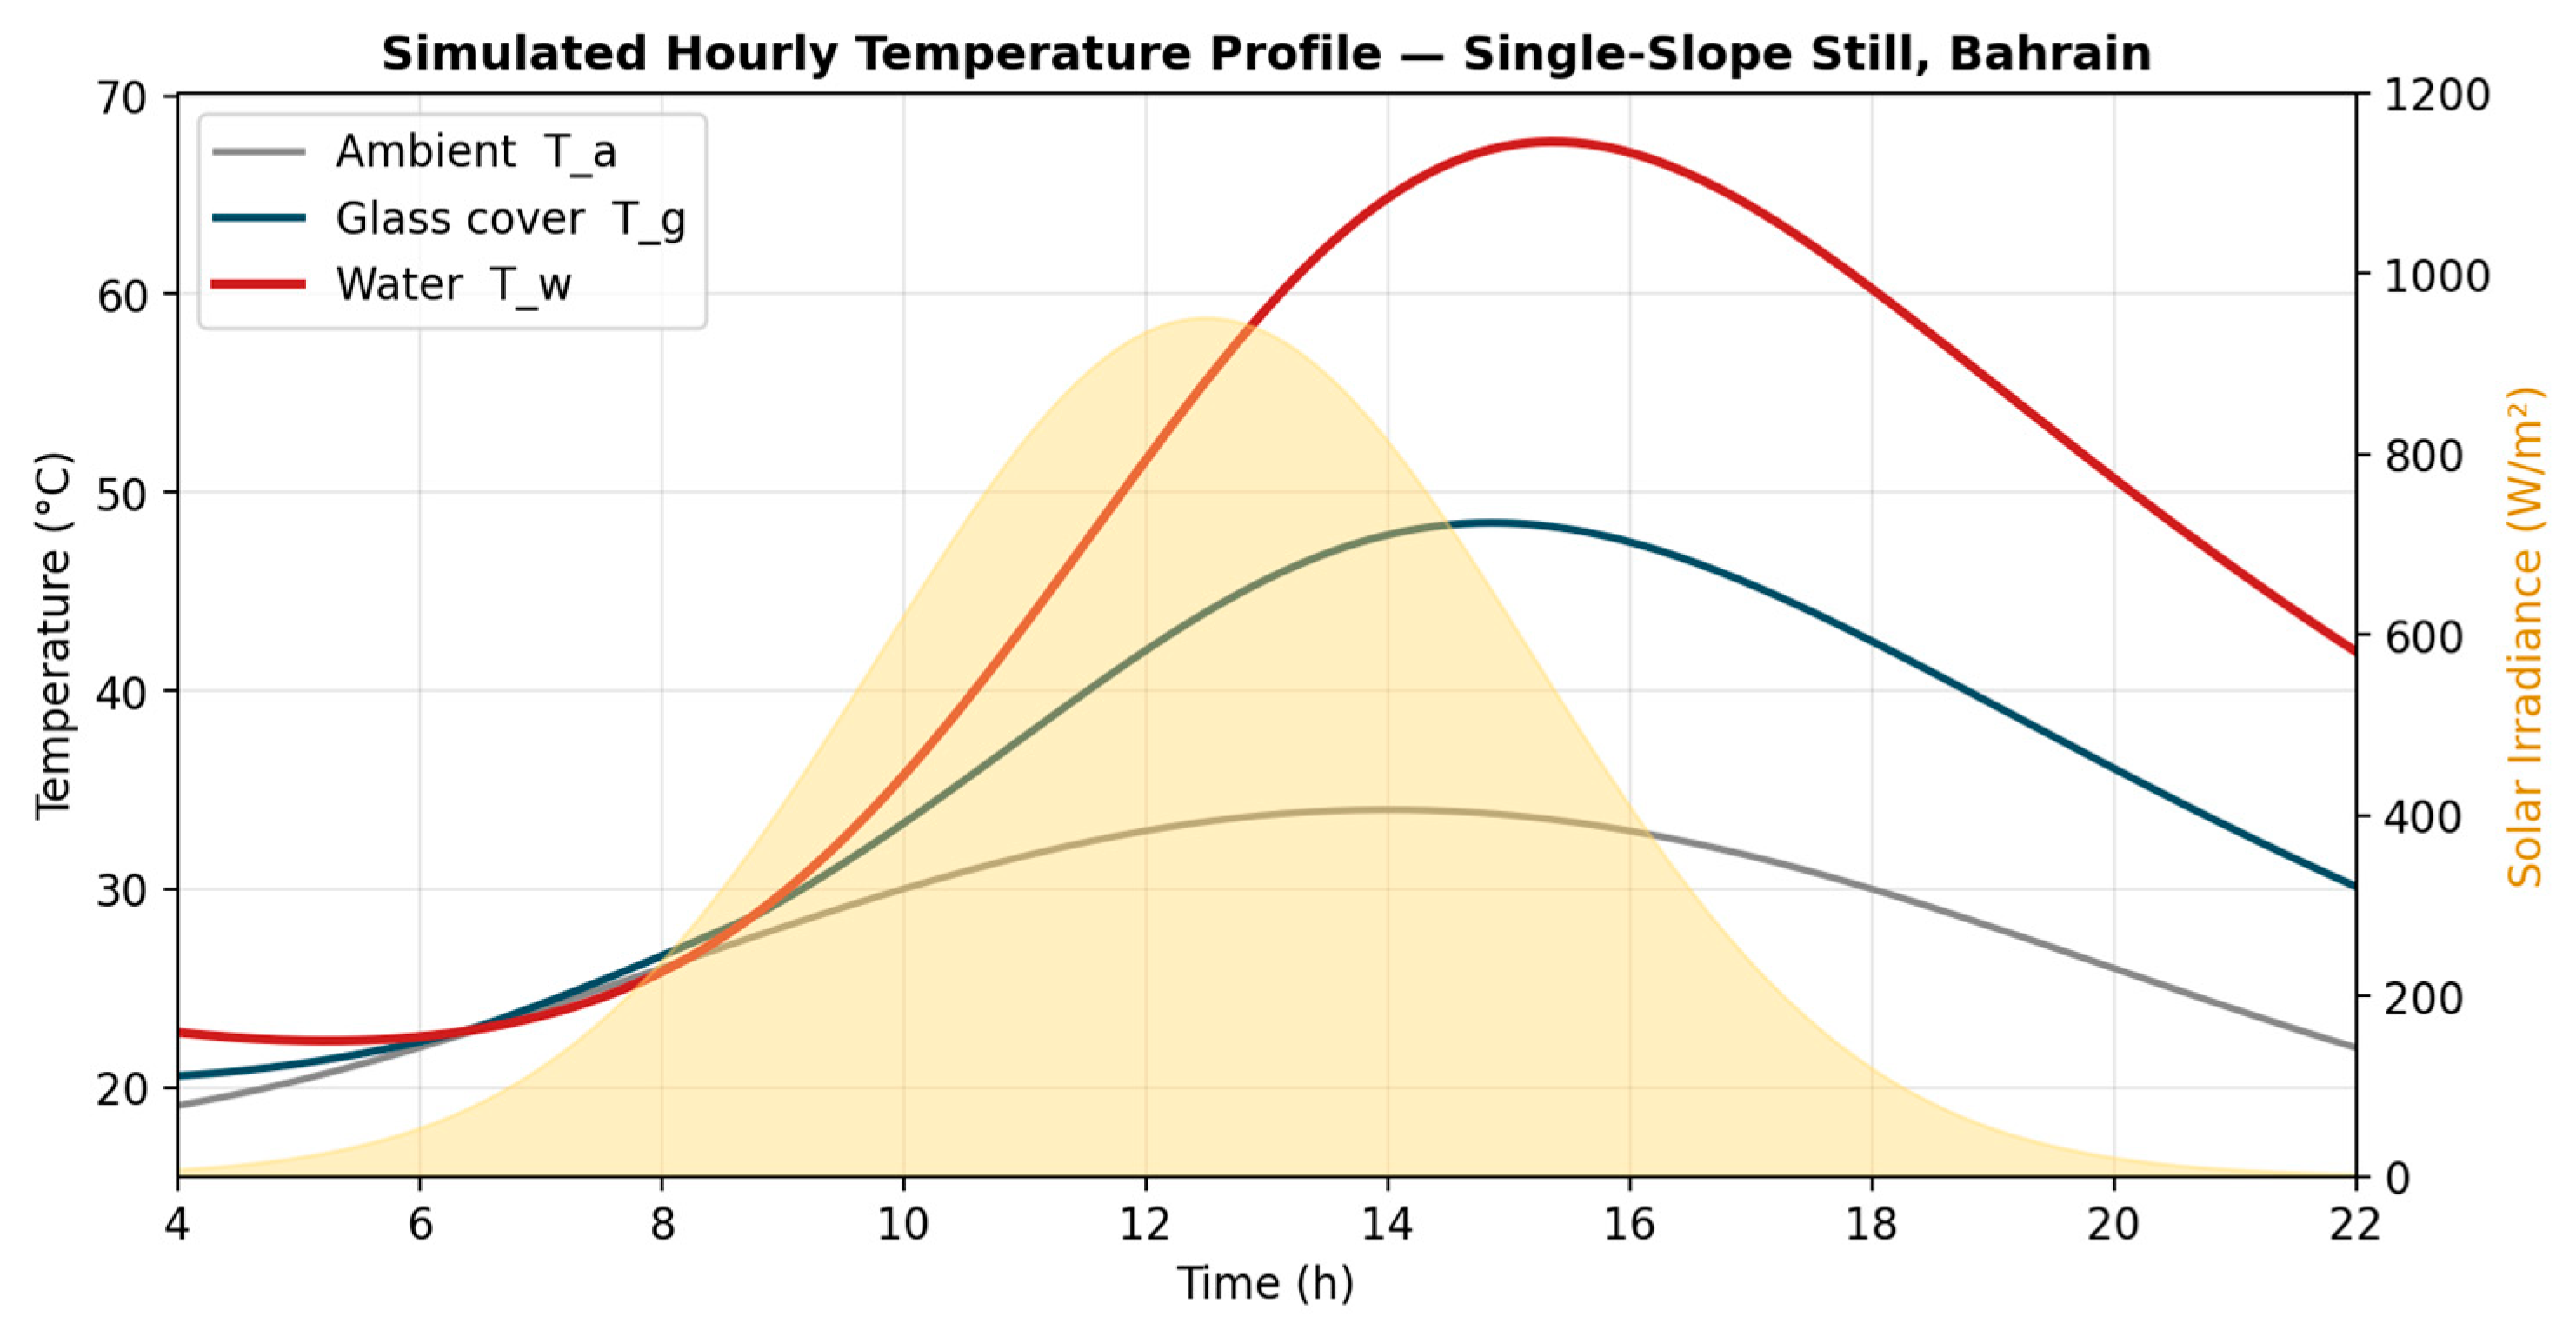
Figure 4.
Daily energy distribution within the solar still, showing the fraction of absorbed solar energy converted to evaporation, convection, radiation, wall losses, and sensible heat storage.
Figure 4.
Daily energy distribution within the solar still, showing the fraction of absorbed solar energy converted to evaporation, convection, radiation, wall losses, and sensible heat storage.
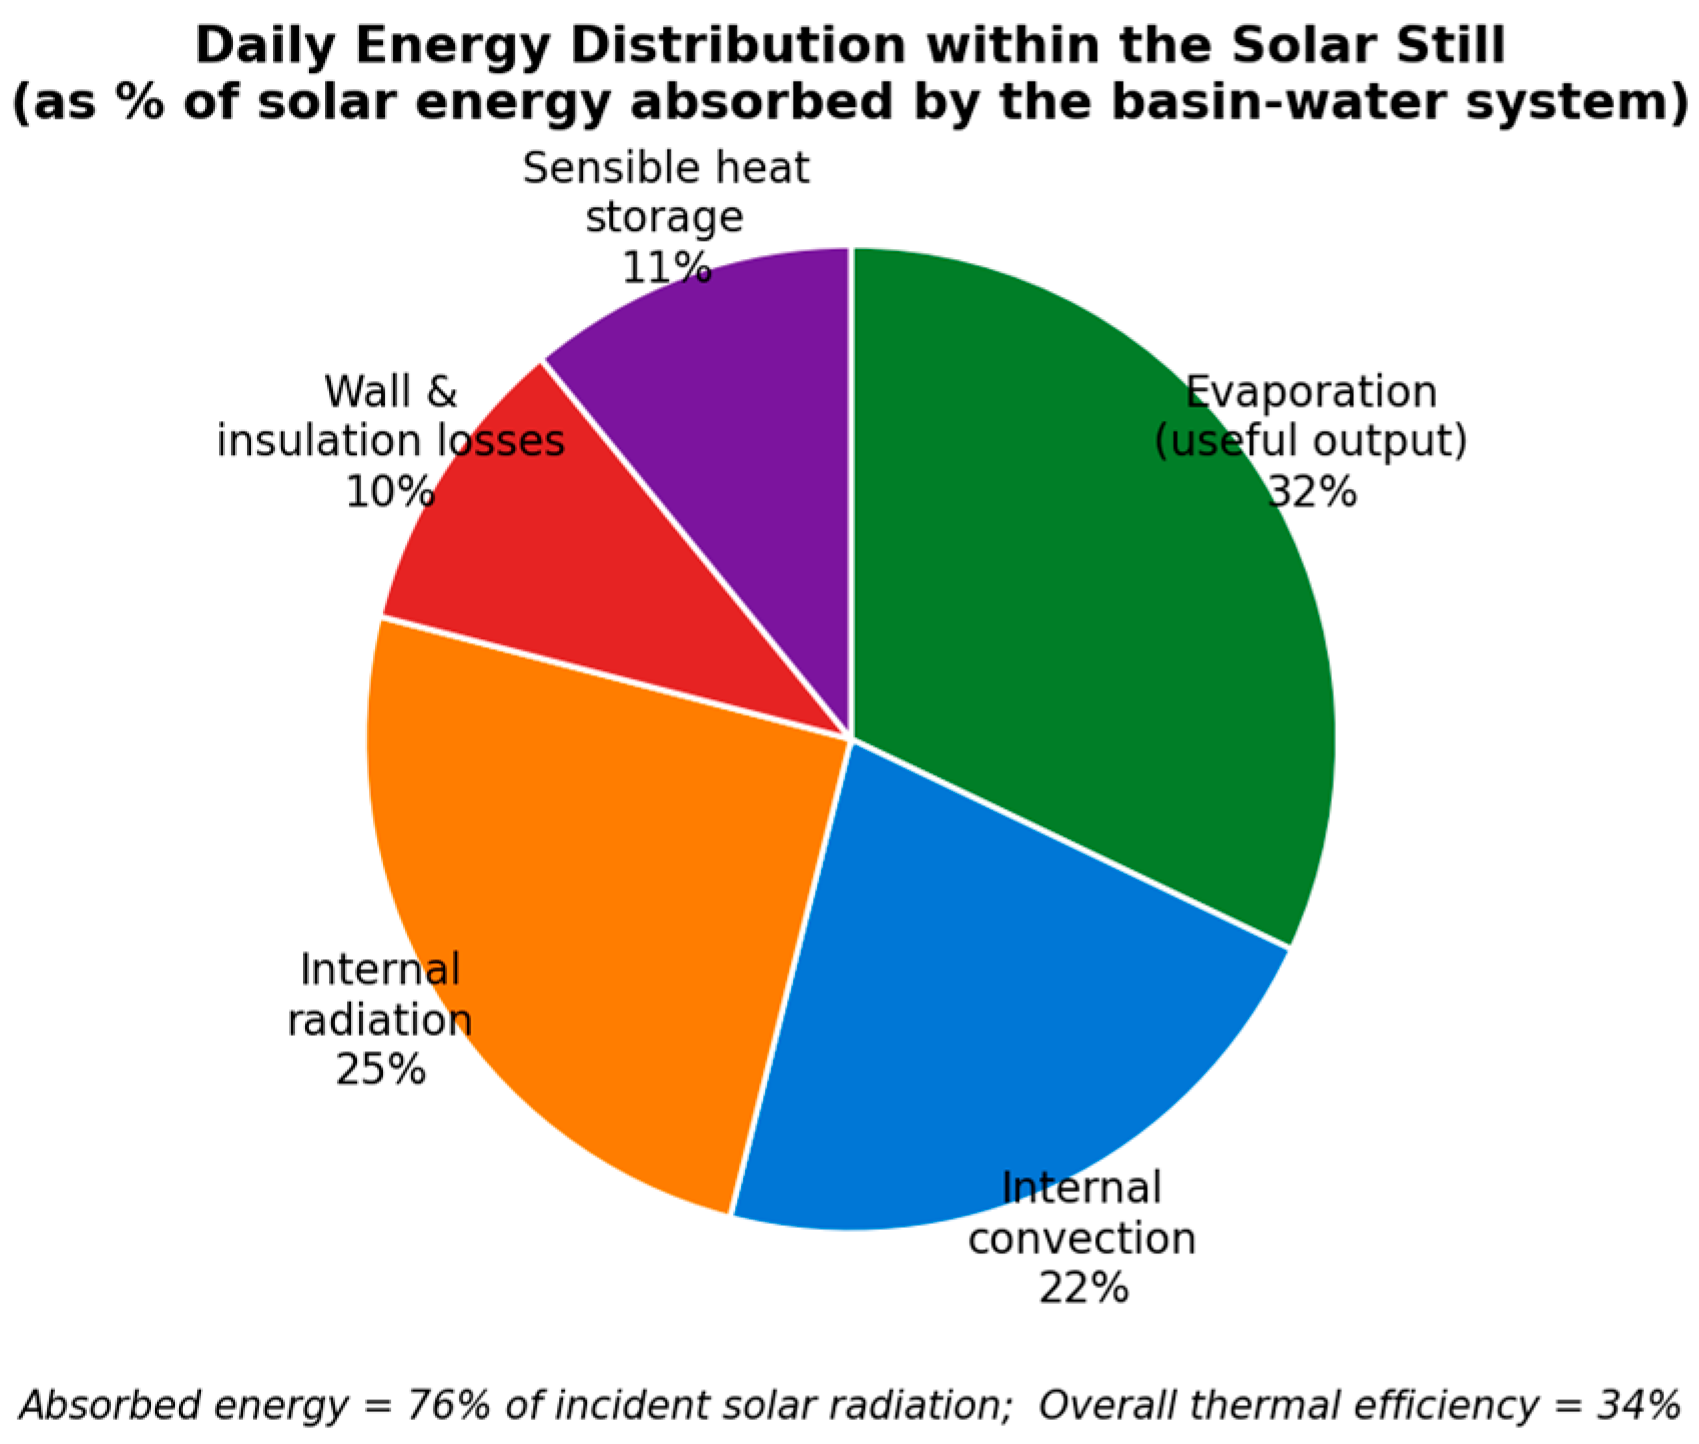
Figure 5.
Effect of glass cover tilt angle on freshwater productivity, showing a broad optimum between approximately 20° and 27° under Bahrain conditions.
Figure 5.
Effect of glass cover tilt angle on freshwater productivity, showing a broad optimum between approximately 20° and 27° under Bahrain conditions.
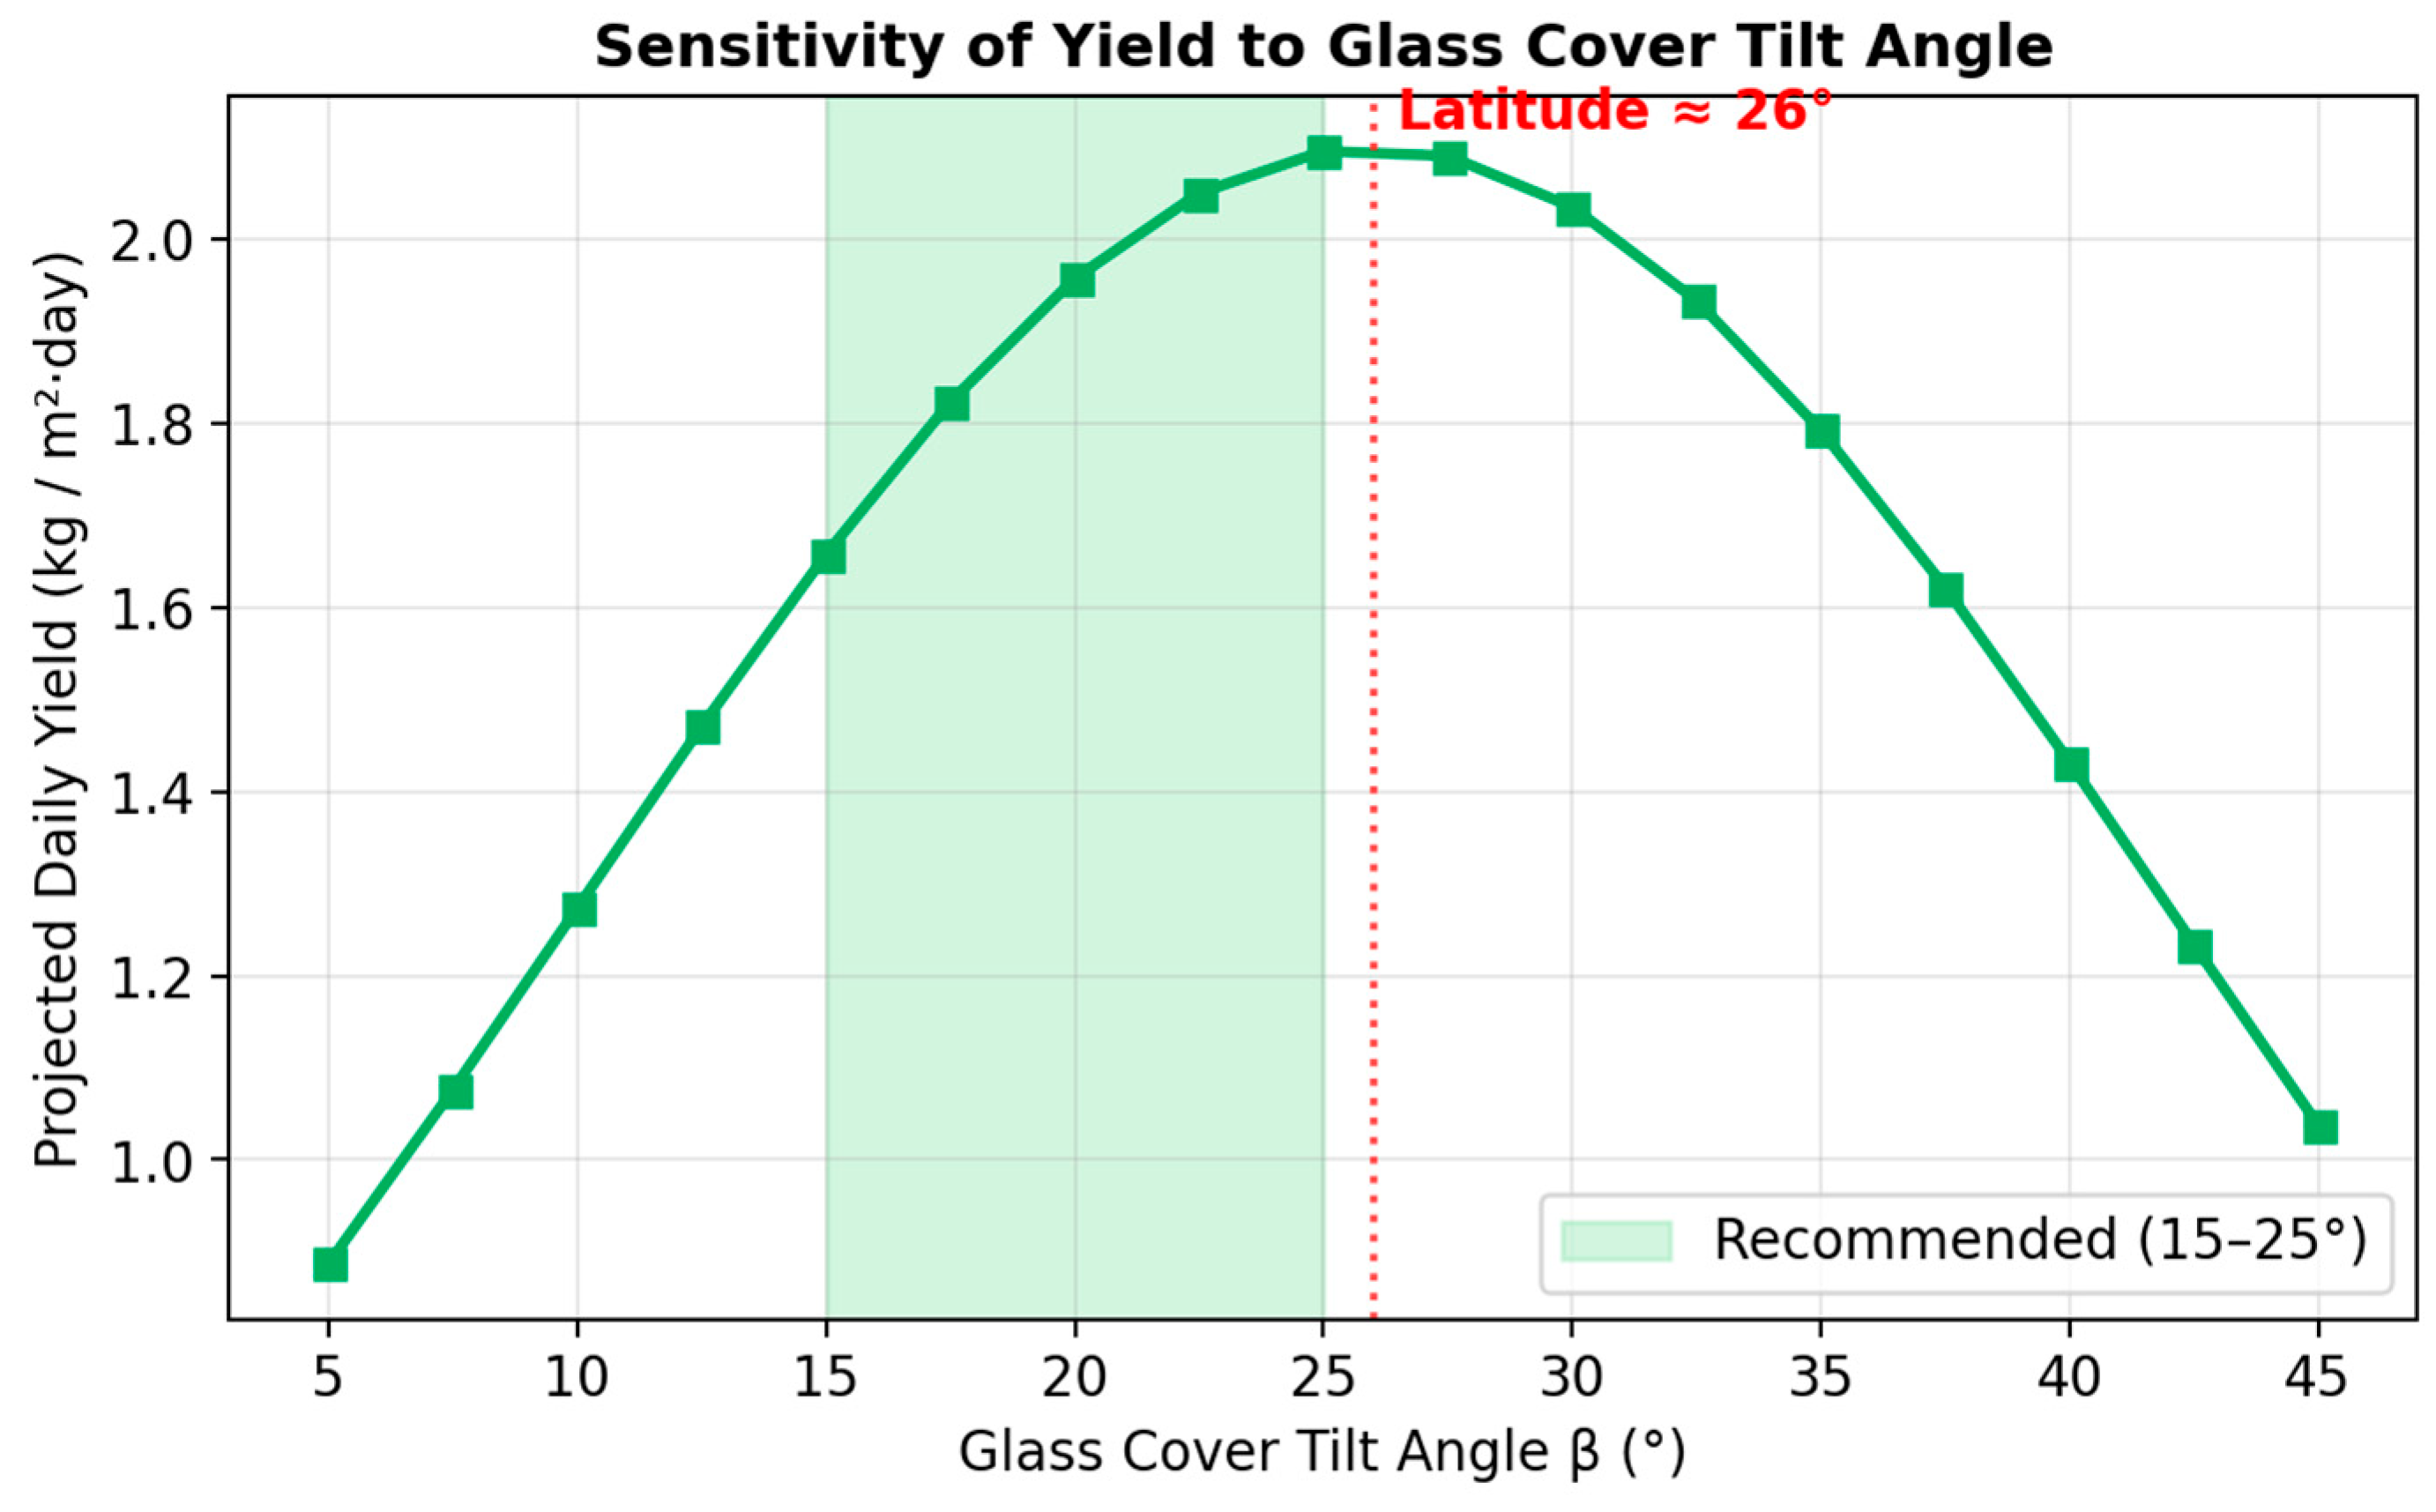
Figure 6.
Monthly solar irradiance and projected freshwater productivity for Manama, Bahrain, based on NASA POWER irradiance data.
Figure 6.
Monthly solar irradiance and projected freshwater productivity for Manama, Bahrain, based on NASA POWER irradiance data.
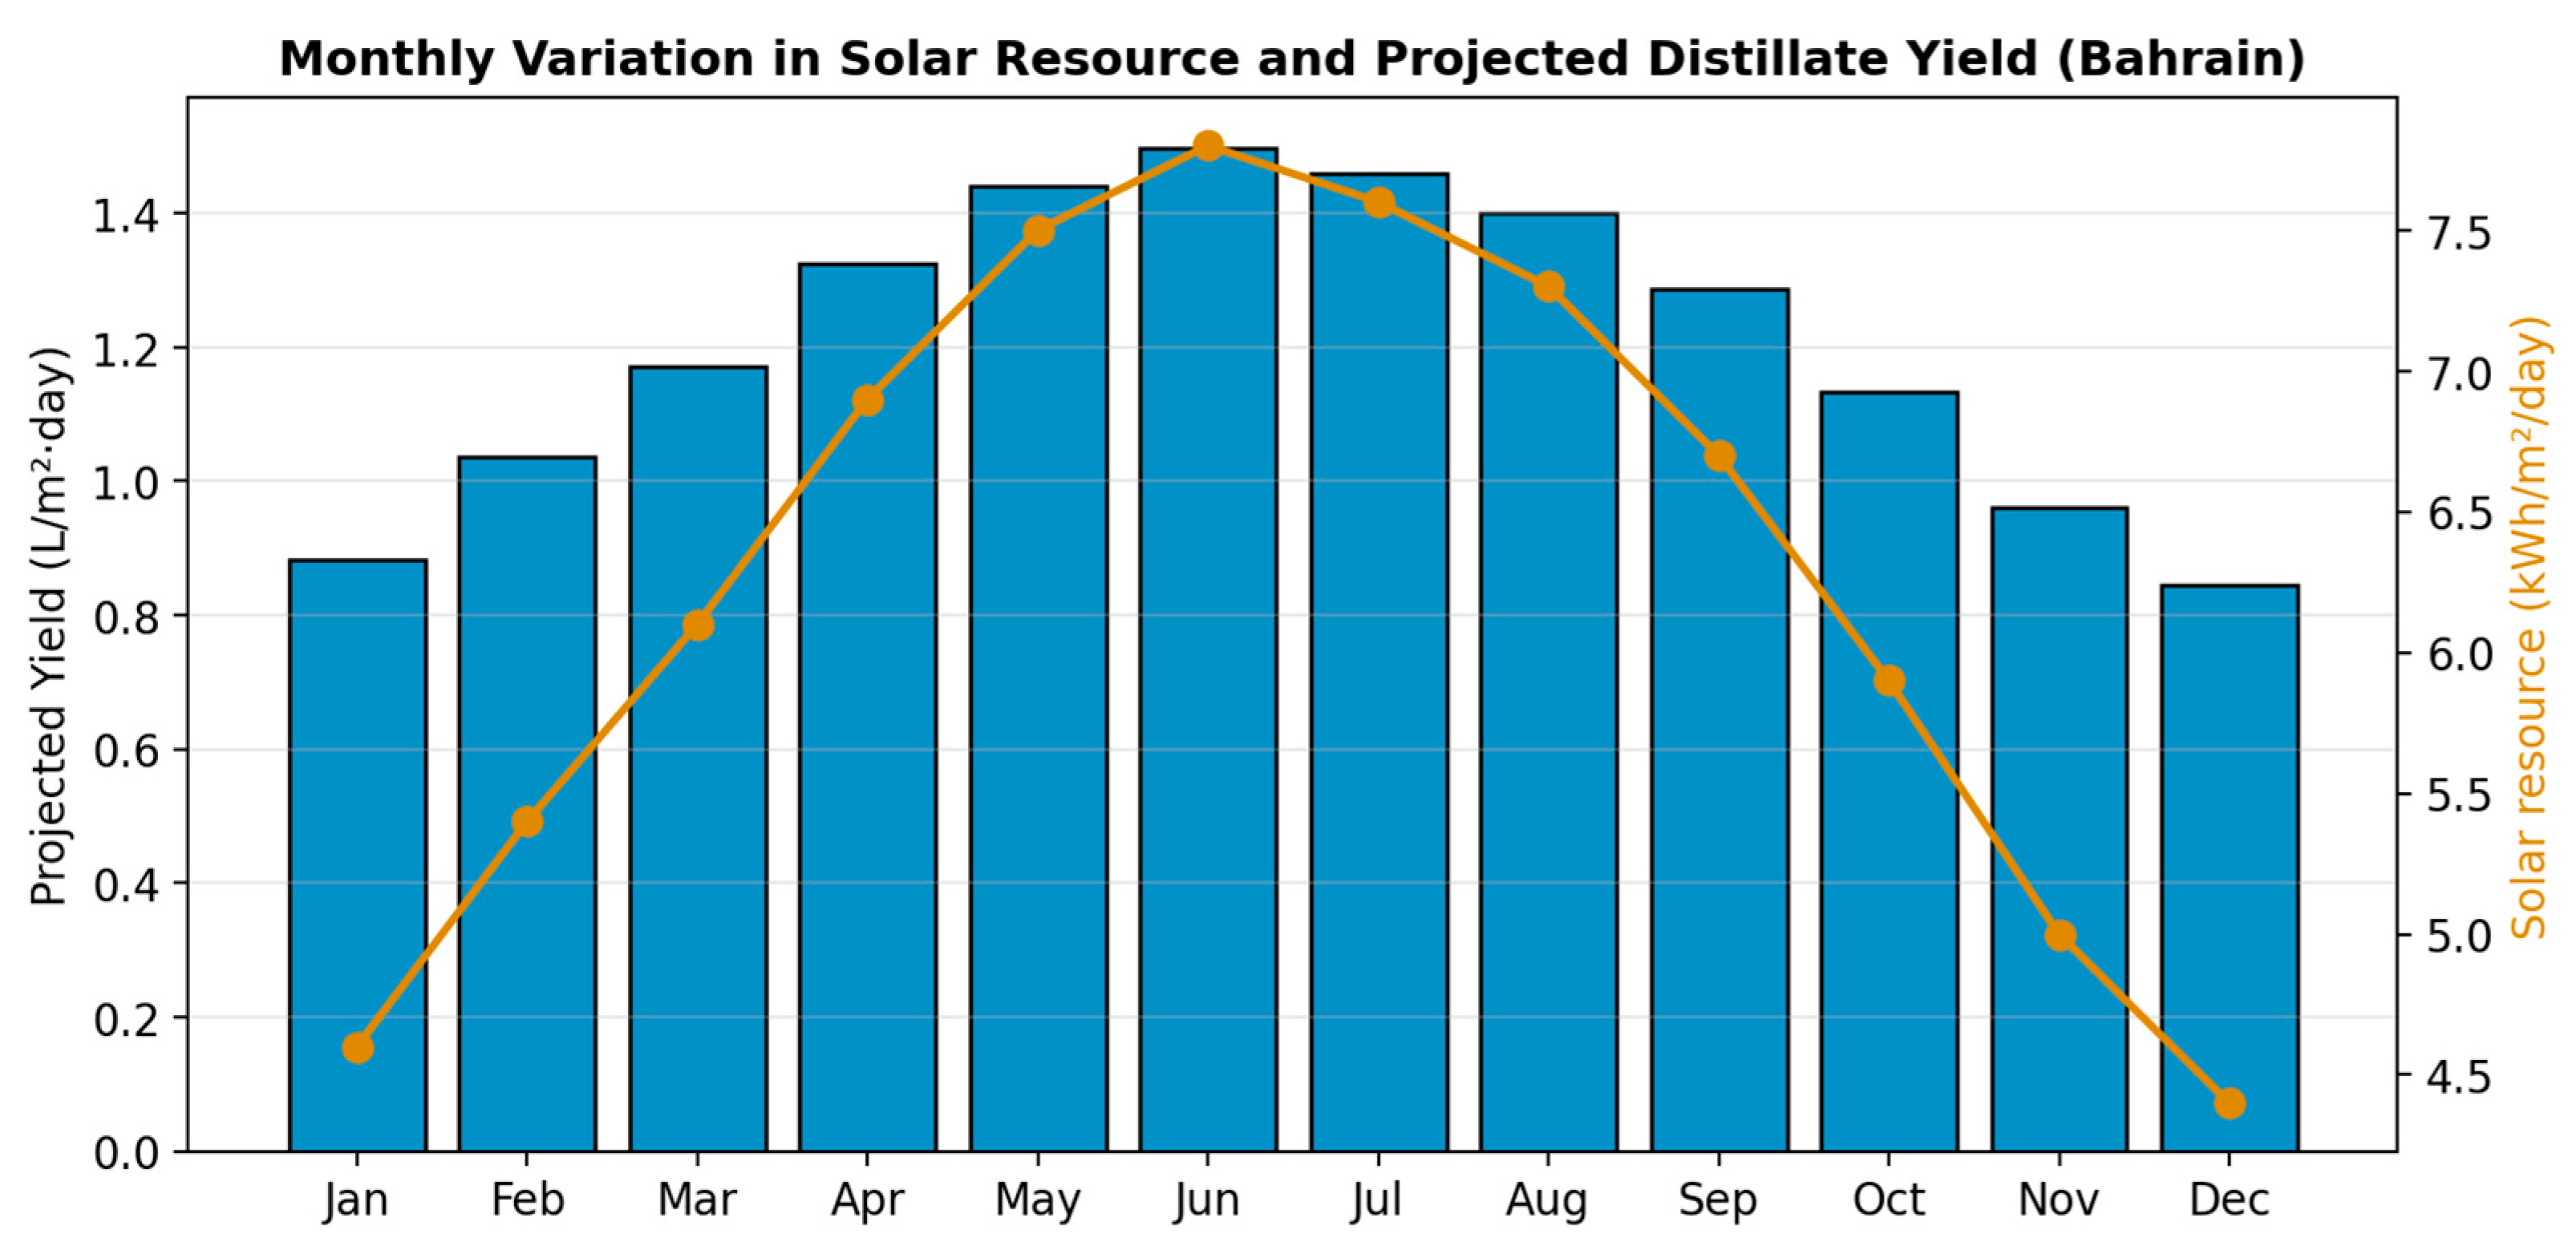
Figure 7.
Comparison between analytical model predictions and experimental measurements for basin water and glass cover temperatures during a representative outdoor validation test conducted under Bahrain summer conditions.
Figure 7.
Comparison between analytical model predictions and experimental measurements for basin water and glass cover temperatures during a representative outdoor validation test conducted under Bahrain summer conditions.
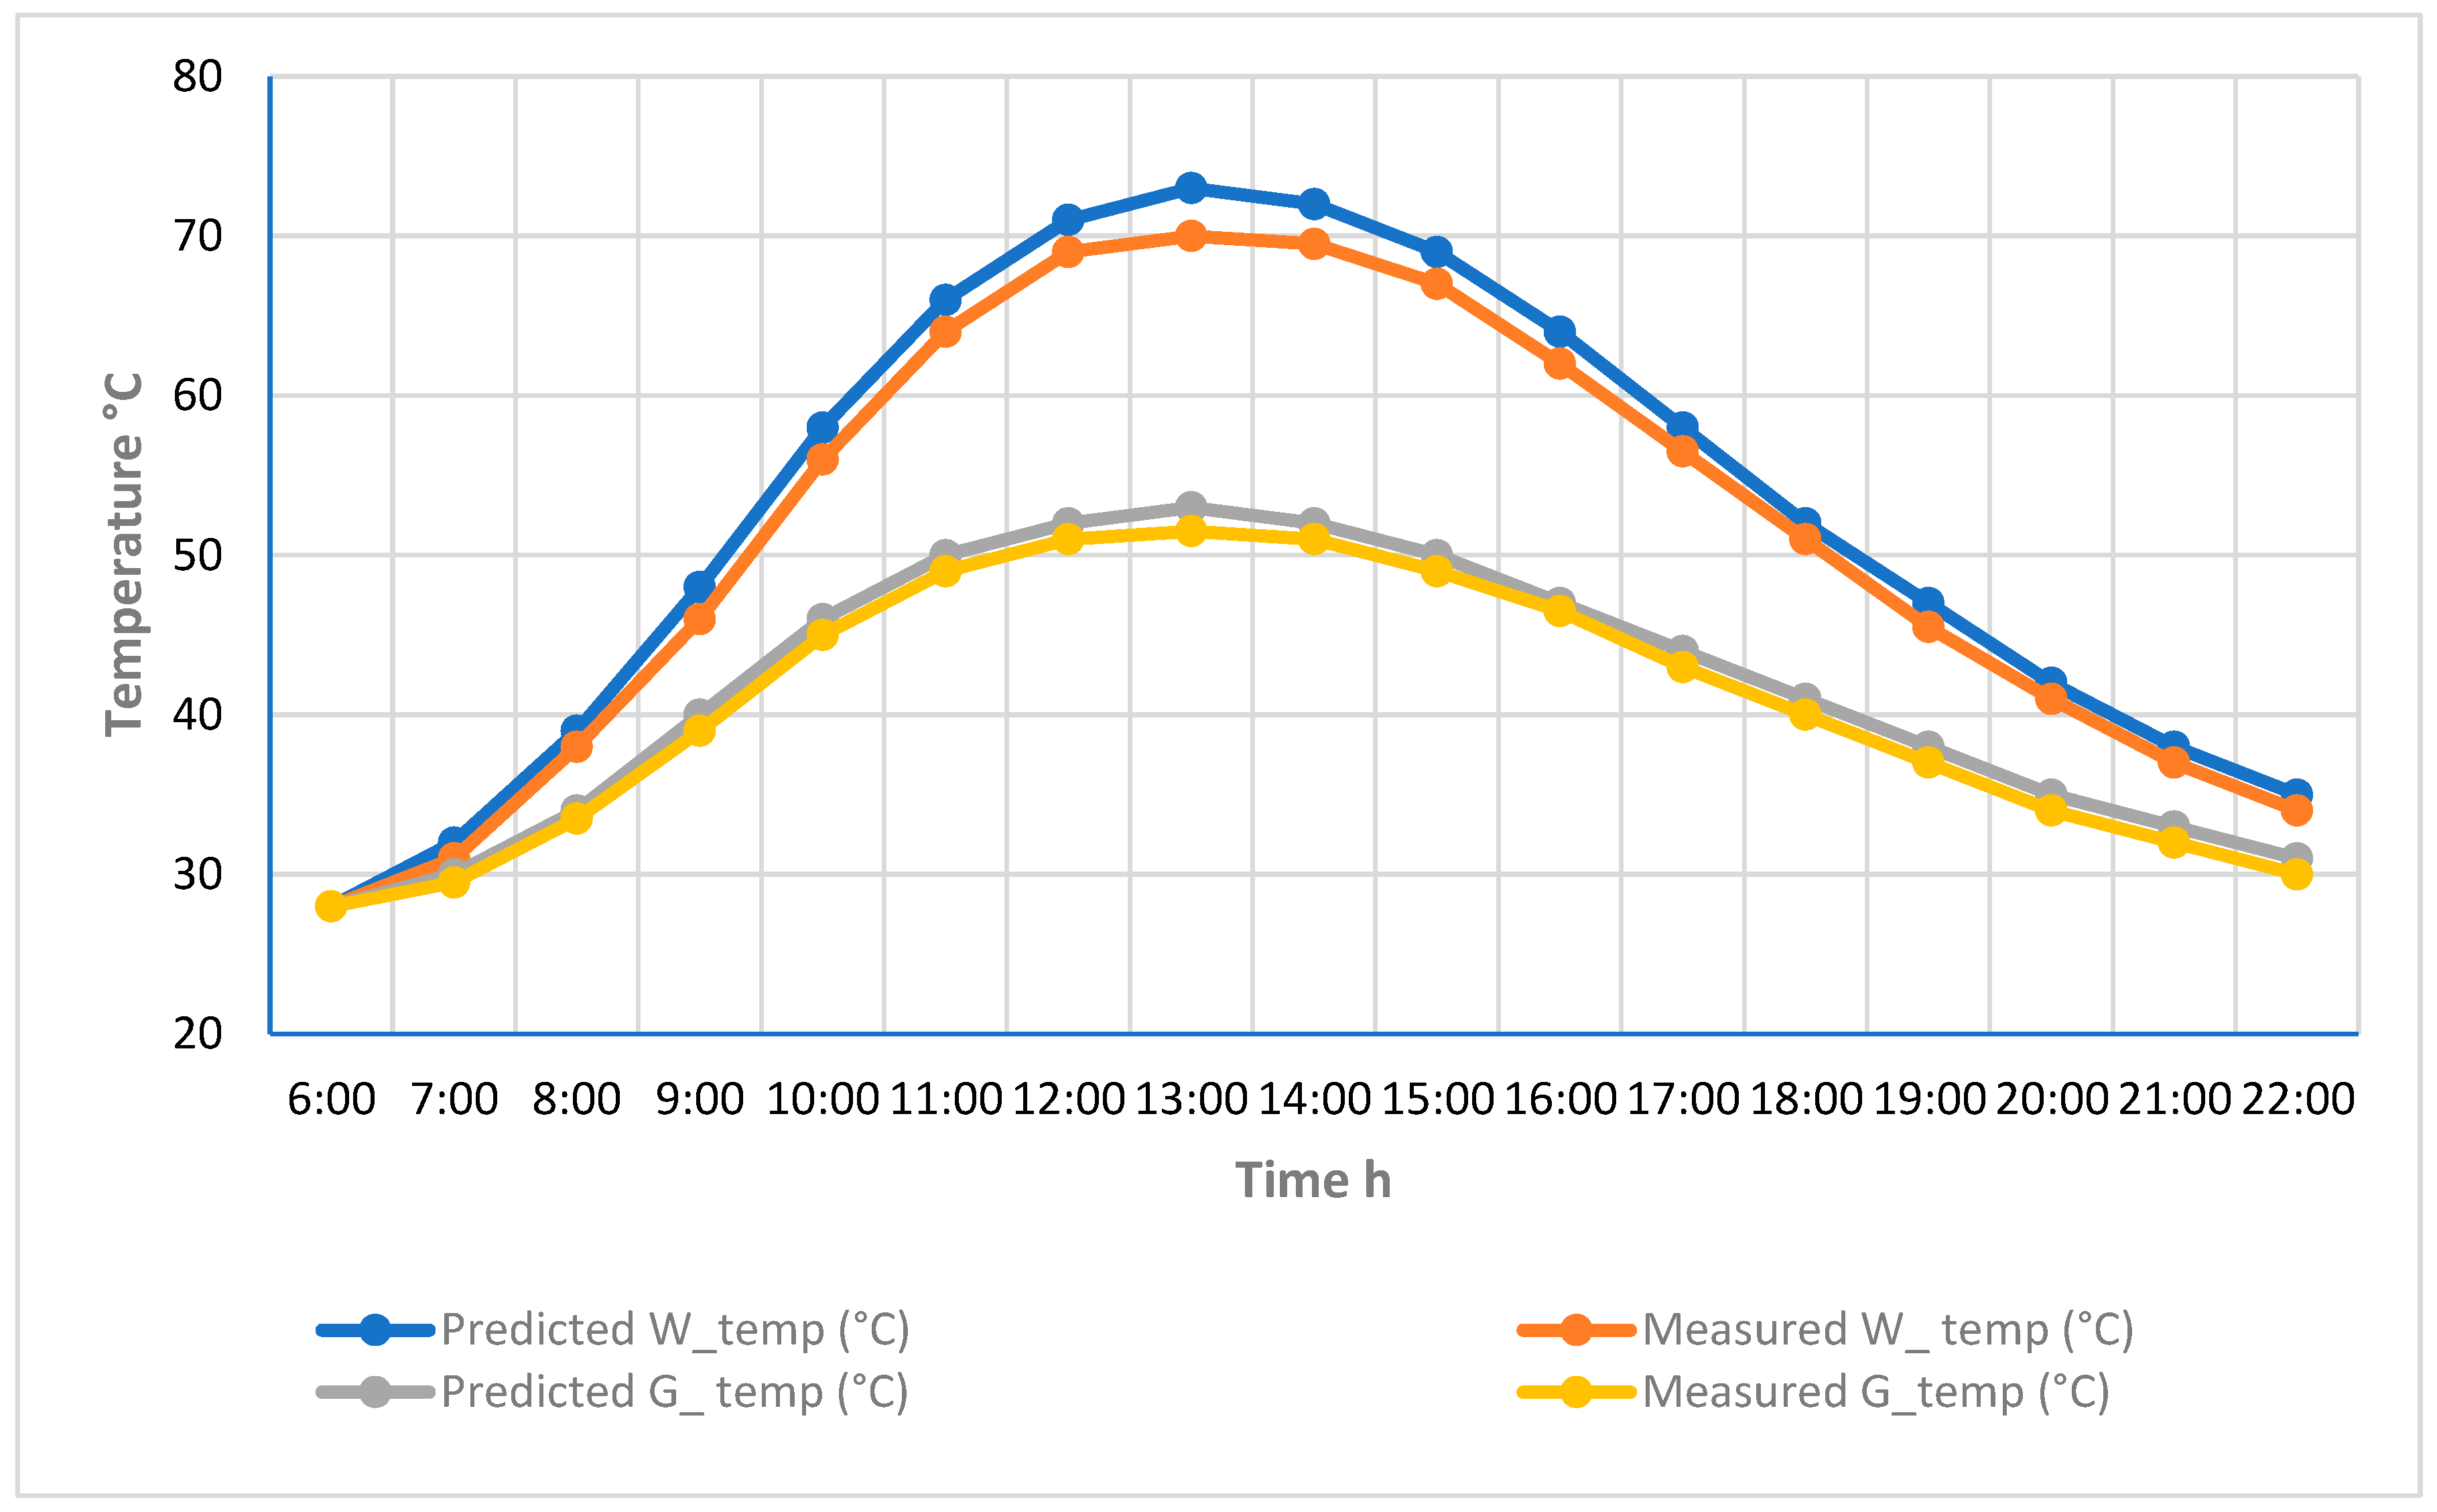
Table I.
Gulf Region Passive Single slope Solar Still Performance.
| Reference | Location | Area (m²) | Depth (m) | Yield (L/m²/day) |
|---|---|---|---|---|
| Khalifa [10] | Doha, QA | 1.0 | 0.04 | 3.10 |
| Al-Hinai [11] | Muscat, OM | 1.0 | 0.05 | 2.85 |
| Hamadou [12] | Riyadh, SA | 0.5 | 0.05 | 3.40 |
| Al-Karaghouli [13] | Kuwait | 0.5 | 0.02 | 4.10 |
| Eltawil [14] | Al-Ain, UAE | 1.0 | 0.04 | 3.25 |
| Al-Hayek [15] | Amman, JO | 1.0 | 0.04 | 2.95 |
| Abdullah [16] | Hurghada, EG | 1.0 | 0.03 | 4.15 |
| Sharshir [17] | Kaferelsheikh, EG | 1.0 | 0.03 | 4.30 |
| Present study | Manama, BH | 0.6 | 0.05 | ≈2.05 |
Table II.
Design Specifications of the Proposed Solar Still.
| Parameter | Value | Basis |
|---|---|---|
| Basin dimensions | 1.0 × 0.6 m | Standard sheet width |
| Basin material | 1.0 mm mild steel | Cost & availability |
| Absorber coating | Matt black acrylic (αw ≈ 0.92) | Solar absorption [18] |
| Glass cover | 4 mm tempered low iron (τg ≈ 0.85) | Transmissivity |
| Glass tilt angle β | 20° | Bahrain optimum [10,19] |
| Water depth (design) | 50 mm | Performance tradeoff [20] |
| Insulation (base & sides) | 30 mm PUR foam (Ub ≈ 0.78 W/m2K) | Heat loss reduction |
Table IV.
Estimated Fabrication Cost Breakdown of the Baseline Design.
| Component | Basis | Cost (BHD) |
|---|---|---|
| Basin (1.0 mm mild steel, basin + walls) | Local sheet metal, cut & formed | 12-16 |
| Tempered glass cover (4 mm, low iron) | Glazing supplier | 22-28 |
| Insulation (30 mm PUR foam, base & sides) | Local supplier | 4-6 |
| Absorber coating (matt black acrylic) | Small quantity coating | 3-5 |
| Sealant, frame hardware, collection trough | Misc. fittings | 5-8 |
| Fabrication labor (cutting, welding, glazing, sealing) | Local workshop | 10-15 |
| Total | ≈68 |
Table V.
Enhancement Strategies vs. Baseline Design.
| Configuration | Yield (L/m²/day) | Δ vs Baseline | Incr. Cost (BHD) | Marginal Cost (fils/L) |
|---|---|---|---|---|
| Baseline | 2.05 | — | — | — |
| Latent heat recovery (LHR) | 2.37 | +16% | +18 | 53.4 |
| Basin fins | 2.25 | +10% | +12 | 56.9 |
| External air condenser | 2.50 | +22% | +35 | 73.8 |
| LHR + External condenser | 2.78 | +36% | +53 | 68.9 |
| LHR + Fins + Ext. condenser | 2.93 | +43% | +65 | 70.1 |
Disclaimer/Publisher’s Note: The statements, opinions and data contained in all publications are solely those of the individual author(s) and contributor(s) and not of MDPI and/or the editor(s). MDPI and/or the editor(s) disclaim responsibility for any injury to people or property resulting from any ideas, methods, instructions or products referred to in the content. |
© 2026 by the authors. Licensee MDPI, Basel, Switzerland. This article is an open access article distributed under the terms and conditions of the Creative Commons Attribution (CC BY) license (http://creativecommons.org/licenses/by/4.0/).
Copyright: This open access article is published under a Creative Commons CC BY 4.0 license, which permit the free download, distribution, and reuse, provided that the author and preprint are cited in any reuse.


