

Submitted:
16 July 2026
Posted:
17 July 2026
You are already at the latest version
Abstract
Background/Objectives: Meal sequence (MS) has been proven to suppress the postprandial blood glucose variability, potentially preventing the onset of diabetes and its complications. However, existing evidence in healthy individuals has not been conclusive because it solely focuses on single-meal postprandial glucose, overlooking the potential influence of preceding meals. Methods: A 24-day randomized, single-blinded crossover study investigated the MS effect in real-life settings. Among 12 participants, 8 (66.7%) were female, with 158/342 (46.2%) observations available for analysis. Results: In per-protocol (PP) analysis, the effect of MS on incremental glucose peak (IGP) was -11.47 (95% confidence interval [CI] -38.04 to 15.09, p-value = 0.395) mg/dL. After adjusting for confounders in model 2 and model 3, the effect of MS on IGP was -12.24 (95% CI -37.09 to 12.61) and -11.25 (95% CI -40.63 to 20.13), respectively. In intention-to-treat analysis (ITT), the effect of MS on IGP was -12.09 (95% CI -38.82 to 14.65, p-value = 0.373) mg/dL. After adjusting for confounders in model 2 and model 3, the effect of MS on IGP was -12.75 (95% CI -37.62 to 12.12) and -14.31 (95% CI -47.14 to 18.53), respectively. Conclusions: This result contradicts previous studies conducted in diabetes patients under free-living conditions and in both healthy individuals and diabetes participants in experimental settings. Discrepancies may be due to different instruction designs, low MS adherence, and irregular meal timing in healthy participants under the free-living conditions of our study. This study reported no evidence of MS effect on the IGP in young, healthy individuals in a real-life time setting. The improved meal quality was seen while following MS by increasing fiber intake and prolonging meal duration. Further studies should aim to stabilize meal timing and strictly instruct the MS implementation.
Keywords:
blood glucose
; diabetes prevention and control
; healthy eating
; meal sequence
; postprandial blood glucose (PPG)
1. Introduction
Diabetes is a significant global health burden [1] that can lead to comorbidities, including cardiovascular disease, and significantly affect the quality of life (QOL).[2,3] Therefore, early detection and treatment (secondary prevention) and prevention of the onset of diabetes (primary prevention) are essential in the fight against diabetes.
For diabetes prevention and treatment, adopting lifestyle habits such as increasing physical activity and improving eating habits is recommended.[4,5] Current evidence suggests a variety of healthy eating patterns, and it is essential to emphasize the significance of nutritional balancing and reducing glycemic load in nutritional counseling.[6] However, maintaining a nutritional balance can be challenging due to reported low adherence.[7] Remarkably, meal sequence (MS) alteration, a simple strategy to reduce glycemic load, has the potential to address these challenges, as it has been found to have higher adherence than a nutritional balance strategy.[8] Specifically, MS involves manipulating the order of macronutrient consumption in a dietary approach that emphasizes eating fiber-rich foods first, followed by protein and fats, and finally carbohydrates, relying on typical natural foods rather than supplement products. In diabetes patients, MS was proven to suppress postprandial blood glucose and insulin levels, stimulate glucagon-like peptide-1 (GLP-1) secretion, and delay gastric emptying.[9,10,11,12,13,14] An 8-week intervention study on diabetes patients reported improved glycemic control in the MS group.[12] Other research in healthy individuals suggests that MS can reduce postprandial blood glucose levels and minimize the incremental glucose peak (IGP) within 180 minutes after a meal.[15] These findings indicate that MS may alleviate the IGP after a meal. Additionally, suppressing IGP also benefits by reducing oxidative stress caused by the overproduction of superoxide by the mitochondrial electron-transfer chain due to IGP. This, in turn, may reduce the risk of developing type 2 diabetes or its complications.[16,17,18,19,20,21]
Although the positive impact of MS has been demonstrated in diabetes patients [9,10,11,12,13,22,23,24], its effects on healthy individuals have only been investigated within a single meal in an experimental setting, which did not take into account the influences of previous meals on blood glucose levels without a certain fasting period [15]. Thus, the impact of MS in a non-experimental setting among healthy individuals remains unclear.[10,15] To address this gap, we aim to elucidate the effect of MS under everyday conditions by analyzing glucose levels obtained through continuous monitoring throughout the day. It is hypothesized that MS can attenuate the incremental glucose peak (IGP [the blood glucose difference between the start of a meal and the maximum value observed within 180 minutes postprandially]) in real-world settings among healthy individuals. If effective, MS could serve as a simple eating pattern and a low-effort strategy to help prevent the onset of type 2 diabetes.
2. Materials and Methods
Study design: The trial was a randomized, single-masked, 2 by 2 crossover study lasting 24 days: titration (2 days); treatment period one (7 days); washout period (7 days); and finally, treatment period two (7 days). Participants were randomly assigned to two groups: one began with intervention in period one and control in period two (Sequence 1). At the same time, the other started with control in period one and intervention in period two (Sequence 2). The details of the trial design are presented in Figure S1. Both treatment periods began on the same weekday.
Participants: Healthy students from the Kanagawa University of Human Services Nutrition Department, aged over 18 with a body mass index (BMI) < 35 kg/m2, owning a Dexcom G6-compatible smartphone, and capable of using Smart Nutrition Calculation Ver. 6.0 (or higher) were recruited voluntarily for this study.[25,26] Exclusion criteria included a history of diabetes or endocrine disorders, depression, dermatitis, anaphylaxis, current pregnancy or lactation, metal allergies, and use of corticosteroids, thiazide diuretics, or hydroxycarbamide. The Institutional Ethics Committee of the Graduate School of Health Innovation, Kanagawa University of Human Services, approved the study (2023-36-002), and all participants provided informed consent. The study was performed in Kanagawa University of Human Services and the living area of research participants from August 7th, 2023, to August 30th, 2023.
Intervention: During the intervention period, participants were instructed to limit their SS intake, which is both carbohydrate, for the initial 10 minutes of each meal, including avoiding sugary drinks. After this period, they could consume the rest of the meal as desired. No additional dietary restrictions were imposed, allowing participants to eat normally. In the control period, participants were instructed to maintain their usual eating habits without specific guidelines.
Data measurement: Participants utilized the Smart Nutrition Calculator Ver 6.0+ (Ishiyaku Publishing, Tokyo) to track meal nutrients, comprising carbohydrates, protein, and fat.[25] Participants were asked to fill in the diet diary, noting meal times, snacks, alcohol intake, and adherence to MS, as well as the questionnaire that contained information regarding biological sex, the start time of the meal, and the end time of the meal. Meal duration was determined from start and end times. We analyzed carbohydrate, protein, and fat intake, excluding meals with alcohol. Height, weight, BMI, and body composition were measured using a Tanita MC-780A.[27] Blood glucose (mg/dL) was monitored 24 hours in 5 minutes intervals using Dexcom G6. The sensor required to measure blood glucose for Dexcom G6 is only valid for 10 days. Thus, the sensor was installed 48 to 72 hours before each treatment period. The daily calorie expenditure (Kcal) was measured using the Oura ring generation 2.[28] IGP was calculated. Time in range (TIR) measured the duration of blood glucose remaining between 70 and 180 mg/dL within 180 minutes post-meal. The time above range (TAR) calculates the duration of blood glucose exceeding or equaling 180 mg/dL within the same timeframe.
Primary endpoint and sample size calculation: We analyzed participants with data available for at least ten meals during the intervention period. The primary endpoint was IGP, previously used in similar studies. In the control group, IGP (standard deviation [SD]) was 51.8 (21.6) mg/dl, compared to 28.1 (27.9) mg/dl in the MS group, with a Cohen’s d of 0.95.[29] Our study aims to study in everyday life settings rather than experimental conditions. We consider an IGP of 32.8 mg/dl (SD 27.9, Cohen’s d = 0.76) or less in the MS group as a meaningful difference. With an alpha error of 5% and a beta error of 20%, a sample size of 14 participants was calculated for a linear mixed model of repeated measures data with missing values.[30] Allowing for exclusions and dropouts, we aimed to recruit 18 participants.
Sequence generation: Participants were randomly assigned to groups using a stratified block design based on biological sex. Allocation was determined by a computer-generated random number list, with the investigator blinded to group assignments until the primary outcome analysis.
Statistical methods: Statistical analyses were performed using R (Version 4.1.0; R Core Team, Vienna, Austria)[31]. The study assessed IGP as a primary endpoint; the higher IGP means worse blood glucose management. TIR and TAR were measured as secondary endpoints; the higher TIR means better blood glucose management, while the higher TAR means worse blood glucose management. Linear mixed models were estimated via the R package lme4. Both per-protocol analysis and intention-to-treat analysis were conducted to ensure accurate conclusions regarding the effectiveness of the intervention. Glucose levels (mg/dL) over time were analyzed using generalized additive models (GAM) to assess the effect of different interventions on blood glucose levels. Blood glucose data were extracted at 5-minute intervals within 180 minutes from the start of the meal. A smooth curve was fitted to the data using GAM with a 95% confidence interval to visualize trends. The interventions were categorized into “control” and “MS”, each represented by distinct colors in the plots. The results were visualized using the ggplot2 package. Intervention and treatment periods were coded as 0 for control, 1 for intervention (MS) periods, 0 for the first treatment period, and 1 for the second treatment period. Interaction terms were used to evaluate allocation and carry-over effects; a p-value < 0.05 for the interaction term between treatment and period indicates a potential carry-over effect. The model was adjusted for nutritional intake (carbohydrate, protein, and fat per meal), snack consumption, and meal duration. The stepwise analysis included evaluating the association between IGP and MS (model 1), then adding carbohydrate intake (model 2), and finally adding protein, lipid intake, snack ingestion, length of meal, daily calorie expenditure, inter-meal interval, total bedtime, total sleep time, and BMI (model 3).
3. Results
Among the 12 participants who consented to the study, only 10/12 participants fully completed data submission, and 8/10 participants with 158/342 (46.2%) observations were available for analysis. Details of the participant flow are presented in Figure 1. Table 1 and Table S1 show the characteristics of the participants; all available participants are female with a mean (SD) age of 21.0 (0.9) years. The mean (SD) of BMI, muscle weight, and fat percentage were 20.7 (2.0) kg/m2, 35.5 (3.0) kg, and 27.7 (4.7) %, respectively. Additionally, all participants knew the definition of MS strategy, but no one had followed it before the study.
Figure 2 illustrates blood glucose fluctuation within 180 minutes following PP analysis; the blue represents the blood glucose in the MS treatment period, and the red represents the blood glucose in the control period.
Table 2 shows the different characteristics between the two periods in PP analysis. The mean (SD) IGP was reported as 50.0 (26.7) mg/dL when following MS and 61.7 (31.1) mg/dL when eating as usual (p-value for difference in means = 0.062). The mean (SD) of meal duration was reported as 18.8 (10.1) minutes when normal eating and 24.1 (9.5) minutes when following MS (p-value for the difference in means < 0.001). The mean (SD) of fiber ingestion was reported as 5.2 (2.2) g when following MS and 4.4 (3.4) g when eating as usual (p-value for the difference in means is 0.001). The MS compliance was about 80%.
The effect of MS on IGP in PP analysis was -11.47 (95% confidence interval [CI] -38.04 to 15.09, p-value = 0.395) mg/dL (Table 3). After adjusting for confounders in model 2 and model 3, the effect of MS on IGP was -12.24 (95% CI -37.09 to 12.61) and -11.25 (95% CI -40.63 to 20.13), respectively. The coefficient for the 10 gram intake of carbohydrates on IGP was 3.06 (95% CI 1.51 to 4.61, p-value < 0.001) mg/dL in model 2 and 3.97 (95% CI 2.43 to 5.51, p-value < 0.001) mg/dL in model 3. The coefficient for 10 gram lipid intake on IGP was -5.64 (95% CI -9.94 to -1.35, p-value = 0.010) mg/dL in model 3.
The effect of MS on TIR in PP analysis was 2.38 (95% CI -7.56 to 12.36, p-value = 0.638) percentage (Table S4). After adjusting for confounders in model 2 and model 3, coefficients for the treatment effect on TIR were 2.64 (95% CI -7.40 to 12.68) percentage and 2.97 (95% CI -7.63 to 13.57) percentage, respectively. The coefficient for 10 gram intake of carbohydrates on TIR was -1.17 (95% CI -2.04 to -0.29, p-value = 0.009) percentage in model 2 and -1.43 (95% CI -2.34 to -0.52, p-value = 0.002) percentage in model 3.
The effect of MS on TAR in PP analysis was -2.67 (95% CI –10.82 to 5.49, p-value = 0.519) percentage (Table S6). After adjusting for confounders in model 2 and model 3, coefficients for the treatment effect on TAR were -2.88 (95% CI -10.82 to 5.49) percentage and -2.88 (95% CI -11.12 to 5.36) percentage, respectively. The coefficient for 10 gram intake of carbohydrates on TAR was 0.97 (95% CI 0.22 to 1.71, p-value = 0.011) percentage in model 2 and 1.16 (95% CI 0.38 to 1.94, p-value = 0.004) percentage in model 3. The coefficient for 10 gram lipid intake on TAR was -2.24 (95% CI -4.41 to -0.06, p-value = 0.044) percentage.
Table 4 summarizes generalized additive model results for blood glucose following PP analysis. The difference in glucose value between interventions was reported at – 3.142 mg/dL (standard error [SE] = 6.954, p-value = 0.615). The difference in glucose value between periods was reported at – 2.794 mg/dL (SE = 6.963, p-value = 0.688).
4. Discussion
Our study did not find a statistically significant effect of MS on IGP in healthy individuals. However, the analysis of glucose levels over 180 minutes using generalized additive models (GAM) revealed a potential difference between the MS and normal eating, suggesting that the overall glucose response may be influenced by the sequence of food intake even if the IGP remains unchanged.
The absence of a difference in IGP suggests that the short-term effects of the MS strategy, which only manipulates the sequence of macronutrient ingestion, may not be sufficient to impact IGP in young, healthy individuals under free-living conditions. Nevertheless, the potential differences observed in the glucose trajectories using GAM indicate that MS may have subtler effects on glucose regulation over time. This could be clinically relevant, particularly in populations at higher risk for glucose intolerance.
The GAM analysis provided a more nuanced view of the glucose response over time, revealing potential differences in glucose levels between the MS strategy and normal eating. While these differences were not evident for the primary outcome (IGP), the distinct trajectories observed suggest that MS may influence the overall glucose response in ways not captured by IGP alone. This finding implies that MS might have a more prolonged or cumulative effect on glucose regulation, potentially offering benefits in long-term glucose management. The GAM analysis underscores the importance of considering IGP and the broader glucose profile when evaluating dietary interventions. Future studies could explore these temporal patterns in more detail to determine whether specific subgroups or conditions might benefit from the MS strategy over extended periods. This may be why a recent MS study in prediabetes failed to observe a meaningful effect of MS.
Our primary finding is inconsistent with previous studies conducted on type 2 diabetic patients under free-living conditions[12], as well as in both healthy [15]and diabetic patients[9] under experimental conditions. The inconsistent results may also be explained by the following reasons. First, the difference in the intervention instruction in this study may have limited the non-SS intake at the beginning of the meal. Previous studies in healthy individuals were conducted in an experimental setting, allowing strict enforcement of consumption of the entire portion of vegetables, protein, and fat before SS ingestion. However, this study was more concerned with the potential for the MS strategy to be applied in everyday life and accordingly tried to facilitate the participants’ performance by only recommending limiting SS intake within 10 minutes of the beginning of the meal without specifying a specific amount. Based on the study instructions, participants likely consumed insufficient amounts of non-SS components beforehand, which may have been ineffective in hindering glucose absorption. The effect of prior non-SS intake on glucose metabolism can be explained through the three mechanisms by which dietary fiber, a non-SS component, affects glucose metabolism. Dietary fiber increases the viscosity of small intestine juice, hindering the diffusion of glucose[32]. Dietary fiber also occludes glucose and reduces the concentration of available glucose in the small intestine. Dietary fiber retards alpha-amylase action by encapsulating starch and the enzyme and may directly inhibit the enzyme. [32]
A second possible explanation is related to adherence to MS. Adherence to MS in this study was about 80%, which is lower compared to a similar study in patients with diabetes (95%), [12] suggesting that participants were not successfully following MS. Following the MS strategy has been shown to benefit the health of individuals with diabetes. [22,23] Research has shown that diabetes patients have a better health perception,[33] enabling them to better adhere to MS. In contrast, adhering to MS proved challenging for our study’s participants, who are young and healthy individuals. This was due to unclear perceived benefits of following MS, as they are already in good health. Future research should consider ways to better incentivize healthy behaviors in a healthy population and improve adherence to the MS strategy. Of note, the 80% adherence observed in this study might serve as a future reference for expected adherence in similar studies investigating the effect of MS in healthy participants under free-living conditions.
Third, it is essential to note that this study tried to facilitate the strategy’s performance, and therefore, it did not mandate participants to adhere to regular meal timing. Previous studies have shown that varying meal timing can lead to distinct effects on glucose metabolism. [34,35] The irregular meal timing among participants in our study might have introduced variability in their glucose tolerance, potentially biasing the effect of the MS intervention. [36] This implies that factors like regular meal timing and fasting duration within a day could significantly influence glucose fluctuation in healthy people.
This study has several limitations. One major limitation is the failure to achieve the required sample size, which may have reduced the power of the study to detect differences in IGP. Additionally, the observed effect size was smaller than expected, as indicated by Cohen’s d value of 0.49, compared to the anticipated 0.79. Since MS has been reported to lower IGP by approximately 12 mg/dL with SD at 30 mg/dL, a recalculated sample size based on this effect size suggests that 100 participants would be needed. Notably, a reduction in IGP of 12 mg/dL is equivalent to consuming approximately 25 grams of regular milk. This level of IGP suppression, achieved through a mild intervention, is meaningful for healthy individuals. [37]
Another limitation is that only female participants’ data were eligible for data analysis, so we could not investigate male participants. Previous studies reported that the prevalence of diabetes is higher in men than in women. [38] Besides, among individuals with standard glucose tolerance, women typically display lower fasting plasma glucose (FPG) and hemoglobin A1c (HbA1c) levels than men. [38] This evidence suggests that gender affects the prevalence of diabetes and glucose variability, as glycemia may fluctuate more in men than women. Therefore, solely female participants’ data were available for the analysis, which may limit the study’s generalizability. However, a recent study investigating the effect of MS on blood glucose in prediabetes with an equal proportion of genders also shows no difference in blood glucose when following MS. [39] Thus, our result is relevant for the healthy female population.
Furthermore, the participants’ self-reported nutrition intake may result in a compliance-dependent bias. Besides, the procedure was complex, requiring healthy participants to record their diet diary and dietary intake for long periods. Despite receiving thorough instruction, some participants could not provide sufficient data due to technical problems, precisely synchronizing their equipped Dexcom G6 with their smartphones. Moreover, the amount of vegetables, protein, and fats consumed before SS intake was not measured. Thus, the non-SS ingestion percentage in the meal’s first part can not be assessed.
Notably, meals following MS showed significant increases in dietary fiber intake compared to the regular diet (Table 2, Table S1). This finding is consistent with a previous study conducted in the United States[39], which shows following the MS strategy increases the consumption of vegetables and protein. Research has linked increased dietary fiber consumption with several health advantages, such as enhanced insulin sensitivity and improvement in postprandial glycemia. [32,40,41,42] Additionally, the study found a 5.3 minute increase in meal duration for participants adhering to an MS compared to those on a normal diet (Table 2). Eating slowly has been shown to impact human health positively[43,44]. While this study intervention did not provide direct evidence of MS ‘s impact on IGP, TIR, or TAR, it may improve health by increasing dietary fiber intake and extending meal duration.
5. Conclusions
In conclusion, this study did not find statistical evidence that the MS strategy significantly attenuates IGP in healthy young individuals under free-living conditions. However, the observed differences in glucose trajectories and the improvements in diet quality suggest that MS might still offer some benefits. Further research is needed to reevaluate the effects of MS on blood glucose in populations at higher risk for glucose intolerance, such as middle-aged or elderly individuals, in real-world settings.
Supplementary Materials
The following supporting information can be downloaded at the website of this paper posted on Preprints.org, Figure S1: Overview of Study Design; Figure S2: The smooth line of blood glucose over 180 minutes after starting the meal (Intention to treat); Table S1: Participant characteristics; Table S2: Difference between the following meal sequence and normal eating (Intention to Treat); Table S3: A linear mixed model of Incremental Glucose Peak (Intention to Treat) (8 subjects, 158 observations); Table S4: A linear mixed model of Time In Range (Per Protocol) (8 subjects, 141 observations); Table S5: A linear mixed model of Time In Range (Intention to Treat) (8 subjects, 158 observations); Table S6: A linear mixed model of Time Above Range (Per Protocol) (8 subjects, 141 observations); Table S7: A linear mixed model of Time Above Range (Intention to Treat) (8 subjects, 158 observations); Table S8: Summary of Generalized Additive Model Results for Blood Glucose (Intention to Treat).
Author Contributions
Conceptualization, A.T.Q., S.N., H.N.; methodology, A.T.Q., S.N., H.N.,; software, A.T.Q., S.N., H.N., L.T., T.S. and A.K.S.; validation, A.T.Q., S.N., H.N.; formal analysis, A.T.Q., S.N. and L.N.; investigation, A.T.Q., S.N., and K.T.; resources, A.T.Q., H.N., S.N.; data curation, A.T.Q., H.N. and S.N.; writing—original draft preparation, A.T.Q., S.N., H.N., K.T., T.S. and A.K.S.; writing—review and editing, A.T.Q., S.N., H.N., L.N., K.T, T.S. and A.K.S.; visualization, A.T.Q., S.N.; supervision, A.T.Q, S.N., H.N.; project administration, A.T.Q., S.N.; funding acquisition, S.N. and A.T.Q.; S.N. had full access to all of the data in the study and took responsibility for the integrity of the data and the accuracy of the data analysis. All authors have read and agreed to the published version of the manuscript.
Funding
This research received no external funding.
Institutional Review Board Statement
The study was conducted in accordance with the Declaration of Helsinki, and approved by the Institutional Review Board of the Graduate School of Health Innovation, Kanagawa University of Human Services, SHI No. 15 (5th July 2023).
Informed Consent Statement
Informed consent was obtained from all subjects involved in the study.
Data Availability Statement
The datasets used and/or analyzed during the current study are available from the corresponding author upon reasonable request. Data is not publicly available due to participants’ privacy concerns.
Acknowledgments
We are grateful to students from the Nutrition Department, Kanagawa University of Human Services, who participated in this study. The authors have reviewed and edited the output and take full responsibility for the content of this publication.
Conflicts of Interest
The authors declare no conflicts of interest.
References
- Resources, Home; L with, diabetes; et al. IDF Diabetes Atlas 2021 | IDF Diabetes Atlas. Available online: https://diabetesatlas.org/atlas/tenth-edition/ (accessed on 6 September 2022).
- Gu, S.; Wang, X.; Shi, L.; et al. Health-related quality of life of type 2 diabetes patients hospitalized for a diabetes-related complication. Qual. Life Res. 2020, 29(10), 2695–2704. [Google Scholar] [CrossRef] [PubMed]
- Shao, H.; Yang, S.; Fonseca, V.; Stoecker, C.; Shi, L. Estimating Quality of Life Decrements Due to Diabetes Complications in the United States: The Health Utility Index (HUI) Diabetes Complication Equation. Pharmacoeconomics 2019, 37(7), 921–929. [Google Scholar] [CrossRef] [PubMed]
- Tabák, A.G.; Herder, C.; Rathmann, W.; Brunner, E.J.; Kivimäki, M. Prediabetes: A high-risk state for developing diabetes. Lancet 2012, 379(9833), 2279–2290. [Google Scholar] [CrossRef] [PubMed]
- Ojo, O. Dietary Intake and Type 2 Diabetes. Nutrients 2019, 11(9), 2177. [Google Scholar] [CrossRef] [PubMed]
- ElSayed, N.A.; Aleppo, G.; Aroda, V.R.; et al. 5. Facilitating Positive Health Behaviors and Well-being to Improve Health Outcomes: Standards of Care in Diabetes—2023. Diabetes Care 2022, 46 (Supplement_1), S68–S96. [Google Scholar] [CrossRef] [PubMed]
- Baral, J.; Karki, K.B.; Thapa, P.; et al. Adherence to Dietary Recommendation and Its Associated Factors among People with Type 2 Diabetes: A Cross-Sectional Study in Nepal. J. Diabetes Res. 2022, 2022, 6136059. [Google Scholar] [CrossRef] [PubMed]
- Yabe, D.; Kuwata, H.; Fujiwara, Y.; et al. Dietary instructions focusing on meal-sequence and nutritional balance for prediabetes subjects: An exploratory, cluster-randomized, prospective, open-label, clinical trial. J. Diabetes Complicat. 2019, 33(12), 107450. [Google Scholar] [CrossRef] [PubMed]
- Shukla, A.P.; Andono, J.; Touhamy, S.H.; et al. Carbohydrate-last meal pattern lowers postprandial glucose and insulin excursions in type 2 diabetes. BMJ Open Diabetes Res. Care 2017, 5(1), e000440. [Google Scholar] [CrossRef] [PubMed]
- Shukla, A.P.; Iliescu, R.G.; Thomas, C.E.; Aronne, L.J. Food Order Has a Significant Impact on Postprandial Glucose and Insulin Levels. Diabetes Care 2015, 38(7), e98–e99. [Google Scholar] [CrossRef] [PubMed]
- Kubota, S.; Liu, Y.; Iizuka, K.; Kuwata, H.; Seino, Y.; Yabe, D. A Review of Recent Findings on Meal Sequence: An Attractive Dietary Approach to Prevention and Management of Type 2 Diabetes. Nutrients 2020, 12(9), 2502. [Google Scholar] [CrossRef] [PubMed]
- Tricò, D.; Filice, E.; Trifirò, S.; Natali, A. Manipulating the sequence of food ingestion improves glycemic control in type 2 diabetic patients under free-living conditions. Nutr. Diabetes 2016, 6(8), e226–e226. [Google Scholar] [CrossRef] [PubMed]
- Kuwata, H.; Iwasaki, M.; Shimizu, S.; et al. Meal sequence and glucose excursion, gastric emptying and incretin secretion in type 2 diabetes: a randomised, controlled crossover, exploratory trial. Diabetologia 2016, 59(3), 453–461. [Google Scholar] [CrossRef] [PubMed]
- Bae, J.H.; Kim, L.K.; Min, S.H.; Ahn, C.H.; Cho, Y.M. Postprandial glucose-lowering effect of premeal consumption of protein-enriched, dietary fiber-fortified bar in individuals with type 2 diabetes mellitus or normal glucose tolerance. J. Diabetes Investig. 2018, 9(5), 1110–1118. [Google Scholar] [CrossRef] [PubMed]
- Sun, L.; Goh, H.J.; Govindharajulu, P.; Leow, M.K.S.; Henry, C.J. Postprandial glucose, insulin and incretin responses differ by test meal macronutrient ingestion sequence (PATTERN study). Clin. Nutr. 2020, 39(3), 950–957. [Google Scholar] [CrossRef] [PubMed]
- Monnier, L.; Mas, E.; Ginet, C.; et al. Activation of oxidative stress by acute glucose fluctuations compared with sustained chronic hyperglycemia in patients with type 2 diabetes. JAMA 2006, 295(14), 1681–1687. [Google Scholar] [CrossRef] [PubMed]
- Bancks, M.P.; Carson, A.P.; Lewis, C.E.; et al. Fasting glucose variability in young adulthood and incident diabetes, cardiovascular disease and all-cause mortality. Diabetologia 2019, 62(8), 1366–1374. [Google Scholar] [CrossRef] [PubMed]
- Rösen, P.; Nawroth, P.P.; King, G.; Möller, W.; Tritschler, H.J.; Packer, L. The role of oxidative stress in the onset and progression of diabetes and its complications: asummary of a Congress Series sponsored byUNESCO-MCBN, the American Diabetes Association and the German Diabetes Society. Diabetes/Metabolism Res. Rev. 2001, 17(3), 189–212. [Google Scholar] [CrossRef] [PubMed]
- Monnier, L.; Colette, C. Glycemic Variability: Should we and can we prevent it? Diabetes Care 2008, 31 (Supplement_2), S150–S154. [Google Scholar] [CrossRef] [PubMed]
- Brownlee, M. Biochemistry and molecular cell biology of diabetic complications. Nature 2001, 414(6865), 6865. [Google Scholar] [CrossRef] [PubMed]
- The Pathobiology of Diabetic Complications | Diabetes | American Diabetes Association. Available online: https://diabetesjournals.org/diabetes/article/54/6/1615/14015/The-Pathobiology-of-Diabetic-ComplicationsA (accessed on 10 January 2024).
- Imai, S.; Ma, M.M.; Hasegawa, G.; et al. A simple meal plan of ‘eating vegetables before carbohydrate’ was more effective for achieving glycemic control than an exchange–based meal plan in Japanese patients with type 2 diabetes. 8. [CrossRef]
- Imai, S.; Fukui, M.; Kajiyama, S. Effect of eating vegetables before carbohydrates on glucose excursions in patients with type 2 diabetes. J. Clin. Biochem Nutr. 2014, 54(1), 7–11. [Google Scholar] [CrossRef] [PubMed]
- Soeters, M.R. Food intake sequence modulates postprandial glycemia. Clin. Nutr. 2020, 39(8), 2335–2336. [Google Scholar] [CrossRef] [PubMed]
- 日本食品成分表: 2022八訂: 栄養計算ソフト・電子版付. (No Title). Available online: https://cir.nii.ac.jp/crid/1130855101977039744 (accessed on 21 March 2024).
- Srunyon. How it Works - Dexcom. Dexcom. 30 July 2019. Available online: https://www.dexcom.com/g6/how-it-works (accessed on 19 May 2022).
- mc780an.pdf. Available online: https://api-img.tanita.co.jp/v=1666504375/files/user/support/manual/mc_series/mc780an.pdf (accessed on 21 March 2024).
- Kristiansson, E.; Fridolfsson, J.; Arvidsson, D.; Holmäng, A.; Börjesson, M.; Andersson-Hall, U. Validation of Oura ring energy expenditure and steps in laboratory and free-living. BMC Med. Res. Methodol. 2023, 23, 50. [Google Scholar] [CrossRef] [PubMed]
- Shukla, A.P.; Dickison, M.; Coughlin, N.; et al. The impact of food order on postprandial glycaemic excursions in prediabetes. Diabetes Obes. Metab. 2019, 21(2), 377–381. [Google Scholar] [CrossRef] [PubMed]
- Lu, K.; Luo, X.; Chen, P.Y. Sample size estimation for repeated measures analysis in randomized clinical trials with missing data. Int. J. Biostat. 2008, 4(1), Article 9. [Google Scholar] [CrossRef] [PubMed]
- R: The R Project for Statistical Computing. Available online: https://www.r-project.org/ (accessed on 12 April 2023).
- Ou, S.; Kwok, K.; Li, Y.; Fu, L. In vitro study of possible role of dietary fiber in lowering postprandial serum glucose. J. Agric. Food Chem. 2001, 49(2), 1026–1029. [Google Scholar] [CrossRef] [PubMed]
- Ngetich, E.; Pateekhum, C.; Hashmi, A.; et al. Illness perceptions, self-care practices, and glycemic control among type 2 diabetes patients in Chiang Mai, Thailand. Arch. Public Health 2022, 80(1), 134. [Google Scholar] [CrossRef] [PubMed]
- Leung, G.K.W.; Huggins, C.E.; Bonham, M.P. Effect of meal timing on postprandial glucose responses to a low glycemic index meal: A crossover trial in healthy volunteers. Clin. Nutr. 2019, 38(1), 465–471. [Google Scholar] [CrossRef] [PubMed]
- Leung, G.K.W.; Huggins, C.E.; Ware, R.S.; Bonham, M.P. Time of day difference in postprandial glucose and insulin responses: Systematic review and meta-analysis of acute postprandial studies. Chronobiol. Int. 2020, 37(3), 311–326. [Google Scholar] [CrossRef] [PubMed]
- de Cabo, R.; Mattson, M.P. Effects of Intermittent Fasting on Health, Aging, and Disease. N. Engl. J. Med. 2019, 381(26), 2541–2551. [Google Scholar] [CrossRef] [PubMed]
- Brand-Miller, J.C.; Stockmann, K.; Atkinson, F.; Petocz, P.; Denyer, G. Glycemic index, postprandial glycemia, and the shape of the curve in healthy subjects: analysis of a database of more than 1,000 foods. Am. J. Clin. Nutr. 2009, 89(1), 97–105. [Google Scholar] [CrossRef] [PubMed]
- Tramunt, B.; Smati, S.; Grandgeorge, N.; et al. Sex differences in metabolic regulation and diabetes susceptibility. Diabetologia 2020, 63(3), 453–461. [Google Scholar] [CrossRef] [PubMed]
- Shukla, A.P.; Karan, A.; Hootman, K.C.; et al. A Randomized Controlled Pilot Study of the Food Order Behavioral Intervention in Prediabetes. Nutrients 2023, 15(20), 4452. [Google Scholar] [CrossRef] [PubMed]
- Riccardi, G.; Rivellese, A.A. Effects of dietary fiber and carbohydrate on glucose and lipoprotein metabolism in diabetic patients. Diabetes Care 1991, 14(12), 1115–1125. [Google Scholar] [CrossRef] [PubMed]
- Reynolds, A.N.; Akerman, A.P.; Mann, J. Dietary fibre and whole grains in diabetes management: Systematic review and meta-analyses. PLoS Med. 2020, 17(3), e1003053. [Google Scholar] [CrossRef] [PubMed]
- Anderson, J.W.; Baird, P.; Davis, R.H.; et al. Health benefits of dietary fiber. Nutr. Rev. 2009, 67(4), 188–205. [Google Scholar] [CrossRef] [PubMed]
- Paz-Graniel, I.; Babio, N.; Mendez, I.; Salas-Salvadó, J. Association between Eating Speed and Classical Cardiovascular Risk Factors: A Cross-Sectional Study. Nutrients 2019, 11(1), 83. [Google Scholar] [CrossRef] [PubMed]
- Zhu, B.; Haruyama, Y.; Muto, T.; Yamazaki, T. Association between eating speed and metabolic syndrome in a three-year population-based cohort study. J. Epidemiol. 2015, 25(4), 332–336. [Google Scholar] [CrossRef] [PubMed]
- Marak, M.C.; Calhoun, P.; Damiano, E.R.; Russell, S.J.; Ruedy, K.J.; Beck, R.W. Testing the Real-World Accuracy of the Dexcom G6 Pro CGM During the Insulin-Only Bionic Pancreas Pivotal Trial. Diabetes Technol. Ther. 2023, 25(11), 817–821. [Google Scholar] [CrossRef] [PubMed]
Figure 1.
Participant flow.
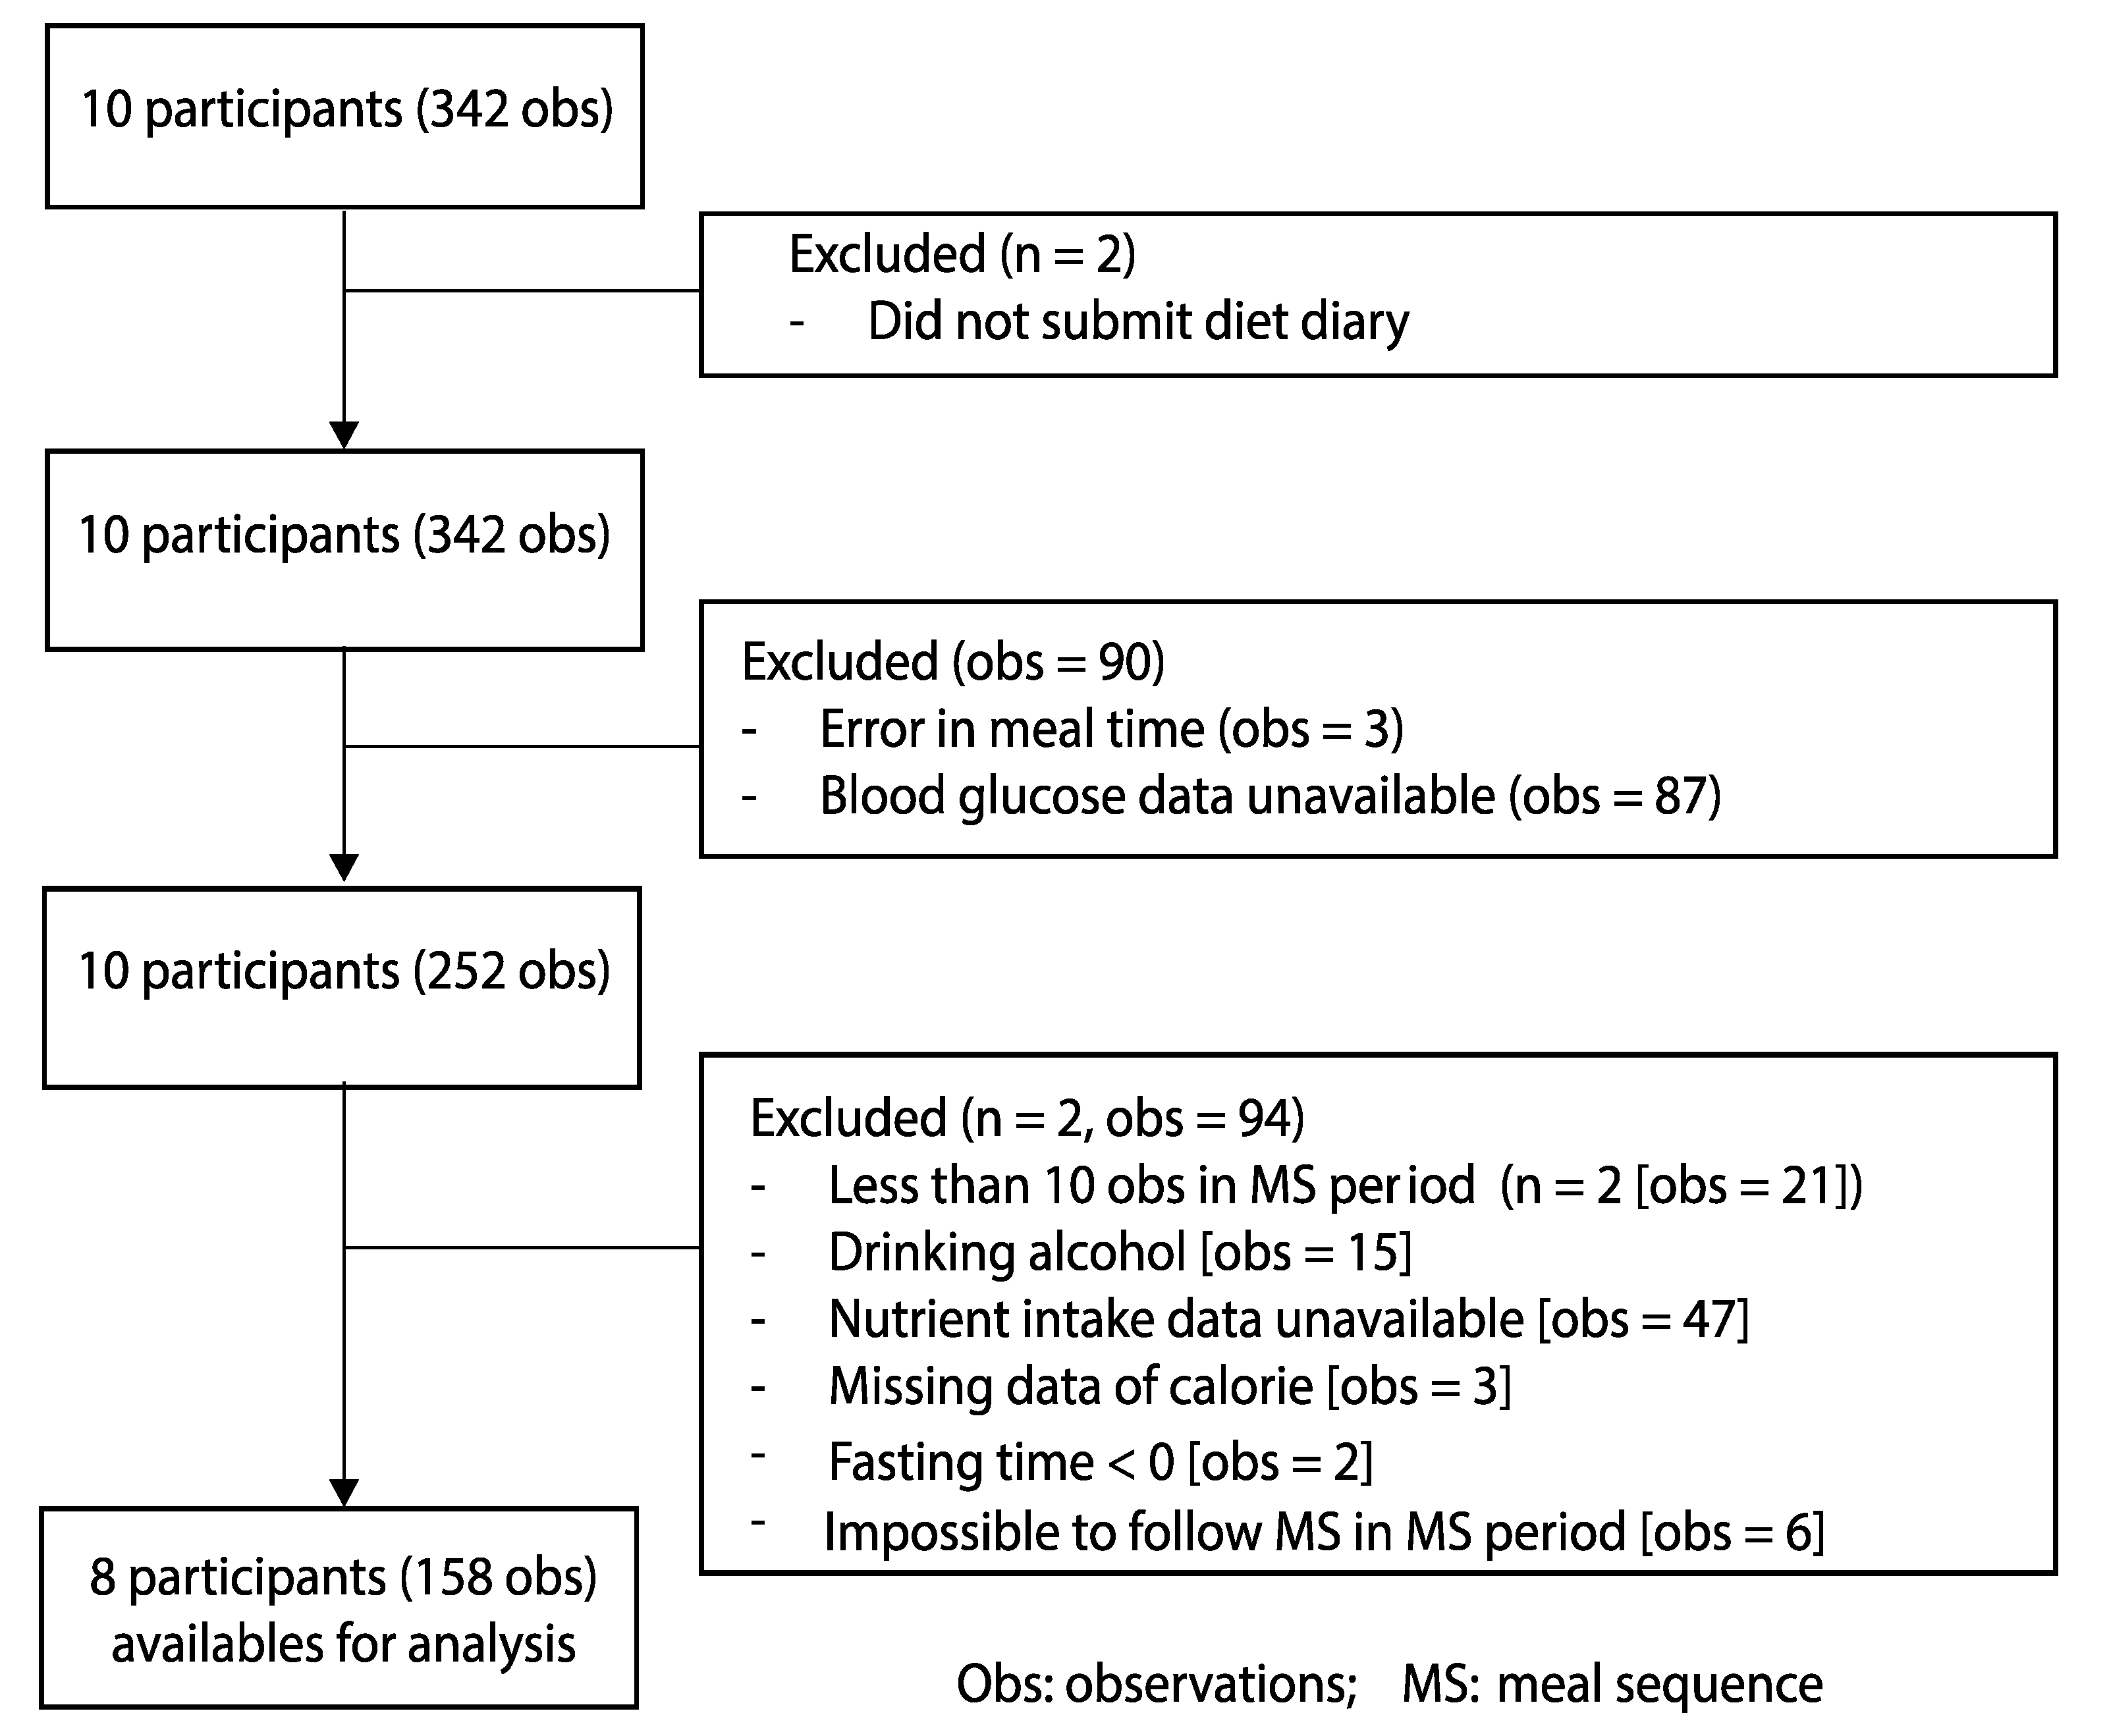
Figure 2.
The smooth line of blood glucose over 180 minutes after starting the meal (Per Protocol). (The Red line presents blood glucose when eating as normal. The blue line represents the blood glucose level following the meal sequence. The shaded area presents the 95% confidence interval of blood glucose. Horizontal reference lines were drawn at 72 mg/dL and 130 mg/dL to denote clinically relevant glucose thresholds. ).
Figure 2.
The smooth line of blood glucose over 180 minutes after starting the meal (Per Protocol). (The Red line presents blood glucose when eating as normal. The blue line represents the blood glucose level following the meal sequence. The shaded area presents the 95% confidence interval of blood glucose. Horizontal reference lines were drawn at 72 mg/dL and 130 mg/dL to denote clinically relevant glucose thresholds. ).
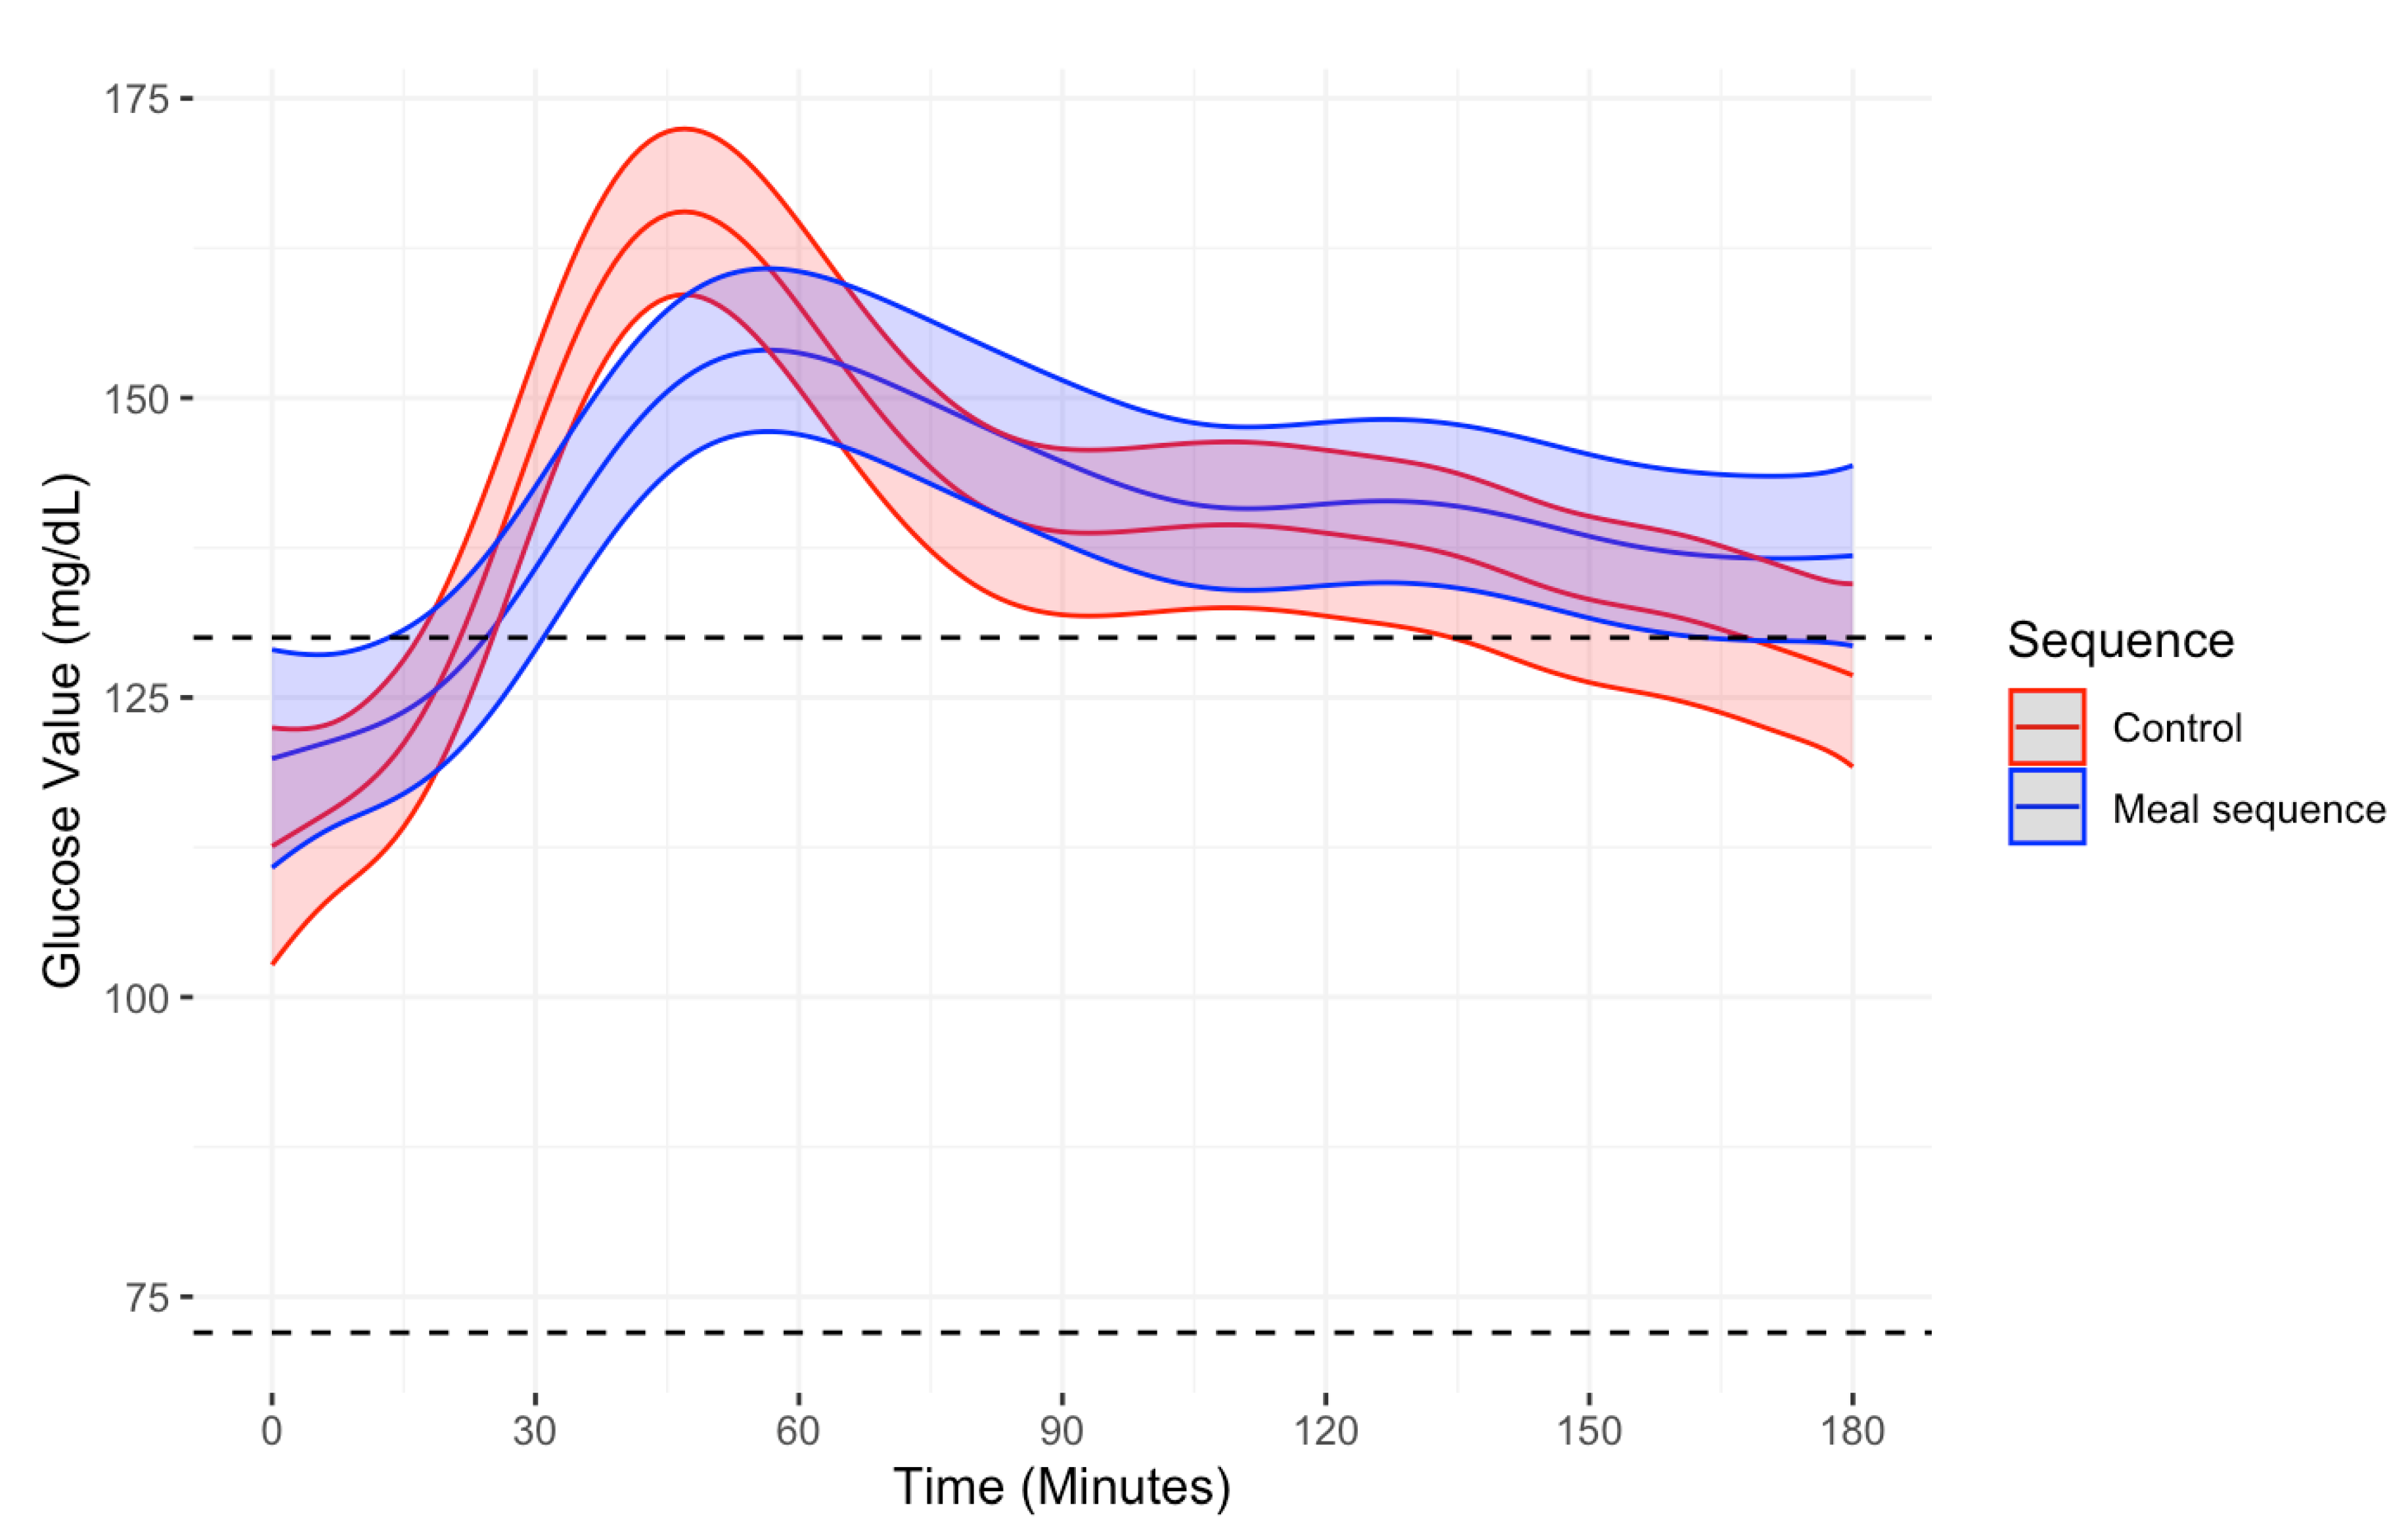

Table 1.
Participant characteristics.
| Characteristic |
Overall (N = 8*) |
Intervention arm | p-value** | |
| MS – Normal (N = 5*) |
Normal – MS (N = 3*) |
|||
| Female | 8 / 8 (100%) | 5 / 5 (100%) | 3 / 3 (100%) | >0.99 |
| Age (years) | 21.0 (0.9) | 20.6 (0.9) | 21.7 (0.6) | 0.16 |
| Body Weight (kg) | 52.4 (6.4) | 51.7 (7.4) | 53.4 (5.5) | >0.99 |
| BMI (kg/m2) | 20.7 (2.0) | 21.0 (2.5) | 20.2 (0.9) | >0.99 |
| Muscle Weight (kg) | 35.5 (3.0) | 34.8 (3.1) | 36.8 (3.0) | 0.39 |
| Fat Percentage | 27.7 (4.7) | 28.3 (6.1) | 26.8 (1.3) | 0.88 |
| Number of observation | 158 | 84 | 74 | |
| * Mean (SD); n / N (%) ** Wilcoxon rank sum test; Wilcoxon rank sum exact test | ||||
| MS: Meal sequence | ||||
Table 2.
Different characteristics between the treatment periods (Per Protocol).
| Characteristic |
Overall n = 141* |
Normal eating n = 73* |
Meal Sequence n = 68* |
p-value** |
| IGP*** (mg/dL) | 56.1 (29.5) | 61.7 (31.1) | 50.0 (26.7) | 0.062 |
| Time In Range (%) | 89.9 (14.9) | 88.2 (17.5) | 91.7 (11.2) | 0.498 |
| Time Above Range (%) | 6.9 (12.7) | 8.6 (15.4) | 5.0 (8.4) | 0.317 |
| Carbohydrate (g) | 60.1 (27.8) | 57.8 (29.7) | 62.6 (25.7) | 0.188 |
| Protein (g) | 18.2 (12.6) | 17.4 (10.5) | 19.0 (14.6) | 0.651 |
| Lipid (g) | 17 (12.2) | 17.5 (14.0) | 16.3 (10.1) | 0.990 |
| Fiber (g) | 4.8 (2.9) | 4.4 (3.4) | 5.2 (2.2) | 0.001 |
| Length of meal (minutes) | 21.3 (10.1) | 18.8 (10.1) | 24.1 (9.5) | <0.001 |
| Daily calorie expenditure (Kcal) | 1862.3 (276.0) | 1898.4 (259.8) | 1823.5 (289.3) | 0.078 |
| Inter-meal interval (hours) | 10.2 (5.0) | 10.4 (4.9) | 10.1 (5.2) | 0.848 |
| Total bedtime (hours) | 7.8 (1.7) | 7.8 (1.8) | 7.8 (1.7) | 0.936 |
| Total sleep time (hours) | 6.3 (1.5) | 6.4 (1.3) | 6.2 (1.7) | 0.422 |
| * Mean (SD) ** Wilcoxon rank sum test. ***IGP: Incremental Glucose Peak Normal eating and Meal sequence correspond to the control and intervention periods of the treatment periods, respectively. | ||||
Table 3.
A linear mixed model of Incremental Glucose Peak (Per Protocol) (8 subjects, 141 observations).
Table 3.
A linear mixed model of Incremental Glucose Peak (Per Protocol) (8 subjects, 141 observations).
| IGP* (Model 1) | IGP* (Model 2) | IGP* (Model 3) | |||||||
| Predictors | Estimates | 95% CI** | p-value | Estimates | 95% CI** | p-value | Estimates | 95% CI** | p-value |
| (Intercept) | 56.93 | 36.36 – 77.60 | <0.001 | 39.19 | 17.88 – 60.50 | <0.001 | 55.72 | -122.19 – 233.63 | 0.537 |
| Meal sequence | -11.47 | -38.04 – 15.09 | 0.395 | -12.24 | -37.09 – 12.61 | 0.332 | -12.25 | -44.63 – 20.13 | 0.455 |
| Treatment period | 0.41 | -26.60 – 27.42 | 0.976 | 1.35 | -23.93 – 26.62 | 0.916 | -3.39 | -36.33 – 29.55 | 0.839 |
| Interaction terms*** | 10.70 | -40.45 – 61.85 | 0.680 | 8.15 | -39.63 – 55.92 | 0.736 | 12.10 | -51.33 – 75.54 | 0.706 |
| Carbohydrate (10g) | 3.06 | 1.51 – 4.61 | <0.001 | 3.97 | 2.43 – 5.51 | <0.001 | |||
| Protein (10g) | -2.53 | -7.16 – 2.10 | 0.282 | ||||||
| Lipid (10g) | -5.64 | -9.94 – -1.35 | 0.010 | ||||||
| Snack (Yes) | -0.27 | -8.27 – 7.73 | 0.947 | ||||||
| Length of Meal (minutes) | -0.45 | -0.92 – 0.02 | 0.061 | ||||||
| Daily Calories Expenditure (100Kcal) | -0.78 | -2.91 – 1.34 | 0.468 | ||||||
| Inter-meal interval (hours) | -0.44 | -1.26 – 0.37 | 0.285 | ||||||
| Total bedtime (hours) | -1.07 | -3.96 – 1.82 | 0.464 | ||||||
| BMI**** | 1.46 | -7.12 – 10.05 | 0.736 | ||||||
| Random Effects | |||||||||
| σ2 | 660.91 | 599.74 | 499.58 | ||||||
| τ00# | 275.27 ID | 238.59 ID | 429.25 ID | ||||||
| ICC | 0.29 | 0.28 | 0.46 | ||||||
| Marginal R2 / Conditional R2 | 0.029 / 0.315 | 0.109 / 0.362 | 0.188 / 0.563 | ||||||
| *IGP: Incremental Glucose Peak **CI: Confidence interval ***Interaction term: Interaction between Meal sequence and Period ****BMI: Body Mass Index #τ00: Intercept | |||||||||
Table 4.
Summary of Generalized Additive Model Results for Blood Glucose (Per-protocol).
| Effect | Estimates | SE | t-value | p-value |
| Intercept | 141.714 | 5.490 | 25.815 | <0.001 |
| Intervention (1 vs 0) | -3.142 | 6.954 | -0.452 | 0.615 |
| Period (1 vs 0) | -2.794 | 6.963 | -0.401 | 0.688 |
| Intervention × Period Interaction | 8.363 | 13.865 | 0.603 | 0.546 |
| SmoothTerms | Edf | Ref.df | F | p-value |
| s(Time, by Intervention 0) | 11.520 | 11.520 | 69.49 | <0.001 |
| s(Time, by Intervention 1) | 8.797 | 8.797 | 38.61 | <0.001 |
|
Adjusted R2: 0.168 Scale estimate: 510.89 Number of observations: 5023 SE, standard error; Edf, effective degree of freedom; Ref.df, reference degree of freedom. | ||||
Disclaimer/Publisher’s Note: The statements, opinions and data contained in all publications are solely those of the individual author(s) and contributor(s) and not of MDPI and/or the editor(s). MDPI and/or the editor(s) disclaim responsibility for any injury to people or property resulting from any ideas, methods, instructions or products referred to in the content. |
© 2026 by the authors. Licensee MDPI, Basel, Switzerland. This article is an open access article distributed under the terms and conditions of the Creative Commons Attribution (CC BY) license.
Copyright: This open access article is published under a Creative Commons CC BY 4.0 license, which permit the free download, distribution, and reuse, provided that the author and preprint are cited in any reuse.


