

Submitted:
15 July 2026
Posted:
17 July 2026
You are already at the latest version
Abstract
Background/Objectives The accurate estimation of glomerular filtration rate (GFR) is essential for assessing trends in the prevalence (CKD), yet standard serum creatinine (SCr)-based estimates (eGFRSCr) are limited by individual variations in muscle mass. While demographic surrogates like age and sex are typically used to account for these variations, they often lead to eGFR misclassification in individuals. This study investi-gated whether normalizing SCr to Dual-energy X-ray absorptiometry (DEXA)-derived Lean Mass Index (LMI) improves the association with cardiometabolic risk. Methods We analyzed data from 11,143 adults (mean age 46.0 ± 17.2 years) in the Austrian LEAD (Lung, hEart, sociAl, boDy) cohort. Individual SCr concentrations were normalized to sex- and age-specific LMI reference values to calculate LMI-adjusted eGFR (eGFRLMISCr). The strength of associations between eGFRSCr and eGFRLMISCr with cardiometabolic risk factors (dyslipidemia, hypertension, pre-diabetes/diabetes, and metabolic syndrome) was compared using age- and sex-adjusted logistic regression with bootstrap resampling. Results While eGFRSCr and eGFRLMISCr were highly correlated (R2 = 0.897), LMI adjust-ment led to significant reclassification between CKD stages G1, G2, and G3a. eGFRLMISCr demonstrated significantly stronger associations with dyslipidemia, arterial hyperten-sion, pre-diabetes/diabetes, and metabolic syndrome compared to standard eGFRSCr. Longitudinal analysis showed that LMI adjustment stabilizes eGFR change estimates, particularly in younger men. Conclusion Adjusting serum creatinine for LMI signifi-cantly enhances the epidemiological utility of GFR estimation. GFRLMISCr improves car-diometabolic risk stratification, potentially offering a valuable method to "salvage" the utility and comparability of eGFRSCr in historic cohorts in early-stage filtration impair-ment in settings where DEXA but not Cystatin C is available.
Keywords:
glomerular filtration rate
; creatinine
; body composition
; metabolic syndrome
; renal insufficiency
; chronic
1. Introduction
It is now well recognized that the clinical significance of CKD extends beyond drug dosing and renal replacement therapy and that it is a potent, independent driver of cardiometabolic risk, including hypertension, dyslipidemia, and cardiovascular mortality.[1,2,3,4]
The accurate assessment of glomerular filtration rate (GFR) is fundamental to the diagnosis, staging, and management of chronic kidney disease (CKD). Traditionally, estimated GFR (eGFR) derived from serum creatinine (SCr) serves as the primary tool in clinical practice due to its cost-effectiveness and accessibility. However, the reliability of SCr as a filtration marker is intrinsically limited, most notably but not exclusively by individual variations in skeletal muscle mass, which serves as the primary reservoir for creatine and its byproduct, creatinine.[5,6]
Standard eGFR equations, such as the CKD-EPI (Chronic Kidney Disease Epidemiology Collaboration) 2009 and 2021 formulae, attempt to account for muscle mass variations by using surrogate demographic markers like age and sex.[7,8] Despite these adjustments, significant intra-individual variability persists. In patients with abnormally high or low muscle mass—common in aging populations, wasting diseases, or young athletes—creatinine-based eGFR can lead to significant misclassification.[9,10,11] While these limitations can be ameliorated by the inclusion of Cystatin C, a now widely available more modern filtration marker, misclassification of GFR from SCr-based estimates likely limit our understanding of historic CKD trajectories, health risks associated with CKD as well as of differences in current and past trends in prevalence.[12]
Several methods are available for the quantification of an individuals’ muscle mass and Dual-energy X-ray absorptiometry (DEXA) is currently one of the most widely used high-accuracy technique for quantifying body composition.[13] By calculating the Lean Mass Index (LMI)—lean mass divided by height squared— a standardized, validated metric of muscularity can be obtained.[14,15] Integrating LMI into the interpretation of serum creatinine may offer a physiological correction that demographic surrogates cannot reasonably achieve.
While previous studies have explored the impact of muscle mass on creatinine levels and the usefulness of creatinine levels as markers of muscle mass in the proven or assumed absence of CKD, it is unknown whether a LMI-adjusted serum-creatinine based eGFR (eGFRLMISCr) improves the stratification of cardiometabolic risk compared to standard, unadjusted serum-creatinine based eGFR (eGFRScr).[9,16,17]
Based on these considerations, we hypothesize that LMI-adjusted eGFR will provide a more accurate reflection of a patient's renal-metabolic status and will demonstrate a stronger association with markers of cardiometabolic risk than traditional creatinine-based eGFR in a well-characterized Austrian general population cohort.
2. Materials and Methods
Study Design
The study was conducted within the framework of the Austrian LEAD (Lung, hEart, sociAl, boDy) study (ClinicalTrials.gov identifier: NCT07127518) which was approved by the Ethics Committee of the City of Vienna (Ethikkomission der Stadt Wien; protocol number EK-11-117-0711). All study procedures were performed in accordance with the Declaration of Helsinki, and written informed consent was obtained from all participants and/or their legal guardians. LEAD is an ongoing longitudinal, observational, population -based cohort study with repeated follow-up assessments conducted from 2011 onward (mean interval between visits 1 and 2: 4.25 ± 0.33 years). All participants aged ≥18 years with valid and no missing creatinine values were included in the present study; participants on dialysis or taking related medications were excluded.
Measurements
Lean mass-adjusted creatinine was derived to account for interindividual differences in muscle mass. Sex- and age-specific reference values for LMI were calculated using the median DEXA-derived LMI within strata defined by sex and single-year age. Individual serum creatinine concentrations were then normalised to the corresponding reference LMI using the following formula:
eGFR was calculated using both raw and LMI-adjusted serum creatinine values. The CKD-EPI 2009 equation was applied using sex- and age-specific coefficients.[7] For categorical analyses, eGFR values were classified according to Kidney Disease: Improving Global Outcomes (KDIGO) GFR categories, with a collapsed five-category classification, combining the two lowest GFR strata due to small sample sizes. Five-category groupings were defined as: <10, 30-<45, 45-<60, 60-<90 and ≥90 ml/min/1.73m2.[5] For regression modelling, KDIGO categories were encoded with ≥90 ml/min/1.73m2 as the reference group.
Height, weight and waist circumference were measured using a calibrated stadiometer and precision scale and were used to calculate body mass index (BMI, kg/m2) and waist-to-height ratio. Fat mass index (FMI) was obtained using DEXA scans. Participant characteristics including age, smoking status and cumulative smoking exposures were collected using standardised, interviewer-administered questionnaires.
Metabolic syndrome was defined according to International Diabetes Federation (IDF) criteria, based on central obesity, triglyceride levels, HDL cholesterol, blood pressure and fasting glucose.[18] Dyslipidemia was defined as at least one of the following: LDL-C ≥100mg/dL, triglycerides ≥150mg/dL, total cholesterol ≥200mg/dL, sex-specific low HDL-C or statin use. Obesity was defined based on the Lancet Diabetes and Endocrinology Commisssion (ObesityLDEC) or WHO (ObesityWHO; BMI ≥30kg/m2) definitions: participants were classified as having obesityLDEC if they had BMI ≥40kg/m2; BMI ≥30kg/m2 in combination with either a waist-to-height ratio ≥0.50 or sex-specific waist circumference thresholds (≥102cm in men or ≥88cm in women); or BMI <30kg/m2 in combination with both elevated waist-height ratio and sex-specific waist circumference thresholds.[19,20] Prediabetes and diabetes were classified using fasting plasma glucose and HbA1c thresholds, and hypertension was defined as systolic blood pressure ≥140mmHg, diastolic blood pressure ≥90mmHg, or current use of anti-hypertensive medication. Cardiovascular disease was defined as self-reported physician-diagnosed myocardial infarction, coronary artery disease or heart failure.
Statistical Analysis
All statistical analyses were performed in R (version 4.3.0; R foundation for Statistical Computing, Vienna, Austria), with the level of significance set at <5%. Data are presented as mean ± standard deviation or relative frequency (percentage of group). Group comparisons between eGFR-CKD stages were performed using one-way ANOVA or t-tests for continuous variables and χ² tests for categorical variables. Age and sex effects on eGFR or eGFR-CKD stages were assessed using linear and logistic regression models and p-values were obtained by Wald’s test. Reclassification of eGFR-CKD stages were visualised as an alluvial plot. To compare the strength of association between outcomes and eGFR definitions, we estimated the difference in log-odds ratios between the two predictors using bootstrap resampling. For each outcome, separate age- and sex-adjusted logistic regression models and the difference in log(OR) between standardised raw and adjusted eGFR was evaluated using 1000 bootstrap samples to obtain confidence intervals and two-sided p-values.
Individual eGFR slopes were calculated for participants with complete and valid serum creatinine measurements at both study visits (n=7487). Annualised eGFR change was derived as the difference in eGFR between visits divided by the time interval and was computed separately for eGFR based on raw and LMI-adjusted creatinine. To compare longitudinal decline between raw and LMI-adjusted eGFR, slopes were assessed in a mixed-effects linear model including eGFR definitions, age, and sex, with a random intercept for participant to account for within-person pairing.
Data Availability Statement
Due to institutional agreements and ongoing data collection activity, unrestricted access cannot be granted to our primary data. However, data specifically pertaining to this manuscript may be made available upon reasonable request made to the corresponding author.
Use of Generative AI Statement
During the preparation of this work the authors used Google Gemini 3 to improve sentence structure in some instances. After using this tool, the authors reviewed and edited the content as needed and take full responsibility for the content of the published article.
3. Results
The study cohort comprised 11,143 adults with a mean age of 46.0 ± 17.2 years, of whom 47.3% were male. A high percentage of included subjects exhibited cardiometabolic risk factors, including dyslipidemia (84.2%), metabolic syndrome (26.5%), pre-diabetes or diabetes (20.8%), and hypertension (17.0%). A summary of baseline characteristics of the total cohort with and without stratification for CKD stages is provided in Table 1. A side-by-side comparison for group characteristics between eGFRSCr and eGFRLMISCr is provided in Supplementary Table S1.
Standardized, age- and sex-adjusted logistic regression analyses demonstrated that eGFRLMISCr was significantly more strongly associated with dyslipidemia, arterial hypertension, pre-diabetes/diabetes, and metabolic syndrome. Manifest cardiovascular disease also showed a stronger association with eGFRLMISCr compared to eGFRSCr , although the 95% confidence intervals for these associations overlapped. Additionally, eGFRLMISCr showed stronger associations with anthropometric parameters for obesity according to both WHO and LDEC Commission criteria[19,20] (ObesityWHO and ObesityLDEC). (Figure 1 and Table 2)
Comparison between standard eGFRSCr and eGFRLMISCr showed a high correlation (R^2 = 0.897). Error analysis revealed a negligible fixed bias of -0.26 mL/min/1.73m² and a precision (SD) of 8.41. The 95% limits of agreement (LoA) ranged from -16.75 to 16.23 mL/min/1.73m². Accuracy metrics indicated that 75.2% of estimates were within 10% (P10) and 99.2% were within 30% (P30) of the reference raw eGFR. A small proportional bias was observed (slope: -0.057, p < 0.001), indicating that individual differences were more pronounced at certain levels of kidney function. Overall, eGFRSCr and eGFRLMISCr showed good agreement: Weighted kappa= 0.76 (0.77, 0.78), z=80.5, p<0.001.
The distribution of eGFR in the total population remained largely unchanged and importantly remained in close approximation of a normal distribution. (Supplementary Figure S1) Similarly, eGFR decline with increasing age remained largely unchanged between eGFRSCr and eGFRLMISCr. (Supplementary Figure S2) There were overlapping 95% confidence intervals when comparing age- and sex effects on eGFRSCr and eGFRLMISCr. (Table 3a and Table 3b)
The application of lean mass correction resulted in shifts in the classification of chronic kidney disease (CKD) stages, with the highest relative number of reclassifications occurring between stage G1 and G2 as well as G3a and G2. (Table 4 and Figure 2)
Longitudinally, eGFRLMISCr showed significantly greater yearly decline than eGFRSCr , (Supplementary Table S2 and Supplementary Figure S3). This was largely driven by a faster decline of eGFRLMISCr particularly in young women, with a significant effect of sex and age. (Table 5 and Figure 3)
4. Discussion
In line with our hypothesis, the present study demonstrates that adjusting serum creatinine for DEXA-derived LMI significantly enhances the strength of association between estimated glomerular filtration rate (eGFR) and cardiometabolic risk factors. By accounting for the biological dependence of creatinine on muscle mass, eGFRLMISCr revealed substantially stronger associations with dyslipidemia, hypertension, pre-diabetes, diabetes, and metabolic syndrome compared to standard eGFRSCr. These findings suggest that conventional eGFRScr may systematically underestimate the true extent of the relationship between kidney health and metabolic disease in individuals with relatively lower muscle mass, while also mischaracterizing subjects with favourable metabolic profile and high muscle mass.
The prevalence of subjects with decreased glomerular filtration rate impairment remained largely unchanged, however, we saw a relatively large number with mild impairment reclassified between CKD G stages. This was particularly pronounced between CKD G1 and G2 as well as G2 and G3a. Importantly, the diagnostic accuracy for eGFRSCr is known to be limited in mildly decreased filtration function, making improved association through more accurate reflection of true filtration rate through eGFRLMISCr more plausible.[21]
eGFR trajectories with increasing age remained largely unchanged with adjustment, which is in line with similar age- and sex effects shown between eGFRSCr and eGFRLMISCr, suggesting that effects of inter-individual differences in muscle mass on filtration function remain of equal relative importance across age spectrums. Longitudinally, our data suggest slower yearly GFR decline after LMI adjustment in men but faster decline in women. We also saw a stabilizing effect LMI adjustment on yearly eGFR change in young men, which appears biologically plausible as this demographic typically exhibits a gain of muscle mass over time.
Overall, our findings align with recent literature suggesting that alternative markers less dependent on muscle mass, such as Cystatin C, provide superior risk stratification for cardiovascular mortality compared to eGFRSCr.[12]
Furthermore, our data showed that eGFRLMISCr classified more subjects as exhibiting CKD G2 was slightly lower than raw eGFRSCr on average, suggesting that standard, solely SCr-based formulas may be providing an overly optimistic view of renal health in the general population where more accurate estimation tools of GFR are not available and/or in historic cohorts.
Previous attempts were made to investigate the link between creatinine homeostasis and muscle mass, however, with different goals and endpoints. A paper by Kim et al. reported that muscle mass could accurately be estimated based on serum creatinine after adjusting for Cystatin C-based eGFR.[22] These findings, functionally representing an approach inverse from our own, are directly relevant to our own as this provides proof-of-concept for our own considerations. To the best of our knowledge, Nankivell et al. performed a study with a rationale closest to our own. Nankivell et al. compared the diagnostic accuracy of eGFRSCr with Tc99m DTPA plasma clearance in 137 kidney transplant recipients and demonstrated a strong inverse correlation of estimation error with muscle mass measured via DEXA scan, highlighting the potential for improved accuracy with correction.[9] Overall, investigative approaches with the goal of linking creatinine to muscle mass date back to as early as 1983.[23] Notably, adding muscle assessments from bioimpedance analysis (BIA) did not improve GFR assessments compared to measured GFR in CRIC study, albeit these findings need to be viewed in light of lower sample size compared to ours and of known limitations regarding measurement accuracy of BIA compared to DEXA.[24,25]
A major strength of this study is the use of the LEAD cohort, a large-scale, well characterized general population observational study in Austria, utilizing highly accurate DEXA measurement for body composition assessment. However, several limitations must be acknowledged. While eGFRLMISCr showed stronger statistical associations, we cannot directly prove that the proposed LMI-adjustment results in a better reflection of true GFR rather than just improving its association with metabolic comorbidities. This requires validation against gold standard measured GFR (e.g., iohexol or inulin clearance) or, albeit with higher uncertainty, against formulas incorporating Cystatin C which is currently unavailable for our cohort.[5,26] Additionally, our study is limited by the current lack of data on albuminuria, which may represent an important confounder. However, the LEAD data are obtained from a general population cohort and therefore a relatively low prevalence of albuminuria can safely be assumed.[27] A recent study from a neighbouring European country reported a 5-year prevalence of chronic albuminuria of 6.8% in all subjects, however, age of inclusion into this study was 35 years vs 18 years in LEAD. Nevertheless, our data need to be interpreted with a degree of caution in light of this unknown factor and we encourage external validation.[28]
Adjusting serum creatinine for lean body mass significantly improves the epidemiological utility of GFR estimation by strengthening its associations with key cardiometabolic risk factors. The implementation of muscle-mass-corrected eGFR could refine risk stratification in general populations, particularly in cohorts with high variability in body composition. Our approach offers a novel method to "salvage" the utility of creatinine by using DEXA-measured muscle mass, which may be particularly useful in epidemiological settings where DEXA is already utilized for bone density or body composition analysis.
Supplementary Materials
The following supporting information can be downloaded at: https://www.mdpi.com/article/doi/s1, Figure S1: Distribution of eGFR in the total population; Figure S2: Distribution of eGFR by age and sex ; Figure S3: Annualised change in eGFR. Table S1: Baseline characteristics of eGFR groups stratified by CKD categories; Table S2: Summary of annualised change in eGFR.
Author Contributions
Conceptualization, O.H..; methodology, C.J.M.L., R.B-K., M.-K.B., O.H.; software, C.J.M.L..; validation, O.H.,; formal analysis, O.H., C.J.M.L..; investigation, R.B-K., M.-K.B., E.F.M.W..; resources, R.B-K., M.-K.B.; data curation, R.B-K., M.-K.B; writing—original draft preparation, O.H.; writing—review and editing, O.H., C.J.M.L., M.M., E.F.M.W., R.B-K., M.-K.B; visualization, C.J.M.L.; supervision, R.B-K., M.-K.B, E.F.M.W., project administration, C.J.M.L.,; funding acquisition, R.B-K., M.-K.B. All authors have read and agreed to the published version of the manuscript.
Funding
The Austrian LEAD study has unrestricted financial support from the Ludwig Boltzmann Gesellschaft, Sigmund Freud Private University Faculty of Medicine, Vienna Healthcare Group, the Lower Austrian Health and Social Fund, AstraZeneca, Chiesi Farmaceutici, GlaxoSmithKline and Menarini Pharma. None of the supporting parties has any participation in the data, nor have they contributed to the design or the content of the manuscript. All authors declare no financial/non-financial disclosures relevant to the manuscript.
Institutional Review Board Statement
The LEAD study was conducted in accordance with the Declaration of Helsinki and approved by the local Ethics committee of Vienna (EK-11-117-0711) with the project identification code, NCT017257518 (ClinicalTrials.gov). All data was obtained with patient consent. As the current study was performed within the framework of the LEAD study, no separate ethics approval for this study was required.
Informed Consent Statement
Informed consent was obtained from all subjects involved in the study.
Data Availability Statement
Due to institutional agreements and ongoing data collection activity, unrestricted access cannot be granted to our primary data. However, data specifically pertaining to this manuscript may be made available upon reasonable request made to the corresponding author.
Conflicts of Interest
All authors declare no conflict of interest pertaining to the manuscript. R.B.-K. and M.-K.B. reports consulting fees from AstraZeneca, Menarini, Sanofi, Boehringer Ingelheim, Novartis Pharma, GSK and Sanofi for advisory board members outside the submitted work. O.H., C.J.M.L., M.M., and E.F.M.W. have nothing to disclose.
Abbreviations
The following abbreviations are used in this manuscript:
| BMI | Body Mass Index |
| CKD | Chronic Kidney Disease |
| CKD-EPI | Chronic Kidney Disease Epidemiology Collaboration |
| DEXA | Dual-Energy X-ray Absorptiometry |
| eGFR | Estimated Glomerular Filtration Rate |
| eGFRLMISCr | Lean Mass Index-Adjusted Estimated Glomerular Filtration Rate |
| eGFRSCr | Standard Serum Creatinine-Based Estimated Glomerular Filtration Rate |
| FMI | Fat Mass Index |
| HbA1c | Glycated Hemoglobin |
| HDL-C | High-Density Lipoprotein Cholesterol |
| IDF | International Diabetes Federation |
| KDIGO | Kidney Disease: Improving Global Outcomes |
| LDEC | Lancet Diabetes and Endocrinology Commission |
| LEAD | Lung, hEart, social, body (name of the study cohort)) |
| LMI | Lean Mass Index |
| LoA | Limits of Agreement |
| LDL-C | Low-Density Lipoprotein Cholesterol |
| OR | Odds Ratio |
| P30 | Estimates Within 30% of the Reference Value |
| SCr | Serum Creatinine |
| WHO | World Health Organization |
References
- Astor, B.C.; Hallan, S.I.; Miller, E.R., 3rd; Yeung, E.; Coresh, J. Glomerular filtration rate, albuminuria, and risk of cardiovascular and all-cause mortality in the US population. Am. J. Epidemiol. 2008, 167, 1226–1234. [Google Scholar] [CrossRef] [PubMed]
- Gaziano, L.; Sun, L.; Arnold, M.; Bell, S.; Cho, K.; Kaptoge, S.K.; Song, R.J.; Burgess, S.; Posner, D.C.; Mosconi, K.; et al. Mild-to-Moderate Kidney Dysfunction and Cardiovascular Disease: Observational and Mendelian Randomization Analyses. Circulation 2022, 146, 1507–1517. [Google Scholar] [CrossRef] [PubMed]
- Matsushita, K.; et al. Estimated glomerular filtration rate and albuminuria for prediction of cardiovascular outcomes: a collaborative meta-analysis of individual participant data. Lancet Diabetes Endocrinol. 2015, 3, 514–525. [Google Scholar] [CrossRef] [PubMed]
- Consortium, W.G.f.t.C.P. Estimated Glomerular Filtration Rate, Albuminuria, and Adverse Outcomes: An Individual-Participant Data Meta-Analysis. JAMA 2023, 330, 1266–1277. [Google Scholar] [CrossRef] [PubMed]
- KDIGO 2024 Clinical Practice Guideline for the Evaluation and Management of Chronic Kidney Disease. Kidney Int. 2024, 105, S117–s314. [CrossRef] [PubMed]
- Bargnoux, A.-S.; Kuster, N.; Cavalier, E.; Piéroni, L.; Souweine, J.-S.; Delanaye, P.; Cristol, J.-P. Serum creatinine: advantages and pitfalls. J. Lab. Precis. Med. 2018, 3. [Google Scholar] [CrossRef]
- Levey, A.S.; et al. A new equation to estimate glomerular filtration rate. Ann. Intern. Med. 2009, 150, 604–612. [Google Scholar] [CrossRef] [PubMed]
- Inker, L.A.; Eneanya, N.D.; Coresh, J.; Tighiouart, H.; Wang, D.; Sang, Y.; Crews, D.C.; Doria, A.; Estrella, M.M.; Froissart, M.; et al. New Creatinine- and Cystatin C-Based Equations to Estimate GFR without Race. N Engl. J. Med. 2021, 385, 1737–1749. [Google Scholar] [CrossRef] [PubMed]
- Nankivell, B.J.; Nankivell, L.F.J.; Elder, G.J.; Gruenewald, S.M. How unmeasured muscle mass affects estimated GFR and diagnostic inaccuracy. EClinicalMedicine 2020, 29-30, 100662. [Google Scholar] [CrossRef] [PubMed]
- Groothof, D.; Shehab, N.B.N.; Erler, N.S.; Post, A.; Kremer, D.; Polinder-Bos, H.A.; Gansevoort, R.T.; Groen, H.; Pol, R.A.; Gans, R.O.B.; et al. Creatinine, cystatin C, muscle mass, and mortality: Findings from a primary and replication population-based cohort. J. Cachexia Sarcopenia Muscle 2024, 15, 1528–1538. [Google Scholar] [CrossRef] [PubMed]
- Okamura, M.; Konishi, M.; Butler, J.; Kalantar-Zadeh, K.; von Haehling, S.; Anker, S.D. Kidney function in cachexia and sarcopenia: Facts and numbers. J. Cachexia Sarcopenia Muscle 2023, 14, 1589–1595. [Google Scholar] [CrossRef] [PubMed]
- Liu, M.; Ye, Z.; He, P.; Wu, Q.; Yang, S.; Zhang, Y.; Zhou, C.; Zhang, Y.; Hou, F.F.; Qin, X. Different cardiovascular risks associated with elevated creatinine-based eGFR and cystatin C-based eGFR. npj Cardiovasc. Health 2024, 1, 3. [Google Scholar] [CrossRef] [PubMed]
- Lemos, T.; Gallagher, D. Current body composition measurement techniques. Curr. Opin. Endocrinol. Diabetes Obes. 2017, 24, 310–314. [Google Scholar] [CrossRef] [PubMed]
- Imboden, M.T.; Swartz, A.M.; Finch, H.W.; Harber, M.P.; Kaminsky, L.A. Reference standards for lean mass measures using GE dual energy x-ray absorptiometry in Caucasian adults. PLoS ONE 2017, 12, e0176161. [Google Scholar] [CrossRef] [PubMed]
- Wang, X.; Yi, M.; Zhang, Y.; Xiao, K.; Si, J.; Sun, L.; Zhang, H.; Sun, J.; Liu, Z.; Lin, J.; et al. Lean Mass Index, Not Body Mass Index, is Essentially Associated with Arterial Stiffness in Chinese Adults: A Cross-Sectional Study. Diabetes Metab. Syndr. Obes. 2025, 18, 4141–4151. [Google Scholar] [CrossRef] [PubMed]
- Baxmann, A.C.; Ahmed, M.S.; Marques, N.C.; Menon, V.B.; Pereira, A.B.; Kirsztajn, G.M.; Heilberg, I.P. Influence of muscle mass and physical activity on serum and urinary creatinine and serum cystatin C. Clin. J. Am. Soc. Nephrol. 2008, 3, 348–354. [Google Scholar] [CrossRef] [PubMed]
- Lian, R.; Liu, Q.; Jiang, G.; Zhang, X.; Tang, H.; Lu, J.; Yang, M. Blood biomarkers for sarcopenia: A systematic review and meta-analysis of diagnostic test accuracy studies. Ageing Res. Rev. 2024, 93, 102148. [Google Scholar] [CrossRef] [PubMed]
- Alberti, K.G.; Zimmet, P.; Shaw, J. Metabolic syndrome--a new world-wide definition. A Consensus Statement from the International Diabetes Federation. Diabet. Med. 2006, 23, 469–480. [Google Scholar] [CrossRef] [PubMed]
- Rubino, F.; Cummings, D.E.; Eckel, R.H.; Cohen, R.V.; Wilding, J.P.H.; Brown, W.A.; Stanford, F.C.; Batterham, R.L.; Farooqi, I.S.; Farpour-Lambert, N.J.; et al. Definition and diagnostic criteria of clinical obesity. Lancet Diabetes Endocrinol. 2025, 13, 221–262. [Google Scholar] [CrossRef] [PubMed]
- Eknoyan, G. Adolphe Quetelet (1796-1874)--the average man and indices of obesity. Nephrol. Dial. Transpl. 2008, 23, 47–51. [Google Scholar] [CrossRef] [PubMed]
- Wang, X.; Mu, J.; Ma, K.; Ma, Y. Challenges of Serum Creatinine Level in GFR Assessment and Drug Dosing Decisions in Kidney Injury. Adv. Pharm. Bull. 2024, 14, 745–758. [Google Scholar] [CrossRef] [PubMed]
- Kim, S.W.; Jung, H.W.; Kim, C.H.; Kim, K.I.; Chin, H.J.; Lee, H. A New Equation to Estimate Muscle Mass from Creatinine and Cystatin C. PLoS ONE 2016, 11, e0148495. [Google Scholar] [CrossRef] [PubMed]
- Heymsfield, S.B.; Arteaga, C.; McManus, C.; Smith, J.; Moffitt, S. Measurement of muscle mass in humans: validity of the 24-hour urinary creatinine method. Am. J. Clin. Nutr. 1983, 37, 478–494. [Google Scholar] [CrossRef] [PubMed]
- Anderson, A.H.; Yang, W.; Hsu, C.Y.; Joffe, M.M.; Leonard, M.B.; Xie, D.; Chen, J.; Greene, T.; Jaar, B.G.; Kao, P.; et al. Estimating GFR among participants in the Chronic Renal Insufficiency Cohort (CRIC) Study. Am. J. Kidney Dis. 2012, 60, 250–261. [Google Scholar] [CrossRef] [PubMed]
- Feng, Q.; Bešević, J.; Conroy, M.; Omiyale, W.; Lacey, B.; Allen, N. Comparison of body composition measures assessed by bioelectrical impedance analysis versus dual-energy X-ray absorptiometry in the United Kingdom Biobank. Clin. Nutr. ESPEN 2024, 63, 214–225. [Google Scholar] [CrossRef] [PubMed]
- Schaeffner, E.; Ebert, N.; White, C.A. Direct Measurement of GFR: Who, When, and How?: A Practical Approach Emphasizing Iohexol Plasma Clearance. J. Am. Soc. Nephrol. 2026. [Google Scholar] [CrossRef] [PubMed]
- Breyer-Kohansal, R.; Hartl, S.; Burghuber, O.C.; Urban, M.; Schrott, A.; Agusti, A.; Sigsgaard, T.; Vogelmeier, C.; Wouters, E.; Studnicka, M.; et al. The LEAD (Lung, Heart, Social, Body) Study: Objectives, Methodology, and External Validity of the Population-Based Cohort Study. J. Epidemiol. 2019, 29, 315–324. [Google Scholar] [CrossRef] [PubMed]
- Kraus, D.; Gieswinkel, A.; Boedecker-Lips, S.C.; Klimpke, P.; Stortz, M.; Schleicher, E.M.; Schattenberg, J.M.; Pfeiffer, N.; Ghaemi, J.; Schmidtmann, I.; et al. Increased albuminuria is highly prevalent in the general population: prevalence of CKD in the gutenberg health study. Clin. Kidney J. 2025. [Google Scholar] [CrossRef] [PubMed]
Figure 1.
Comparisons of outcome associations between eGFR classifications.
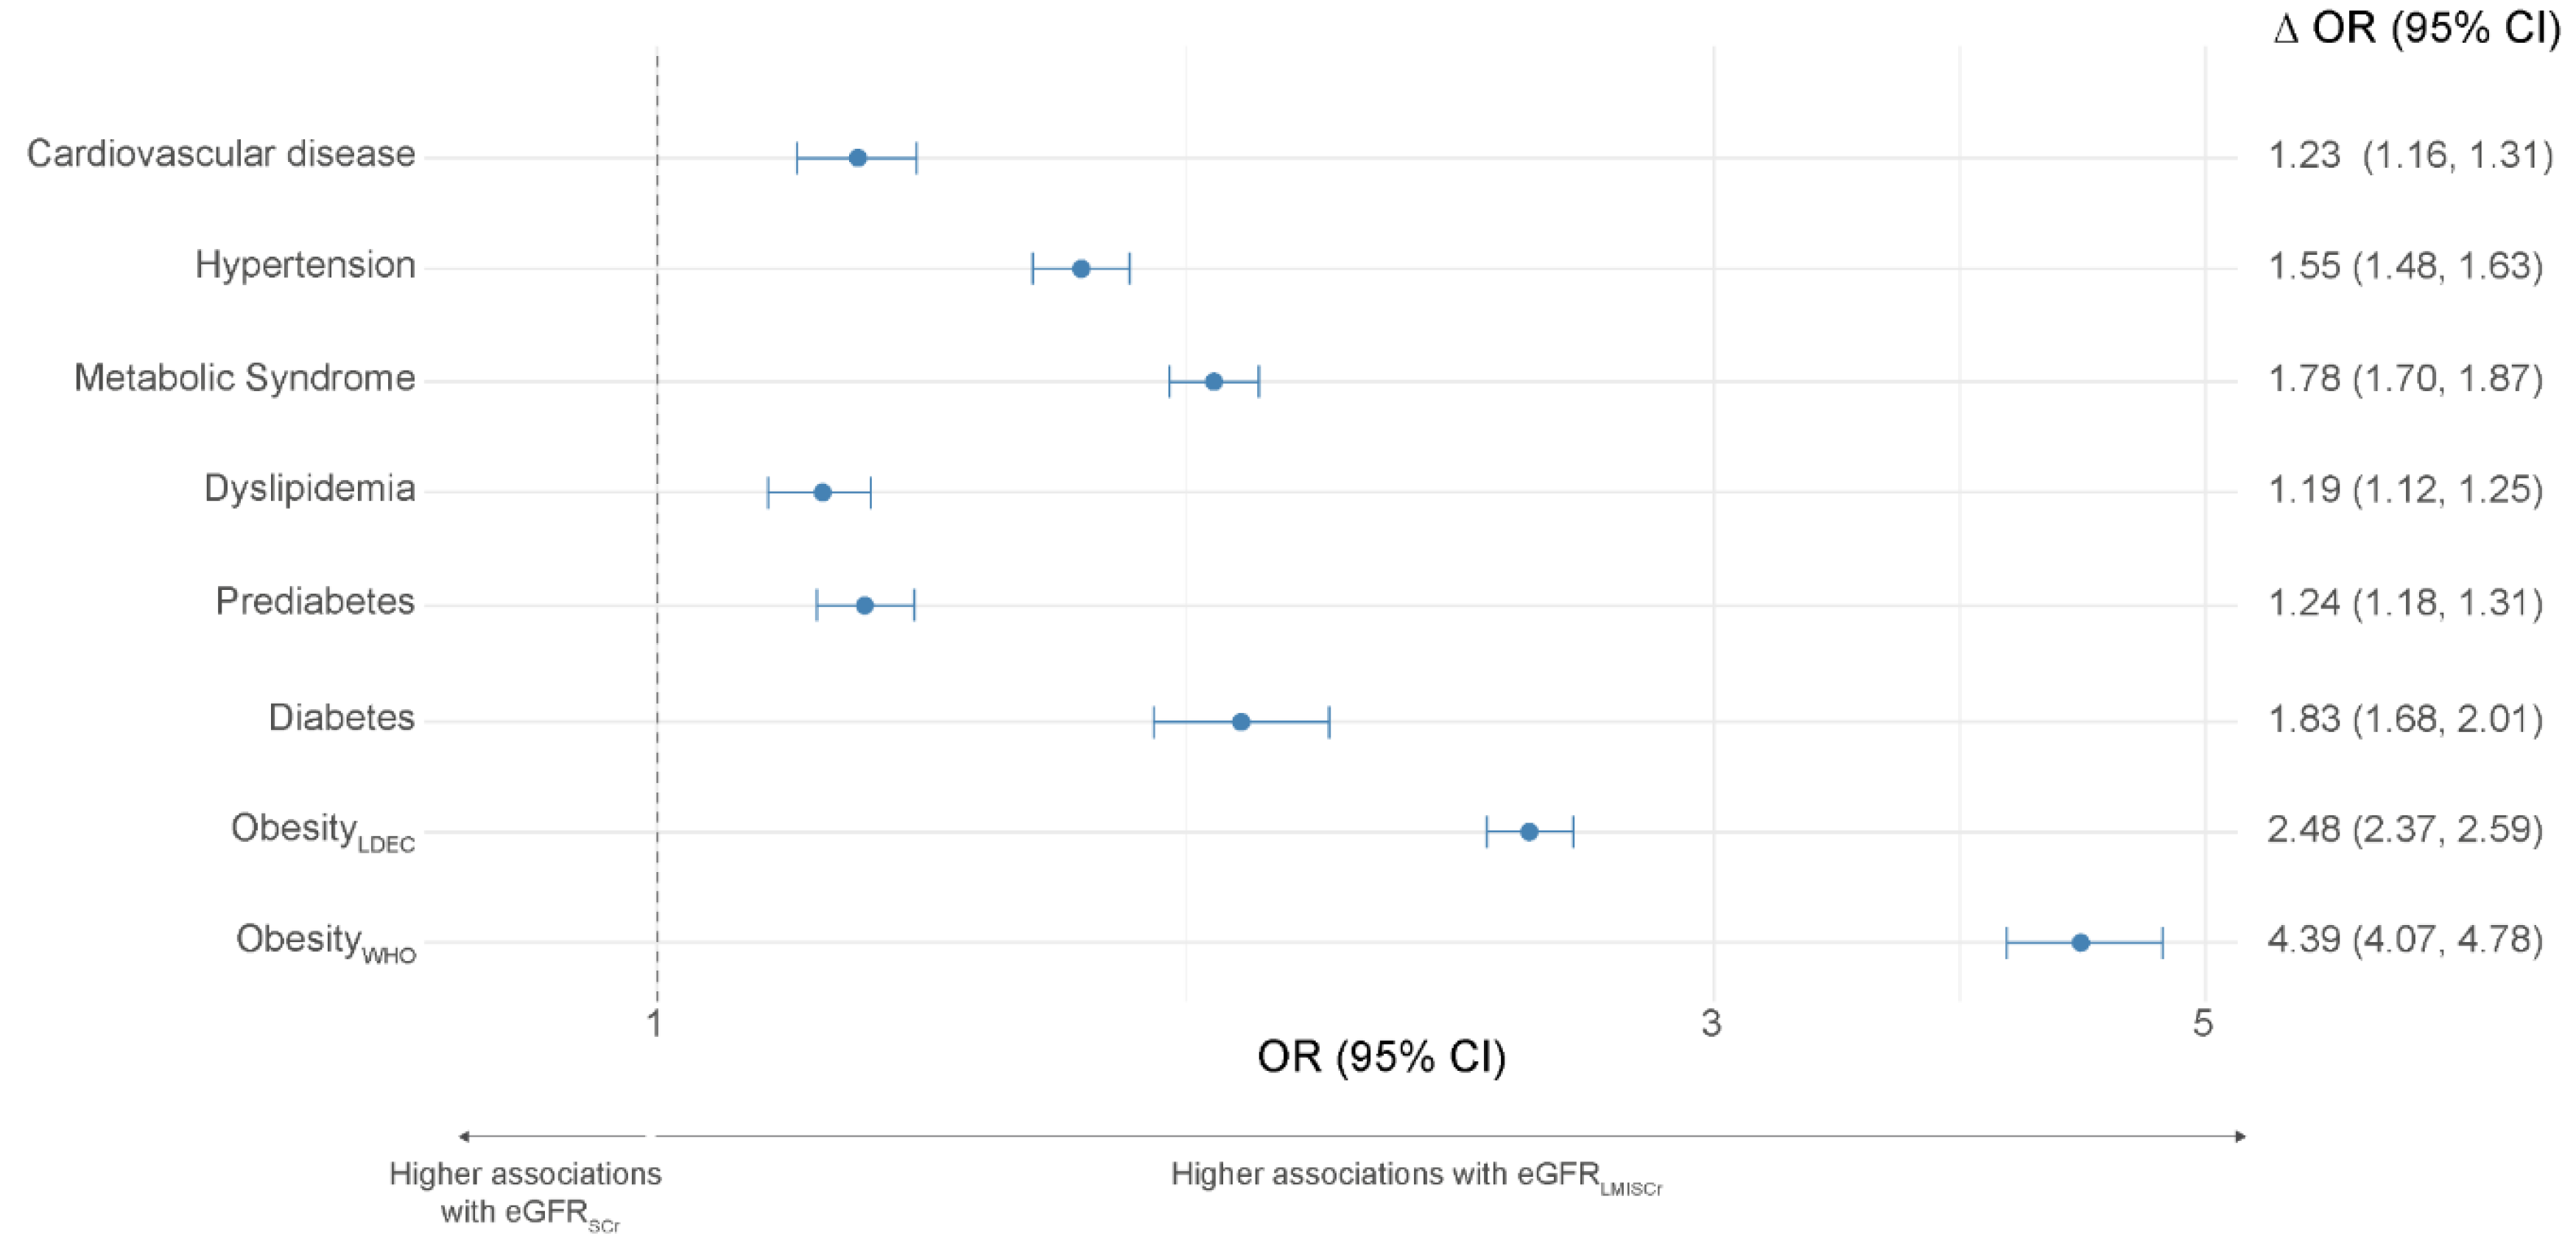
Figure 2.
Alluvial of eGFR-CKD reclassification.
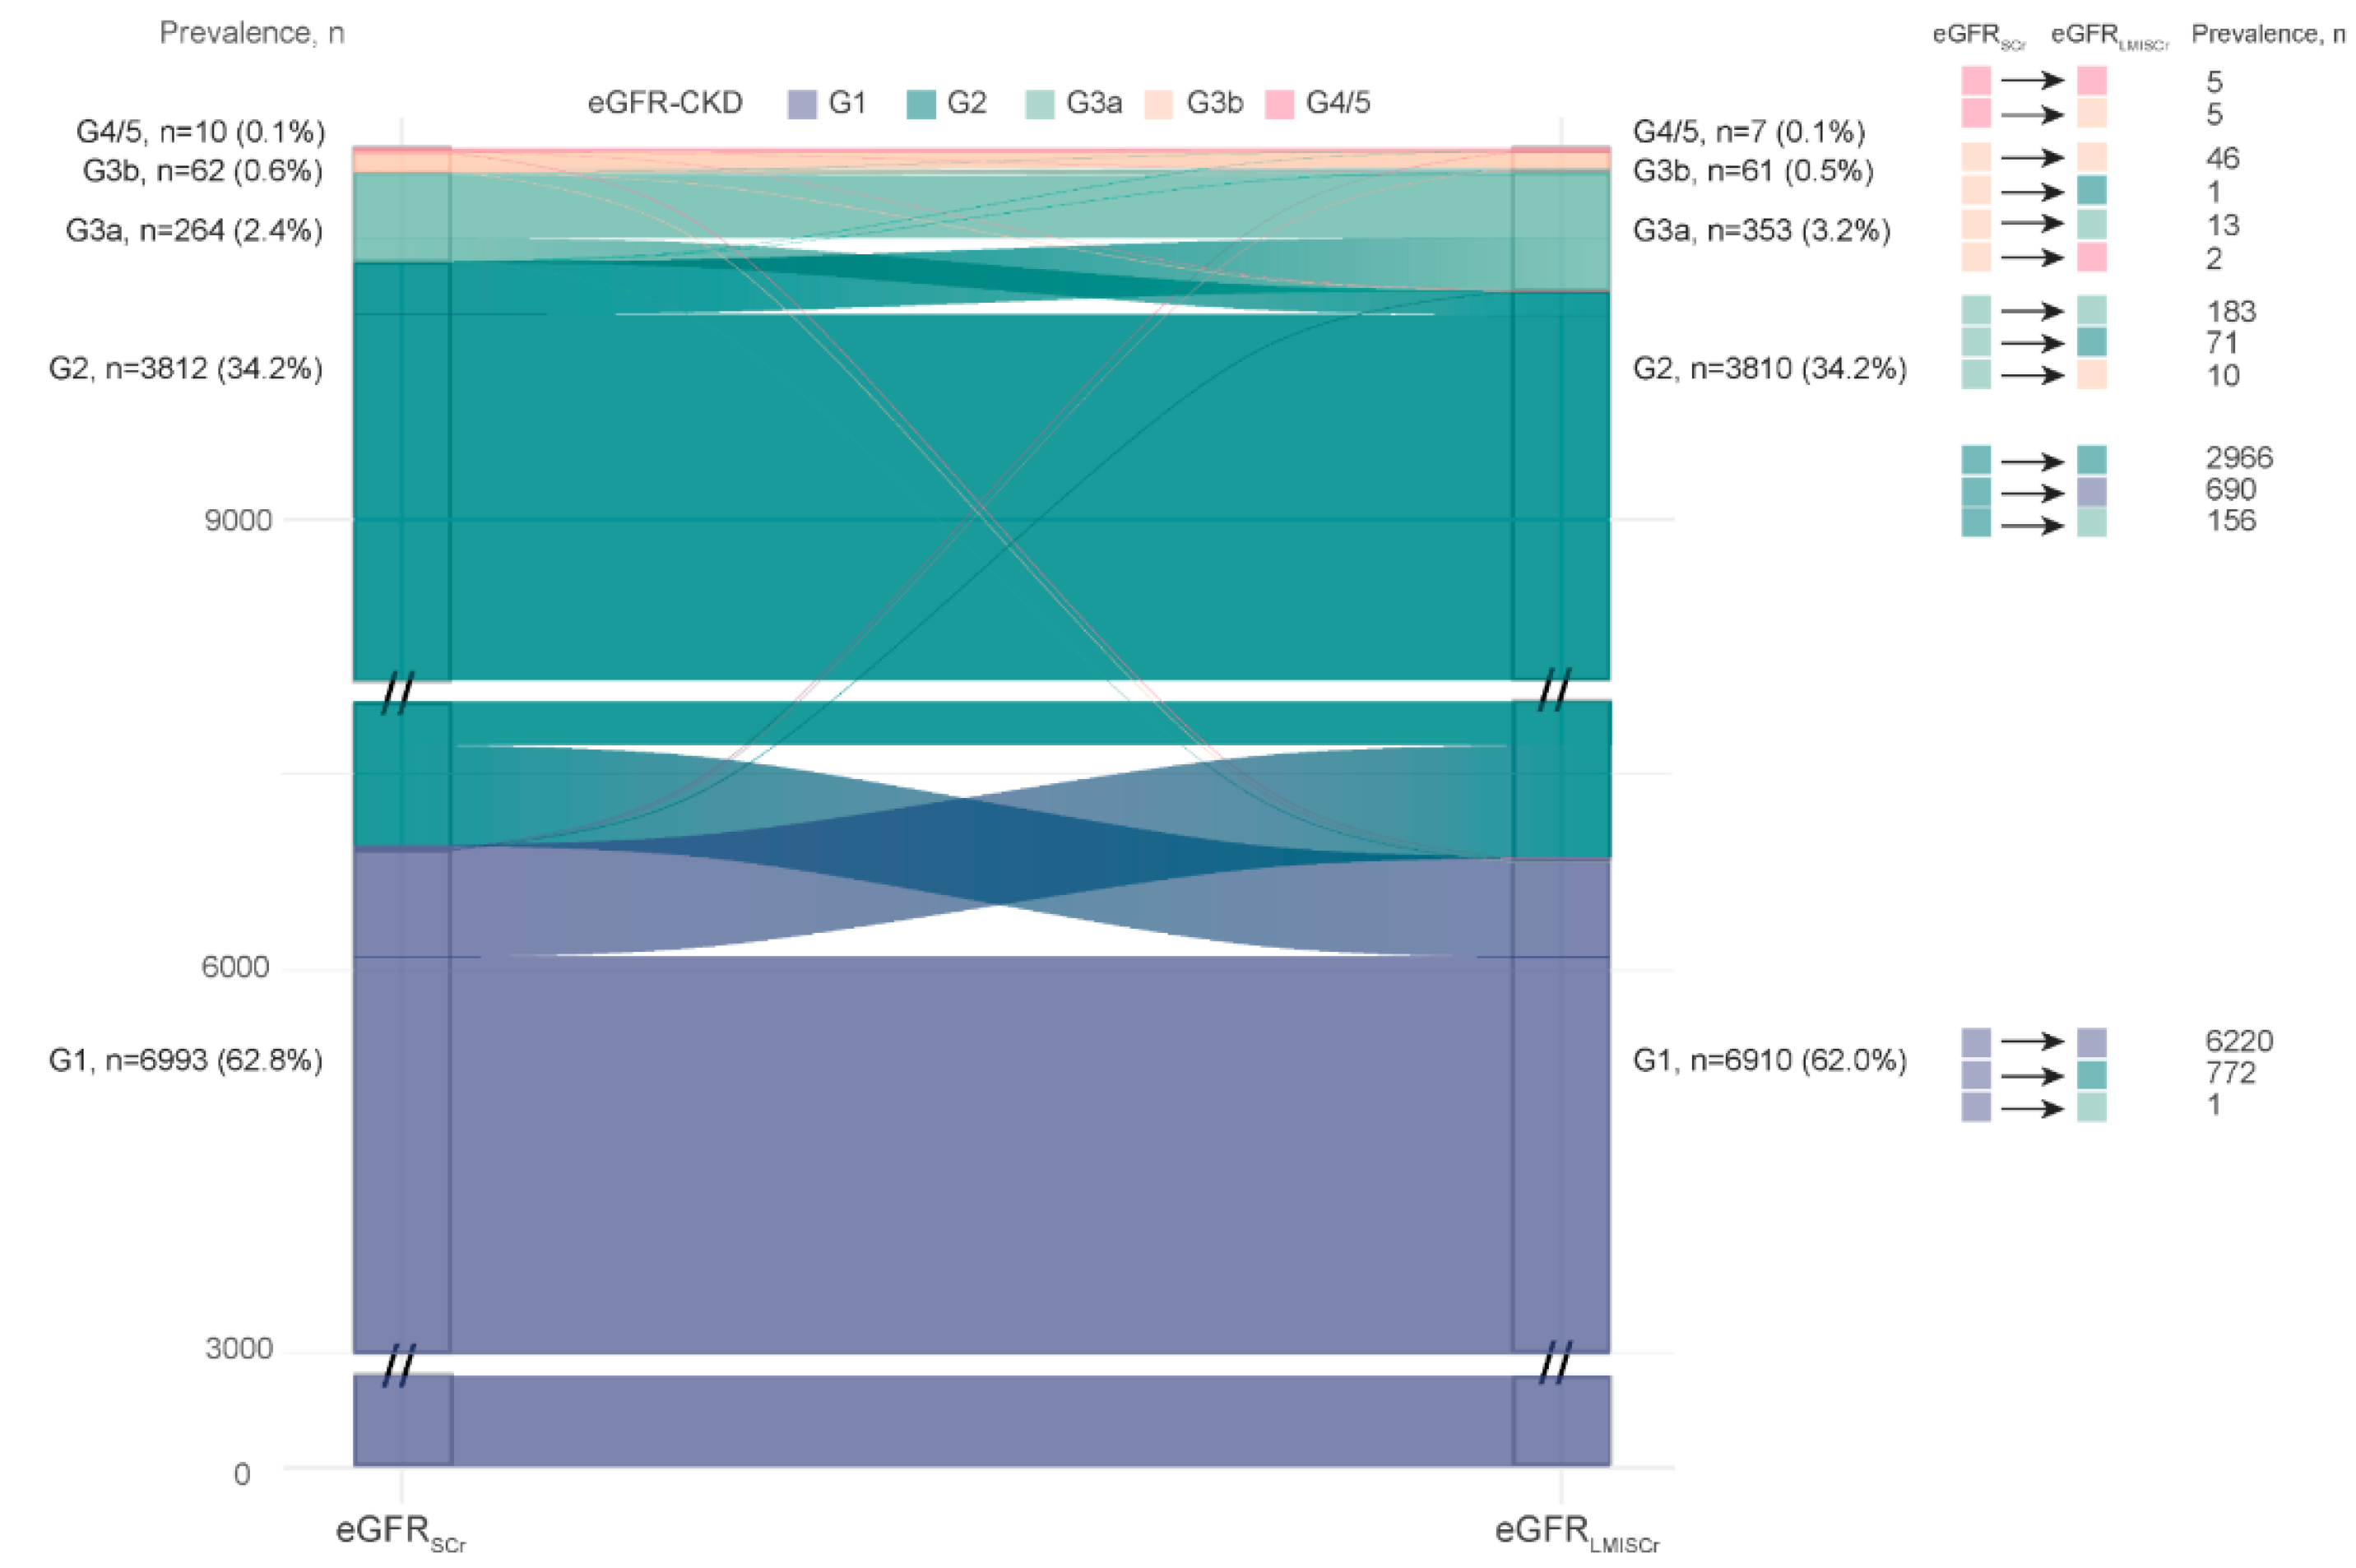
Figure 3.
Annualised change in eGFR stratified by age bins and sex.
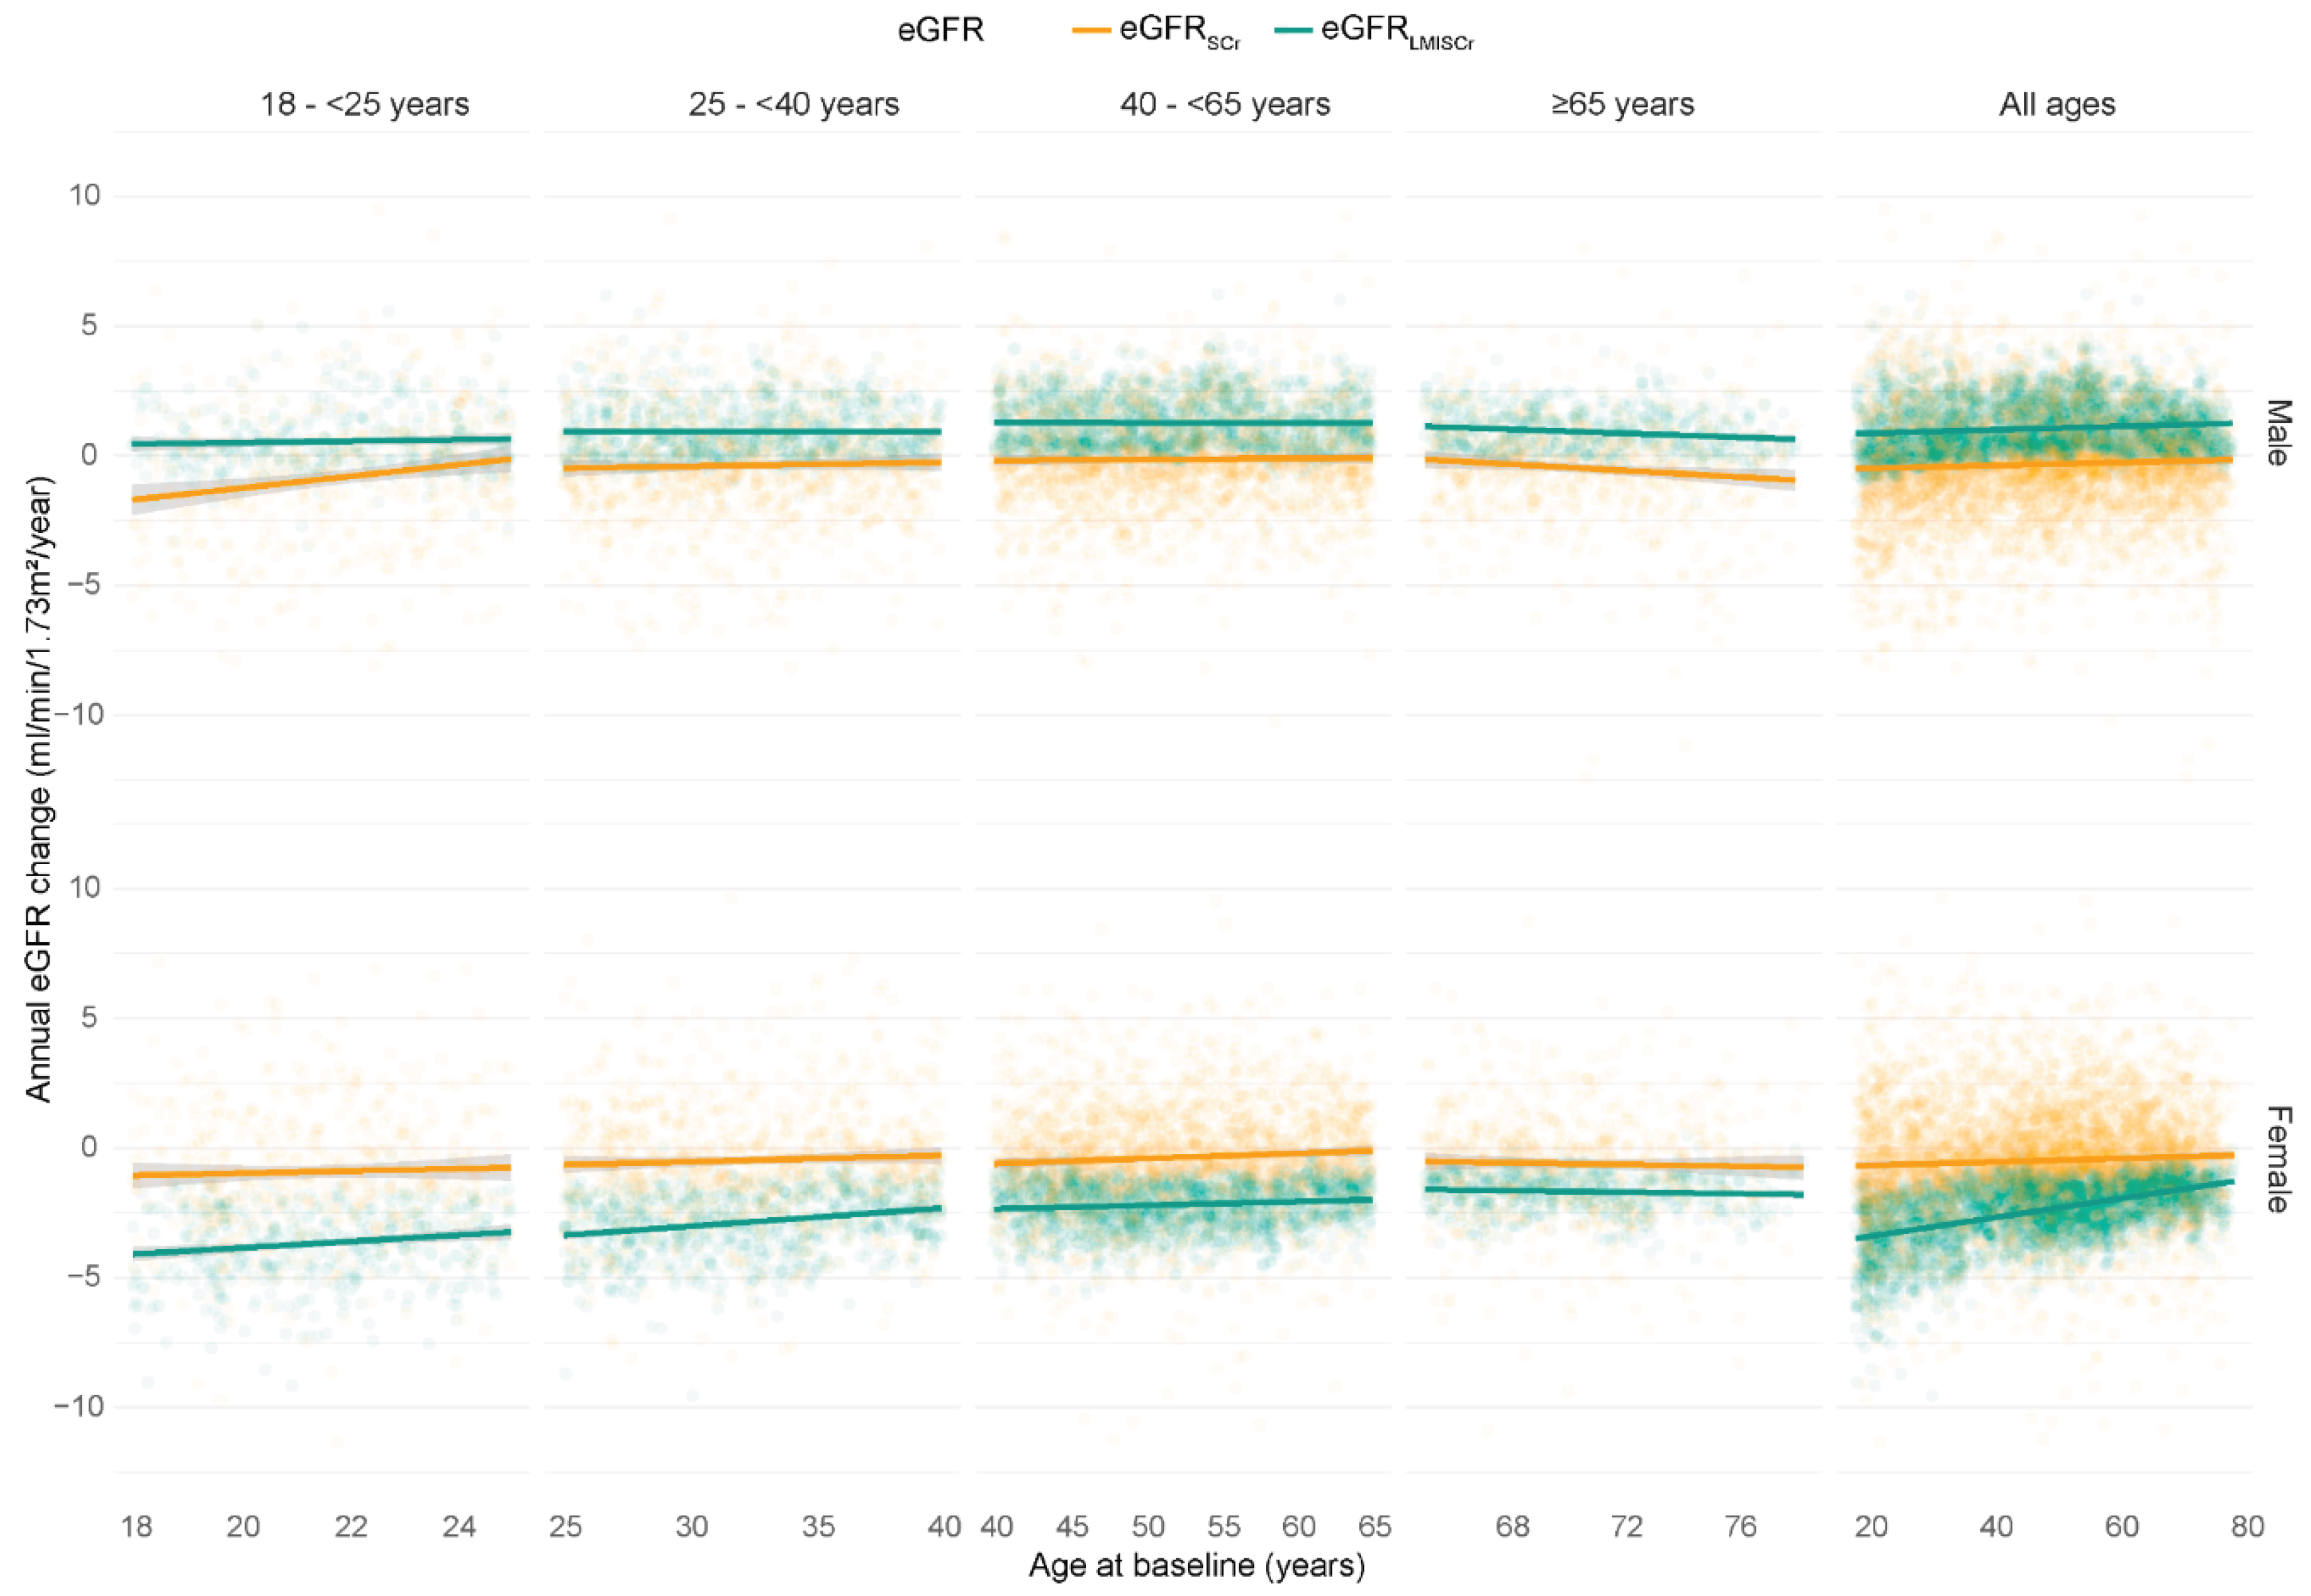

Table 1.
Baseline characteristics of CKD groups.
| eGFRSCr | eGFRLMISCr | ||||||||||||
| Total | G1 | G2 | G3a | G3b | G4/5 | p | G1 | G2 | G3a | G3b | G4/5 | p | |
| Total N (%) | 11141 | 6993 (62.8) | 3812 (34.2) | 264 (2.4) | 62 (0.6) | 10 (0.1) | 6910 (62.0) | 3810 (34.2) | 353 (3.2) | 61 (0.5) | 7 (0.1) | ||
| Males | 5265 (47.3) | 3338 (47.7) | 1764 (46.3) | 122 (46.2) | 35 (56.5) | 6 (60.0) | 0.289 | 3261 (47.2) | 1806 (47.4) | 157 (44.5) | 37 (60.7) | 4 (57.1) | 0.214 |
| Age | 46.0 (17.2) | 38.1 (14.0) | 58.3 (13.6) | 69.7 (8.8) | 71.7 (7.8) | 73.8 (6.8) | <0.001 | 38.3 (14.3) | 57.3 (14.0) | 68.3 (9.2) | 70.9 (9.2) | 72.1 (6.4) | <0.001 |
| 18 - <25 | 1636 (14.7) | 1557 (22.3) | 78 (2.0) | 1 (0.4) | 0 (0.0) | 0 (0.0) | <0.001 | 1543 (22.3) | 92 (2.4) | 1 (0.3) | 0 (0.0) | 0 (0.0) | <0.001 |
| 25 - <40 | 2880 (25.9) | 2538 (36.3) | 340 (8.9) | 2 (0.8) | 0 (0.0) | 0 (0.0) | 2485 (36.0) | 392 (10.3) | 2 (0.6) | 1 (1.6) | 0 (0.0) | ||
| 40 - <65 | 4604 (41.3) | 2621 (37.5) | 1917 (50.3) | 55 (20.8) | 10 (16.1) | 1 (10.0) | 2548 (36.9) | 1945 (51.0) | 101 (28.6) | 9 (14.8) | 1 (14.3) | ||
| ⩾65 | 2021 (18.1) | 277 (4.0) | 1477 (38.7) | 206 (78.0) | 52 (83.9) | 9 (90.0) | 334 (4.8) | 1381 (36.2) | 249 (70.5) | 51 (83.6) | 6 (85.7) | ||
| Creatinine, mg/dL | 0.8 (0.2) | 0.8 (0.1) | 0.9 (0.1) | 1.2 (0.2) | 1.6 (0.3) | 2.9 (2.0) | <0.001 | 0.8 (0.1) | 0.9 (0.1) | 1.1 (0.2) | 1.6 (0.3) | 3.2 (2.3) | <0.001 |
| CreatinineLMI, mg/dL | 0.8 (0.2) | 0.8 (0.2) | 0.9 (0.2) | 1.2 (0.2) | 1.5 (0.3) | 2.7 (1.9) | <0.001 | 0.8 (0.1) | 0.9 (0.1) | 1.2 (0.2) | 1.6 (0.2) | 3.2 (2.1) | <0.001 |
| eGFRSCr | 96.1 (19.1) | 107.8 (12.0) | 78.7 (7.9) | 54.6 (4.0) | 39.7 (3.9) | 22.8 (7.8) | 106.9 (13.4) | 81.2 (10.6) | 59.0 (8.3) | 40.1 (6.7) | 21.7 (9.9) | ||
| eGFRLMISCr | 95.9 (20.0) | 106.9 (14.1) | 79.5 (11.6) | 56.2 (7.4) | 41.3 (6.5) | 26.7 (11.0) | 108.4 (12.3) | 78.0 (8.0) | 54.6 (3.9) | 39.5 (3.9) | 20.8 (8.5) | ||
| Height, cm | 170.6 (9.5) | 171.2 (9.5) | 169.9 (9.4) | 166.5 (9.0) | 167.9 (9.0) | 168.0 (11.8) | <0.001 | 170.9 (9.5) | 170.2 (9.5) | 167.8 (9.5) | 169.3 (8.9) | 166.3 (11.4) | <0.001 |
| Weight, kg | 75.1 (16.0) | 73.4 (16.1) | 77.6 (15.4) | 80.0 (14.8) | 82.8 (14.6) | 90.0 (14.6) | <0.001 | 75.7 (16.9) | 73.9 (14.3) | 73.1 (14.2) | 81.2 (16.7) | 77.3 (18.4) | <0.001 |
| Waist circumference, cm | 93.0 (13.8) | 90.4 (13.4) | 97.0 (13.0) | 102.7 (15.0) | 106.1 (12.5) | 111.2 (12.4) | <0.001 | 92.2 (14.2) | 94.1 (12.8) | 96.6 (14.0) | 104.2 (14.3) | 100.1 (13.7) | <0.001 |
| Waist-to-height, ratio | 0.5 (0.1) | 0.5 (0.1) | 0.6 (0.1) | 0.6 (0.1) | 0.6 (0.1) | 0.7 (0.1) | <0.001 | 0.5 (0.1) | 0.6 (0.1) | 0.6 (0.1) | 0.6 (0.1) | 0.6 (0.1) | <0.001 |
| LMI, kg/m2 | 16.2 (2.3) | 16.0 (2.3) | 16.5 (2.3) | 16.7 (2.0) | 17.2 (2.2) | 18.8 (2.8) | <0.001 | 16.4 (2.4) | 15.8 (2.1) | 15.4 (2.0) | 16.8 (2.7) | 16.6 (3.1) | <0.001 |
| ALMI, kg/m2 | 7.4 (1.3) | 7.4 (1.3) | 7.5 (1.3) | 7.5 (1.1) | 7.7 (1.2) | 8.3 (1.7) | <0.001 | 7.6 (1.4) | 7.2 (1.2) | 6.9 (1.1) | 7.5 (1.4) | 7.2 (1.8) | <0.001 |
| BMI, kg/m2 | 25.7 (4.8) | 25.0 (4.7) | 26.8 (4.6) | 28.8 (4.7) | 29.4 (4.8) | 31.9 (4.5) | <0.001 | 25.8 (5.1) | 25.4 (4.2) | 25.9 (4.4) | 28.2 (4.7) | 27.9 (5.8) | <0.001 |
| FMI, kg/m2 | 8.7 (3.6) | 8.2 (3.5) | 9.5 (3.6) | 11.3 (3.9) | 11.4 (3.9) | 12.2 (3.7) | <0.001 | 8.6 (3.8) | 8.8 (3.2) | 9.7 (3.5) | 10.5 (3.1) | 10.5 (3.7) | <0.001 |
| VATI, kg/m2 | 0.3 (0.3) | 0.2 (0.2) | 0.4 (0.3) | 0.6 (0.3) | 0.7 (0.3) | 0.8 (0.4) | <0.001 | 0.3 (0.3) | 0.4 (0.3) | 0.5 (0.3) | 0.6 (0.3) | 0.6 (0.4) | <0.001 |
| Never smoker | 5099 (45.8) | 3195 (45.7) | 1737 (45.6) | 135 (51.1) | 28 (45.2) | 4 (40.0) | <0.001 | 3164 (45.8) | 1724 (45.3) | 182 (51.6) | 26 (42.6) | 3 (42.9) | <0.001 |
| Former smoker | 3301 (29.7) | 1734 (24.8) | 1426 (37.4) | 105 (39.8) | 30 (48.4) | 6 (60.0) | 1768 (25.6) | 1364 (35.8) | 133 (37.7) | 32 (52.5) | 4 (57.1) | ||
| Current smoker | 2730 (24.5) | 2056 (29.4) | 646 (17.0) | 24 (9.1) | 4 (6.5) | 0 (0.0) | 1969 (28.5) | 720 (18.9) | 38 (10.8) | 3 (4.9) | 0 (0.0) | ||
| Packyears | 9.3 (17.8) | 7.7 (15.3) | 11.8 (20.5) | 14.2 (27.0) | 19.4 (27.1) | 15.1 (30.9) | <0.001 | 7.9 (15.5) | 11.4 (20.2) | 13.5 (25.4) | 18.0 (27.4) | 20.6 (36.4) | <0.001 |
| Metabolic syndrome | 2947 (26.5) | 1215 (17.4) | 1506 (39.5) | 172 (65.2) | 45 (72.6) | 9 (90.0) | <0.001 | 1420 (20.5) | 1296 (34.0) | 183 (51.8) | 42 (68.9) | 6 (85.7) | <0.001 |
| ObesityWHO | 1888 (16.9) | 955 (13.7) | 802 (21.0) | 97 (36.7) | 26 (41.9) | 8 (80.0) | <0.001 | 1303 (18.9) | 500 (13.1) | 59 (16.7) | 22 (36.1) | 4 (57.1) | <0.001 |
| ObesityLDEC | 4823 (43.3) | 2367 (33.8) | 2202 (57.8) | 195 (73.9) | 50 (80.6) | 9 (90.0) | <0.001 | 2731 (39.5) | 1846 (48.5) | 196 (55.5) | 46 (75.4) | 4 (57.1) | <0.001 |
| Dyslipidemia | 8168 (84.2) | 4494 (79.0) | 3369 (91.7) | 237 (90.8) | 58 (93.5) | 10 (100.0) | <0.001 | 4491 (79.8) | 3291 (90.1) | 322 (92.5) | 57 (93.4) | 7 (100.0) | <0.001 |
| Pre-diabetes/diabetes | 2304 (20.8) | 1056 (15.2) | 1111 (29.3) | 110 (42.0) | 20 (32.8) | 7 (70.0) | <0.001 | 1103 (16.0) | 1046 (27.6) | 131 (37.2) | 20 (33.3) | 4 (57.1) | <0.001 |
| Pre-diabetes | 596 (5.4) | 247 (3.5) | 281 (7.4) | 49 (18.7) | 18 (29.5) | 1 (10.0) | 291 (4.2) | 248 (6.5) | 42 (11.9) | 15 (25.0) | 0 (0.0) | ||
| Diabetes | 596 (5.3) | 247 (3.5) | 281 (7.4) | 49 (18.6) | 18 (29.0) | 1 (10.0) | <0.001 | 291 (4.2) | 248 (6.5) | 42 (11.9) | 15 (24.6) | 0 (0.0) | <0.001 |
| Cardiovascular disease | 804 (7.2) | 197 (2.8) | 494 (13.0) | 76 (28.8) | 31 (50.0) | 6 (60.0) | <0.001 | 229 (3.3) | 458 (12.0) | 78 (22.1) | 35 (57.4) | 4 (57.1) | <0.001 |
| Hypertension | 1890 (17.0) | 553 (7.9) | 1128 (29.6) | 152 (57.6) | 48 (77.4) | 9 (90.0) | <0.001 | 675 (9.8) | 1010 (26.5) | 154 (43.6) | 46 (75.4) | 5 (71.4) | <0.001 |
| Osteopenia/osteoporosis | 5071 (46.6) | 2790 (40.9) | 2061 (55.3) | 174 (67.7) | 41 (67.2) | 5 (55.6) | <0.001 | 2611 (38.8) | 2164 (58.0) | 249 (71.8) | 41 (69.5) | 6 (85.7) | <0.001 |
| Asthma | 1033 (9.3) | 682 (9.8) | 327 (8.6) | 17 (6.5) | 7 (11.3) | 0 (0.0) | 0.092 | 673 (9.8) | 325 (8.6) | 28 (8.1) | 6 (9.8) | 1 (14.3) | 0.250 |
| COPD | 839 (7.6) | 455 (6.5) | 340 (8.9) | 38 (14.4) | 6 (9.7) | 0 (0.0) | <0.001 | 435 (6.3) | 341 (9.0) | 55 (15.6) | 8 (13.1) | 0 (0.0) | <0.001 |
| Anxiety | 2311 (20.9) | 1578 (22.8) | 685 (18.0) | 38 (14.4) | 8 (12.9) | 2 (20.0) | <0.001 | 1515 (22.1) | 731 (19.2) | 52 (14.8) | 11 (18.0) | 2 (28.6) | <0.001 |
| Depression | 1044 (9.4) | 651 (9.4) | 339 (8.9) | 39 (14.9) | 12 (19.7) | 3 (30.0) | <0.001 | 626 (9.1) | 361 (9.5) | 41 (11.7) | 13 (21.3) | 3 (42.9) | <0.001 |
| Psychological disorders | 715 (6.4) | 412 (5.9) | 276 (7.2) | 21 (8.0) | 4 (6.5) | 2 (20.0) | 0.020 | 421 (6.1) | 261 (6.9) | 24 (6.8) | 8 (13.1) | 1 (14.3) | 0.101 |
| Neurological disorders | 357 (3.2) | 168 (2.4) | 160 (4.2) | 23 (8.7) | 5 (8.1) | 1 (10.0) | <0.001 | 187 (2.7) | 139 (3.6) | 25 (7.1) | 5 (8.2) | 1 (14.3) | <0.001 |
| Systolic blood pressure, mmHg | 129.0 (20.8) | 124.0 (18.7) | 136.9 (21.4) | 140.0 (20.3) | 148.3 (22.2) | 150.2 (13.4) | <0.001 | 124.8 (19.1) | 135.3 (21.7) | 138.3 (20.7) | 148.5 (22.5) | 138.3 (21.8) | <0.001 |
| Diastolic blood pressure, mmHg | 77.1 (11.4) | 75.5 (11.2) | 80.0 (11.3) | 79.0 (11.1) | 81.6 (12.1) | 72.2 (10.4) | <0.001 | 75.9 (11.3) | 79.2 (11.3) | 78.6 (11.0) | 80.2 (12.6) | 71.4 (10.4) | <0.001 |
| Cholesterol, mg/dL | 203.6 (43.3) | 195.7 (41.8) | 218.1 (42.3) | 205.5 (42.8) | 198.0 (48.8) | 184.3 (42.9) | <0.001 | 195.4 (41.7) | 217.4 (42.0) | 217.2 (46.6) | 202.7 (49.2) | 190.7 (42.1) | <0.001 |
| HDL, mg/dL | 64.0 (18.7) | 63.1 (18.0) | 65.9 (19.7) | 61.2 (17.3) | 56.2 (18.9) | 50.0 (21.8) | <0.001 | 62.1 (17.9) | 67.3 (19.5) | 65.4 (18.8) | 58.2 (19.8) | 48.6 (19.6) | <0.001 |
| LDL, mg/dL | 123.1 (37.9) | 118.4 (37.1) | 130.4 (37.8) | 117.6 (37.8) | 109.9 (47.9) | 98.8 (35.6) | <0.001 | 118.4 (37.2) | 129.3 (37.5) | 127.2 (42.0) | 114.7 (45.2) | 105.4 (42.4) | <0.001 |
| Fibrinogen, g/L | 3.1 (0.7) | 3.0 (0.7) | 3.3 (0.7) | 3.5 (0.8) | 3.7 (0.7) | 4.3 (0.8) | <0.001 | 3.0 (0.7) | 3.2 (0.7) | 3.5 (0.7) | 3.7 (0.8) | 4.3 (0.6) | <0.001 |
| Triglyceride, mg/dL | 109.7 (72.3) | 103.4 (72.3) | 118.0 (70.1) | 135.9 (65.7) | 168.3 (94.2) | 207.0 (158.1) | <0.001 | 105.9 (72.2) | 113.9 (72.0) | 127.9 (59.0) | 153.7 (88.1) | 254.4 (186.0) | <0.001 |
| HbA1C, mmol/mol | 34.3 (5.8) | 33.4 (5.7) | 35.5 (5.4) | 38.9 (7.1) | 39.8 (7.5) | 38.6 (9.8) | <0.001 | 33.6 (6.0) | 35.1 (5.3) | 37.2 (5.8) | 38.9 (7.6) | 34.7 (5.7) | <0.001 |
Table 2.
Associations of eGFR with comorbidities.
| eGFRSCr | eGFRLMISCr | |||||
| Outcomes | OR (95% CI) | p-value | OR (95% CI) | p-value | ∆ OR (95% CI) | p-value |
| Cardiovascular disease | 0.84 (0.75, 0.95) | 0.004 | 1.04 (0.93, 1.17) | 0.499 | 1.23 (1.16, 1.31) | <0.001 |
| Hypertension | 0.82 (0.75, 0.89) | <0.001 | 1.27 (1.16, 1.39) | <0.001 | 1.55 (1.48, 1.63) | <0.001 |
| Metabolic syndrome | 0.95 (0.88, 1.02) | 0.157 | 1.69 (1.57, 1.82) | <0.001 | 1.78 (1.70, 1.87) | <0.001 |
| Dyslipidemia | 1 (0.92, 1.09) | 0.96 | 1.19 (1.1, 1.29) | <0.001 | 1.19 (1.12, 1.25) | <0.001 |
| Prediabetes | 1.05 (0.97, 1.14) | 0.203 | 1.31 (1.21, 1.41) | <0.001 | 1.24 (1.18, 1.31) | <0.001 |
| Diabetes | 1.21 (1.05, 1.39) | 0.007 | 2.22 (1.91, 2.58) | <0.001 | 1.83 (1.68, 2.01) | <0.001 |
| ObesityLDEC | 1.04 (0.97, 1.1) | 0.278 | 2.56 (2.39, 2.75) | <0.001 | 2.48 (2.37, 2.59) | <0.001 |
| ObesityWHO | 0.97 (0.9, 1.05) | 0.402 | 4.25 (3.84, 4.71) | <0.001 | 4.39 (4.07, 4.78) | <0.001 |
Estimates are odds ratios (OR) and 95% confidence intervals (CI) obtained from logistic regression models adjusted for age and sex. ∆OR are bootstrapped at 1000 resamples. Significance is considered where p<0.001.
Table 3.
a. Age and sex effects on eGFR.
| eGFRSCr | eGFRLMISCr | |||||
| Unstandardised β (95% CI) | Standardised β (95% CI) | p-value | Unstandardised β (95% CI) | Standardised β (95% CI) | p-value | |
| Female | 3.13 (1.79, 4.47) | 0.01 (0, 0.02) | <0.001 | 2.97 (1.5, 4.43) | 0.01 (0, 0.03) | <0.001 |
| Age | -0.80 (-0.82, -0.78) | -0.75 (-0.76, -0.74) | <0.001 | -0.81 (-0.83, -0.79) | -0.72 (-0.73, -0.71) | <0.001 |
| Female *Age | -0.06 (-0.09, -0.03) | -0.03 (-0.04, -0.01) | <0.001 | -0.05 (-0.08, -0.02) | -0.02 (-0.04, -0.01) | <0.001 |
| Estimates were obtained from linear regression models. Significance is considered where p<0.05. | ||||||
Table 3.
b. Age and sex effects on eGFR, stratified by CKD stages.
| eGFRSCr | eGFRLMISCr | |||||||||||
| Age | p-value | Female | p-value | Age* Female | p-value | Age | p-value | Female | p-value | Age*sex | p-value | |
| G2 | 1.09 (1.09, 1.1) | 0.000 | 0.82 (0.56, 1.2) | 0.308 | 1 (1, 1.01) | 0.182 | 1.09 (1.08, 1.09) | 0.000 | 0.96 (0.68, 1.37) | 0.805 | 1 (0.99, 1.01) | 0.985 |
| G3a | 1.21 (1.18, 1.24) | 0.000 | 0.31 (0.03, 3.08) | 0.316 | 1.02 (0.99, 1.05) | 0.242 | 1.18 (1.15, 1.2) | 0.000 | 0.29 (0.05, 1.67) | 0.165 | 1.02 (0.99, 1.05) | 0.129 |
| G3b | 1.23 (1.19, 1.27) | 0.000 | 0 (0, 0) | 0.000 | 1.09 (1.08, 1.1) | 0.000 | 1.21 (1.17, 1.25) | 0.000 | 0.01 (0, 0.01) | 0.000 | 1.07 (1.06, 1.08) | 0.000 |
| G4/5 | 1.29 (1.27, 1.3) | 0.000 | 0 (0, 0) | 0.000 | 1.16 (1.14, 1.18) | 0.000 | 1.36 (1.36, 1.40) | 0.000 | 27518.94 (27396.05, 27642.38) | 0.000 | 0.86 (0.85, 0.88) | 0.000 |
| Estimates were obtained from logistic regression models. Significance is considered where p<0.05. | ||||||||||||
Table 4.
Reclassification of eGFR-CKD stages.
| eGFRSCr | eGFRLMISCr | Total n in eGFRSCr | ||||
| G1 | G2 | G3a | G3b | G4/5 | ||
| G1 | 6220 | 772 | 1 | 0 | 0 | 6993 |
| G2 | 690 | 2966 | 156 | 0 | 0 | 3812 |
| G3a | 0 | 71 | 183 | 10 | 0 | 264 |
| G3b | 0 | 1 | 13 | 46 | 2 | 62 |
| G4/5 | 0 | 0 | 0 | 5 | 5 | 10 |
| Total n in eGFRLMISCr | 6910 | 3810 | 353 | 61 | 7 | 11141 |
Table 5.
Associations of age, sex and eGFR definitions on annualised eGFR slopes.
| β (95% CI) | p-value | |
| eGFRSCr (ref. eGFRLMISCr) | -1.38 (-1.46 – -1.3) | <0.001 |
| Age | 0.01 (0 – 0.01) | <0.001 |
| Female (ref. Male) | -3.47 (-3.55 – -3.39) | <0.001 |
| eGFRSCr * Age | 0 (-0.01 – 0) | 0.721 |
| eGFRSCr * Female | 3.31 (3.2 – 3.43) | <0.001 |
| Age * Female | 0.03 (0.02 – 0.03) | <0.001 |
| eGFRSCr * Age * Female | -0.03 (-0.04 – -0.02) | <0.001 |
| Estimates β and 95% confidence interval (CI) were obtained from mixed effect linear regression models, with individual participants as random intercepts. Significance is considered where p<0.05. | ||
Disclaimer/Publisher’s Note: The statements, opinions and data contained in all publications are solely those of the individual author(s) and contributor(s) and not of MDPI and/or the editor(s). MDPI and/or the editor(s) disclaim responsibility for any injury to people or property resulting from any ideas, methods, instructions or products referred to in the content. |
© 2026 by the authors. Licensee MDPI, Basel, Switzerland. This article is an open access article distributed under the terms and conditions of the Creative Commons Attribution (CC BY) license (http://creativecommons.org/licenses/by/4.0/).
Copyright: This open access article is published under a Creative Commons CC BY 4.0 license, which permit the free download, distribution, and reuse, provided that the author and preprint are cited in any reuse.


