
Submitted:
16 July 2026
Posted:
17 July 2026
You are already at the latest version
Abstract
Road infrastructure plays a strategic role in supporting the mobility of people and the distribution of goods, so that maintaining an adequate level of service requires effective and continuous maintenance programs informed by reliable pavement evaluation. In Indonesia, the functional performance of pavements is commonly assessed through the International Roughness Index (IRI) and the Pavement Condition Index (PCI); however, the relationship between these two indicators may differ from one road section to another depending on distress patterns and traffic characteristics. This study analyzes the correlation between IRI and PCI on eleven national road sections on Ambon Island, Maluku Province. Secondary data from the 2021 road condition survey conducted by the Maluku National Road Implementation Agency were analyzed using simple linear regression in IBM SPSS Statistics 23. The results reveal a moderate negative relationship, with a correlation coefficient (R) of 0.423 and a coefficient of determination (R²) of 0.179. The fitted model, IRI = 8.836 − 0.047 PCI, indicates that pavements in better condition (higher PCI) tend to exhibit lower roughness. The regression was statistically significant (F = 73.616; p < 0.001). Nevertheless, PCI explains only 17.9% of the variation in IRI, confirming that roughness is also governed by factors beyond visible surface distress, such as pavement age, traffic loading, and construction quality. The findings support the combined use of both indices for a more comprehensive functional assessment of urban national roads.
Keywords:
International Roughness Index
; Pavement Condition Index
; road condition survey
; national roads
; linear regression
1. Introduction
Road infrastructure is a strategic component of land transportation that supports human mobility and the distribution of goods and services, and a well-connected road network is widely recognized as a key driver of economic growth, agricultural activity, and regional development. In developing countries, where road agencies frequently operate under limited budgets, the demand for systematic and cost-effective road condition assessment has become increasingly urgent [1]. Consequently, road authorities continue to expand and rehabilitate their networks in order to reduce regional isolation and improve community welfare.
As traffic volume and axle loads increase, pavement performance progressively deteriorates, manifesting as various forms of surface distress and a decline in riding comfort. Maintaining pavements at an acceptable service level therefore requires timely maintenance programs that are based on accurate and up-to-date condition data [2]. Reliable condition information provides the basis for prioritizing treatments and allocating scarce resources efficiently, and it is a fundamental input to any pavement management system [3]. Weak or outdated data, by contrast, often leads to premature and costly rehabilitation.
Two indicators are widely used to characterize the functional performance of pavements. The International Roughness Index (IRI) quantifies longitudinal surface unevenness and is closely associated with riding comfort and vehicle operating costs; it is derived from the measured road profile using a standardized quarter-car model [4,5], and its computation from longitudinal profiles is defined in ASTM E1926 [6]. The Pavement Condition Index (PCI), in contrast, is a numerical rating from 0 to 100 that reflects the type, severity, and extent of visible surface distress, and it is obtained through detailed distress surveys following ASTM D6433 [7,8]. Because IRI captures ride quality while PCI captures structural-functional distress, the two indices provide complementary perspectives on pavement serviceability.
In Indonesia, the functional evaluation of national roads generally follows guidelines issued by the Directorate General of Highways under the Ministry of Public Works and Public Housing, in which both IRI and PCI are employed to classify road condition. Several Indonesian studies have combined IRI, PCI, and the Surface Distress Index to determine road condition and maintenance needs [9,10], and early-distress investigations have highlighted how inadequate condition monitoring accelerates deterioration and inflates handling costs [11]. Collectively, these studies confirm the practical value of jointly interpreting roughness and distress data for network-level decision making.
Although IRI and PCI are conceptually related, their empirical relationship is not universal and tends to vary with pavement type, distress composition, climate, and road class. In rural road networks, strong negative correlations have been reported, with coefficients of determination reaching 0.75 or higher [12], whereas urban and arid-region studies have proposed nonlinear (exponential) IRI–PCI models with differing goodness of fit [13,14]. Comparative reviews of roughness specifications further show that reported correlations are strongly influenced by measurement protocol and local conditions [15]. This variability implies that a correlation calibrated for one region cannot be transferred uncritically to another, and that locally derived relationships remain necessary.
In parallel, recent research has increasingly applied statistical and machine-learning techniques to predict roughness and pavement condition from field and traffic data [16,17]. Data-driven models based on ensemble and Gaussian-process algorithms have achieved high predictive accuracy for IRI on flexible and composite pavements [18,19,20,21]. Nevertheless, before such advanced models can be applied, the fundamental bivariate relationship between the two most commonly collected indices, IRI and PCI, must be understood for the specific network under study. To date, this relationship has rarely been quantified for national roads in the eastern Indonesian archipelago, where terrain, climate, and traffic loading differ markedly from the Java-centred contexts that dominate the existing literature. This gap motivates the present study.
The novelty of this work lies in providing the first quantitative correlation between IRI and PCI for national road sections on Ambon Island, Maluku Province, based on a complete official condition survey. Accordingly, the objective of this study is to analyze the correlation between IRI and PCI on eleven national road sections on Ambon Island, to derive a locally calibrated regression model, and to evaluate the extent to which surface distress, as represented by PCI, explains variations in road roughness. The findings are expected to support more evidence-based maintenance planning for road agencies operating in similar regional settings.
2. Materials and Methods
2.1. Study Area
The study was carried out on several national road sections on Ambon Island, Maluku Province, Indonesia, which fall under the jurisdiction of the Maluku National Road Implementation Agency (Balai Pelaksanaan Jalan Nasional, BPJN). The eleven sections examined were Pelabuhan Road, Yos Sudarso Road, Pala Road, Pantai Mardika Road, Pantai Batu Merah Road, Sultan Hasanuddin Road, Jenderal Sudirman Road, Rijali Road, Ahmad Yani Road, Diponegoro Road, and A.M. Sangaji Road. These are predominantly urban arterial and collector links within the city of Ambon, carrying mixed traffic under a tropical wet climate. The spatial distribution of the study locations is presented in Figure 1.
2.2. Data Source
The analysis relied on secondary data extracted from the 2021 Fiscal Year Survey Report on the Condition of Roads, Slopes, and Bridges in Maluku Province [22,23]. Two datasets were used: IRI values, expressed in metres per kilometre (m/km), which describe longitudinal surface unevenness; and PCI values, which describe pavement condition based on the type, severity, and extent of distress recorded on each surveyed section. The two datasets were spatially matched by road link and station so that roughness and distress could be compared over the same pavement segments. In total, 340 paired segment observations were available for the regression analysis.
2.3. Roughness (IRI) Measurement
Roughness was measured in the field using an Irimeter-2 device mounted on a survey vehicle. The instrument records the longitudinal profile of the road surface and converts it into roughness values in m/km, consistent with the standardized quarter-car formulation of the IRI [4,6]. Data were collected per lane and aggregated into fixed-length segments. The configuration of the roughness survey equipment is shown in Figure 2.
2.4. Pavement Condition (PCI) Survey
The pavement distress survey used to derive PCI values was conducted with a survey vehicle equipped with a video-imaging system. The recorded imagery was used to identify the distress type, severity level, and extent for each segment, which then served as the basis for computing PCI following the ASTM D6433 procedure [7,8]. An example of the video-imaging output used for distress identification is shown in Figure 3.
2.5. Data Analysis
The relationship between IRI and PCI was examined using simple linear regression implemented in IBM SPSS Statistics version 23. In the model, PCI was treated as the independent (predictor) variable and IRI as the dependent variable, and the Enter method was applied so that the predictor was retained in the model. The strength and direction of the association were evaluated through the correlation coefficient (R) and the coefficient of determination (R²), while the overall significance of the model was tested using analysis of variance (the F-test) at a 5% significance level. The regression coefficients were then used to formulate the predictive equation. The normality of the standardized residuals was inspected using a normal probability (P–P) plot to verify that the assumptions underlying linear regression were reasonably satisfied. This procedure is consistent with regression-based approaches widely adopted in recent IRI–PCI modelling studies [12,13,14], and it is fully reproducible from the openly documented survey data.
3. Results and Discussion
3.1. Pavement Roughness Based on IRI Values
The IRI survey indicates that most of the examined national road sections on Ambon Island fall within the “Fair” category, with average IRI values ranging from approximately 4.17 m/km to 5.56 m/km, whereas A.M. Sangaji Road, at 3.96 m/km, falls within the “Good” category. The highest roughness was recorded on Sultan Hasanuddin Road (5.56 m/km) and the lowest on A.M. Sangaji Road (3.96 m/km). These values indicate that surface unevenness across the network generally remains at a good-to-moderate service level and does not yet warrant major structural intervention. A representative extract of the segment-level IRI survey output is presented in Table 1, illustrating the fixed-length reporting format used in the source dataset.
3.2. Pavement Condition Based on PCI Values
Evaluation using the PCI method shows that the pavement condition of the national road sections on Ambon Island generally falls within the “Satisfactory” to “Good” categories, with average PCI values ranging from 77.97 to 86.40, as summarized in Table 2. The highest PCI value was recorded on Rijali Road (86.40, “Good”), while the lowest occurred on Pantai Mardika Road (77.97, “Satisfactory”). Overall, the surveyed pavements remain in fairly good structural-functional condition and do not yet require major rehabilitation, although the sections in the lower part of the range would benefit from preventive maintenance to arrest further distress progression.
3.3. Correlation Between IRI and PCI Values
The relationship between IRI and PCI was analyzed using simple linear regression in IBM SPSS Statistics 23. The analysis began by defining the variables entered into the model, as reported in Table 3, in which PCI was specified as the predictor and IRI as the dependent variable using the Enter method.
The model summary in Table 4 yields a correlation coefficient (R) of 0.423, which indicates a moderate negative association between PCI and IRI. The coefficient of determination (R²) of 0.179 shows that variation in PCI accounts for approximately 17.9% of the variation in IRI, leaving about 82.1% to be explained by factors not captured by the model. A moderate association of this magnitude is consistent with several urban-network studies, in which the IRI–PCI relationship is weaker than in controlled rural datasets because urban roughness is strongly affected by localized features such as utility patches, intersections, and drainage irregularities that are not fully reflected in the PCI score [13,14].
The statistical significance of the model was assessed using analysis of variance, as presented in Table 5. The F-value of 73.616 with a significance level below 0.001 (p < 0.05) confirms that the regression model is statistically significant and that PCI is a meaningful, non-random predictor of IRI across the 340 paired observations.
The regression coefficients are reported in Table 6. Based on these coefficients, the fitted relationship between IRI and PCI is expressed in Equation (1):
where IRI is the International Roughness Index (m/km) and PCI is the Pavement Condition Index (dimensionless). The negative slope indicates that an increase in PCI is associated with a decrease in IRI; that is, pavements in better condition tend to exhibit lower surface roughness. The standardized coefficient (Beta = −0.432) reinforces the moderate strength of this inverse relationship. This behaviour is physically consistent with the concept of pavement serviceability, in which reduced surface distress translates into a smoother riding surface [8,12].
IRI = 8.836 − 0.047 (PCI)
3.4. Relationship and Interpretation
The fitted relationship between IRI and PCI is visualized in Figure 4. The regression line confirms the negative trend implied by Equation (1): as PCI increases, predicted IRI decreases. However, the relatively low coefficient of determination indicates that surface distress, as represented by PCI, is not the sole determinant of roughness. Additional factors, including pavement age, cumulative traffic loading, axle-load spectra, subgrade support, drainage conditions, environmental exposure, and construction quality, also contribute to the development of unevenness [2,18]. This partial explanatory power is one reason why recent studies have moved toward multivariate and machine-learning models that incorporate such variables to improve IRI prediction accuracy [17,19,20,21].
To verify that the linear regression assumptions were reasonably satisfied, the normality of the standardized residuals was examined using the normal probability (P–P) plot shown in Figure 5. The plotted points cluster closely along the diagonal reference line, indicating that the residuals are approximately normally distributed and that the linear model is statistically acceptable for the observed data. This diagnostic supports the validity of the significance test reported in Table 5.
Taken together, the results demonstrate that IRI and PCI are meaningfully but only moderately correlated on the studied urban national roads. From a practical standpoint, this implies that neither index should be used in isolation: PCI captures distress that may not yet affect ride quality, whereas IRI captures roughness that may arise from mechanisms beyond visible distress. Their combined interpretation therefore provides a more complete and reliable basis for prioritizing maintenance and rehabilitation within a pavement management framework [1,3,16]. The locally calibrated model in Equation (1) offers road agencies in Maluku a preliminary, network-specific tool for cross-checking the two indices where only one has been measured.
4. Conclusions
This study analyzed the correlation between the International Roughness Index (IRI) and the Pavement Condition Index (PCI) on eleven national road sections on Ambon Island, Maluku Province, using official 2021 condition-survey data and simple linear regression. The IRI survey showed that most sections fall within the “Fair” category (3.96–5.56 m/km), while the PCI survey indicated “Satisfactory” to “Good” conditions (77.97–86.40), confirming that the network is currently in a good-to-moderate serviceable state.
The regression analysis produced a correlation coefficient (R) of 0.423 and a coefficient of determination (R²) of 0.179, corresponding to a moderate negative relationship in which PCI explains about 17.9% of the variation in IRI. The fitted model, IRI = 8.836 − 0.047 PCI, was statistically significant (F = 73.616; p < 0.001), demonstrating that better pavement condition is reliably associated with lower roughness. The principal contribution of this work is the first locally calibrated IRI–PCI relationship for national roads in the Maluku region, which can assist agencies in cross-validating the two indices and in making more evidence-based maintenance decisions.
The main limitation of the study is that it considers only the bivariate relationship between PCI and IRI and relies on secondary data from a single survey year, so the relatively low R² reflects the influence of unmodelled variables. Future research should therefore incorporate additional explanatory factors, such as pavement age, traffic loading, subgrade and drainage conditions, and construction quality, and should explore multivariate or machine-learning models and multi-year datasets to enhance predictive accuracy and support long-term pavement management.
Author Contributions
Conceptualization, E.M.G. and B.B.; methodology, E.M.G., B.B. and M.A.A.; formal analysis, E.M.G.; investigation, E.M.G.; data curation, E.M.G.; writing—original draft preparation, E.M.G.; writing—review and editing, B.B. and M.A.A.; supervision, B.B. and M.A.A. All authors have read and agreed to the published version of the manuscript.
Funding
This research received no external funding.
Data Availability Statement
The data used in this study were obtained from the 2021 road condition survey reports of the Maluku National Road Implementation Agency (BPJN Maluku) and are available from the agency upon reasonable request.
Acknowledgments
The authors gratefully acknowledge the Maluku National Road Implementation Agency (Balai Pelaksanaan Jalan Nasional Maluku) for providing the road condition survey data, and the Department of Civil Engineering, Hasanuddin University, for its support during this study.
Conflicts of Interest
The authors declare no conflicts of interest.
References
- Khahro, S.H.; Memon, Z.A.; Gungat, L.; Yazid, M.R.M.; Rahim, A.; Mubaraki, M.; Md Yusoff, N.I. Low-cost pavement management system for developing countries. Sustainability 2021, 13, 5941. [CrossRef]
- Khahro, S.H.; Memon, Z.A.; Yusoff, N.I.M.; Memon, A.H.; Memon, R.A. Pavement maintenance management framework for flexible roads: a case study of Pakistan. Environ. Sci. Pollut. Res. 2022, 29, 10771–10781. [CrossRef]
- Huang, L.L.; Lin, J.D.; Huang, W.H.; Kuo, C.H.; Chiou, Y.S.; Huang, M.Y. Developing pavement maintenance strategies and implementing management systems. Infrastructures 2024, 9, 101. [CrossRef]
- Sayers, M.W.; Karamihas, S.M. The Little Book of Profiling: Basic Information about Measuring and Interpreting Road Profiles; University of Michigan Transportation Research Institute: Ann Arbor, MI, USA, 1998.
- Sayers, M.W.; Gillespie, T.D.; Queiroz, C.A.V. The International Road Roughness Experiment: Establishing Correlation and a Calibration Standard for Measurements; World Bank Technical Paper No. 45; World Bank: Washington, DC, USA, 1986.
- ASTM E1926-08. Standard Practice for Computing International Roughness Index of Roads from Longitudinal Profile Measurements; ASTM International: West Conshohocken, PA, USA, 2015.
- ASTM D6433-20. Standard Practice for Roads and Parking Lots Pavement Condition Index Surveys; ASTM International: West Conshohocken, PA, USA, 2020.
- Shahin, M.Y. Pavement Management for Airports, Roads, and Parking Lots, 2nd ed.; Springer: New York, NY, USA, 2005.
- Arianto, T.; Suprapto, M.; Syafi’i. Pavement condition assessment using IRI from Roadroid and surface distress index method on national road in Sumenep Regency. IOP Conf. Ser. Mater. Sci. Eng. 2018, 333, 012091. [CrossRef]
- Tho’atin, U.; Setiawan, A.; Suprapto, M. The use of international roughness index (IRI), surface distress index (SDI) and pavement condition index (PCI) methods for road condition assessment in Wonogiri Regency. Matriks Tek. Sipil 2016, 4, 882–889.
- Munggarani, N.A.; Wibowo, A. Study of the factors causing early damage to flexible pavements and their influence on handling costs. J. Tek. Sipil ITB 2017.
- Adeli, S.; Najafi Moghaddam Gilani, V.; Kashani Novin, M.; Motesharei, E.; Salehfard, R. Development of a relationship between pavement condition index and international roughness index in rural road network. Adv. Civ. Eng. 2021, 2021, 6635820. [CrossRef]
- Zahran, E.M.M. Enhancing pavement sustainability: prediction of the pavement condition index in arid urban climates using the international roughness index. Sustainability 2024, 16, 3158. [CrossRef]
- Imam, R.; Murad, Y.; Asi, I.; Shatnawi, A. Predicting pavement condition index from international roughness index using gene expression programming. Innov. Infrastruct. Solut. 2021, 6, 84. [CrossRef]
- Múčka, P. International roughness index specifications around the world. Road Mater. Pavement Des. 2017, 18, 929–965. [CrossRef]
- Kaloop, M.R.; El-Badawy, S.M.; Hu, J.W.; Abd El-Hakim, R.T. International roughness index prediction for flexible pavements using novel machine learning techniques. Eng. Appl. Artif. Intell. 2023, 122, 106007. [CrossRef]
- Tamagusko, T.; Ferreira, A. Machine learning for prediction of the international roughness index on flexible pavements: a review, challenges, and future directions. Infrastructures 2023, 8, 170. [CrossRef]
- Alnaqbi, A.; Zeiada, W.; Al-Khateeb, G.G. Machine learning modeling of pavement performance and IRI prediction in flexible pavement. Innov. Infrastruct. Solut. 2024, 9, 385. [CrossRef]
- Al-Samahi, S.; Zeiada, W.; Al-Khateeb, G.G.; Hamad, K.; Alnaqbi, A. A comparative study of pavement roughness prediction models under different climatic conditions. Infrastructures 2024, 9, 167. [CrossRef]
- Tamagusko, T.; Gomes Correia, M.; Ferreira, A. Machine learning applications in road pavement management: a review, challenges and future directions. Infrastructures 2024, 9, 213. [CrossRef]
- Suliman, A.M.; Awed, A.M.; Abd El-Hakim, R.T.; El-Badawy, S.M. International roughness index prediction for jointed plain concrete pavements using regression and machine learning techniques. Transp. Res. Rec. 2024, 2678, 86–104. [CrossRef]
- Balai Pelaksanaan Jalan Nasional Maluku. Road Roughness (IRI) Survey Report of Maluku Province, Fiscal Year 2021; BPJN Maluku: Ambon, Indonesia, 2021.
- Balai Pelaksanaan Jalan Nasional Maluku. Road Condition (PCI) Survey Report of Maluku Province, Fiscal Year 2021; BPJN Maluku: Ambon, Indonesia, 2021.
Figure 1.
Map of the study locations on national road sections on Ambon Island.
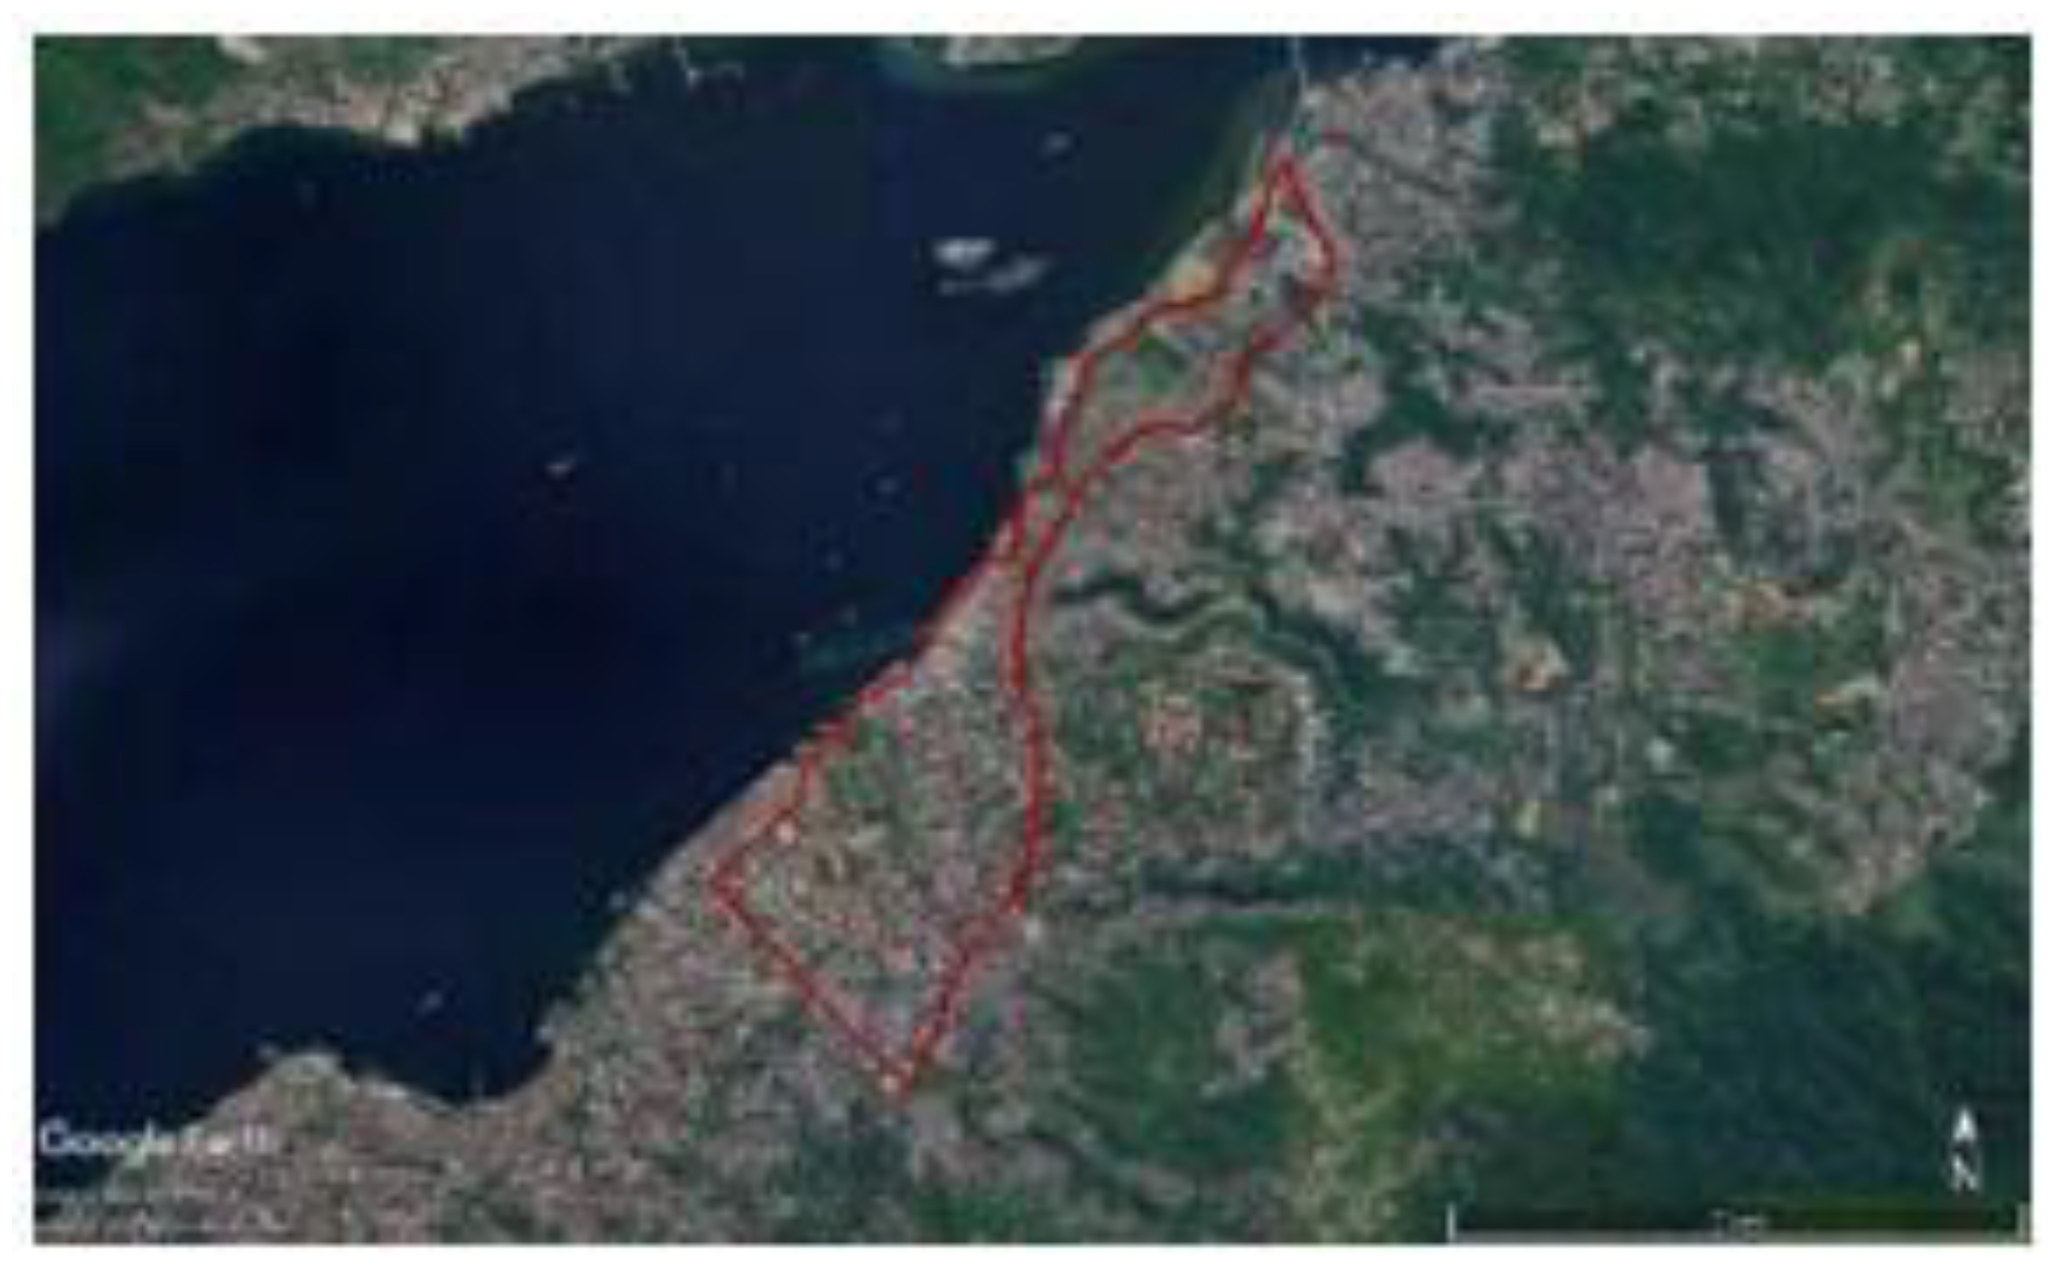
Figure 2.
Road roughness survey equipment based on the Irimeter-2 system.
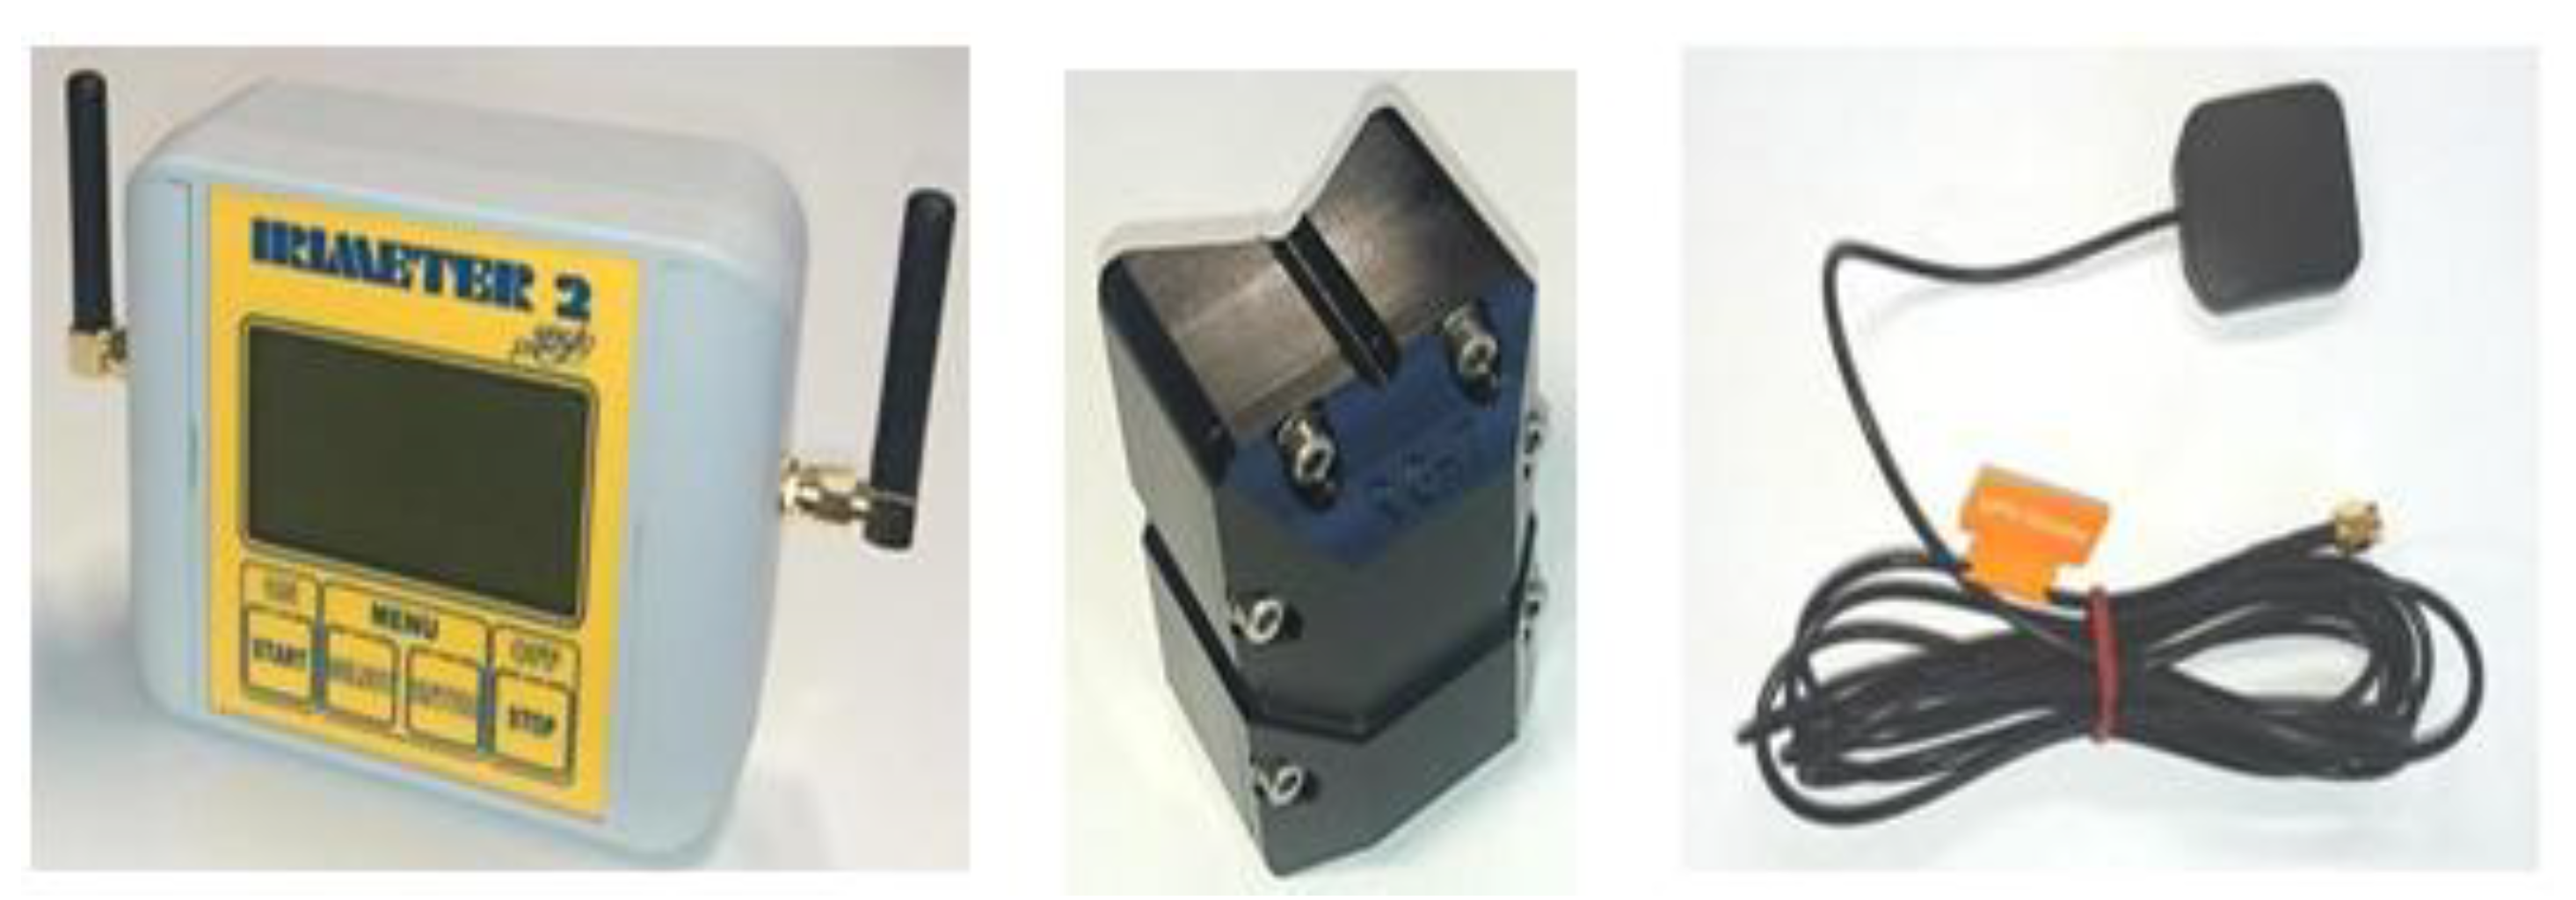
Figure 3.
Example of video-imaging output from the road condition survey.
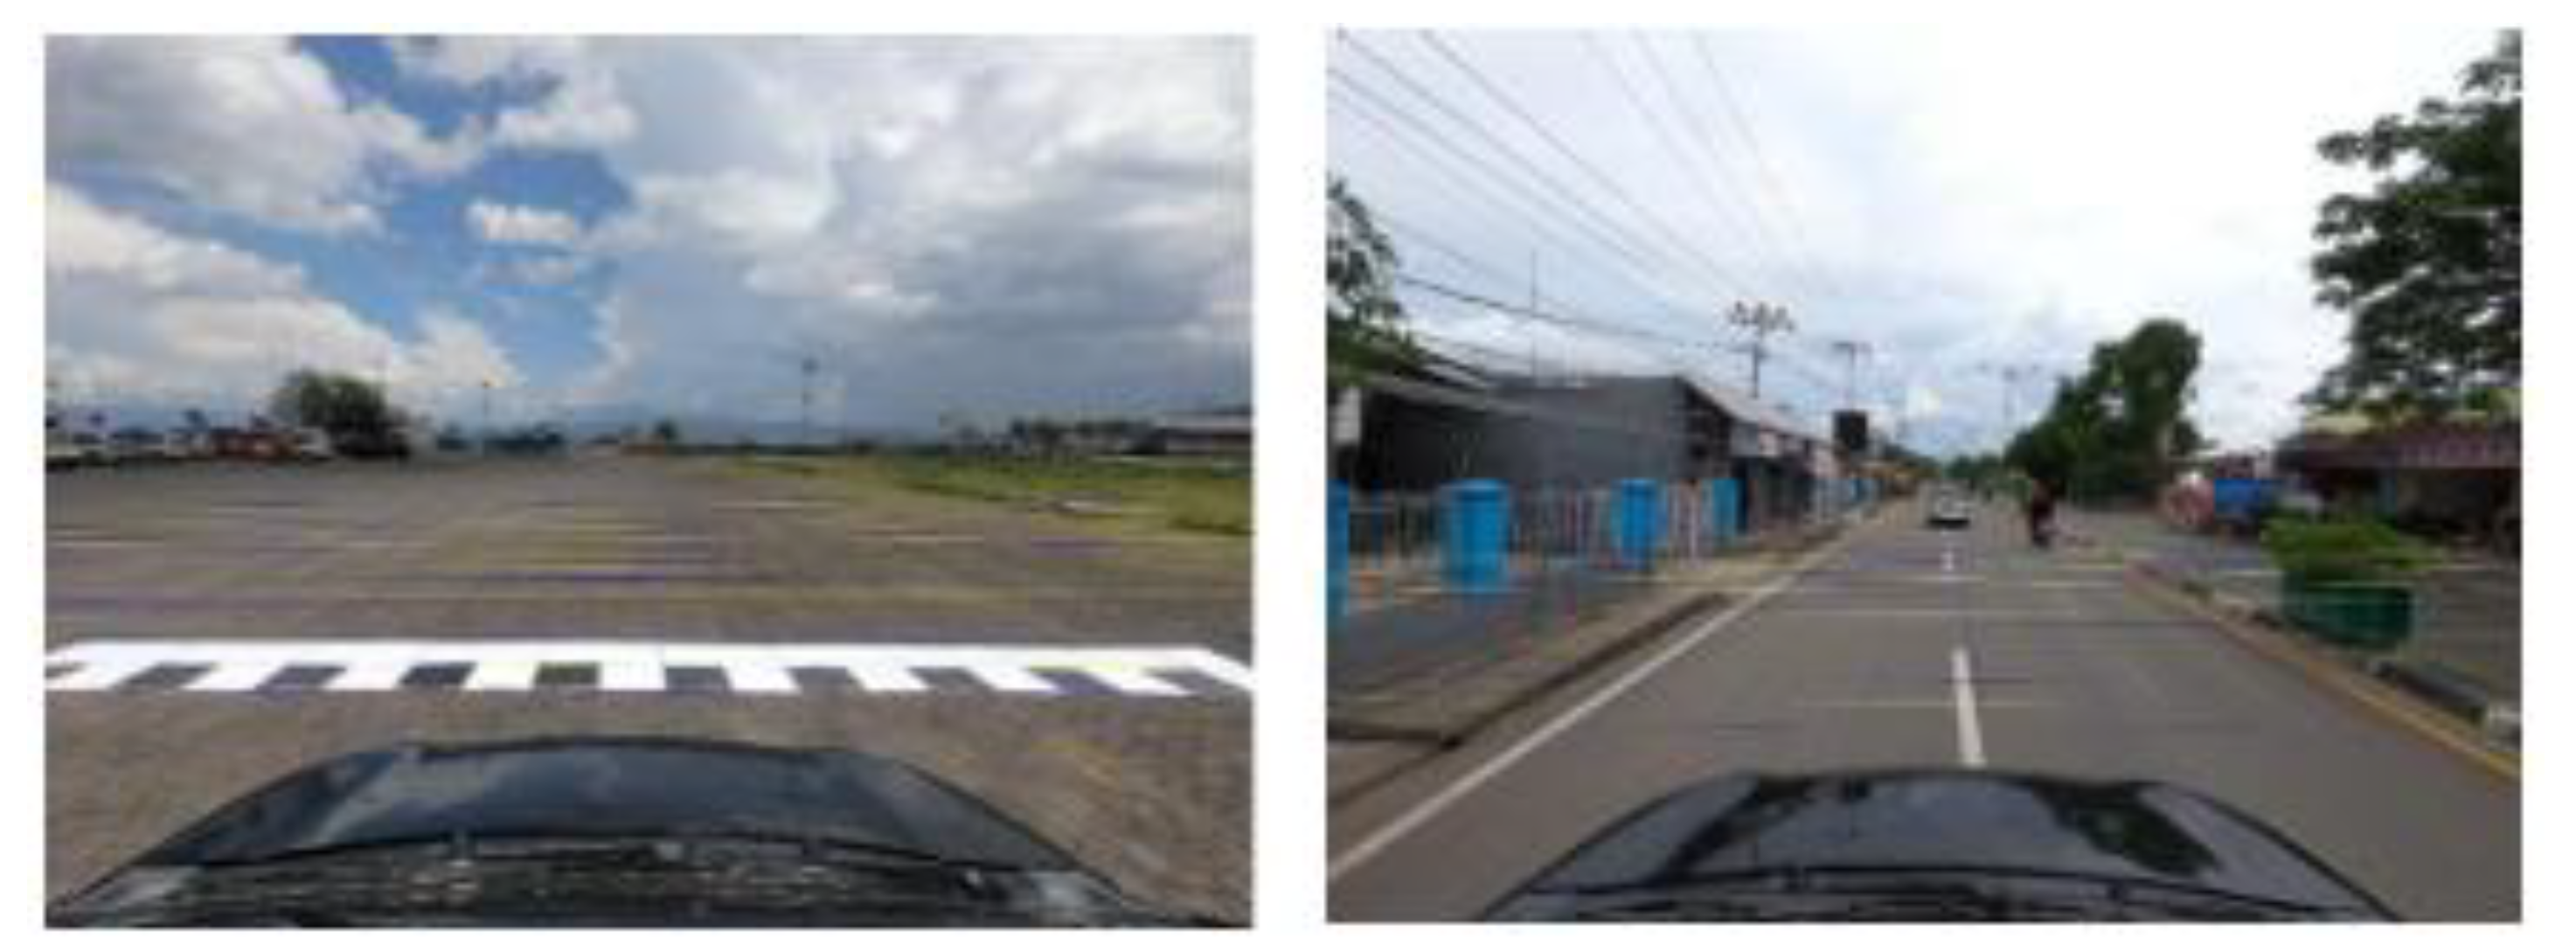
Figure 4.
Fitted simple linear regression relationship between IRI and PCI.
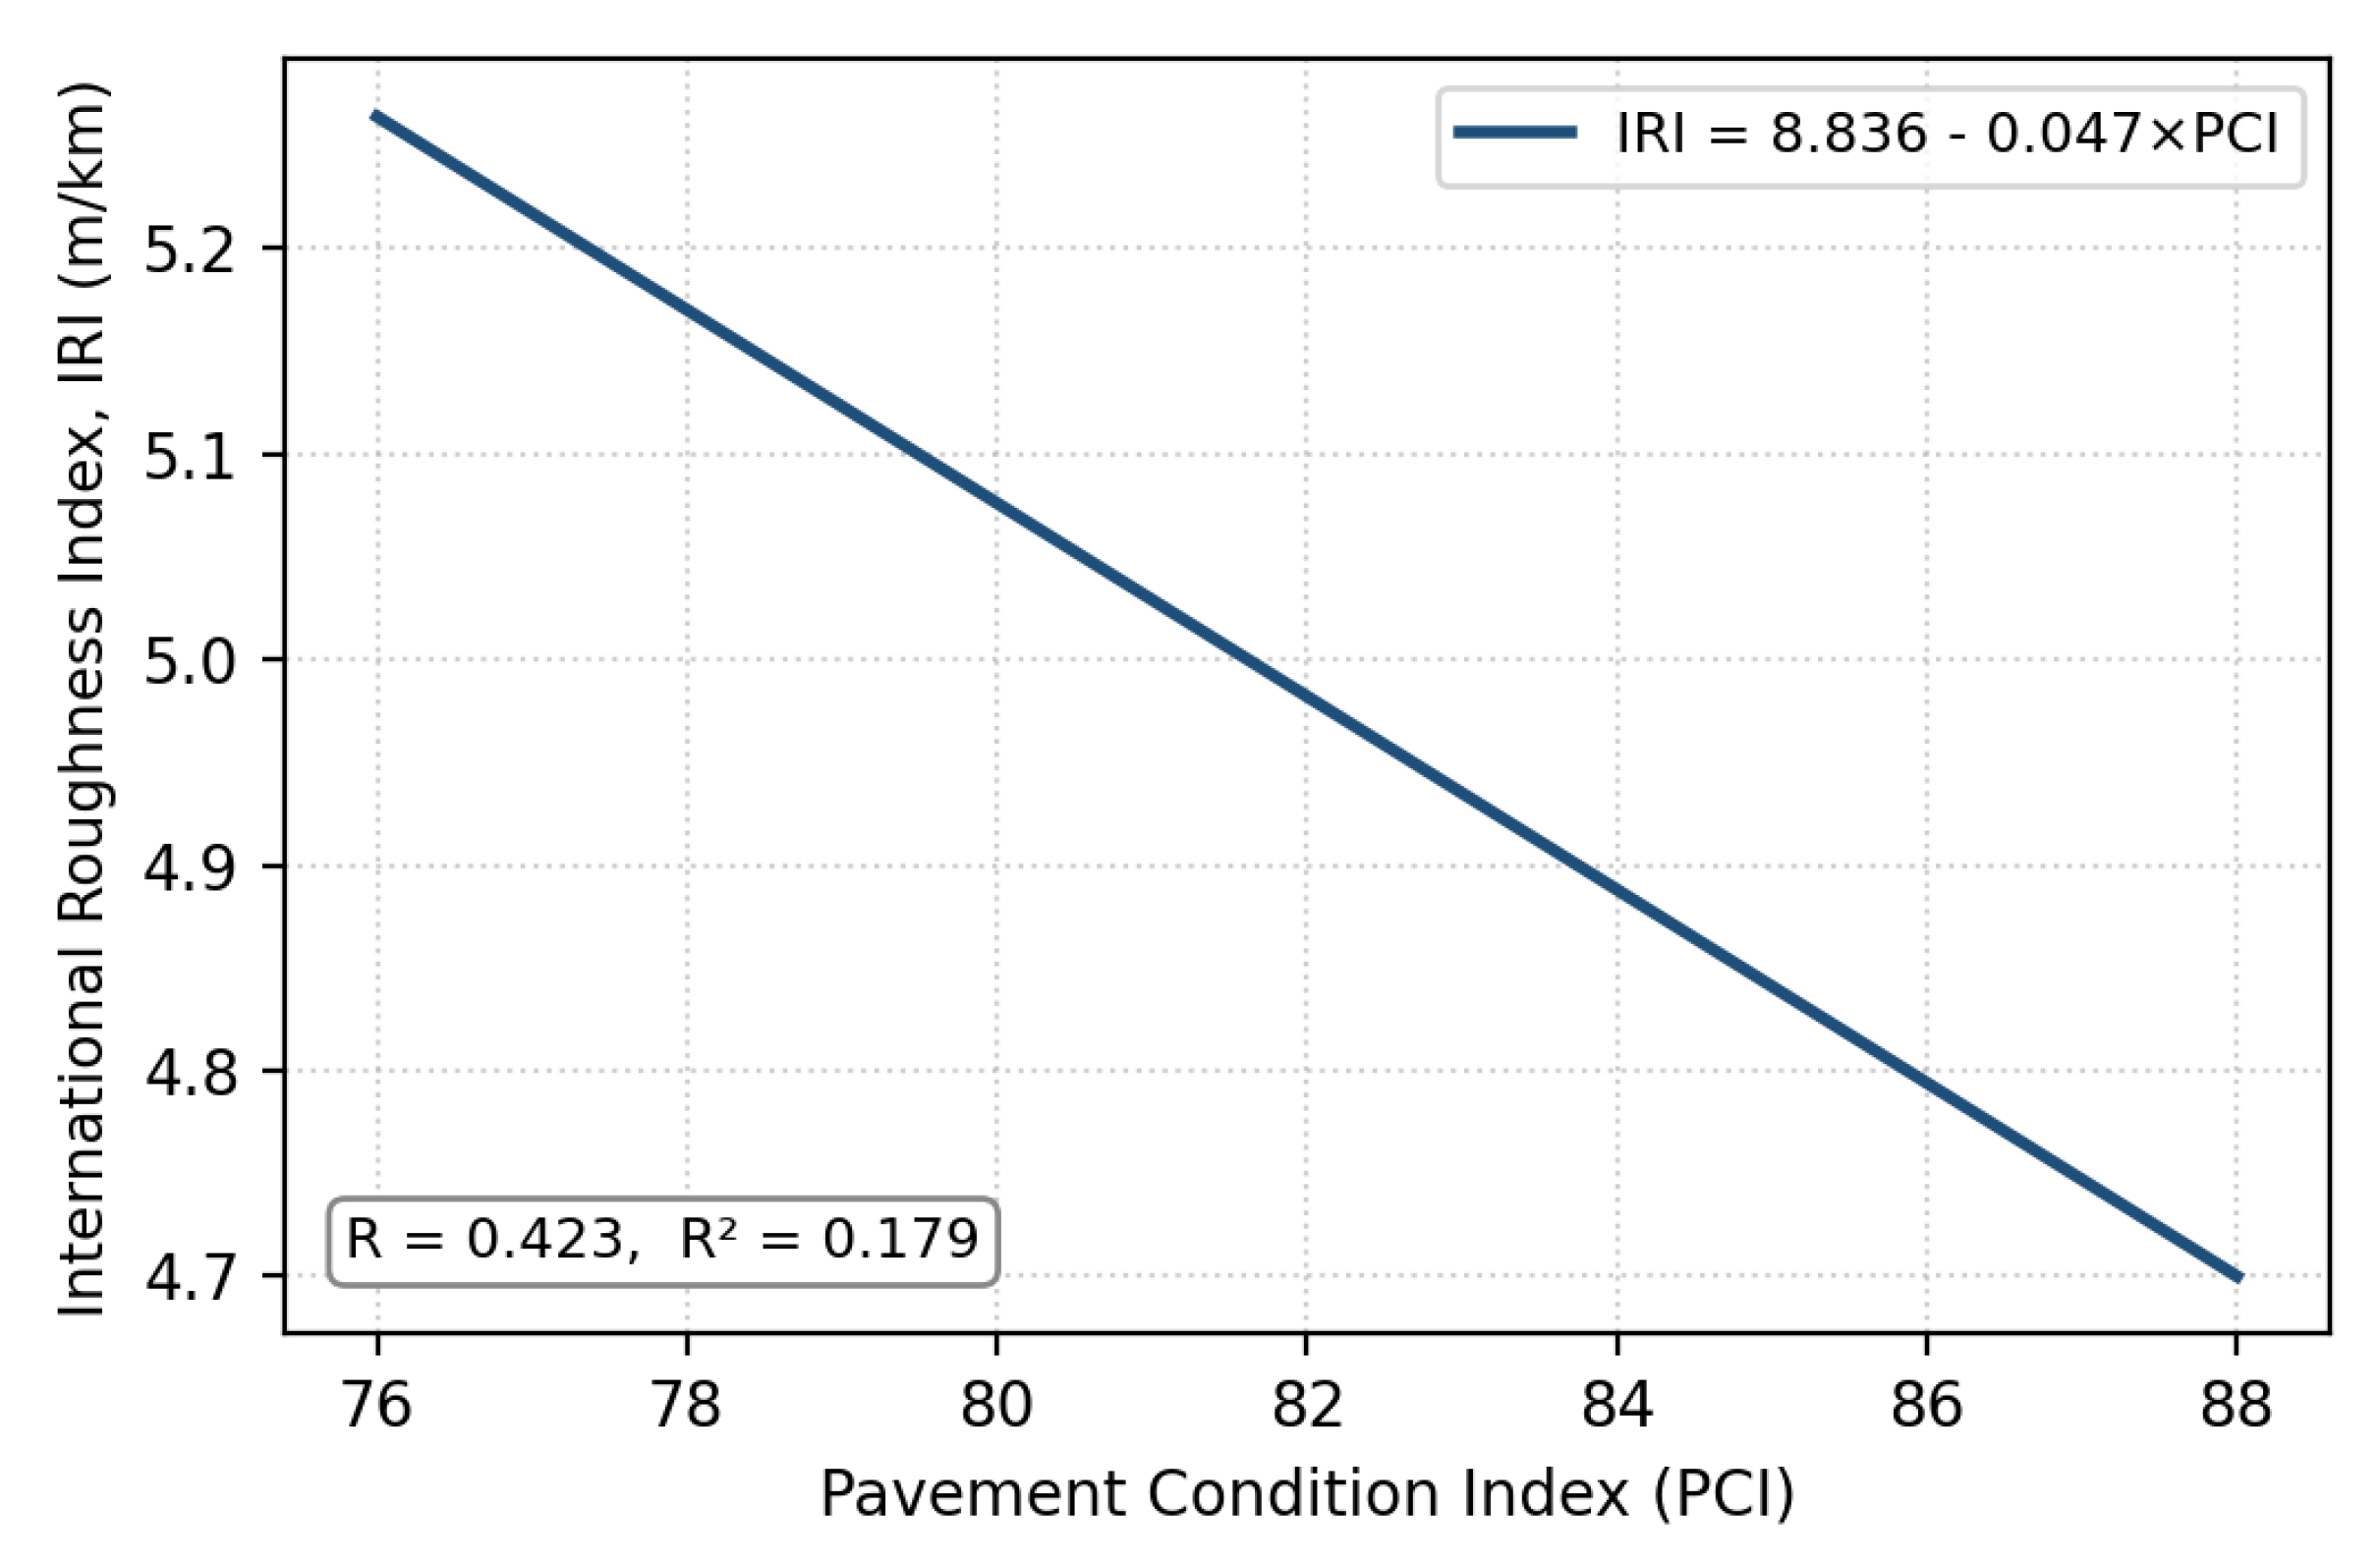
Figure 5.
Normal P–P plot of the standardized regression residuals (dependent variable: IRI).
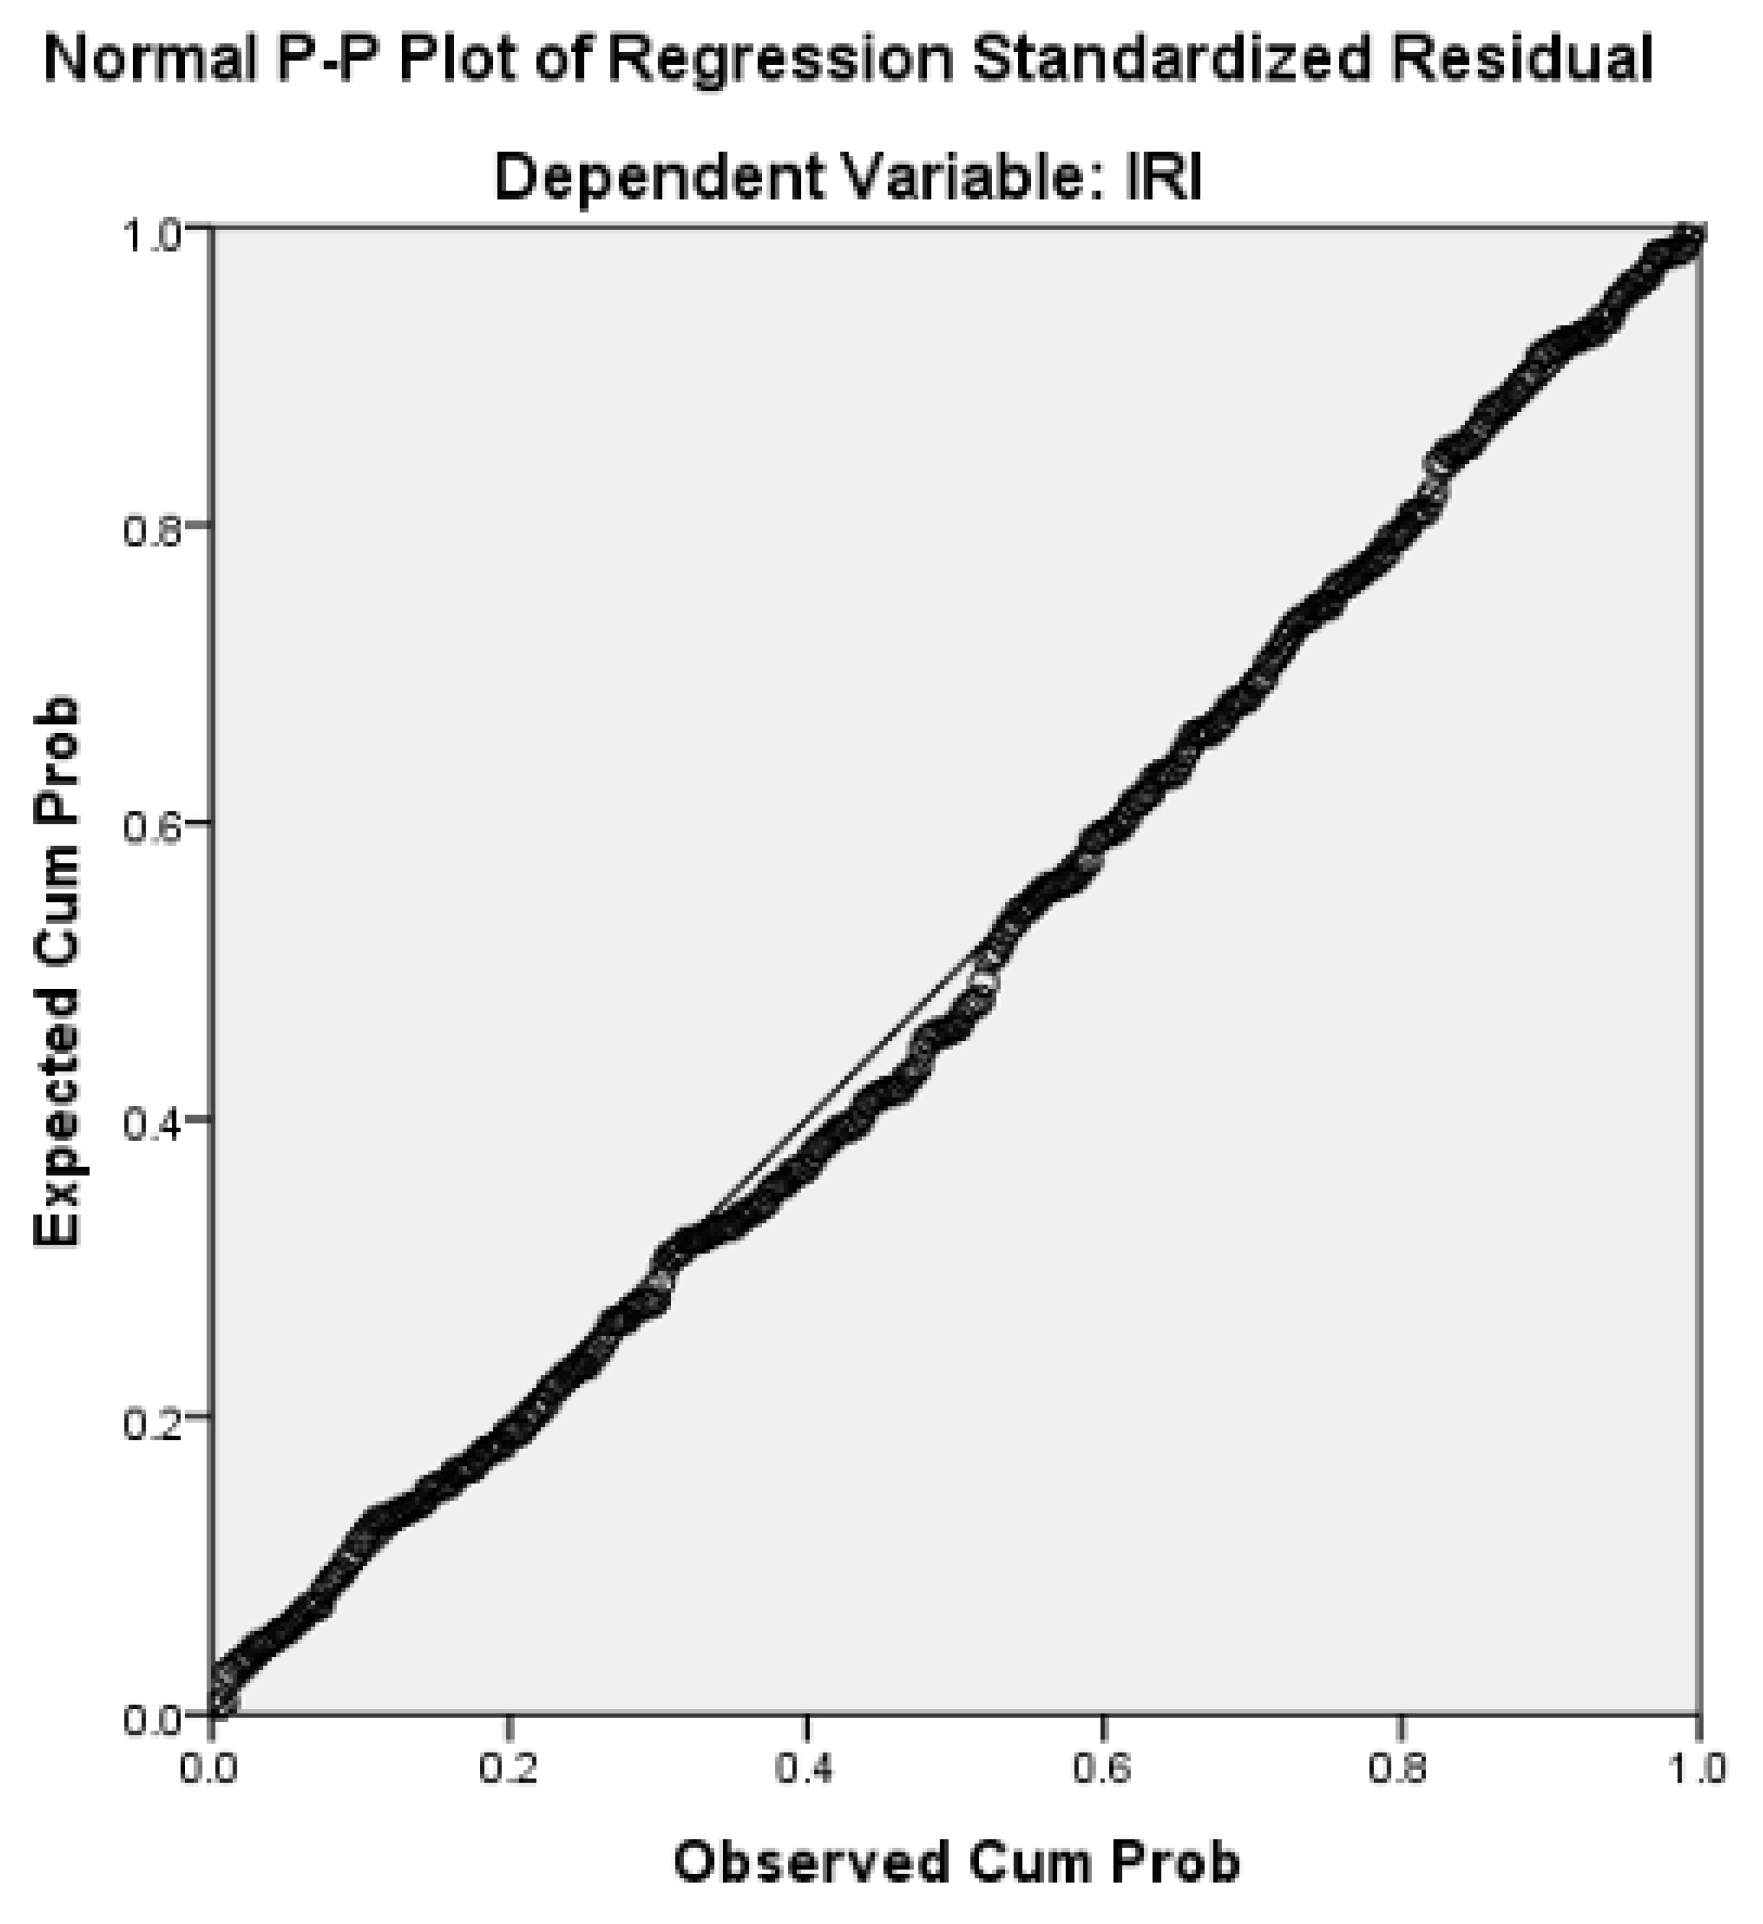

Table 1.
Representative segment-level IRI survey output for road link 600011A.
| Link ID | From Sta. | To Sta. | Lane Code | IRI (m/km) |
|---|---|---|---|---|
| 600011A | 0 | 10 | L1 | 3.79 |
| 600011A | 10 | 20 | L1 | 4.47 |
| 600011A | 20 | 30 | L1 | 4.30 |
| 600011A | 30 | 40 | L1 | 3.67 |
| 600011A | 40 | 50 | L1 | 3.75 |
Table 2.
Summary of PCI survey results for national road sections on Ambon Island.
| No. | Section No. | Road Name | Length (km) | Average PCI | Classification |
|---|---|---|---|---|---|
| 1 | 001.11.K | Pelabuhan Road | 0.23 | 81.34 | Satisfactory |
| 2 | 001.12.K | Yos Sudarso Road | 0.47 | 86.39 | Good |
| 3 | 001.13.K | Pala Road | 0.04 | 83.44 | Satisfactory |
| 4 | 001.14.K | Pantai Mardika Road | 0.81 | 77.97 | Satisfactory |
| 5 | 001.15.K | Pantai Batu Merah Road | 0.50 | 84.02 | Satisfactory |
| 6 | 001.16.K | Sultan Hasanuddin Road | 2.36 | 78.53 | Satisfactory |
| 7 | 001.17.K | Jend. Sudirman Road | 2.80 | 80.64 | Satisfactory |
| 8 | 001.18.K | Rijali Road | 1.32 | 86.40 | Good |
| 9 | 001.19.K | A. Yani Road | 0.54 | 85.05 | Satisfactory |
| 10 | 001.1A.K | Diponegoro Road | 0.61 | 85.99 | Satisfactory |
| 11 | 001.1B.K | A.M. Sangaji Road | 0.27 | 79.96 | Satisfactory |
Table 3.
Variables entered/removed.
| Model | Variables Entered | Variables Removed | Method |
|---|---|---|---|
| 1 | PCIᵇ | — | Enter |
a Dependent variable: IRI. b All requested variables entered.
Table 4.
Model summary.
| Model | R | R Square | Adjusted R Square | Std. Error of the Estimate |
|---|---|---|---|---|
| 1 | 0.423ᵃ | 0.179 | 0.176 | 1.04776 |
a Predictors: (Constant), PCI.
Table 5.
Analysis of variance (ANOVA).
| Model | Sum of Squares | df | Mean Square | F | Sig. |
|---|---|---|---|---|---|
| Regression | 80.816 | 1 | 80.816 | 73.616 | 0.000ᵇ |
| Residual | 317.058 | 338 | 1.098 | ||
| Total | 397.874 | 339 |
a Dependent variable: IRI. b Predictors: (Constant), PCI.
Table 6.
Regression coefficients.
| Model | B | Std. Error | Beta | t | Sig. |
|---|---|---|---|---|---|
| (Constant) | 8.836 | 0.453 | 19.493 | 0.000 | |
| PCI | −0.047 | 0.006 | −0.432 | −8.850 | 0.000 |
a Dependent variable: IRI.
Disclaimer/Publisher’s Note: The statements, opinions and data contained in all publications are solely those of the individual author(s) and contributor(s) and not of MDPI and/or the editor(s). MDPI and/or the editor(s) disclaim responsibility for any injury to people or property resulting from any ideas, methods, instructions or products referred to in the content. |
© 2026 by the authors. Licensee MDPI, Basel, Switzerland. This article is an open access article distributed under the terms and conditions of the Creative Commons Attribution (CC BY) license.
Copyright: This open access article is published under a Creative Commons CC BY 4.0 license, which permit the free download, distribution, and reuse, provided that the author and preprint are cited in any reuse.


