

Submitted:
15 July 2026
Posted:
16 July 2026
You are already at the latest version
Abstract
This study evaluated the effect of an integrated irrigation practice (IP), including reg-ulated deficit irrigation (RDI), managed through an IoT-based platform, on a pear or-chard (Pyrus communis L., cv. ‘Krystali’) compared to the farmer’s standard practice (FP). Tree response was evaluated through the measurement of tree water relations, leaf physiological functions, biochemical parameters, fruit growth and quality, pro-duction, and aerial multispectral NDVI imaging. IP achieved 15.8% water savings, sig-nificantly enhancing water-use efficiency and increasing yield per tree. However, IP trees exhibited higher crop water stress index - CWSI values and lower midday stem water potential -Ψstem than FP, particularly by late July, indicating progressive water stress. Leaf-level responses revealed morphological and biochemical alterations to drought, including increased leaf mass per area (LMA), dry matter content (DM), and accumulation of proline, alongside declines in chlorophyll pigments. Despite these stress indicators, gas exchange parameters were maintained in IP, possibly due to fruit load modulating source–sink relationships and surpassing stomatal limitations. IP re-duced vegetative growth, as evidenced by lower winter pruning material mass, but this did not result in improved fruit quality. IP produced smaller fruit with lower an-tioxidant activity, polyphenolic content and soluble solids content/acidity ratio, alt-hough fruit firmness was improved. NDVI did not detect differences between the treatments on vegetative growth, or on canopy greenness, suggesting that IP trees maintained adequate photosynthetic capacity or that water stress was moderate for NDVI detection. The study highlights the need for integrating irrigation management with fruit thinning and careful scheduling to optimize both water productivity and marketable fruit quality in water-scarce pear production systems.
Keywords:
Pyrus communis L.
; smart farming
; water saving
; crop water stress index
; gas exchange parameters
; fruit quality
; NDVI
1. Introduction
In 2024, Greece produced 73,600 tons of pears across 4,040 hectares, ranking as the 28th largest pear producer worldwide [1]. The primary pear-producing region in Greece is in Central Greece, specifically in the Tyrnavos area. There, modern commercial pear orchards are characterized by high-density planting systems, the use of marketable cultivars intended either for fresh consumption or for processing, dwarfing rootstocks, and intensive management practices that include the application of drip irrigation. The main drawbacks of pear cultivation in the area are the low productivity of pear orchards due to adverse weather conditions during blooming, the application of gibberellins that reduce flower differentiation, nitrogen over-fertilization, over-irrigation promoting vegetation vigor and decrease of fruit quality, and tree losses due to bacteria Erwinia amylovora. These issues highlight the need for smart-farming practices to ensure both the long-term viability of pear cultivation and stable incomes for producers.
In recent years, the climate crisis has emerged as a significant constraint on cultivation productivity across the Mediterranean. Phenomena such as water scarcity, extreme weather events, uneven rainfall distribution, and rising temperatures have become increasingly prevalent [2]. In semi-arid and arid regions with large-scale commercial fruit production, water availability is further constrained by intensifying competition from alternative users, evolving government policies, and the direct impacts of climate change [3]. These compounding pressures necessitate the adoption of more efficient water management practices by growers [4]. Among the available strategies, optimal irrigation scheduling, enabled by smart irrigation technologies that integrate real-time climatic data, soil properties, and crop response monitoring, represents a key management practice for maximizing orchard water use efficiency.
Effective irrigation management plays a critical role in the overall performance of pear orchards, influencing key parameters such as yield, tree vigor, fruit quality, and long-term productivity [5]. In Central Greece, where pear cultivation is extensive, the hot and dry summers elevate evapotranspiration rates and crop water requirements, making supplementary irrigation indispensable for meeting the trees’ water needs. Integrated irrigation is an important water-saving technique that has been developed to control vegetative growth in high-density orchards, thereby optimizing productivity and enhancing fruit quality [6]. Regulated Deficit Irrigation (RDI) is typically applied during the period of slow fruit growth, when shoot growth is most rapid; this timing is beneficial as it restrains excessive vegetative growth, minimizes nutrient loss through leaching, and conserves irrigation water [7]. However, the successful application of this technique requires accurate knowledge of deciduous fruit trees response to water stress, which is largely determined by their phenological growth stages. These stages define the periods when trees are least sensitive to water deficits, allowing growers to identify the optimal timing for deficit irrigation application [8]. It has been demonstrated that mild water stress applied during the slow fruit growth period effectively controls excessive vegetative growth in European pear while maintaining or even increasing yields [9]. Meanwhile, existing guidelines have outlined estimated water requirements for tree survival using the FAO56 approach [10]; however, this methodology requires validation under Greek conditions.
Greek agriculture is characterized by the intensive exploitation of natural resources, including the rising demand for water [11]. Novel technologies, such as Internet of Things (IoT) and Remote Sensing, can improve natural resource management through data analysis methods that collect and analyze enormous data aiming to provide decision-making support to farmers [12,13]. The adoption of innovative approaches, such as Smart Farming, can enhance crop productivity while reducing inputs, positively influencing agricultural efficiency and sustainability [14].
Remotely sensed imagery has become a valuable tool for assessing various crop characteristics and evaluating the performance of alternative agronomic practices. It has been widely implemented in both arable crops and orchards at a range of spatial scales. For instance, Van Beek et al. [15] correlated remote sensing data with midday stem water potential measurements and found high correlations between canopy reflectance at various wavelengths and stem water potential demonstrating the potential of satellite imagery to monitor water stress in pear orchards. However, Perry et al. [16] claim that satellite imagery with a resolution even up to 2.5 m is insufficient to effectively separate tree canopy signals from those of the orchard floor vegetation. Therefore, they suggest the deployment of unmanned aerial vehicles (UAVs) equipped with multispectral sensors, which can provide images with a high resolution of just a few centimeters. In their study, they established correlations between the Canopy Chlorophyll Concentration Index (CCCI) and leaf nitrogen content. Bagheri [17] used also a multispectral sensor onboard a UAV to detect stress in pear trees caused by fire blight disease. He found that disease symptoms were captured by numerous vegetation indices, and this information was valuable for early detection of infected pear trees. Thus, UAV technology is a useful tool for monitoring pear trees throughout their productive cycle.
The present study aimed to evaluate an integrated irrigation protocol based on a smart farming decision-support system in a pear orchard of cv. ‘Krystali’ (synonym: cv. ‘Spadona’/Italian and cv. ‘Blanquilla’/Spanish) in order to save water, manage tree vigor and enable growers to dynamically adopt suitable irrigation strategies under shifting Mediterranean climate conditions. For this purpose, pear trees were subjected to two different irrigation treatments: Farmer’s practice (FP) and Integrated Irrigation Practice (IP). The response of pear trees on these irrigation strategies was evaluated based on tree water relations, canopy temperature, leaf physiological functions and biochemical parameters, fruit growth, fruit quality characteristics, tree yield, and aerial multispectral images.
2. Materials and Methods
2.1. Study Area - Irrigation Scheduling
The research was conducted in a commercial pear orchard of cv. ‘Krystali’, at Tyrnavos, a prefecture of Larissa, Central Greece, during the cultivation period of 2021. The studied orchard was 0.70 ha, the tree spacing was 3 m x 3.8 m. The trees were 10 years old, grafted onto EMA rootstock, trained to palmette, and were cultivated according to the local horticultural practices. The soil type was loam (sand: 46.9, silt: 34.0, clay: 19.1) based on soil texture analysis. The farmer’s fertilization program included application of N, P2O5, K2O at the end of January, applications of foliar fertilizers (B, Zn, organic Ca) and fertigation (N, P2O5, K2O, CaO) from bud swelling until late June. In total, for the macronutrients, the farmer applied (in kg ha-1) 83.5 N, 38 P2O5, 103.9 K2O, 8.5 Ca. The irrigation method was drip irrigation (one drip irrigation line), the distance between drippers was 0.4 m and the water supply was 8 L h-1. Full bloom occurred on 20/3/21 and commercial harvest on 11/8/21.
To investigate the effect of an integrated irrigation protocol on pear trees, the two following treatments were carried out:
- Farmer’s traditional irrigation practice (FP).
The FP irrigation was performed empirically by the grower around once per week for 8 hours independently of the phenological stage of the cultivation.
- Integrated irrigation practice (IP).
The IP irrigation was performed using a smart irrigation management tool, the AgroNIT platform, around once every four days.
A corresponding number of hydrometers was used to measure the amount of irrigation water administered in each treatment. Each treatment consisted of 10 tree replications.
Except for the irrigation, the rest of agricultural practices (weed management, crop protection, etc.) were common between the treatments. Each treatment consisted of 10 tree replications.
2.2. The AgroNIT Platform and Irrigation Scheduling
AgroNIT is a Smart-Farming Framework designed to incubate and evaluate innovative, eco-friendly, field-based solutions that aim to transform traditional farming to data-driven farming [18,19]. These solutions may incorporate an array of ad-hoc, cross-industry technologies and applications, such as IoT, Artificial Intelligence, GPS Technology & Remote Sensing, aiming to introduce new techniques to improve the applied cultivation practices. The AgroNIT platform collects, analyzes, and disseminates real-time field data to provide the user with informed decision making on crop management practices, such as the irrigation scheduling [19]. Irrigation is scheduled based on crop evapotranspiration (ETc), rainfall, and soil hydraulic conductivity. In the experimental orchard, an agrometeorological station was installed to measure meteorological data. The net ETc was calculated using a modified Penman-Monteith equation [10,19,20], while the non-measurable model parameters, which fluctuated according to crop attributes (i.e., developmental stage), were calculated by [10] and [20] guidelines. The optimal irrigation volume, duration, and interval were determined based on the AgroNIT model. Based on soil sampling taken from the experimental field, the soil water potential values (cbars) were converted to % moisture by volume using the Soil Water Characteristic Curves. The particular Soil Water characteristic curve describes the average values of pressure and humidity for the sampling depths. Based on the characteristic curve of the soil, the value of 20 cbar corresponded to the water capacity (about 39.7% by volume) and the average value of soil moisture at the permanent wilting point was 21.7% by volume. The irrigation duration was calculated based on the water flow rate of the irrigation system. In this study, to maximize water saving, the FAO 66 Kc was modified (RDI) during the period of the initial slow growth phase of pear fruit development together with shoot growth (middle May – middle June) (Table 1) [9], reducing the amount of water applied but maintaining the irrigation frequency [4].
2.3. UAV Remote Sensing
Aerial multispectral images of the pear orchard were obtained with a Parrot Sequoia multispectral sensor on board a Parrot Bluegrass UAV. The Pix4DCapture app was used to schedule parallel flight paths. The missions were performed at a 60 m above ground level with an 80% forward, and a 70% side image overlap. Three surveys were contacted on 17/4/21, 25/5/21 and 16/6/21 corresponding to three key stages of the experiment: before summer pruning, immediately after summer pruning and the initiation of the RDI, and at the completion of the RDI period. The flights were performed between 12:00 and 15:00 under clear sky conditions. Eight ground control points (GCPs) were established in the field for assisting georeference during image postprocessing.
The Parrot Sequoia consists of four narrow band visible and infrared sensors, a green sensor capturing the wavelength of 550±40 nm, a red sensor sensitive at 660±40 nm, a red-edge sensor at 735±10 nm, and near-infrared sensor at 790±40 nm. The instrument also contains a sunshine sensor measuring simultaneously the sunshine radiation at the respective wavelengths, enabling the estimation of ground reflectance. The calibration panel provided by Parrot was also used to assist on image calibration. Sequoia also has an RGB sensor capturing common RGB images. 60 m height provided a ground resolution for the monochrome images of 7.4 cm and for the RGB images of 1.6 cm.
The Pix4DMapper (https://pix4d.com, accessed 12/10/22) software was used for post-processing the images and building monochrome orthomosaics for each field and each survey date. The orthomosaics were stacked in a virtual four-layer raster (one layer for each band) using the open-source Quantum GIS software (www.qgis.org, accessed 12/10/22) and then were georeferenced by utilizing the GCPs. The first date was used as a base to georeference all the consequent images.
Three common vegetation indices derived from the four bands of the Sequoia sensor were calculated from the above data, the Normalized Difference Vegetation Index (NDVI), the Green Normalized Difference Vegetation Index (GNDVI) and the Normalized Difference Red-Edge (NDRE) index [21]. Results for NDVI are presented in the present study, as the index was capable to depict clearer the tree canopy. The NDVI is calculated from the formula:
where R790 is the reflectance in the near infrared band and R660 the reflectance in the red band.
NDVI = (R790-R660)/(R790+R660)
The normalized index provides non-dimensional values at the range of -1 to 1 while green vegetation is usually observed at values above 0.3. Its value depends both on canopy growth and vigor associated with leaf area index and leaf chlorophyll content [22]. However, the canopy volume was altered artificially due to summer pruning performed in the middle of May. To exclude the impacts of the manual interference, a narrow strip of about 1 m wide was drawn on the center of the tree canopies of the experimental rows (Figure 6). These strips were also clear from floor vegetation because weeds were previously destroyed by using a combination of mechanical and chemical weed management. The strips were further divided into 3-5 m intervals to create plots from which the average NDVI values were extracted using the v.rast.stats GRASS package tool of the Quantum GIS suite. These average values were subjected in a Student’s t-test analysis at P=0.05 using the JASP 0.16 (https://jasp-stats.org, accessed 12/10/22) open-source statistical package.
2.4. Field and Laboratory Measurements
Field measurements were conducted on 14/6/21, two days after the irrigation event, and on 28/7/21, two days after the irrigation event. Midday stem water potential (Ψstem) was measured on 12 leaves per treatment from 12:00 to 14:00 with a pressure chamber (model SKPM 1400, Skye Instruments Ltd., Isle of Skye, Scotland). Canopy temperature (Tc) was measured using a FLIR TG167 thermal camera (model TG167, Teledyne FLIR LLC, Wilsonville) at 12:00, on four leaves per tree in the middle of the canopy. Crop water stress index (CWSI) was measured according to [23]. CWSI takes values from 0 to 1, i.e. 0 means no water stress and 1 means maximum water stress. Leaf gas exchange parameters were measured in two temporal replications, 10:30-11:30 and 11:30-13:00. Leaf gas exchange was measured on four leaves per tree using a portable photosynthesis unit (model LCpro, ADC Bioscientific Ltd., Herts, England). The system's leaf chamber was operated at a flow rate of 300-350 mL min⁻¹ under ambient environmental conditions and net photosynthetic rate (A, μmol m⁻² s⁻¹), stomatal conductance (gₛ, mol m⁻² s⁻¹) and transpiration rate (E, mmol m⁻² s⁻¹) were recorded.
Leaf characteristics measurements were conducted at six replications of 10 leaves fully exposed to the sun and included specific leaf mass (SLM), concentration of chlorophyll a (Chla), b (Chlb), total (TChl), total polyphenolic content, antioxidant activity, and proline concentration. Leaf disks were removed with a 9-mm diameter corer; their fresh mass was measured immediately, then were dried at 80 °C and reweighted to receive the dry weight. SLM (mg dry weight per cm2) was then calculated. From the same leaves, leaf disks were removed with a 6-mm diameter corer, were extracted in 95% ethanol and Chla, Chlb and TChl were determined spectrophotometrically (Spectronic 301, Milton Roy Company, Ivyland, PA, USA) at 665 nm and 649 nm according to [24] and then were calculated at g per m2 leaf surface. The measurement of leaf proline concentration was performed by the method of acid ninhydrin [25]. Proline leaf concentration is expressed in mg proline per g of fresh weight of leaves. Total phenolic content and antioxidant activity in leaves were determined with the same method used for fruit analysis (as described below).
At commercial harvest, fruit quality was evaluated at six replications of 10 fruit per treatment. Quality evaluation included fruit mass, peel color, flesh firmness (FF), soluble solids content (SSC), titratable acidity (TA), the ratio SSC/TA and fruit % dry matter (DM) as previously reported by Maletsika et al. [26].
To determine fruit total polyphenolic content and antioxidant activity, four replications of 10-fruit each were used. Ten slices of the 10 fruits were homogenized and a sample of 5 g pulp plus peel was extracted with 25 mL methanol. The extract was centrifuged at 4000g for 10 min and the supernatant was analyzed for total phenolic content and antioxidant activity. Total polyphenolic content of the pear fruit was measured to the methanolic solution at 760 nm with a spectrophotometer (Milton Roy Spectronic 301, Ivyland, USA) using the Folin-Ciocalteu reagent and expressed as mg of equivalent gallic acid per g fresh weight based on calibration curve using gallic acid [27]. The total antioxidant activity of the pear fruit was assessed with the DPPH (2,2-diphenyl-1-picrylhydrazyl radical scavenging activity) [28] and the FRAP (Ferric ion Reducing Antioxidant Power) [29] assays, and the results were expressed as mg of equivalent ascorbic acid per g fresh weight.
Fruit diameter was measured on two representative, well-exposed fruits per tree, (totaling 20 fruits per treatment), at 29, 50, 80, and 112 days, respectively, after full bloom (DAFB).
During winter pruning, pruning material from four trees per treatment was collected, separated into one-year-old and multi-year-old shoots, and then weighed.
Field and laboratory results were analyzed using SPSS statistical package (SPSS Statistics for Windows, Version 31.0, IBM Corporation, Armonk, NY, USA) using two factors: irrigation practice, and time. Differences between treatments and time were analyzed using Tukey post hoc test for p ≤ 0.05 level of significance.
3. Results
3.1. Applied Irrigation
The amount of irrigation water applied by the grower was higher than the calculated crop water needs. In total, IP trees received 452.8 mm, while FP trees received 537.7 mm, leading to water savings up to 15.8% (84.9 mm) (Table 2).
In Figure 1 the mean daily temperature (oC) and the daily precipitation (mm) for the experimental farm are presented. The temperature range was at normal level for the season with mean value of 25.7 oC, while the precipitation was in very low level.
3.2. Tree Water Status, CWSI and Canopy Temperature
In both treatments, canopy temperature was higher in late July than in mid-June, with no significant difference between the upper and lower parts of the canopy. Although irrigation regime had no effect on canopy temperature, CWSI values were significantly higher under IP than FP at the upper canopy in mid-June, and at both canopy positions in late July, indicating a greater water stress level in the IP treatment over time (Table 3).
Midday stem water potential was more negative in late July than in mid-June. Furthermore, the IP treatment exhibited lower (more negative) values than the FP treatment during the late-July period (Figure 2).
3.3. Leaf Physiological and Antioxidant Characteristics
Leaf traits and photosynthetic pigments were influenced by both date and irrigation treatment. In the IP treatment, LMA was higher in late July than in mid-June, whereas in the FP treatment, LMA remained similar between the two dates. In both treatments, DM increased, while the concentrations of photosynthetic pigments, Chla, Chlb and TChl, decreased from mid-June to late July. In mid-June, leaf LMA and DM were similar between treatments, however, in late July, leaves from the IP treatment had significantly higher LMA and DM than those from the FP treatment. Regarding photosynthetic pigments, the IP treatment exhibited lower Chla, Chlb and TChl concentrations than the FP treatment on both dates. The Chla/Chlb ratio was not influenced by date or treatment (Table 4).
From mid-June to late July, leaves from both treatments exhibited a significant increase in total polyphenolic content, antioxidant activity (in both assays), and proline content (Table 5). When comparing treatments, the IP leaves showed similar total polyphenolic content, but lower antioxidant activity (in both assays) compared to FP leaves at both sampling dates. However, the proline response was differential, as IP had lower proline than FP in mid-June, whereas it showed higher levels by late July (Table 5).
3.4. Leaf Gas Exchange Parameters
Stomatal conductance gs and E were higher in late July than in mid-June for both treatments, except for the FP treatment at 10:30 that gs remained similar in both dates (Table 6). Net photosynthesis decreased in late July for FP, whereas in IP it remained at similar levels in both dates (Table 6). Treatment comparisons revealed that IP had lower gₛ than FP in mid-June. Regarding E, IP was lower than FP in mid-June at 11:30, but by late July the two treatments had similar E values (Table 6). Similarly, A was lower in IP than FP in mid-June, but by late July the two treatments had similar A values (Table 6).
1 Different letters among values indicate significant differences at p ≤ 0.05 according to the Tukey test (n = 10).
3.5. Fruit Growth
The fruit growth pattern revealed that IP irrigation reduced fruit diameter throughout the season, resulting in a significantly smaller final fruit size at harvest compared to FP (58.3 mm vs. 60.9 mm, respectively; Figure 3). According to commercial grading standards, the extra category requires a minimum diameter of 60 mm, while 55 mm is the threshold for 1st class. Consequently, IP treatment resulted in smaller pears than FP, with potential consequences for marketable yield.
3.6. Fruit Quality Characteristics, Production, and Water Use Efficiency
Irrigation treatment significantly affected several fruit quality parameters. IP reduced fruit mass compared to FP (Figure 4A), while fruit firmness was higher under IP (Figure 4D). Peel color was also influenced, with IP showing a less negative a* value, indicating less green fruit skin (Figure 4C). Dry matter content, however, remained similar between treatments (Figure 4H). Soluble solids content (SSC) and titratable acidity (TA) did not differ between treatments, but the SSC/TA ratio was lower in IP than in FP (Figs. 4E–G). Antioxidant properties were also irrigation-dependent, with IP exhibiting the lowest total polyphenolic content and the lowest antioxidant activity in both DPPH and FRAP assays, while FP showed the highest values (Figs. 4J–L). Despite these quality reductions, IP achieved higher production per tree than in FP (Figure 4I).
Based on crop yield (kg of fruit per ha) and the applied water volume, the WUE found equal to 7.31 kg m-3 in IP and 5.16 kg m-3 in FP.
3.7. Pruning Material Mass
Irrigation treatment had a significant impact on pruning material mass. The lowest pruning material mass per tree was recorded in IP irrigation for both one-year old and multi-year-old shoots (Figure 5).
3.8. Drone and NDVI
Maps of NDVI at different observation dates are presented in Figure 6. The experimental strips are highlighted in color. The strips are divided in plots placed right above the center tree canopy. The first UAV survey was conducted on 17/4/21, when the trees had reached full canopy development and before pruning was carried out (Figure 6a). During this period, NDVI values were high, approaching 0.8 (Figure 7). Pruning was performed in mid-May, and its effect was clearly evident in the second UAV survey conducted on 25/5/21 (Figure 6b and Figure 7). Following pruning, NDVI values declined to below 0.6, reflecting the reduction in canopy density. At approximately the same time, the integrated irrigation management (IP) treatment was initiated. However, no discernible differences in NDVI were observed between the two irrigation treatments (Figure 7). The integrated irrigation management period ended in mid-June, shortly before the final UAV survey on 16/6/21 (Figure 6c). At that time, NDVI values remained relatively low, ranging from 0.5 to 0.6, and no apparent differences in canopy vigor were detected between the irrigation treatments, despite the reduced water application under the IP treatment.
4. Discussion
In this study, the AgroNIT platform was employed to support irrigation scheduling of pear orchard. AgroNIT is an integrated IoT framework designed to support and asses innovative, field-based solutions for enhancing the efficiency and sustainability of agricultural resource management [19]. AgroNIT combines energy-autonomous, mesh wireless sensor networks, cloud computing, and decision-support systems to deliver real-time artificial intelligence-based consultancy to farmers based on distributed field data collection. This is achieved by employing a tree-adapted smart irrigation model that utilizes key climatic, crop and soil parameters measured in-field as inputs. Comparing different irrigation scheduling algorithms, it was proposed that the weather - and plant- based methods exhibit a promising tool for the scientifically-supported irrigation scheduling in terms of applying precise amount of water when needed and has the great advantage of being fully automatically [30].
The present study demonstrated that integrated irrigation (IP) achieved a 15.8% water saving (84.9 mm) compared to the farmer’s standard practice (FP), without severely compromising tree physiological performance. Nevertheless, the higher CWSI values recorded in IP, compared to FP, particularly in late July at both canopy positions, indicate that IP trees experienced greater water stress over time. The CWSI is widely recognized as a reliable indicator of plant water status in fruit trees, including pear and olive [31,32]. Blanco et al. [31] found that CWSI values exceeding 0.45 show water deficit, while values above 0.7 indicate severe water stress in pear cultivation. Applying these thresholds to our data suggests that water stress was already elevated in both treatments by mid-June but remained at high levels till late July only in the IP treatment. Although mid-June was characterized by normal mean air temperatures, the exceptionally low precipitation during this period seemed to exacerbate the water deficit experienced in both treatments. In agreement with Blanco et al. [31], canopy temperature (Tc) alone failed to detect the differential water status between the two treatments, highlighting the greater sensitivity of the CWSI approach.
Midday stem water potential followed a clear temporal pattern, declining from mid-June to late July, which indicates a progressive intensification of water stress under both treatments. In June, despite the reduced water supply, there was no significant treatment effect on Ψstem. By late July, however, the IP treatment exhibited significantly lower Ψstem than the FP treatment. The fact that these differences became more pronounced over time, from mid-June to late July, shows a cumulative stress response. Although the deficit irrigation regime was discontinued in mid-June, the trees possibly continued to experience the persistent effect of the earlier water restriction, which was then amplified by the extreme arid conditions and high evaporative demand characteristic of late July (as shown by low precipitation and elevated air and canopy temperatures), further compounded by the prolonged irrigation intervals standard in regional commercial orchards. This observation aligns with research showing that pear trees are particularly vulnerable to water restrictions during periods of high evaporative demand [33].
The leaf-level responses demonstrated an acclimation strategy by IP trees to cope with reduced water availability. The increase in LMA and DM in IP leaves from mid-June to late July, while FP leaves maintained relatively stable LMA, indicates a morphological adjustment toward more sclerophyllous leaf characteristics. Leaves that develop under drought conditions typically exhibit a higher LMA than those produced with adequate water supply [34,35]. Higher LMA generally results from increased tissue density or thickness, reflecting greater investment in the assimilatory apparatus during extended water deficit [36]. This structural modification, by reducing the transpiring surface at both leaf and whole-plant levels, effectively reduces water requirements under dry conditions [37].
Concurrent declines in Chla, Chlb, and TChl concentrations under both treatments from mid-June to late July, with lower values in IP, indicate drought-induced pigment degradation, a common response to oxidative stress under water limitation [38]. Studies on pear rootstocks have shown that drought stress decreases total chlorophyll content while increasing proline and antioxidant enzyme activities [39,40]. Similarly, drought stress in young, ungrafted pear rootstocks and grafted combinations have been shown to decrease chlorophyll pigments, carotenoids, and ascorbic acid levels [41]. The accumulation of total polyphenolics, antioxidant activity, and proline in leaves from mid-June to late July confirms the activation of osmotic adjustment and antioxidant defense mechanisms under water stress [42]. The differential proline response, which was lower in IP than FP in mid-June but higher by late July, is probably associated with a progressive induction of stress protection pathways as the season advanced, connected with proline’s role as an osmoprotectant and free radical scavenger under prolonged drought. Interestingly, despite similar total polyphenolic content between treatments, IP exhibited lower antioxidant activity in both DPPH and FRAP assays compared to FP, indicating a failure to maintain high antioxidant capacity under water deficit. Under long-term drought stress, the activities of SOD, POD, and CAT in ’Yulu Xiang’ pear leaves were downregulated, indicating that the weakened antioxidant defense system resulted in enhanced oxidative stress under drought stress [43]. Overall, drought stress disturbs the balance between reactive oxygen species production and scavenging, resulting in oxidative stress in plants [44].
Although Ψstem, CWSI and the activation of antioxidant defense system indicate elevated water stress, no severe stomatal limitations were observed in the gas exchange parameters in both treatments, especially in IP. According to Flexas et al. [45] stomatal closure is the earliest response to drought and the dominant limitation to photosynthesis at mild to moderate drought. However, gₛ and E increased from mid-June to late July for both treatments which may be explained by the higher temperatures and vapor pressure deficits typical of late July, which drive evaporative demand. Nevertheless, in mid-June, at the end of the period of deficit irrigation, IP exhibited lower gs, A and E (only at 11:30) compared to FP. Similarly, Blanco et al. [33] reported reductions in gₛ and A for RDI-treated 'd' Anjou' and 'Bartlett' trees. Τhe annihilation of differences in gas exchange parameters between the treatments at late-July may involve other factors, such as the fruit load. The measurement of gas exchange parameters at late July coincides with the pre-harvest period (11/8/21). The fruit presence at the last stage of fruit growth has been found to increase A and gs in Prunus salicina L. [46] and in peach [47]. According to Marsal and Girona [48] during the short period of high reproductive sink strength in peach, A could be maintained by decreased sensitivity of gs to leaf water status. On the other hand, in two Asian pear cultivars Amax responded oppositely to source-sink variations. A higher fruit load enhanced Amax in ‘Hosui’ but it suppressed in ‘Cuiyu’ cultivar [49]. Fruit load may therefore interfere with gas exchange parameters, helping to maintain them even under increased water stress.
Fruit mass and diameter are standard criteria for pear fruit quality classification. However, results indicated that IP negatively affected fruit mass and size compared to FP. Our data is in accordance with Blanco et al. [33] who found a reduction in fruit mass and size measured from RDI trees, especially in high cropping years when fruit size is smaller even in fully irrigated trees. Nevertheless, in our study fruit yield was higher in IP compared to FP. This shows that IP trees had more fruit, or that FP experienced some fruit abscission due to excessive vegetative growth. Besides, the reduced pruning material mass under IP for both one-year-old and multi-year-old shoots indicates that water deficit constrained vegetative growth. Blanco et al. [33] proposed that in years with high crop and low water availability, fruit thinning must be considered as an orchard management technique to increase individual fruit mass. In a mature 'Blanquilla' pear orchard in Lleida, Spain, RDI during early fruit growth stages increased fruit number but reduced size [50]. Similarly, in potted pear trees RDI also led to a smaller fruit size at harvest than in fully irrigated trees [51].
The higher production per tree under IP, combined with reduced water input, resulted in a substantially higher water-use efficiency (0.725 kg fruit/mm) compared to FP (0.516 kg fruit/mm). This finding highlights the potential of deficit irrigation to maximize yield per unit of irrigation water, an important consideration in water-scarce regions [52]. According to Vélez-Sánchez et al. [53] RDI during the stage of rapid pear fruit growth under tropical conditions had no impact on the production (number of fruits per tree and distribution of fruits by size) or most of the quality characteristics at harvest, while contributed to significant water conservation and higher WUE the specific period.
Our study demonstrated that integrated irrigation practice (IP) improved FF, without affecting SSC, TA, and DM, though it decreased SSC/TA ratio. Our results are partially in agreement with previous findings. Venturi et al. [54] found that irrigation with 80% of ETc and 60% of ETc from fruit set to harvest, had no effect on Abbé Fetél pear fruit firmness and soluble solids content, increased fruit dry matter, and only 60% of ETc under SYDO rootstock decreased fruit size compared to 110% of ETc. In contrast, Lopez et al. [55] reported that deficit irrigation increased pear fruit FF, SSC and acidity at harvest, while no changes were observed in fruit maturity. In our study, pear fruit skin color was less green in IP, indicating advanced maturity compared to FP, though SSC was similar between the treatments and flesh firmness was higher in IP. Furthermore, Blanco et al. [33] found that deficit irrigation (RDI - 100 % ETc early preharvest and 50 % ETc late preharvest and postharvest) didn’t affect fruit yield, but it had an impact on fruit quality. Fruit from ‘d’ Anjou’ and ‘Bartlett’ trees in the RDI treatment had smaller diameter, lower fresh mass, and higher dry matter content than fruit from fully irrigated trees. Vélez-Sánchez et al. [53] found that under tropical conditions different RDI levels did not affect fruit firmness, pigments (chlorophyll and carotenoids), color index, content of phenols, sugars, or acids at harvest. In our study, IP irrigation fruit had lower antioxidant activity and total polyphenolic content compared to FP treatment. The combination of lower SSC/TA ratio and reduced antioxidant content under IP indicates that, although water saving was achieved, there may be a reduction of fruit nutritional and sensory quality.
The reduced winter pruning material mass under IP for both one-year-old and multi-year-old shoots indicates that water deficit constrained vegetative growth during the whole season. Our results align with those of Blanco et al. [33], who found that RDI trees had more than 50% less pruned wood per growing season than fully irrigated trees. For pears, deficit irrigation applied during slow fruit growth and rapid vegetative growth stages is referred as an effective strategy to control excessive vegetative vigor [9]. Excessive vegetative growth consumes significant amounts of water and nutrient, while the necessary pruning further increases labor requirements. Thus, RDI treatment during the cell division stage can increase efficiency of water use and reduce the cost of labor as well [56]. Reduction in pruning wood material is of high importance, as it indicates that a larger share of assimilated carbon is allocated to reproductive sinks (fruits) instead of being lost through the removal of vegetative tissues. It has been reported that water deficit from budburst to leafing stage inhibited vegetative growth in pear-jujube, and after resumption of full irrigation, the stored photosynthates from leaves and branches were translocated to the fruit, and the combination of a strong compensatory photosynthetic response and full irrigation during the rapid fruit growth stage ultimately benefited fruit development [57]. This means that deficit irrigation strategies that reduce pruning biomass can help optimize source–sink relationships, allowing trees to use carbohydrates more efficiently for fruit development. However, despite the expected benefits of reduced pruning biomass on source–sink balance, our study found that the suppression of vegetative growth is probably related to lower fruit quality.
Up to the end of the deficit irrigation period in mid-June, NDVI showed no significant differences between the IP treatment and the FP, even though vegetative growth had already ceased. Furthermore, NDVI did not capture any effect of water deficit on vegetation greenness, showing that IP trees maintained adequate photosynthetic capacity despite experiencing water stress or maybe the water stress was moderate to detect. It has been reported that NDVI is effective for assessing long-term crop changes such as pest damage, prolonged water deficits, and nutrient deficiencies that affect chlorophyll, but NDVI may not be useful for acute stresses that have an effect within days [58].
5. Conclusions
The AgroNIT-based integrated irrigation practice reduced irrigation water-use by 15.8% while substantially improving water-use efficiency in pear production. Although deficit irrigation increased plant water stress, as indicated by higher CWSI and lower Ψstem, trees showed effective physiological and biochemical acclimation, maintaining photosynthetic performance and achieving higher fruit yield with reduced vegetative growth. However, the improved water-use efficiency was accompanied by smaller fruit, lower antioxidant activity, reduced polyphenolic content, and a lower SSC/TA ratio, indicating some trade-offs in fruit quality. Overall, the results demonstrate that AgroNIT is a promising decision-support tool for precision irrigation in water-limited environments. Further optimization of irrigation scheduling and complementary orchard management practices is needed to maximize water savings while preserving fruit quality.
Author Contributions
Conceptualization, G.D.N. and P.M.; Methodology, P.M., V.G., I.M., C.K., G.D.N.; Software, I.M., P.T., T.K.; Validation, I.M., P.T., T.K.; Formal Analysis, P.M., V.G., C.K., T.G., G.D.N.; Investigation, P.M., V.G., G.D.N.; Resources, G.D.N.; Data Curation, P.M., V.G., C.K., T.G. G.D.N.; Writing – Original Draft Preparation, P.M., V.G., I.M., C.K.; Writing – Review & Editing, P.M., V.G., I.M., C.K., G.D.N.; Visualization, G.D.N., T.K.; Supervision, G.D.N.; Project Administration, G.D.N.; Funding Acquisition, T.K., G.D.N. All authors have read and agreed to the published version of the manuscript.:
Funding
This research was funded by the European Union and Greek national funds through the Operational Program Competitiveness, Entrepreneurship, and Innovation, under the call RESEARCH—CREATE—INNOVATE under Grant T1EDK-03793, entitled “ORALI”.
Institutional Review Board Statement
Not applicable.
Informed Consent Statement
Not applicable.
Data Availability Statement
The data presented in this study are available upon request from the corresponding author.
Acknowledgments
The research is conducted in the operating framework of the University of Thessaly Innovation, Technology Transfer Unit and Entrepreneurship Center "One Planet Thessaly", under the “University of Thessaly Grants for Scientific Publication Support” action and is funded by the Special Account of Research Grants of the University of Thessaly.
Conflicts of Interest
The authors declare no conflicts of interest.
References
- Food and Agriculture Organization of the United Nations. FAOSTAT. 2024. Available online: www.fao.org/faostat/en/ (accessed on 3 July 2026).
- Noto, L.V.; Cipolla, G.; Pumo, D. Climate Change in the Mediterranean Basin (Part II): A Review of Challenges and Uncertainties in Climate Change Modeling and Impact Analyses. Water Resour. Manag. 2023, 37, 2307–2323. [Google Scholar] [CrossRef]
- Kisekka, I. Orchard Water Management. In Advanced Automation for Tree Fruit Orchards and Vineyards; Agriculture Automation and Control; Vougioukas, S.G., Zhang, Q., Eds.; Springer International Publishing: Cham, Switzerland, 2023; pp. 59–74. [Google Scholar]
- Boland, A.; Ziehri, A.; Beaumont, J. Guide to Best Practice in Water Management: Orchard Crops; Murray-Darling Basin Commission, State of Victoria, Department of Natural Resources and Environment: Melbourne, Australia, 2002. [Google Scholar]
- Naor, A. Irrigation Scheduling and Evaluation of Tree Water Status in Deciduous Orchards. In Horticultural Reviews; Janick, J., Ed.; Wiley: Hoboken, NJ, USA, 2006; Volume 32, pp. 111–165. [Google Scholar]
- Soliman, M.A.M.; Ennab, H.A.; Mikhael, G.B. Effect of Periodic Deficit Irrigation at Different Fruit Growth Stages on Yield and Fruit Quality of “Anna” Apple Trees. J. Plant Prod. 2018, 9, 13–19. [Google Scholar] [CrossRef]
- Cummins, Tim; Associates. Irrigation Survival Requirements: A Collation of the Best Available Information on Survival Requirements of Horticultural Crops and Dairy Enterprises During Severe Water Restrictions Lasting One Season; Prepared for the Department of Natural Resources and Environment, 1998. [Google Scholar]
- Fereres, E.; Goldhamer, D. Irrigation of Deciduous Fruit and Nut Trees. In Irrigation of Agricultural Crops; ASA Monograph No. 30; American Society of Agronomy: Madison, WI, USA, 1990; pp. 987–1017. [Google Scholar]
- Mitchell, P.D.; van den Ende, B.; Jerie, P.H.; Chalmers, D.J. Response of “Bartlett” Pear to Withholding Irrigation, Regulated Deficit Irrigation, and Tree Spacing. J. Am. Soc. Hortic. Sci. 1989, 114, 15–19. [Google Scholar] [CrossRef]
- Allen, R.G.; Pereira, L.S.; Raes, D.; Smith, M. Crop Evapotranspiration: Guidelines for Computing Crop Water Requirements; FAO Irrigation and Drainage Paper No. 56; Food and Agriculture Organization of the United Nations: Rome, Italy, 1998; Volume 56. [Google Scholar]
- Vardopoulos, I.; Falireas, S.; Konstantopoulos, I.; Kaliora, E.; Theodoropoulou, E. Sustainability Assessment of the Agri-Environmental Practices in Greece. Indicators’ Comparative Study. Int. J. Agric. Resour. Gov. Ecol. 2018, 14, 368–399. [Google Scholar] [CrossRef]
- Zhai, Z.; Martínez, J.F.; Beltran, V.; Martínez, N.L. Decision Support Systems for Agriculture 4.0: Survey and Challenges. Comput. Electron. Agric. 2020, 170, 105256. [Google Scholar] [CrossRef]
- Dagar, R.; Som, S.; Khatri, S.K. Smart Farming–IoT in Agriculture. In Proceedings of the 2018 International Conference on Inventive Research in Computing Applications (ICIRCA), Coimbatore, India, 11–12 July 2018; IEEE: New York, NY, USA, 2018. [Google Scholar]
- Moysiadis, V.; Sarigiannidis, P.; Vitsas, V.; Khelifi, A. Smart Farming in Europe. Comput. Sci. Rev. 2021, 39, 100345. [Google Scholar] [CrossRef]
- Van Beek, J.; Tits, L.; Somers, B.; Coppin, P. Stem Water Potential Monitoring in Pear Orchards through WorldView-2 Multispectral Imagery. Remote Sens. 2013, 5, 6647–6666. [Google Scholar] [CrossRef]
- Perry, E.M.; Bluml, M.; Goodwin, I.; Cornwall, D.; Swarts, N.D. Remote Sensing of N Deficiencies in Apple and Pear Orchards. Acta Hortic. 2016, 1130, 575–580. [Google Scholar] [CrossRef]
- Bagheri, N. Application of Aerial Remote Sensing Technology for Detection of Fire Blight Infected Pear Trees. Comput. Electron. Agric. 2020, 168, 105147. [Google Scholar] [CrossRef]
- Moutsinas, I.; Kalkanof, A.; Mavridis, J.; Zafeiris, V.; Oikonomou, F.; Tziokas, G.; Themelis, K.; Kyriakou, K.; Theologou, C.; Serafeim, A.; Apostolaras, A.; Maletsika, P.; Nanos, G.D.; Korakis, T. AgroNIT: Innovating Precision Agriculture. In Proceedings of the 2022 Global Information Infrastructure and Networking Symposium (GIIS), Argostoli, Greece, 26–28 September 2022; pp. 6–12. [Google Scholar]
- Moutsinas, I.; Maletsika, P.; Zafeiris, V.; Tziokas, G.; Serafeim, A.; Apostolaras, A.; Giouvanis, V.; Korakis, T.; Nanos, G.D. Use of the AgroNIT Smart-Farming IoT Ecosystem to Support Irrigation Management and Assess Its Impact on Fruit Trees’ Economy and Nutrition in Greece. Acta Hortic. 2024, 1409, 417–426. [Google Scholar] [CrossRef]
- Pereira, L.S.; Allen, R.G.; Smith, M.; Raes, D. Crop Evapotranspiration Estimation with FAO56: Past and Future. Agric. Water Manag. 2015, 147, 4–20. [Google Scholar] [CrossRef]
- Maes, W.H.; Steppe, K. Perspectives for Remote Sensing with Unmanned Aerial Vehicles in Precision Agriculture. Trends Plant Sci. 2019, 24, 152–164. [Google Scholar] [CrossRef] [PubMed]
- Xue, J.; Su, B. Significant Remote Sensing Vegetation Indices: A Review of Developments and Applications. J. Sens. 2017, 2017, 1353691. [Google Scholar] [CrossRef]
- Jones, H. Use of Infrared Thermometry for Estimation of Stomatal Conductance as a Possible Aid to Irrigation Scheduling. Agric. For. Meteorol. 1999, 95, 139–149. [Google Scholar] [CrossRef]
- Lichtenthaler, K. Chlorophylls and Carotenoids: Pigments of Photosynthetic Biomembranes. Methods Enzymol. 1987, 148, 350–382. [Google Scholar] [CrossRef]
- Bates, L.S.; Waldren, R.P.; Teare, I.D. Rapid Determination of Free Proline for Water-Stress Studies. Plant Soil 1973, 39, 205–207. [Google Scholar] [CrossRef]
- Maletsika, P.; Michailidis, M.; Mouchtaropoulou, E.; et al. Transcriptomic and metabolomic analysis of on-tree fruit maturation in the white, melting-flesh peach cultivar ‘Lemonato’. Hortic. Environ. Biotechnol. 2025, 66, 1647–1664. [Google Scholar] [CrossRef]
- Swain, T.; Hillis, E. The Phenolic Constituents of Prunus domestica. J. Sci. Food Agric. 1959, 10, 63–68. [Google Scholar] [CrossRef]
- Brand-Williams, W.; Cuvelier, M.E.; Berset, C. Use of a Free Radical Method to Evaluate Antioxidant Activity. LWT—Food Sci. Technol. 1995, 28, 25–30. [Google Scholar] [CrossRef]
- Benzie, I.F.F.; Strain, J.J. The Ferric Reducing Ability of Plasma (FRAP) as a Measure of “Antioxidant Power”: The FRAP Assay. Anal. Biochem. 1996, 239, 70–76. [Google Scholar] [CrossRef] [PubMed]
- Osroosh, Y.; Troy Peters, R.T.; Campbell, C.S.; Zhang, Q. Comparison of Irrigation Automation Algorithms for Drip-Irrigated Apple Trees. Comput. Electron. Agric. 2016, 128, 87–99. [Google Scholar] [CrossRef]
- Blanco, V.; Willsea, N.; Campbell, T.; Howe, O.; Kalcsits, L. Combining Thermal Imaging and Soil Water Content Sensors to Assess Tree Water Status in Pear Trees. Front. Plant Sci. 2023, 14, 1197437. [Google Scholar] [CrossRef] [PubMed]
- Berni, J.A.J.; Zarco-Tejada, P.J.; Sepulcre-Cantó, G.; Fereres, E.; Villalobos, F. Mapping Canopy Conductance and CWSI in Olive Orchards Using High Resolution Thermal Remote Sensing Imagery. Remote Sens. Environ. 2009, 113, 2380–2388. [Google Scholar] [CrossRef]
- Blanco, V.; Willsea, N.; Campbell, T.; Howe, O.; Kalcsits, L. Deficit Irrigation Affects Fruit Quality, Production and Resource Allocation of ‘d’Anjou’ and ‘Bartlett’ Pear Trees. Agric. Water Manag. 2025, 318, 109728. [Google Scholar] [CrossRef]
- Bacelar, E.A.; Correia, C.M.; Moutinho-Pereira, J.M.; Gonçalves, B.C.; Lopes, J.I.; Torres-Pereira, J.M. Sclerophylly and Leaf Anatomical Traits of Five Field-Grown Olive Cultivars Growing under Drought Conditions. Tree Physiol. 2004, 24, 233–239. [Google Scholar] [CrossRef] [PubMed]
- de la Riva, E.G.; Olmo, M.; Poorter, H.; Ubera, J.L.; Villar, R. Leaf Mass per Area (LMA) and Its Relationship with Leaf Structure and Anatomy in 34 Mediterranean Woody Species along a Water Availability Gradient. PLoS ONE 2016, 11, e0148788. [Google Scholar] [CrossRef] [PubMed]
- Centritto, M. The Effects of Elevated [CO₂] and Water Availability on Growth and Physiology of Peach (Prunus persica) Plants. Plant Biosyst. 2002, 136, 177–188. [Google Scholar] [CrossRef]
- Poorter, H.; Niinemets, Ü.; Poorter, L.; Wright, I.J.; Villar, R. Causes and Consequences of Variation in Leaf Mass per Area (LMA): A Meta-Analysis. New Phytol. 2009, 183, 565–588. [Google Scholar] [CrossRef]
- Muhammad, I.; Shalmani, A.; Ali, M.; Yang, Q.H.; Ahmad, H.; Li, F.B. Mechanisms Regulating the Dynamics of Photosynthesis under Abiotic Stresses. Front. Plant Sci. 2021, 11, 2310. [Google Scholar] [CrossRef] [PubMed]
- Ebtedaei, M.; Arzani, K.; Abdollahi, H. Unraveling the Effects of Melatonin on Drought-Stressed Pear Rootstocks: A Comparative Analysis of Dargazi and Pyrodwarf. Plant Stress 2024, 11, 100393. [Google Scholar] [CrossRef]
- Dumanoğlu, H.; Şahin, Ö.; Sarıkamış, G. Drought Stress Response of Pears and Quince as Pear Rootstocks Induced by D-Mannitol Assessed with Proliferation and Growth, Antioxidant Enzymes and Mineral Elements of In Vitro Microshoots. S. Afr. J. Bot. 2025, 178, 382–389. [Google Scholar] [CrossRef]
- Asayesh, Z.M.; Arzani, K.; Mokhtassi-Bidgoli, A.; Abdollahi, H. Enzymatic and Non-Enzymatic Response of Grafted and Ungrafted Young European Pear (Pyrus communis L.) Trees to Drought Stress. Sci. Hortic. 2023, 310, 111745. [Google Scholar] [CrossRef]
- Farooq, M.; Wahid, A.; Kobayashi, N.; Fujita, D.; Basra, S.M.A. Plant Drought Stress: Effects, Mechanisms and Management. Agron. Sustain. Dev. 2009, 29, 185–212. [Google Scholar] [CrossRef]
- Yang, S.; Bai, M.; Hao, G.; Zhang, X.; Guo, H.; Fu, B. Transcriptome Survey and Expression Analysis Reveals the Adaptive Mechanism of ‘Yulu Xiang’ Pear in Response to Long-Term Drought Stress. PLoS ONE 2021, 16, e0246070. [Google Scholar] [CrossRef] [PubMed]
- Hussain, H.A.; Hussain, S.; Khaliq, A.; Ashraf, U.; Anjum, S.A.; Men, S.; Wang, L. Chilling and Drought Stresses in Crop Plants: Implications, Cross Talk, and Potential Management Opportunities. Front. Plant Sci. 2018, 9, 393. [Google Scholar] [CrossRef] [PubMed]
- Flexas, J.; Medrano, H. Drought-Inhibition of Photosynthesis in C3 Plants: Stomatal and Non-Stomatal Limitations Revisited. Ann. Bot. 2002, 89, 183–189. [Google Scholar] [CrossRef] [PubMed]
- Ziska, L.H.; Hutmacher, R.B.; Hoffman, G.J.; DeJong, T.M. Changes in Leaf Water Status Associated with Salinity in Mature, Field-Grown Prunus salicina. Physiol. Plant. 1989, 77, 141–149. [Google Scholar] [CrossRef]
- DeJong, T.M. Fruit Effects on Photosynthesis in Prunus persica. Physiol. Plant. 1986, 66, 149–153. [Google Scholar] [CrossRef]
- Marsal, J.; Girona, J. Relationship between Leaf Water Potential and Gas Exchange Activity at Different Phenological Stages and Fruit Loads in Peach Trees. J. Am. Soc. Hortic. Sci. 1997, 122, 415–421. [Google Scholar] [CrossRef]
- Zhang, N.; Yang, Z.; Kaiser, E.; Qi, K.; Tang, C.; Wang, P.; Caleb, O.J.; Tsige, A.A.; Tao, S.; Zhang, S.; Wu, J. Variation of Leaf Photosynthetic Traits Is Mostly Driven by Changes in Source–Sink Relationship Rather than Irradiance in Pear Tree Canopies. BMC Plant Biol. 2026, 26, 628. [Google Scholar] [CrossRef] [PubMed]
- Marsal, J.; Mata, M.; Arbones, A.; Rufat, J.; Girona, J. Regulated Deficit Irrigation and Rectification Scheduling in Young Pear Trees: An Evaluation Based on Vegetative and Productive Response. Eur. J. Agron. 2002, 17, 111–122. [Google Scholar] [CrossRef]
- Marsal, J.; Rapoport, H.F.; Manrique, T.; Girona, J. Pear Fruit Growth under Regulated Deficit Irrigation in Container-Grown Trees. Sci. Hortic. 2000, 85, 243–259. [Google Scholar] [CrossRef]
- Fereres, E.; Soriano, M.A. Deficit Irrigation for Reducing Agricultural Water Use. J. Exp. Bot. 2007, 58, 147–159. [Google Scholar] [PubMed]
- Vélez-Sánchez, J.E.; Balaguera-López, H.E.; Alvarez-Herrera, J.G. Effect of Regulated Deficit Irrigation (RDI) on the Production and Quality of Pear Triunfo de Viena Variety under Tropical Conditions. Sci. Hortic. 2021, 278, 109880. [Google Scholar] [CrossRef]
- Venturi, M.; Manfrini, L.; Perulli, G.D.; Boini, A.; Bresilla, K.; Corelli Grappadelli, L.; Morandi, B. Deficit Irrigation as a Tool to Optimize Fruit Quality in ‘Abbé Fétel’ Pear. Agronomy 2021, 11, 1141. [Google Scholar] [CrossRef]
- Lopez, G.; Larrigaudière, C.; Girona, J.; Behboudian, M.H.; Marsal, J. Fruit Thinning in ‘Conference’ Pear Grown under Deficit Irrigation: Implications for Fruit Quality at Harvest and after Cold Storage. Sci. Hortic. 2011, 129, 64–70. [Google Scholar] [CrossRef]
- Wu, Y.; Zhao, Z.; Wang, W.; Ma, Y.; Huang, X. Yield and Growth of Mature Pear Trees under Water Deficit during Slow Fruit Growth Stages in Sparse Planting Orchard. Sci. Hortic. 2013, 164, 189–195. [Google Scholar] [CrossRef]
- Cui, N.; Du, T.; Kang, S.; Li, F.; Zhang, J.; Wang, M.; Li, Z. Response of Vegetative Growth and Fruit Development to Regulated Deficit Irrigation at Different Growth Stages of Pear-Jujube Tree. Agric. Water Manag. 2009, 96, 1237–1246. [Google Scholar] [CrossRef]
- Glenn, D.M.; Tabb, A. Evaluation of Five Methods to Measure Normalized Difference Vegetation Index (NDVI) in Apple and Citrus. Int. J. Fruit. Sci. 2019, 19, 191–210. [Google Scholar]
Figure 1.
Μean daily air temperature (oC) and daily precipitation (mm).
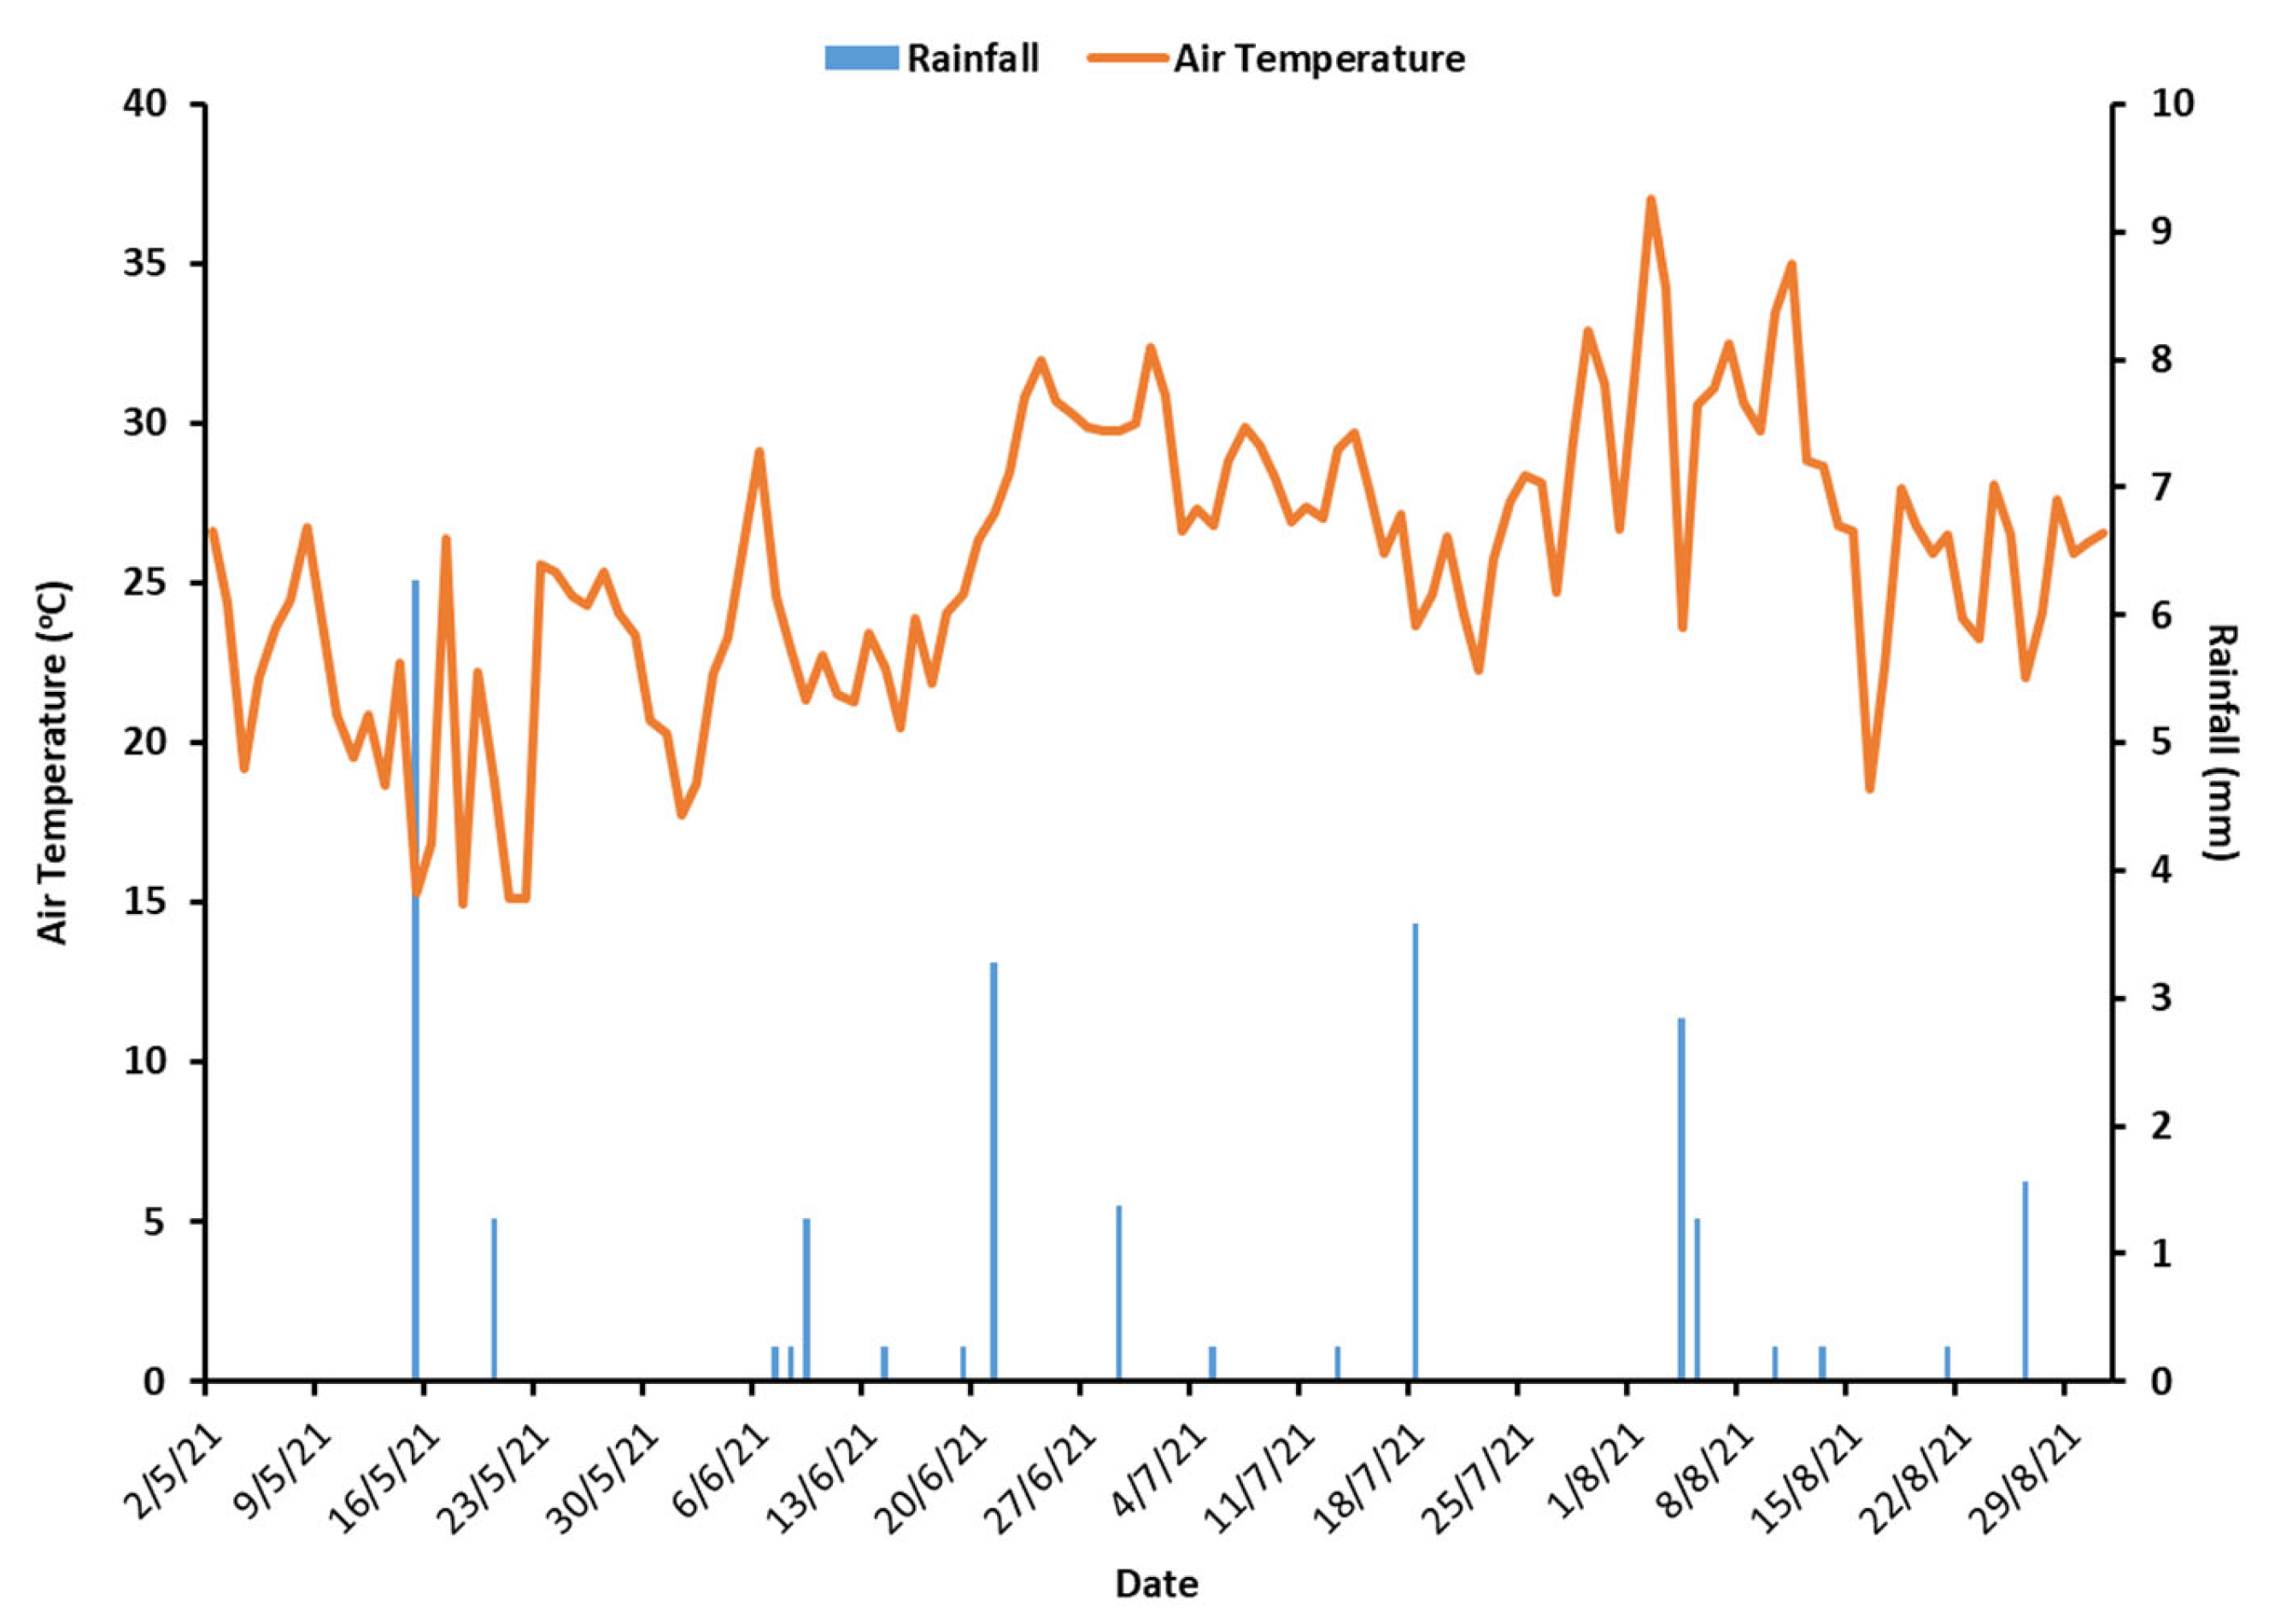
Figure 2.
Midday stem water potential (Ψstem) (MPa) of the trees of the FP and IP treatments in 14/6/21 and 28/7/21. Data shown are the mean ± SE (n = 12).
Figure 2.
Midday stem water potential (Ψstem) (MPa) of the trees of the FP and IP treatments in 14/6/21 and 28/7/21. Data shown are the mean ± SE (n = 12).
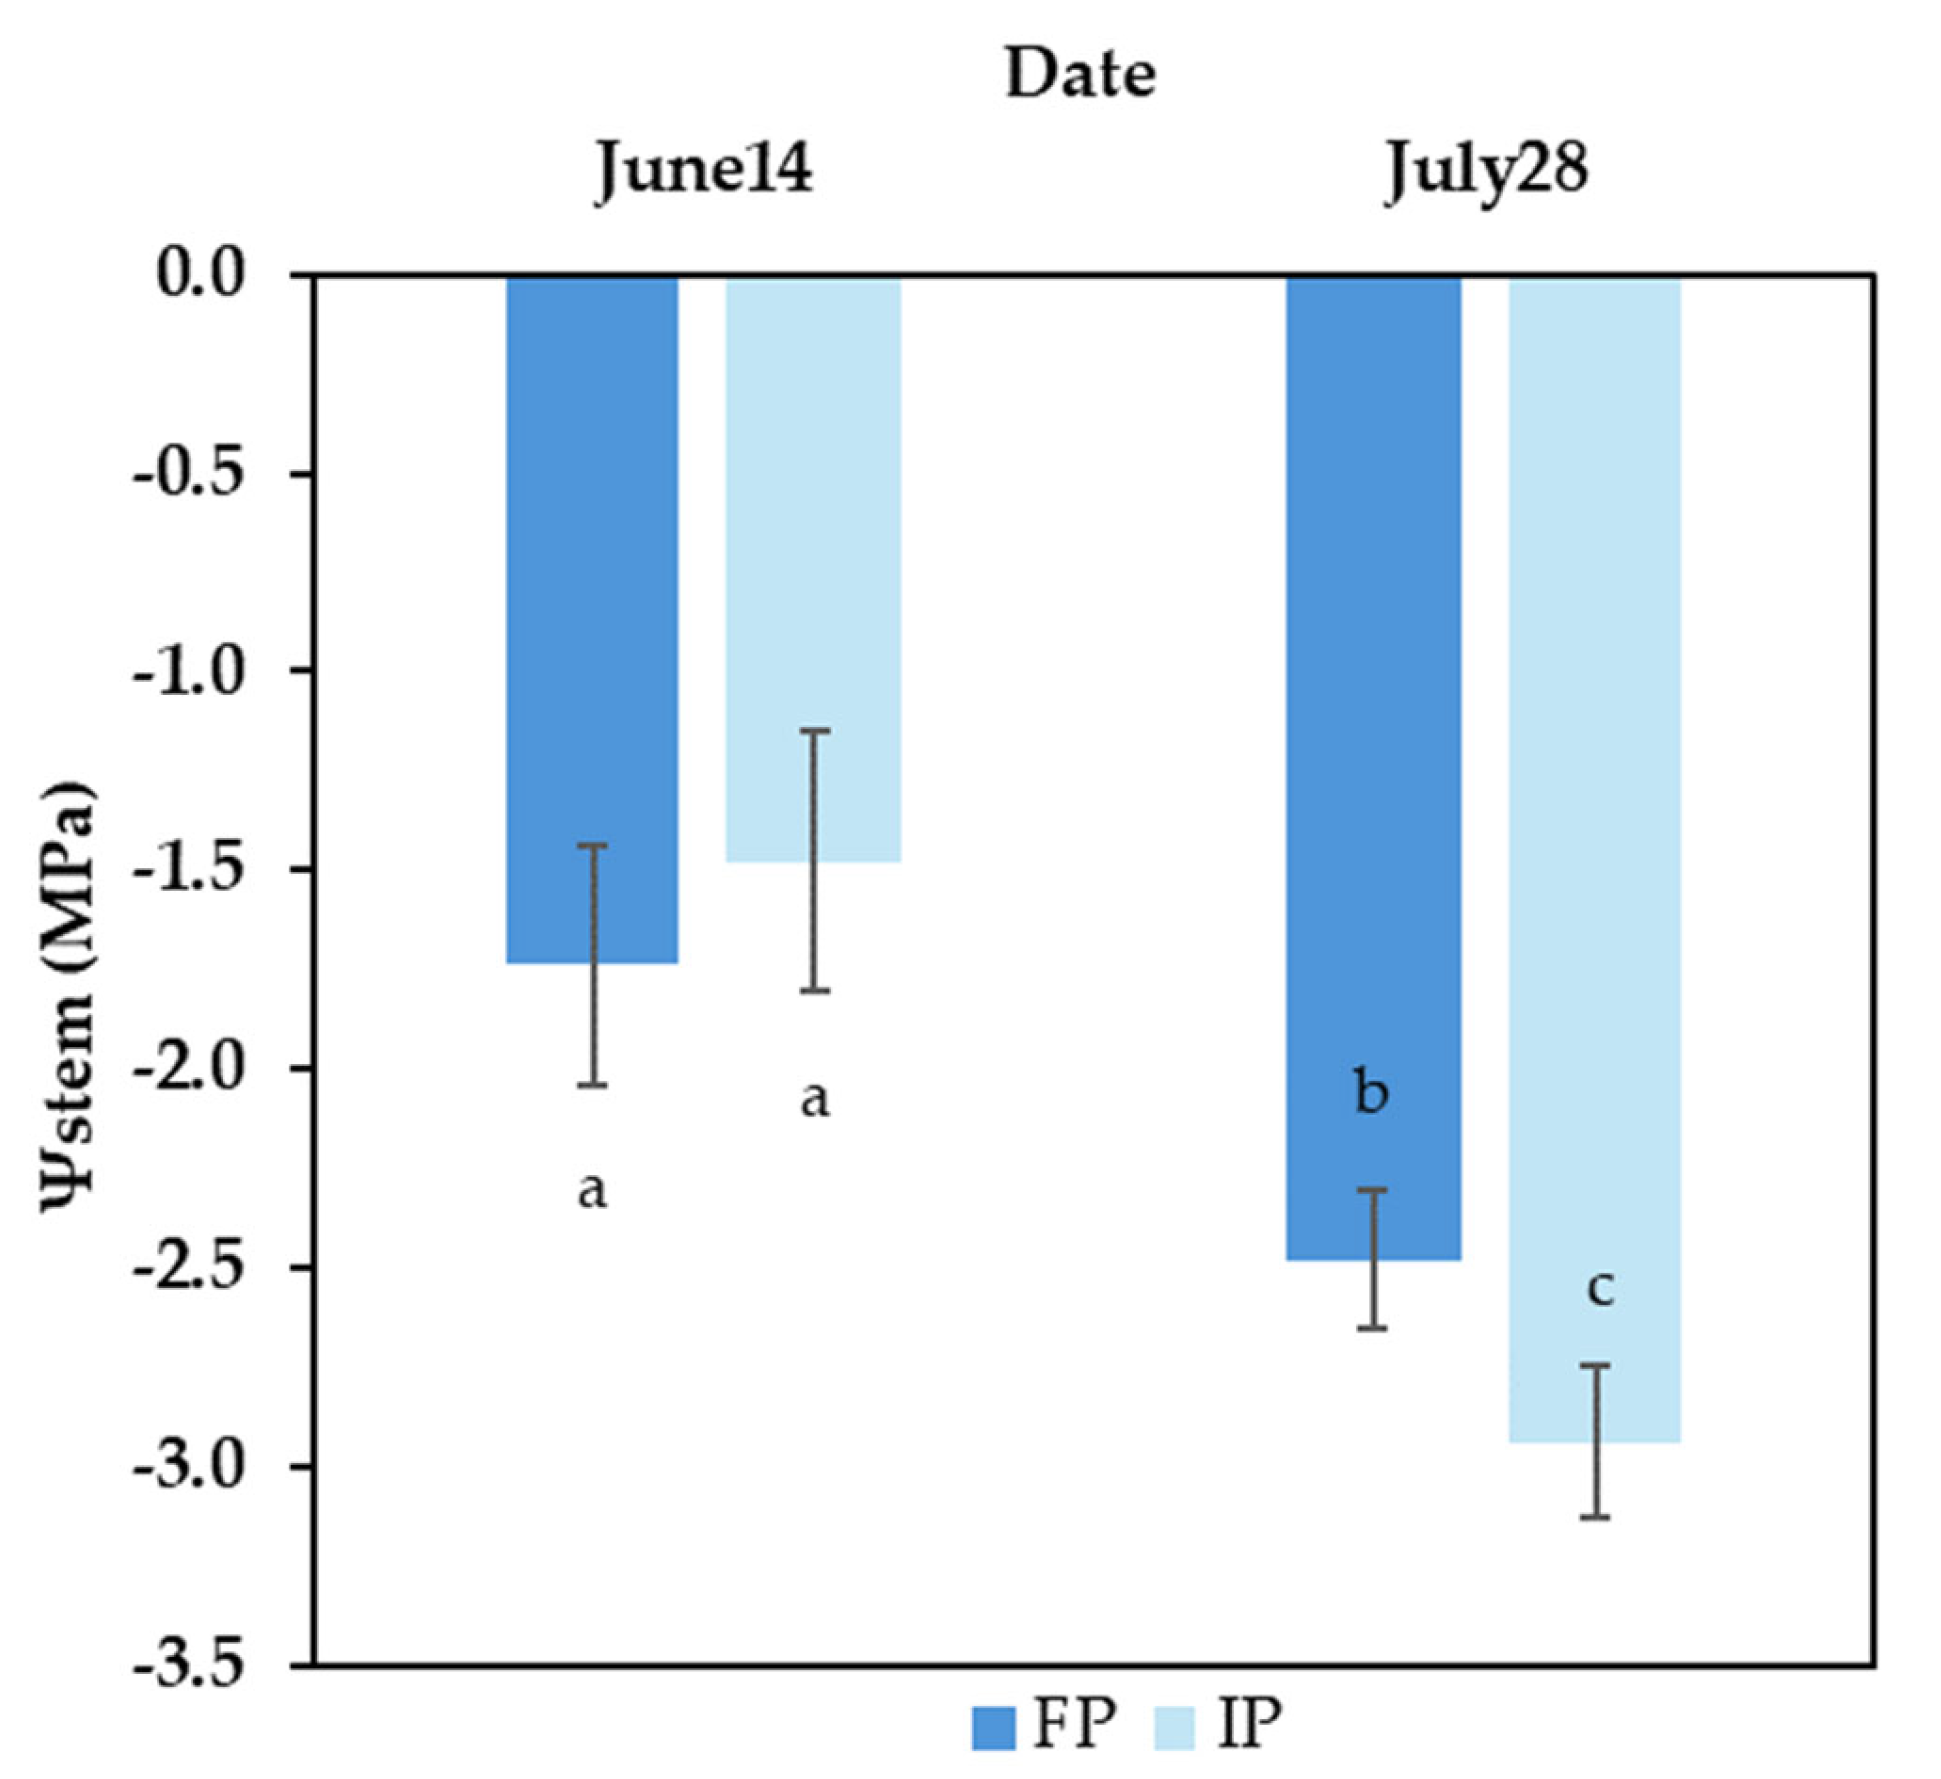
Figure 3.
The influence of irrigation practice (farmer’s practice FP and integrated practice IP) on fruit diameter. Data shown are the mean ± SE (n = 12).
Figure 3.
The influence of irrigation practice (farmer’s practice FP and integrated practice IP) on fruit diameter. Data shown are the mean ± SE (n = 12).
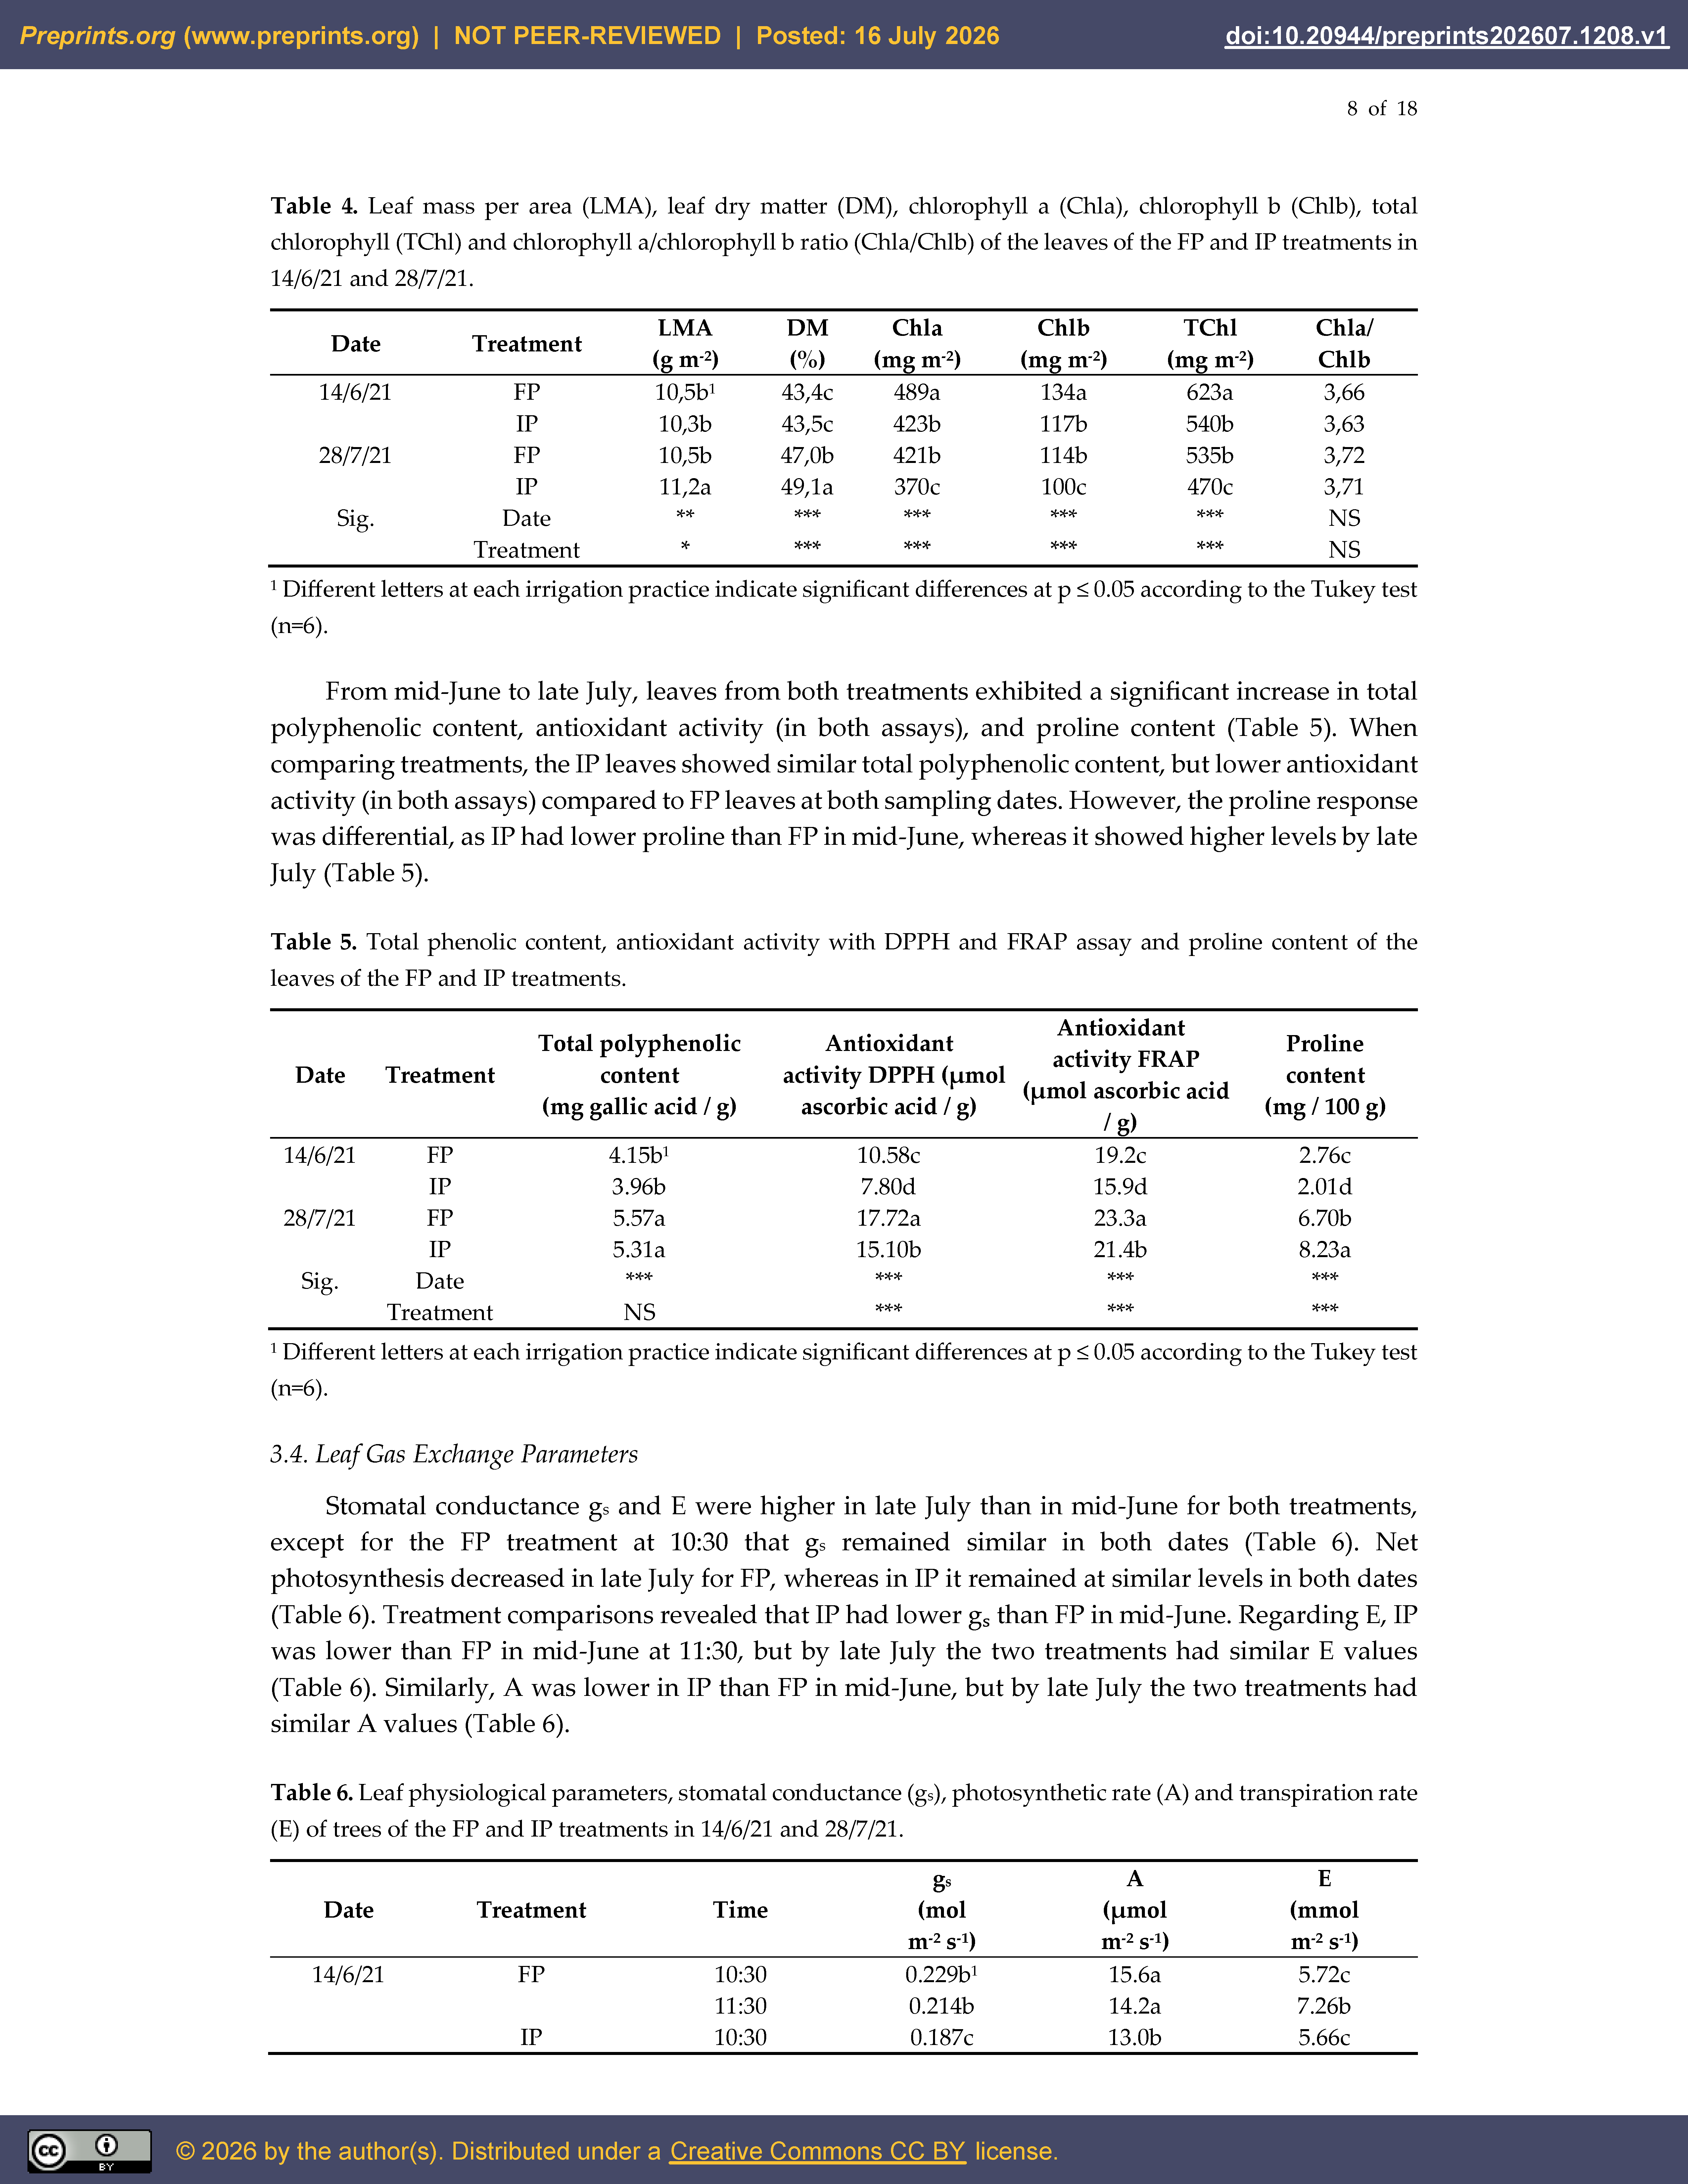
Figure 4.
The influence of irrigation practice (farmer’s practice FP and integrated practice IP) on fruit quality characteristics of pears and tree production. Determination of fruit mass (A), color index L* (B), color index a* (C), firmness (D), soluble solids content (E), titratable acidity (F), SSC/TA (G), % dry matter (H), production (kg per tree) (I), total phenolic content (J), antioxidant activity based on DPPH (K) and FRAP (L) assays at commercial harvest stage. Different letters at each irrigation practice indicate significant differences at p ≤ 0.05 according to the Tukey test. Data shown are the mean ± SE (n = 6).
Figure 4.
The influence of irrigation practice (farmer’s practice FP and integrated practice IP) on fruit quality characteristics of pears and tree production. Determination of fruit mass (A), color index L* (B), color index a* (C), firmness (D), soluble solids content (E), titratable acidity (F), SSC/TA (G), % dry matter (H), production (kg per tree) (I), total phenolic content (J), antioxidant activity based on DPPH (K) and FRAP (L) assays at commercial harvest stage. Different letters at each irrigation practice indicate significant differences at p ≤ 0.05 according to the Tukey test. Data shown are the mean ± SE (n = 6).
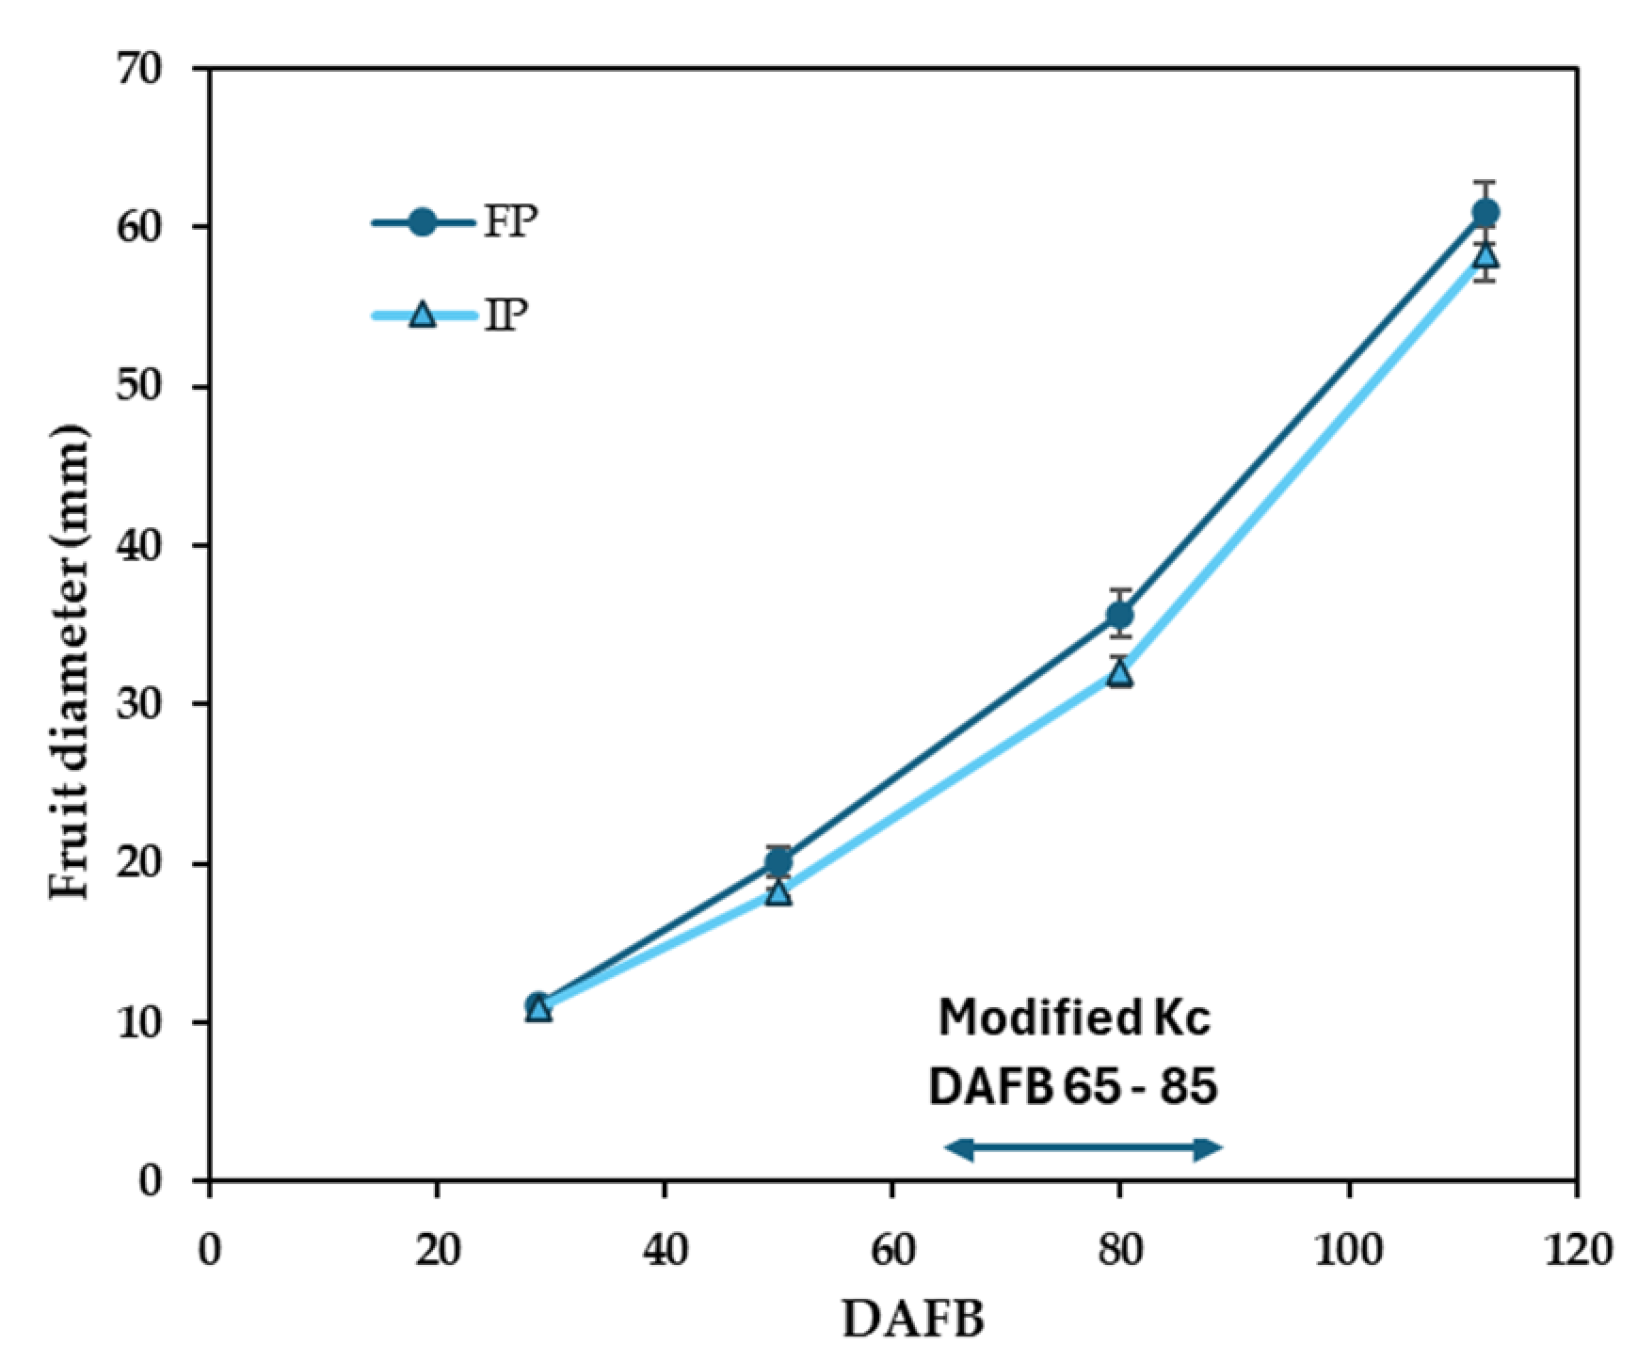
Figure 5.
Pruning material mass for one-year old and multi-year-old shoots (n=4).
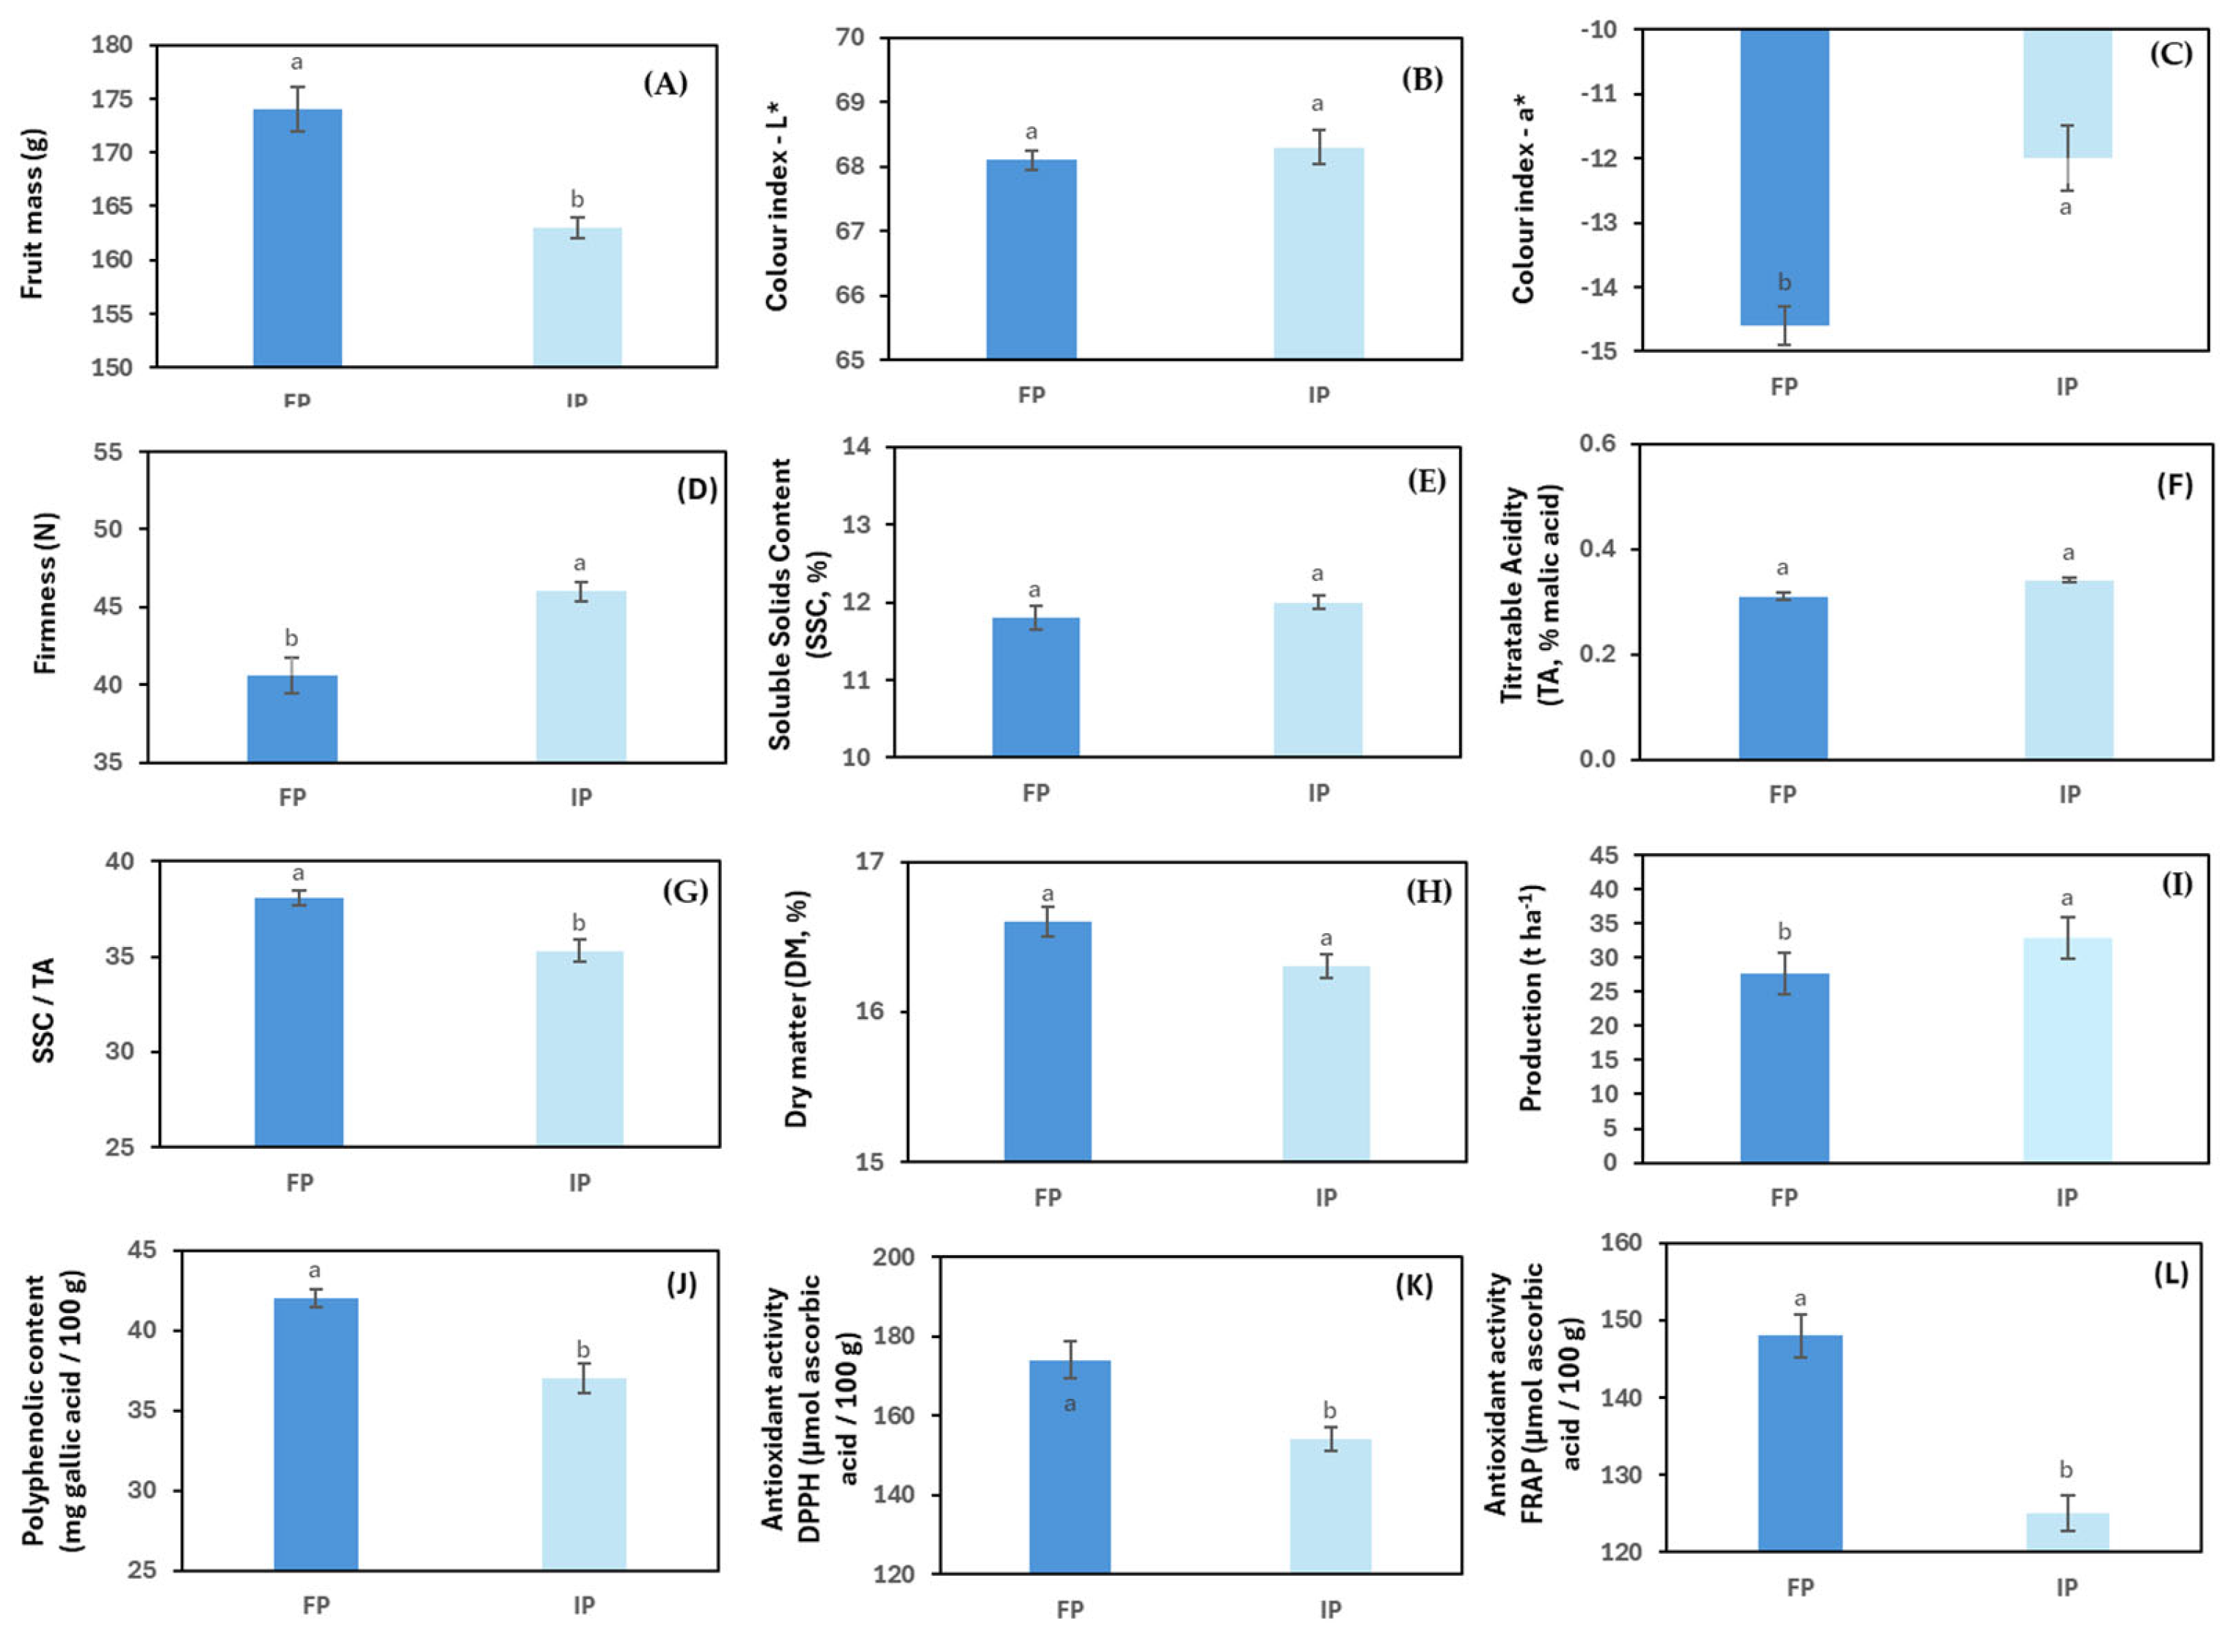
Figure 6.
NDVI maps for the two irrigation treatments (FP and IP). Black polygons indicate the sampling plots over the center of the tree canopy.
Figure 6.
NDVI maps for the two irrigation treatments (FP and IP). Black polygons indicate the sampling plots over the center of the tree canopy.
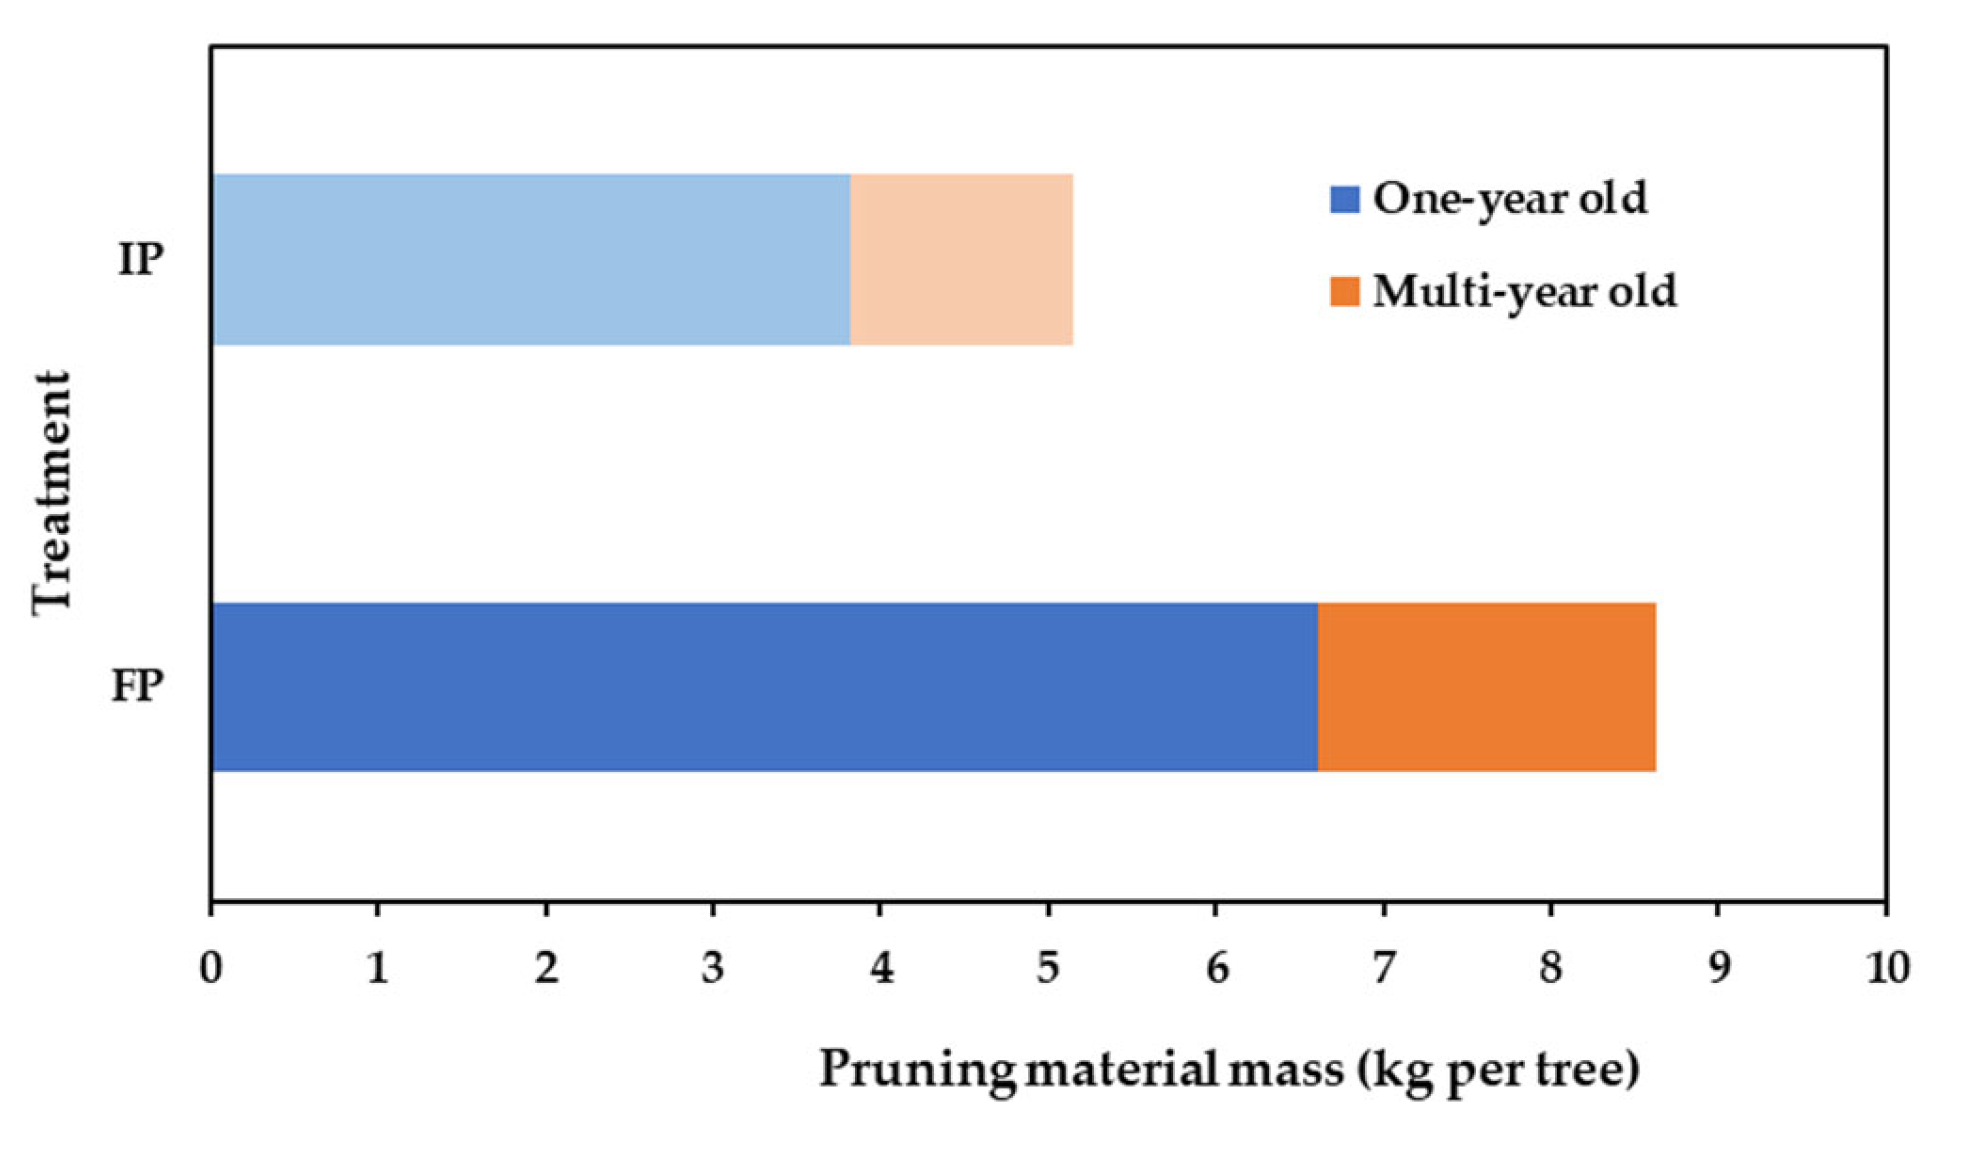
Figure 7.
Mean NDVI values for the two irrigation treatments at different dates (FP – Farmer Practice, IP = Integrated Practice). Error bars indicate standard error at p=0.05.
Figure 7.
Mean NDVI values for the two irrigation treatments at different dates (FP – Farmer Practice, IP = Integrated Practice). Error bars indicate standard error at p=0.05.
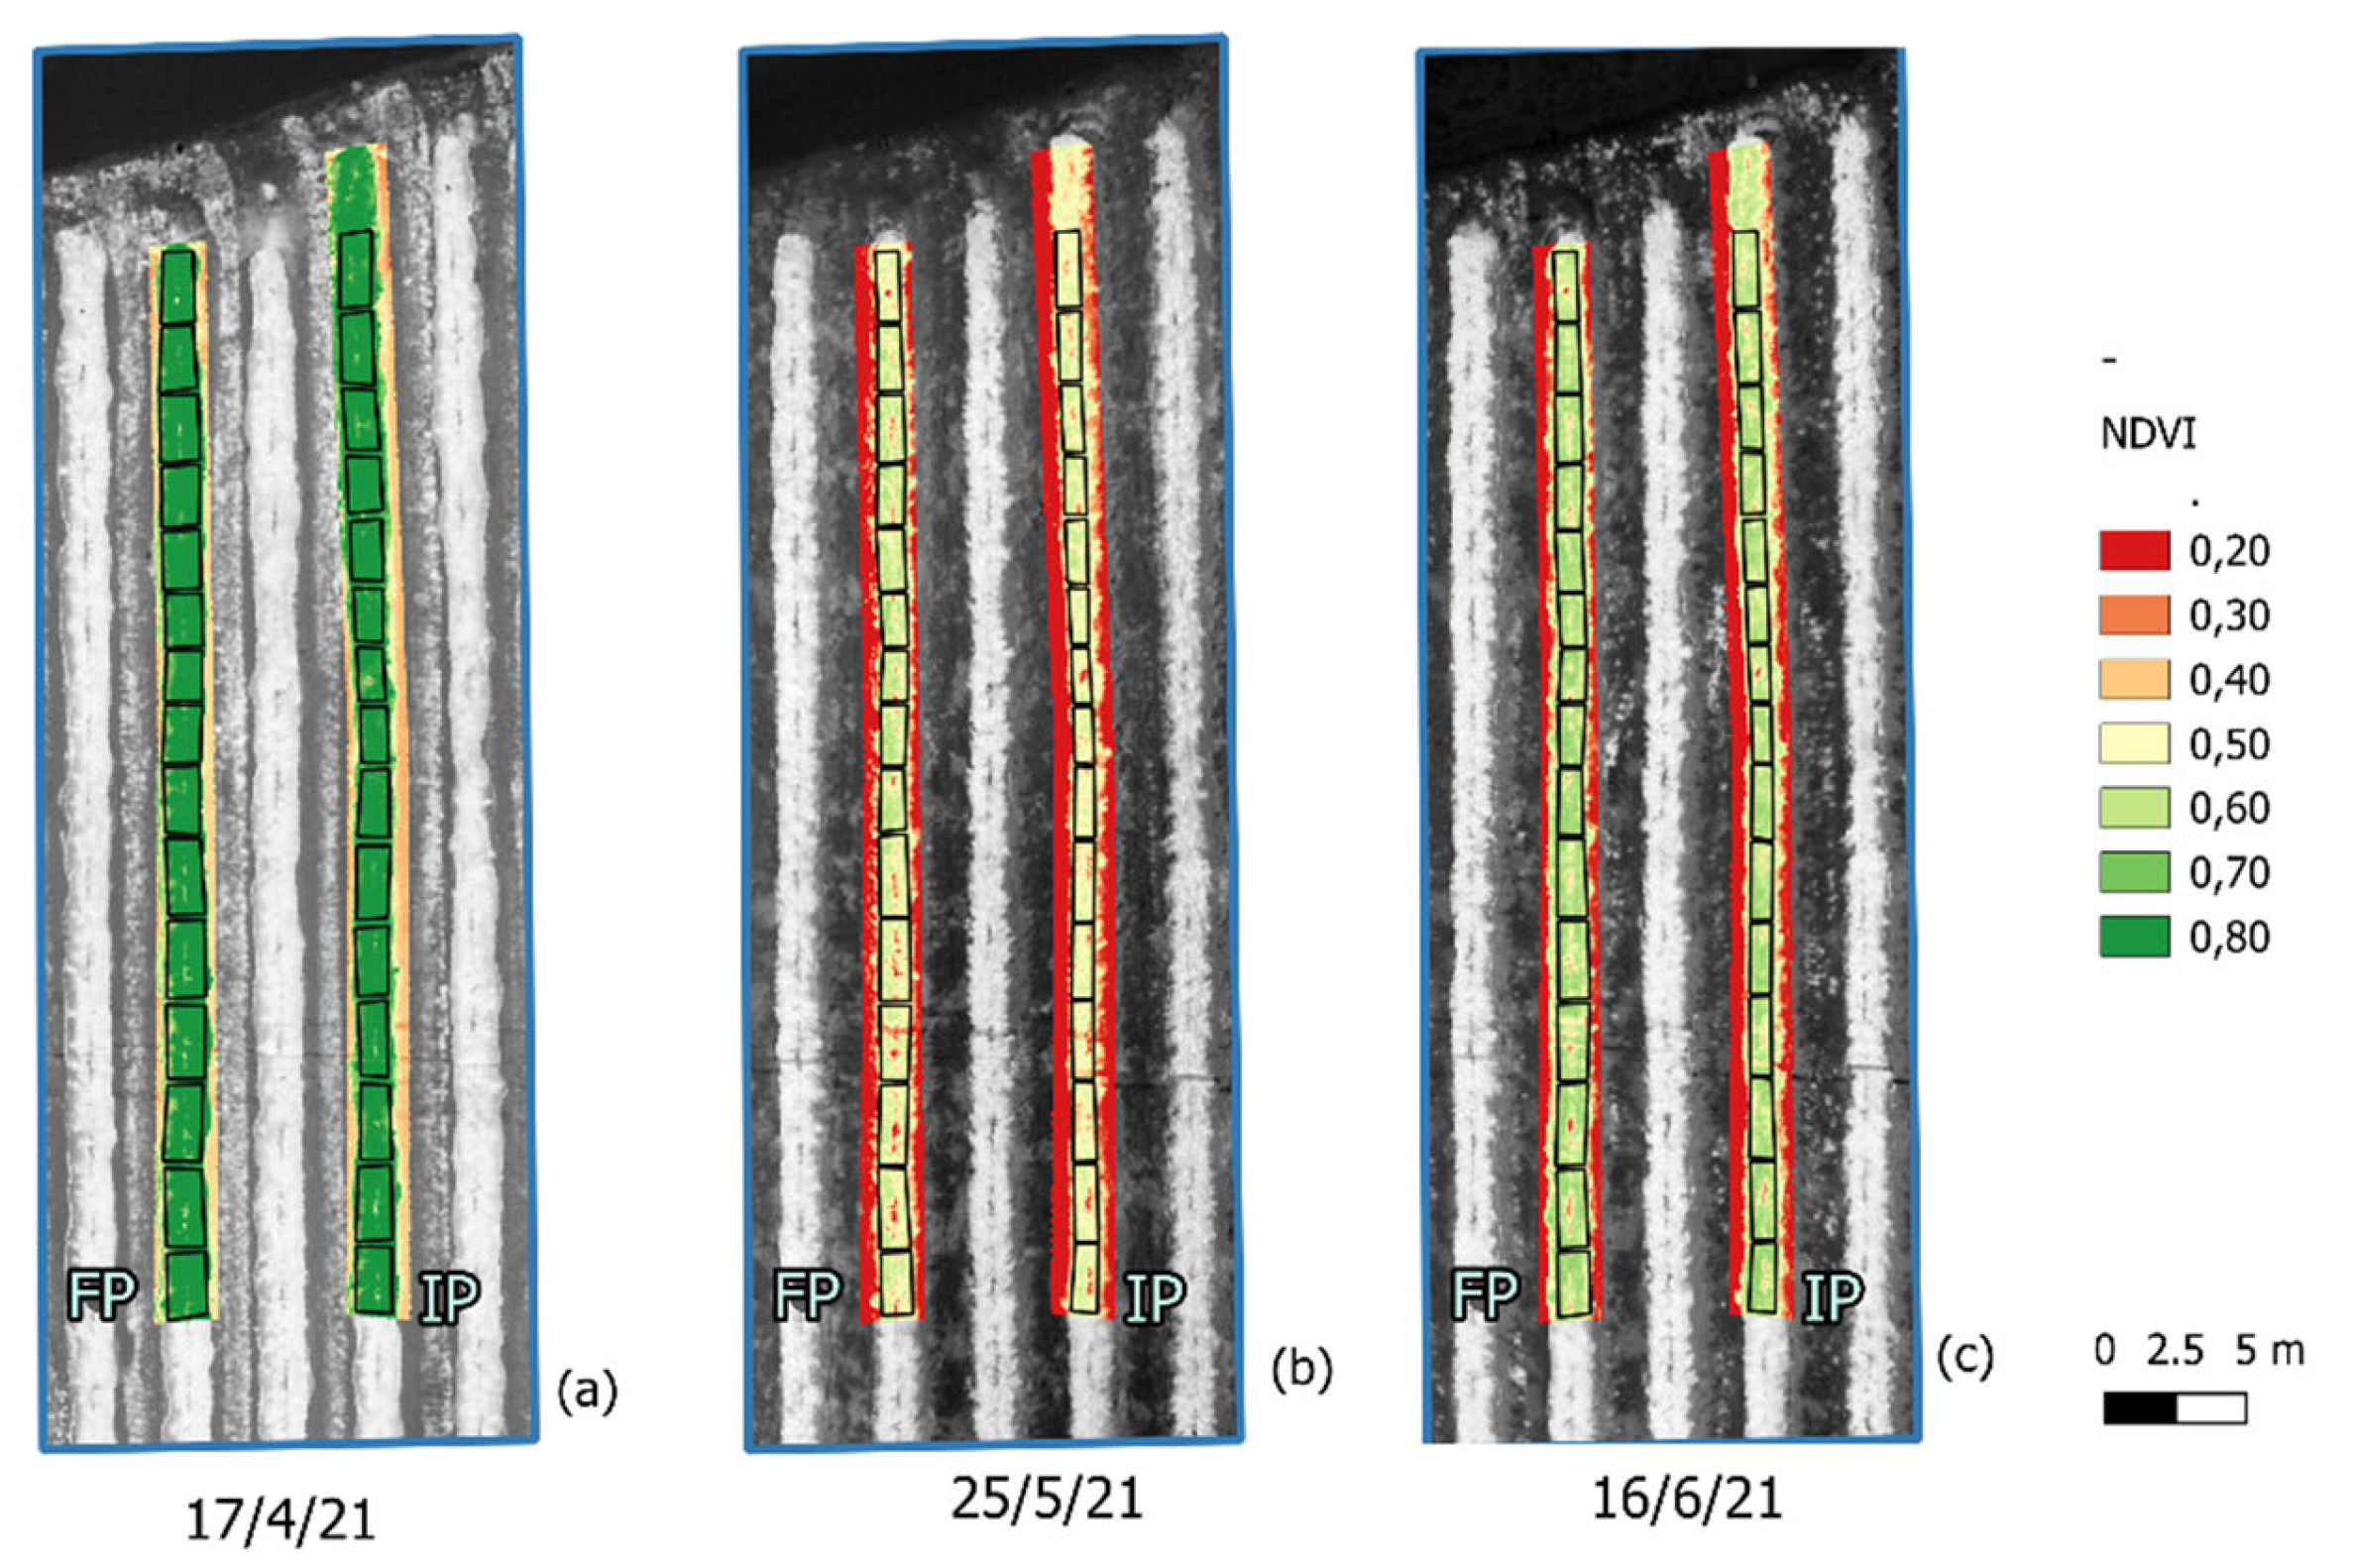

Table 1.
FAO 66 Kc and modified Kc for the irrigation period 2021.
| Harvest date | 1 - 15 April | 16 - 30 April | 1 - 15 May | 15 - 31 May | 1 - 15 June | 16 - 30 June | 1 July - 15 Aug. | 16 - 31 Aug. | 1 - 30 Sept. | |
|---|---|---|---|---|---|---|---|---|---|---|
| FAO 66 Kc | Early August | 0.3 | 0.5 | 0.7 | 0.8 | 0.85 | 0.9 | 0.9 | 0.7 | 0.55 |
| Modified Kc | Early August | 0.3 | 0.5 | 0.7 | 0.7 | 0.7 | 0.9 | 0.9 | 0.7 | 0.55 |
Table 2.
Irrigated water and real crop water needs, and total water saving during the irrigation period of 2021.
Table 2.
Irrigated water and real crop water needs, and total water saving during the irrigation period of 2021.
| Irrigation period | Trees per ha |
(FP) Irrigated water per tree (m3) |
(IP) Real water needs per tree (m3) |
(FP) Irrigated water (mm) |
(IP) Real water requirements (mm) |
Total water saving (%) |
|---|---|---|---|---|---|---|
| 10/5-10/9 | 880 | 6.1 | 5.1 | 537.7 | 452.8 | 15.8 |
Table 3.
Canopy temperature (Tc) and Crop Water Stress Index (CWSI) for FP and IP treatments.
| Date | Treatment | Position | Tc (oC) |
CWSI |
|---|---|---|---|---|
| 14/6/21 | FP | Up | 30.3c1 | 0.512b |
| Down | 30.9c | 0.546ab | ||
| IP | Up | 30.8c | 0.580a | |
| Down | 30.1c | 0.544ab | ||
| 28/7/21 | FP | Up | 34.9ab | 0.379d |
| Down | 35.2a | 0.446c | ||
| IP | Up | 34.2b | 0.506b | |
| Down | 34.9ab | 0.543ab | ||
| Sig. | Treatment | *** | *** | |
| Position | NS | * |
1 Different letters at each value indicate significant differences at p ≤ 0.05 according to the Tukey test (n=10).
Table 4.
Leaf mass per area (LMA), leaf dry matter (DM), chlorophyll a (Chla), chlorophyll b (Chlb), total chlorophyll (TChl) and chlorophyll a/chlorophyll b ratio (Chla/Chlb) of the leaves of the FP and IP treatments in 14/6/21 and 28/7/21.
Table 4.
Leaf mass per area (LMA), leaf dry matter (DM), chlorophyll a (Chla), chlorophyll b (Chlb), total chlorophyll (TChl) and chlorophyll a/chlorophyll b ratio (Chla/Chlb) of the leaves of the FP and IP treatments in 14/6/21 and 28/7/21.
| Date | Treatment | LMA (g m-2) |
DM (%) |
Chla (mg m-2) |
Chlb (mg m-2) |
TChl (mg m-2) |
Chla/ Chlb |
|---|---|---|---|---|---|---|---|
| 14/6/21 | FP | 10,5b1 | 43,4c | 489a | 134a | 623a | 3,66 |
| IP | 10,3b | 43,5c | 423b | 117b | 540b | 3,63 | |
| 28/7/21 | FP | 10,5b | 47,0b | 421b | 114b | 535b | 3,72 |
| IP | 11,2a | 49,1a | 370c | 100c | 470c | 3,71 | |
| Sig. | Date | ** | *** | *** | *** | *** | NS |
| Treatment | * | *** | *** | *** | *** | NS |
1 Different letters at each irrigation practice indicate significant differences at p ≤ 0.05 according to the Tukey test (n=6).
Table 5.
Total phenolic content, antioxidant activity with DPPH and FRAP assay and proline content of the leaves of the FP and IP treatments.
Table 5.
Total phenolic content, antioxidant activity with DPPH and FRAP assay and proline content of the leaves of the FP and IP treatments.
| Date | Treatment | Total polyphenolic content (mg gallic acid / g) |
Antioxidant activity DPPH (μmol ascorbic acid / g) |
Antioxidant activity FRAP (μmol ascorbic acid / g) |
Proline content (mg / 100 g) |
|---|---|---|---|---|---|
| 14/6/21 | FP | 4.15b1 | 10.58c | 19.2c | 2.76c |
| IP | 3.96b | 7.80d | 15.9d | 2.01d | |
| 28/7/21 | FP | 5.57a | 17.72a | 23.3a | 6.70b |
| IP | 5.31a | 15.10b | 21.4b | 8.23a | |
| Sig. | Date | *** | *** | *** | *** |
| Treatment | NS | *** | *** | *** |
1 Different letters at each irrigation practice indicate significant differences at p ≤ 0.05 according to the Tukey test (n=6).
Table 6.
Leaf physiological parameters, stomatal conductance (gs), photosynthetic rate (A) and transpiration rate (E) of trees of the FP and IP treatments in 14/6/21 and 28/7/21.
Table 6.
Leaf physiological parameters, stomatal conductance (gs), photosynthetic rate (A) and transpiration rate (E) of trees of the FP and IP treatments in 14/6/21 and 28/7/21.
| Date | Treatment | Time | gs (mol m-2 s-1) |
A (μmol m-2 s-1) |
E (mmol m-2 s-1) |
|---|---|---|---|---|---|
| 14/6/21 | FP | 10:30 | 0.229b1 | 15.6a | 5.72c |
| 11:30 | 0.214b | 14.2a | 7.26b | ||
| IP | 10:30 | 0.187c | 13.0b | 5.66c | |
| 11:30 | 0.154c | 11.9b | 5.64c | ||
| 28/7/21 | FP | 10:30 | 0.236b | 12.2b | 7.65b |
| 11:30 | 0.278a | 13.3b | 8.92a | ||
| IP | 10:30 | 0.223b | 13.7ab | 7.99b | |
| 11:30 | 0.252ab | 12.2b | 8.56ab | ||
| Sig. | Date | ** | * | *** | |
| Treatment | * | * | ** | ||
| Time | * | * | *** |
Disclaimer/Publisher’s Note: The statements, opinions and data contained in all publications are solely those of the individual author(s) and contributor(s) and not of MDPI and/or the editor(s). MDPI and/or the editor(s) disclaim responsibility for any injury to people or property resulting from any ideas, methods, instructions or products referred to in the content. |
© 2026 by the authors. Licensee MDPI, Basel, Switzerland. This article is an open access article distributed under the terms and conditions of the Creative Commons Attribution (CC BY) license (http://creativecommons.org/licenses/by/4.0/).
Copyright: This open access article is published under a Creative Commons CC BY 4.0 license, which permit the free download, distribution, and reuse, provided that the author and preprint are cited in any reuse.