

Submitted:
16 July 2026
Posted:
16 July 2026
You are already at the latest version
Abstract
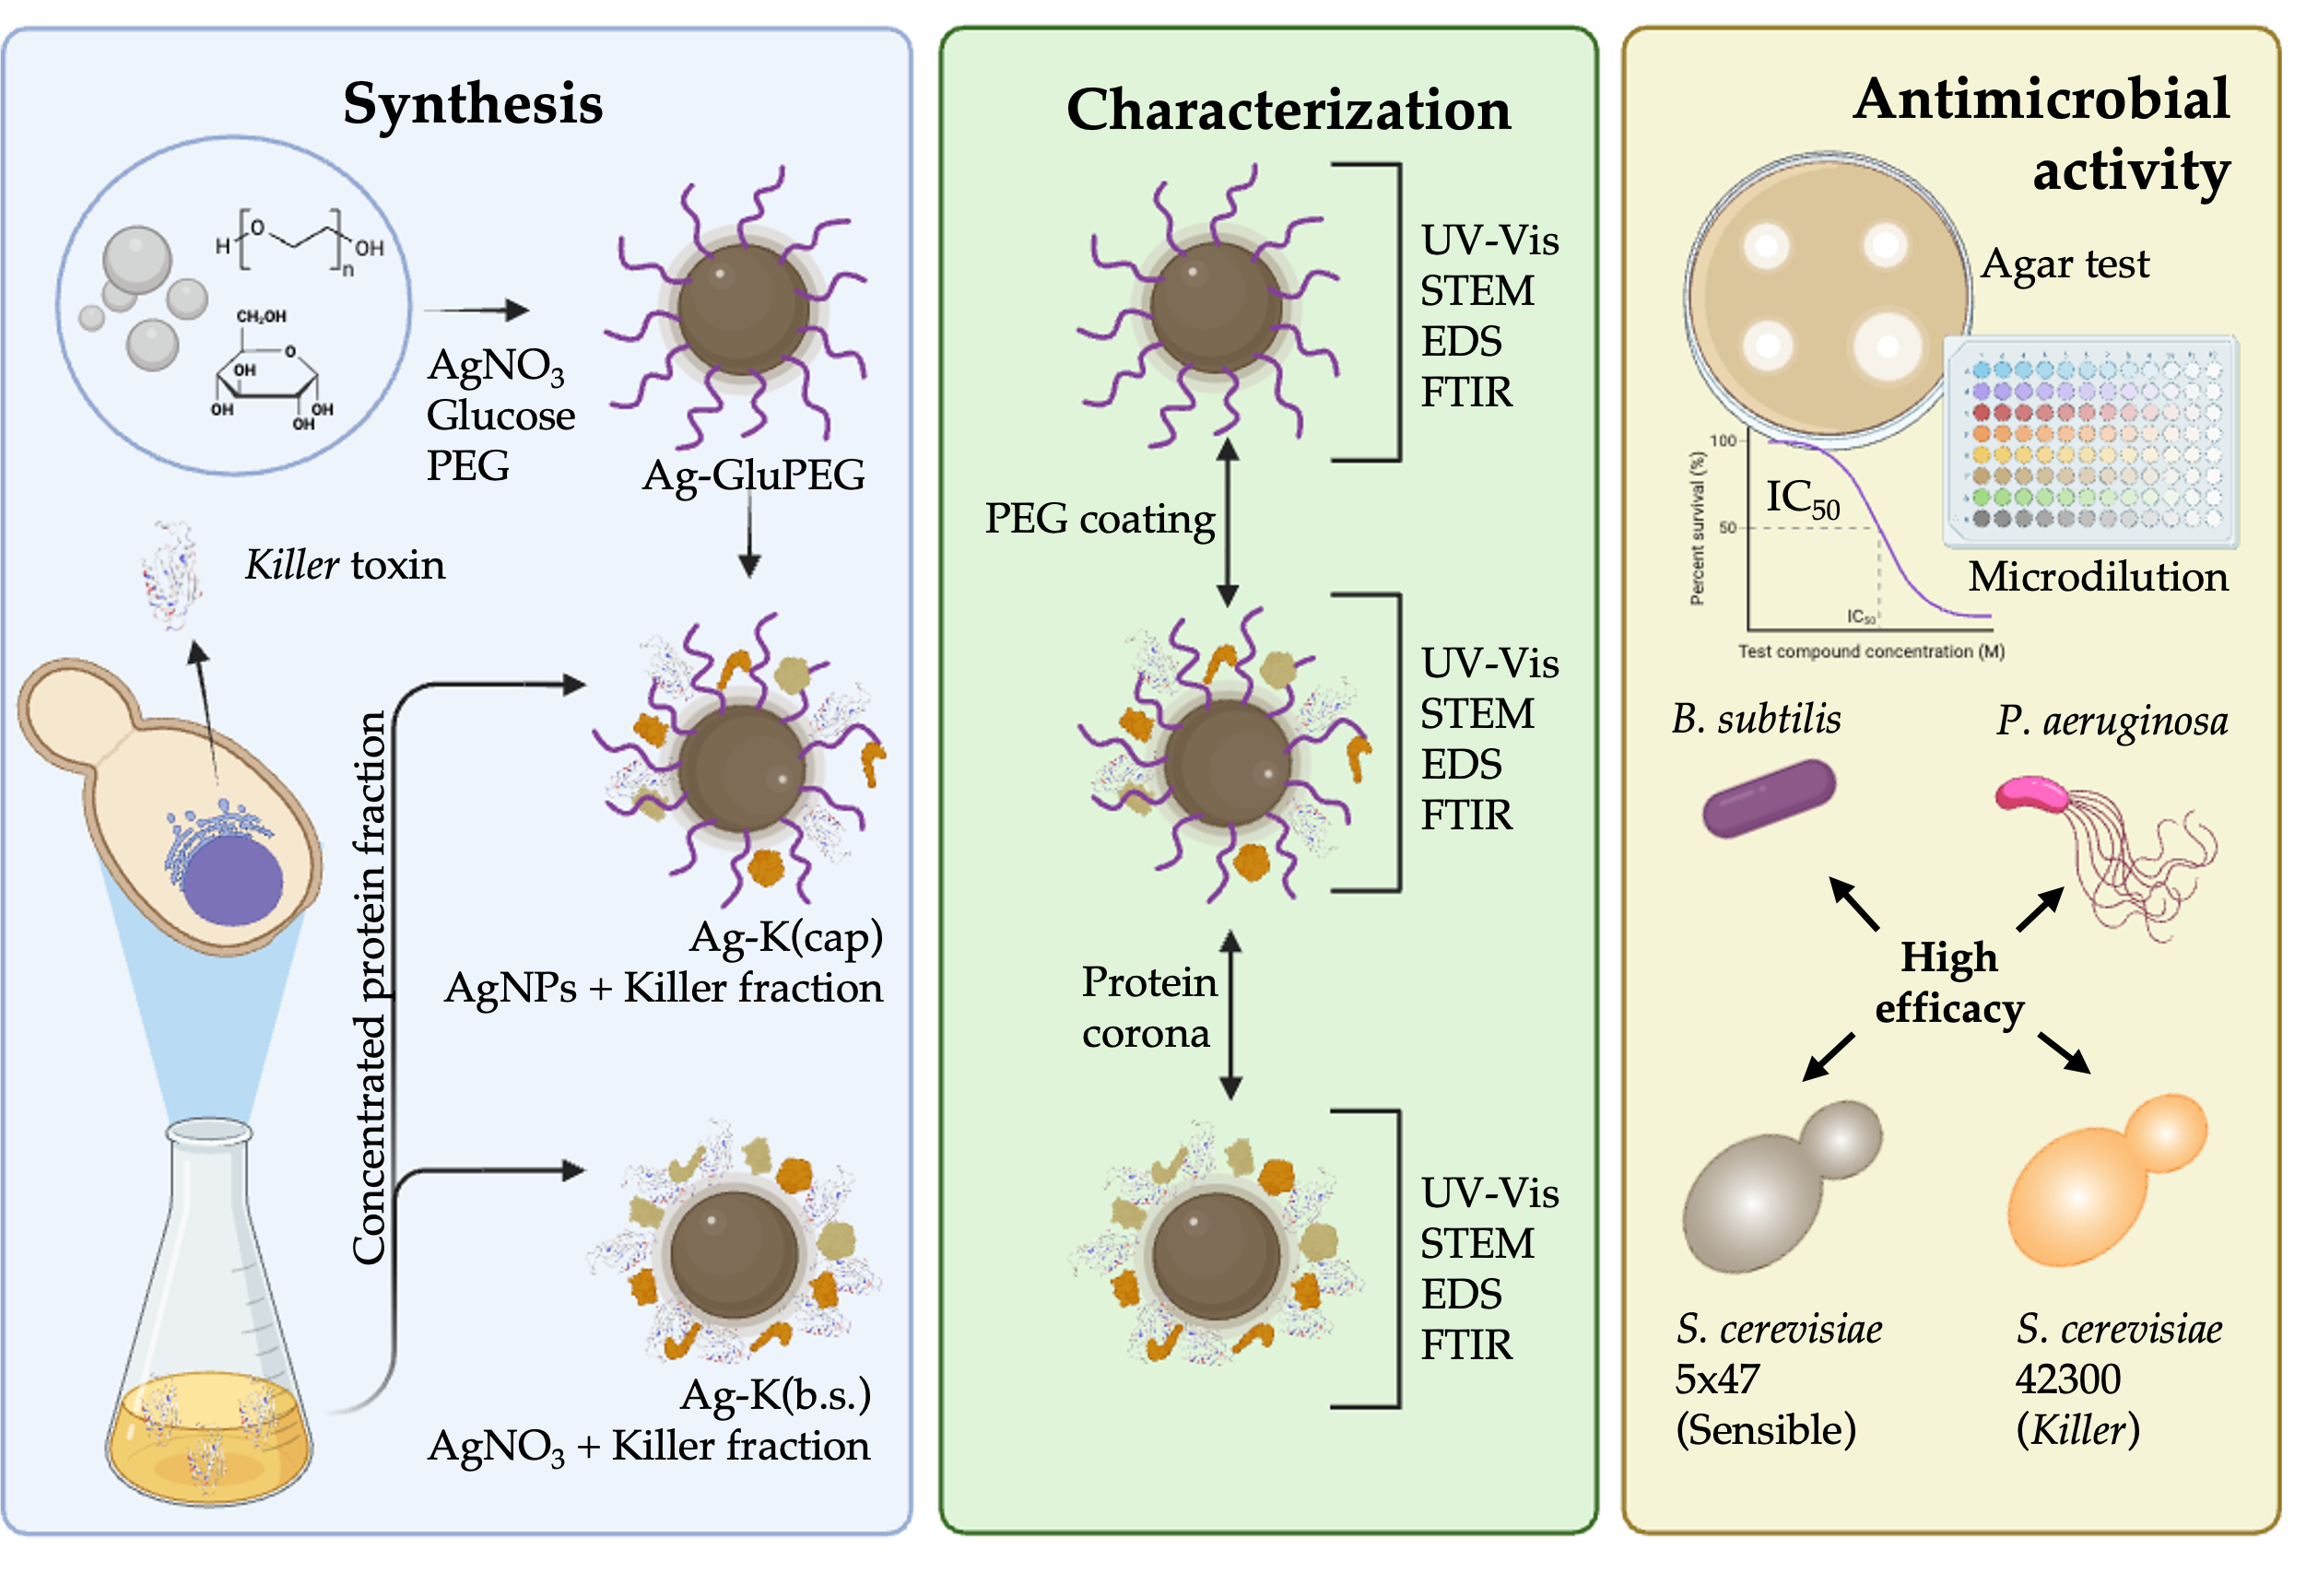
Recently, novel nanobiotechnological approaches have been developed to reduce the impact of pollutants during the synthesis of nanoparticles (NPs). To do so, green synthesis methods have now become widely adopted, using biomolecules to produce high-quality, stable nanoparticles. In this work, we employed the K1 toxin produced by S. cerevisiae as a reducing and capping agent for silver nanoparticles. The synthesis of Ag-K1 NPs was carried out using a concentrated protein fraction from the culture medium of S. cerevisiae 42300 containing the secreted K1 toxin. The obtained nanoparticles were characterized using UV-Vis spectroscopy, STEM, EDS, and FTIR, and the antimicrobial efficacy was determined against S. cerevisiae, P. aeruginosa, and B. subtilis. The synthesized NPs showed high antimicrobial efficacy, killing all tested strains; additionally, dose-response modeling suggested differential activity among the nanoparticles. This work reports, for the first time, the biosynthesis and antimicrobial characterization of silver nanoparticles associated with K1 killer toxin-containing protein fractions.
Keywords:
green synthesis
; killer toxin
; AgNPs
; antimicrobials
; protein corona
; Saccharomyces cerevisiae
1. Introduction
Nanotechnology has become a major driver of technological advances across multiple disciplines. One of the most promising branches in the field is nanobiotechnology, which integrates nanomaterials with biological systems to create compounds and tools to understand biological phenomena [1]. The combination of environmentally friendly synthetic approaches with highly efficient nanoparticle synthesis offers effective alternatives with biological uses, while reducing the impact of pollutants during the synthesis [2,3]. Accordingly, considerable efforts have been devoted to designing nanocomposites that combine biosafety with high biological performance. Here, we developed a silver nanoparticles-based system. Silver (Ag) is commonly used in food safety and biomedical applications [4]. To date, the application of the K1 killer toxin of S. cerevisiae as a capping agent for NPs has not yet been explored, opening a new avenue for research in this field.
The killer phenotype of Saccharomyces cerevisiae has been extensively investigated because of the potent antimicrobial activity mediated by its secreted killer toxins. Nowadays, it is known that the origin of this phenotype is the secretion of a toxic peptide coded in the virus M1, a satellite of the Totivirus L-A [5,6]. The M1 virus contains a single ORF (Open Reading Frame) of 964 bp, which encodes a preprotoxin (pptox) of four domains: δ, α, γ, and β. During the maturation of the peptide, the subunit γ is glycosylated and both δ and γ are removed in the ER (Endoplasmic Reticulum) by the peptidases Kex1p and Kex2p [7]. The final product is a mature K1 killer toxin, a 36 kDa heterodimer α-β stabilized by a disulfide bond [8,9,10]. Previous studies have demonstrated that the lethal activity of K1 on sensitive cells (Non-producers of killer toxins) is related to the α subunit, acting as an ionophore or altering the stability of the potassium channel Tok1p [11,12,13,14,15]. Meanwhile, it has been proven that the principal receptor of this toxin is the β-1-6-D-Glucan of the cell wall and the receptor Kre1p, a cell surface O-glycoprotein [16,17]. Beyond their antimicrobial properties, yeasts have also emerged as efficient biological platforms for the green synthesis of metallic nanoparticles. To date, Killer strains have not been used to produce any nanoparticles; however, other yeasts have previously been used to produce NPs from several precursors like Ag, Au, and Fe [18,19,20,21,22,23]. Despite these advances, no previous study has explored the use of killer yeast strains or killer toxin-containing protein fractions for the biosynthesis or functionalization of silver nanoparticles, representing an important knowledge gap in the development of biologically functionalized antimicrobial nanomaterials. In this study, we investigated the biosynthesis and surface conjugation of silver nanoparticles using killer toxin-containing protein fractions obtained from S. cerevisiae. The resulting nanomaterials were physiochemically characterized and evaluated for their antimicrobial activity against bacterial and yeast models. We further analyzed their inhibitory potency by MIC determination and dose-response modeling to elucidate the contribution of the protein corona to their biological activity.
2. Materials and Methods
2.1. Reagents
Silver nitrate (AgNO3, ACS grade; Karal S.A. de C.V., León, Mexico) used for nanoparticle synthesis was kindly provided by Dr. Pedro Salas-Castillo (UNAM). Polyethylene glycol 3350 (PEG 3350, ACS grade; Sigma-Aldrich, St. Louis, MO, USA), D-(+)-glucose (ACS grade; Sigma-Aldrich), and ethanol (Sigma-Aldrich) were used as received; for culture media, peptone (Merck KGaA, Darmstadt, Germany), yeast extract (BD DIFCO, México City, México), KH2PO4 A.C.S. (Macron Fine Chemicals, Avantor Performance Materials, S.A. de C.V. Xalostoc, Edo. De Méx. México), Citric acid A.C.S. (Macron Fine Chemicals), Agar (BD DIFCO, México City, México) and for bacterial culture, LB broth (Sigma-Aldrich). For PBS buffer, NaCl (Reasol, México), KCl (Macron Fine Chemicals), Na2HPO4 (J.T. Baker, Mallinckrodt Baker S.A. de C.V. Xalostoc, Edo. De Méx. México), and KH2PO4 (J.T. Baker) were used. All reagents were prepared with triple-distilled water with no further purification; meanwhile, the culture media were sterilized at 121°C for 20 min in an autoclave (AV-3070, Prendo. SEVMÉXICO).
2.2. Strains and Culture Media
The S. cerevisiae strain 42300 (Killer; MAT α Ade2/+ Thr1/+ sKi2-1/+ [KIL-K1]) (ATCC 1382) and a sensitive yeast strain 5x47 (MATa/α his1/+ trp1/+ ura3/+ [K10 K20 K280 Klus0]) (ATCC 38527) were maintained on YPD broth (1% Yeast Extract, 2% Peptone, 2% Glucose, 0.1 M KH2PO4, pH 4.7 adjusted with citric acid) at 30 °C with continuous shaking for 24 hrs. B. subtilis strain PY79 (kindly provided by Dr. Juan Campos Guillén, FQ, UAQ), and P. aeruginosa strain 575 (Resistant to imipenem and meropenem) (Donated by Dr. José Antonio Cervantes Chávez, FCN, UAQ) were maintained on LB broth at 37 °C with continuous shaking for 24 hrs.
2.3. Killer toxin induction and concentration
K1 secretion was induced by adding 0.1 g of sensitive yeast per gram of killer yeast to a 50 mL fresh YPD broth (pH 4.7). Cultures were incubated at 30 o C, with continuous shaking for 24 hrs. The culture was centrifuged at 5000 rpm for 10 min, the supernatant was filtered 0.22 μm filter, (Milipore) and concentrated with a 10 kDa column (Briscale UF-15, Cobetter, China) [24]. The resulting killer-concentrated protein fraction (Kcpf) was stored at 4 °C until further use.
2.4. Synthesis of Ag nanoparticles
2.4.1. Synthesis of AgNPs with glucose and PEG
Ag-GluPEG nanoparticles were synthesized under continuous stirring and heating following a modified glucose reduction method. In a typical reaction, 2 mM of AgNO3 was dissolved in 8.5 mL of distilled water and heated to boiling for 30 min. Subsequently, PEG 3350 (1 % w/v) and D-(+)-Glucose (0.5-300 mM) were added, and the volume adjusted to 10 mL with distilled water. The reaction mixture was maintained under same conditions for an additional 30 min until a brownish-yellow color develop, indicating nanoparticle formation. The NPs were allowed to cool down at room temperature in the dark overnight and then centrifuged at 13,000 rpm for 20 min, washed 2 times with absolute ethanol and 2 times with sterile water. The pellet was then resuspended in PBS pH 7.4 and stored at 4 °C until use.
2.4.2. Conjugation of AgNPs with Kcpf
Freshly synthesized Ag-GluPEG NPs were conjugated with Kcpf obtained from the previous culture to generate the Ag-Kcap preparation. The conjugation was carried out by passive adsorption, mixing 1 volume of freshly prepared Ag-GluPEG NPs with 1 volume of Kcpf. This mixture was incubated at room temp under indirect light for 3 days until the suspension changed from light yellow to golden brown.
2.4.3. Biosynthesis of Ag nanoparticles with Kcpf
Ag-Kbs nanoparticles were biosynthesized by mixing AgNO3 (2 mM) with 10 mL of Kcpf. As with the Ag-Kcap preparation, the reaction mixture was incubated at room temperature under indirect light for 3 days until the color changed from light golden to brownish amber. Both capped and biosynthesized NPs were washed with ethanol, resuspended in PBS (pH 7.4), and stored at 4 °C until further use.
2.5. Characterization of Ag NPs
Nanoparticles characterization was performed by UV-Vis spectroscopy using the VarioSkan ® Flash (Thermo Scientific, Waltham, MA, USA) operating in spectrophotometric mode at the Proteogenomic Unit, Instituto de Neurobiología, Juriquilla, UNAM, México. The absorbance spectrum was recorded from 200 to 600 nm with a resolution of 2 nm. Several sample dilutions were prepared to obtain optimal absorbance signals within the linear detection range of the instrument. The particle size distribution, elemental composition, and morphology were measured by High Resolution Scanning Transmission Electron Microscopy (HR-STEM) and Energy Dispersive X-ray Spectroscopy (EDS) (Hitachi SU8230, Tokyo, Japan, Microscopy unit, Centro de Física Aplicada y Tecnología Avanzada, UNAM, México). The functional groups present on the AgNPs were detected by Fourier-transform infrared (FTIR) spectroscopy over the spectral range of 600 to 4000 cm-1 using a Perkin-Elmer Spectrum Two spectrometer (Waltham, MA, United States. CFATA Juriquilla, UNAM, México). All analyses were perfomed in triplicate; the UV-Vis spectral analysis was graphed using GraphPad Prism 10 (GraphPad Software, San Diego, CA, USA), the FTIR spectra were analyzed in Origin, and the TIFF-converted images were analyzed in ImageJ software (NIH, USA).
2.6. Antimicrobial activity
To determine the effectiveness of the AgNPs, agar well diffusion assays were performed using S. cerevisiae 5x47, S. cerevisiae 42300, P. aeruginosa strain 757, and B. subtilis strain PY79. Bacterial strains were cultured in LB broth for 24 h, and the inoculant was adjusted to an optical density of OD600 = 0.5 before antimicrobial testing. Antimicrobial activity was evaluated using the agar well diffusion method by measuring the inhibition zones produced by each nanoparticle preparation. The wells were formed by drilling the agar with a sterile 200 μL pipette tip. All microorganisms were inoculated on YPD agar, and 50 μL of each nanoparticle preparation were tested. After 24 hrs., all the plates were photographed to measure inhibition zones. The inhibition area was calculated by subtracting the area of the agar well from the total inhibition halo area. The inhibition halos were analyzed using GraphPad Prism 10 using one-way ANOVA.
2.7. MIC determination and IC50 modelling
Minimum inhibitory concentration (MIC) values were determined by a two-fold serial microdilution assay performed in sterile 96-well plates as previously described [25]. Briefly, 300 μL of each nanoparticle preparation at the highest concentration was added to the first well of the plate. Two-fold serial dilutions were prepared by transferring 150 μL into 150 μL of fresh YPD medium until the final dilution was reached. After the last transfer, 150 μL was discarded from the final well to maintain equal volumes throughout the plate. Each well was inoculated with 5 μL of microbial inoculum at OD600 = 0.08. The plate was then incubated overnight at 37 °C. MIC values were defined as the lowest nanoparticle concentration at which no visible microbial growth was observed. Additionally, the absorbance at 600 nm was recorded to quantify microbial growth at each nanoparticle concentration.
Absorbance values obtained from the MIC assays were normalized and fitted using a nonlinear dose-response model. Heatmaps were generated in BioRender, whereas dose-response curves and IC50 values were calculated using GraphPad Prism 10 (GraphPad Software, San Diego, CA, USA).
3. Results and Discussion
3.1. UV-Visible and morphological characterization of AgNPs.
The synthesized AgNPs exhibited a characteristic surface plasmon resonance (SPR) band in the UV–Vis spectra (Figure 1), between 380 and 400 nm, confirming the successful formation of silver nanoparticles. Furthermore, the concentration of the reducing agent markedly influenced the SPR profile and, consequently, the nanoparticle synthesis process. Several studies have reported the use of glucose as both a reducing and stabilizing agent during silver nanoparticle synthesis [26,27,28]. In our study, increasing the glucose concentration enhanced the intensity of the SPR band. As shown in Figure 1A, the highest absorbance was obtained using 300 mM glucose and 2 mM AgNO3. Interestingly, the signal of those reactions tends to oscillate over time, and when the reactions were carried out for 30 min, they show a stronger SPR signal, reaching a single, well-defined peak at 390-400 nm. However, when the reactions were carried out for 60 min, the SPR showed a lower peak and increased again at 90 and 120 min Notably, the maximum absorbance at 120 min did not reach the initial peak observed at 30 min (Figure 1A). These results confirm the presence of a typical AgNPs signal commonly reported around 400 nm on yeast assisted synthesis [19,29,30,31]. By contrast, when the NPs were biosynthesized with the Kcpf, the SPR of the AgNPs was significantly increased, and a secondary peak appeared at 280 nm (Figure 1B). This can be attributed to the absorbance of aromatic amino acids such as tryptophan and tyrosine, which mainly contribute to the absorbance spectra of protein samples [32]. Previous reports have demonstrated the usage of UV-Vis spectroscopy for the analysis of complex protein formulations, highlighting signals related to the aromatic amino acids in the region between 260-300 nm [33,34,35]. In our system, the yeast produces and secretes killer toxin, which is the main protein into the media [36], contributing to the absorbance in the aromatic region of the synthesized nanoparticles. Remarkably, the capped nanoparticles showed an increased signal around 270 nm and an increase in the 400 nm signal compared to the non-capped nanoparticles. This behavior may be related to the protein decoration and an increase in the NP concentration.
The morphology of the synthesized nanoparticles differed markedly among the different preparations. AgNPs synthesized using glucose and PEG exhibited the most homogeneous particle size distribution, with an average diameter of 18.4 ± 6.3 nm. In comparison, Ag-Kbs and Ag-Kcap displayed larger average particle sizes of 20.7 ± 5.6 nm and 25.0 ± 16.6 nm, respectively. According to already reported evidence, the use of PEG as a capping agent forming a uniform coating that can be visualized by high-resolution transmission electron microscopy (HR-TEM) [37,38,39,40]. Consistent with these reports, a well-defined surface coating was observed surrounding the glucose/PEG-synthesized AgNPs (Figure 2A). As expected, the same surface coating was also observed in Ag-Kcap nanoparticles after conjugation with Kcpf In both preparations, the PEG coating exhibited an average thickness of 29.9 ± 7.4 nm, which is consistent with previous reports for nanoparticles coated with PEG 2000 [38,40] and PEG 4000 [37]. These observations support the reported relationship between PEG molecular weight and coating thickness [41]. Ag-Kbs nanoparticles exhibited a narrow particle size distribution, which may be attributed to the proteins present during the synthesis reaction. These proteins likely acted as stabilizing agents, promoting a more uniform nanoparticle population. As shown in Figure 2B, the nanoparticles are surrounded by a low electron-dense matrix, which is likely associated with protein aggregates derived from the killer protein fraction. A similar feature was observed in Ag-Kcap nanoparticles, where these protein aggregates were present in addition to the PEG coating (Figure 2C).
3.2. Elemental and functional characterization of AgNPs
The elemental composition of the AgNPs was determined by energy-dispersive X-ray spectroscopy (EDS) coupled to SEM. The analysis revealed differences between the biosynthesized and conjugated NPs. In all samples, a characteristic silver signal was detected at approximately 3 keV (kilo-electron volts), confirming the presence of AgNPs on all the samples [42,43]. However, the conjugated AgNPs exhibited additional nitrogen signals, which may be associated with nitrogen-containing organic components from the coating layer or, alternatively, with residual precursor-derived species. In contrast, nitrogen signals were not detected in biosynthesized AgNPs, suggesting an efficient conversion of the silver precursor during the biosynthetic process (AgNO3). The analysis also revealed carbon signals, which are commonly associated with the carbon-coated support grid used for SEM-EDS measurements. Additionally, signals corresponding to Na, Mg, Si, K, P, S, and Cl were detected, with marked differences between biosynthesized and conjugated AgNPs (Figure S1). Trace elements such as Mg and Si have previously been reported in EDS analyses of nanomaterials [44]. The presence of Na and other non-metal elements may be related to residual components from the yeast culture system, including extracellular biomolecules and inorganic ions derived from the growth medium. These differences may reflect the influence of the biological synthesis process and the chemical environment provided by yeast-derived components [45].
To identify functional groups associated with the organic coating of AgNPs, Fourier-transform infrared spectroscopy (FTIR) analysis was performed (Figure 3). The spectra obtained for glucose- and PEG-functionalized AgNPs showed characteristic bands associated with PEG and carbohydrate-derived molecules. The band observed at 1475 cm−1 was assigned to asymmetric C–H bending vibrations, whereas the signals detected at 1123, 1158, and 1163 cm−1 were consistent with C–O–C stretching vibrations from PEG chains [46]. Additionally, a signal at 998 cm−1 was associated with C–O vibrations from carbohydrate structures [47], while the band detected at 661 cm−1 was attributed to Ag–nonmetal interactions. Previous studies describing AgNPs synthesized using glucose and PEG 3350 reported characteristic glucose-associated signals at 3246 cm−1 (O–H), 2901 cm−1 (C–H), 998 cm−1 (C–O–H/C–O–C), and bands ranging from 1145 to 554 cm−1 corresponding to C–O and C–C vibrations. PEG 3350-associated signals were reported at 3441 cm−1 (O–H), 2878 cm−1 (C–H), 1464 cm−1 (C–H bending), 1279 cm−1, and 1094 cm−1 (O–H and C–O–C vibrations) [48]. In agreement with these previous reports, our spectra showed comparable absorption bands with minor shifts, supporting the presence of PEG and glucose-derived residues associated with the nanoparticle surface. These findings suggest the formation of an organic coating layer that may contribute to nanoparticle stabilization.
For biosynthesized AgNPs obtained using Kcpf, the FTIR spectrum showed characteristic absorption bands associated with protein- and carbohydrate-derived functional groups. Signals detected at 3499, 3254, and 2974 cm−1 were assigned to O–H/N–H and C–H stretching vibrations, respectively [49,50,51]. Additionally, intense bands at 1636 and 1532 cm−1, together with signals between 1400 and 1200 cm−1, were associated with amide I, amide II, and amide III vibrations, respectively, indicating the presence of protein-associated structures on the nanoparticle surface [52]. A signal at 1061 cm−1 was detected, which is consistent with C–O vibrations from carbohydrate residues derived from the YPD medium and yeast-associated polysaccharides [53]. Furthermore, the band observed at 677 cm−1 may be related to Ag–nonmetal interactions [54].
For Kcpf-conjugated AgNPs, the FTIR spectrum showed a profile similar to that observed for biosynthesized nanoparticles, including protein-associated bands at 3304, 2881, 1643, and 1534 cm−1, corresponding to O–H/N–H stretching, C–H vibrations, and amide-associated signals [55]. As expected, additional signals at 1453 and 1099 cm−1 were detected, which are consistent with PEG-associated vibrations. The carbohydrate-associated region, represented by a signal at 947 cm−1, was also observed. Moreover, the Ag–nonmetal interaction band was detected at approximately 667 cm−1, similar to that observed in glucose/PEG-functionalized AgNPs. The simultaneous presence of PEG, carbohydrate, and protein-associated signals suggests the formation of a mixed organic surface layer composed of PEG and Kcpf-derived biomolecules.
3.3. Antimicrobial effect of AgNPs.
The antimicrobial effect of the synthesized nanoparticles was analyzed by a well diffusion test on agar plates. The images were analyzed for inhibition zone determination by subtracting the area of the well from the total inhibition halo.
It has been previously reported that yeast-mediated AgNPs had significant antibacterial activity [56,57,58,59,60]. However, to date, there is no evidence reported of the usage of a killer strain for nanoparticle biosynthesis, and the effectiveness of a conjugated Metallic-Kcpf nanoparticle as a novel antimicrobial agent.
The results of the inhibition assays show an interesting behavior when the Kcpf is on the surface of the NP. The antimicrobial activity of the complex NP-Killer increases the inhibitory effect of the NP in comparison to the Ag-GluPEG (Figure 4). In this assay, it is compared the deadly effect of the different preparations of NPs over two bacterial strains: B. subtilis (Gram +) and P. aeruginosa (Gram -), and two yeast strains: S. cerevisiae 5x47 and S. cerevisiae 42300. Interestingly, all NPs demonstrate a strong antibacterial effect. In comparison, the Ag-Kbs and Ag-Kcap NPs had increased inhibitory activity against B. subtilis and yeast (P>0.05). However, for the case of P. aeruginosa, both Ag-GluPEG and Ag-Kcap nanoparticles showed similar effects, but the Ag-Kbs exhibited a higher effect on the inhibition of this strain.
For the case of yeast, it was expected to observe an increase in the inhibition according to the preparation, while those containing Kcpf would have higher activity in the sensitive strain due to the interaction of the killer toxin on the cell membrane. It is known that the interaction of the K1 killer toxin with the receptor β-1-6-D-Glucan, and the proteins Kre1p [16] and the potassium channel Tok1p [11,12] is key for the susceptibility of the cell to be killed by the killer toxin. In our killer-containing nanoparticles, we demonstrate an increase in the inhibition of the sensitive strain due to the interaction of the proteins involved in the killer system (P>0.01). For the other strain, and contrary to what we expected, the 42300 killer strain is more sensitive to the AgNPs, and when the Kcpf is present in the nanocomposite, the activity of this complex is highly increased (P<0.01). Furthermore, the activity of the Ag-GluPEG is lower than that of the NP-K for all the preparations tested. This effect can be related to the mechanism of action and the concentration of K1 of each NP. Also, the availability of K1 is increased when the NP carries it [61], allowing the toxin to interact more efficiently with the membrane of the cell, and increasing the mobilization of the toxin across it and/or to the interior of the cell. Previous studies have explored the basis of the immunity of the killer strain to its own toxin, remarking on the importance of the internal blockade of the channel Tok1p [11], and the interaction of the gamma subunit of the K1 pptox, when this subunit is removed by Kex1 and Kex2 from K1 pptox [10]. However, the immunity of the killer system 1 is poorly understood. Our data highlight the enhanced antimicrobial activity of the hybrid metal–protein nanocomposite, suggesting that the presence of Kcpf modifies nanoparticle–cell interactions and increases the susceptibility of killer yeast strains to AgNP-mediated inhibition.
3.4. Determination of MIC and IC50 values for AgNPs.
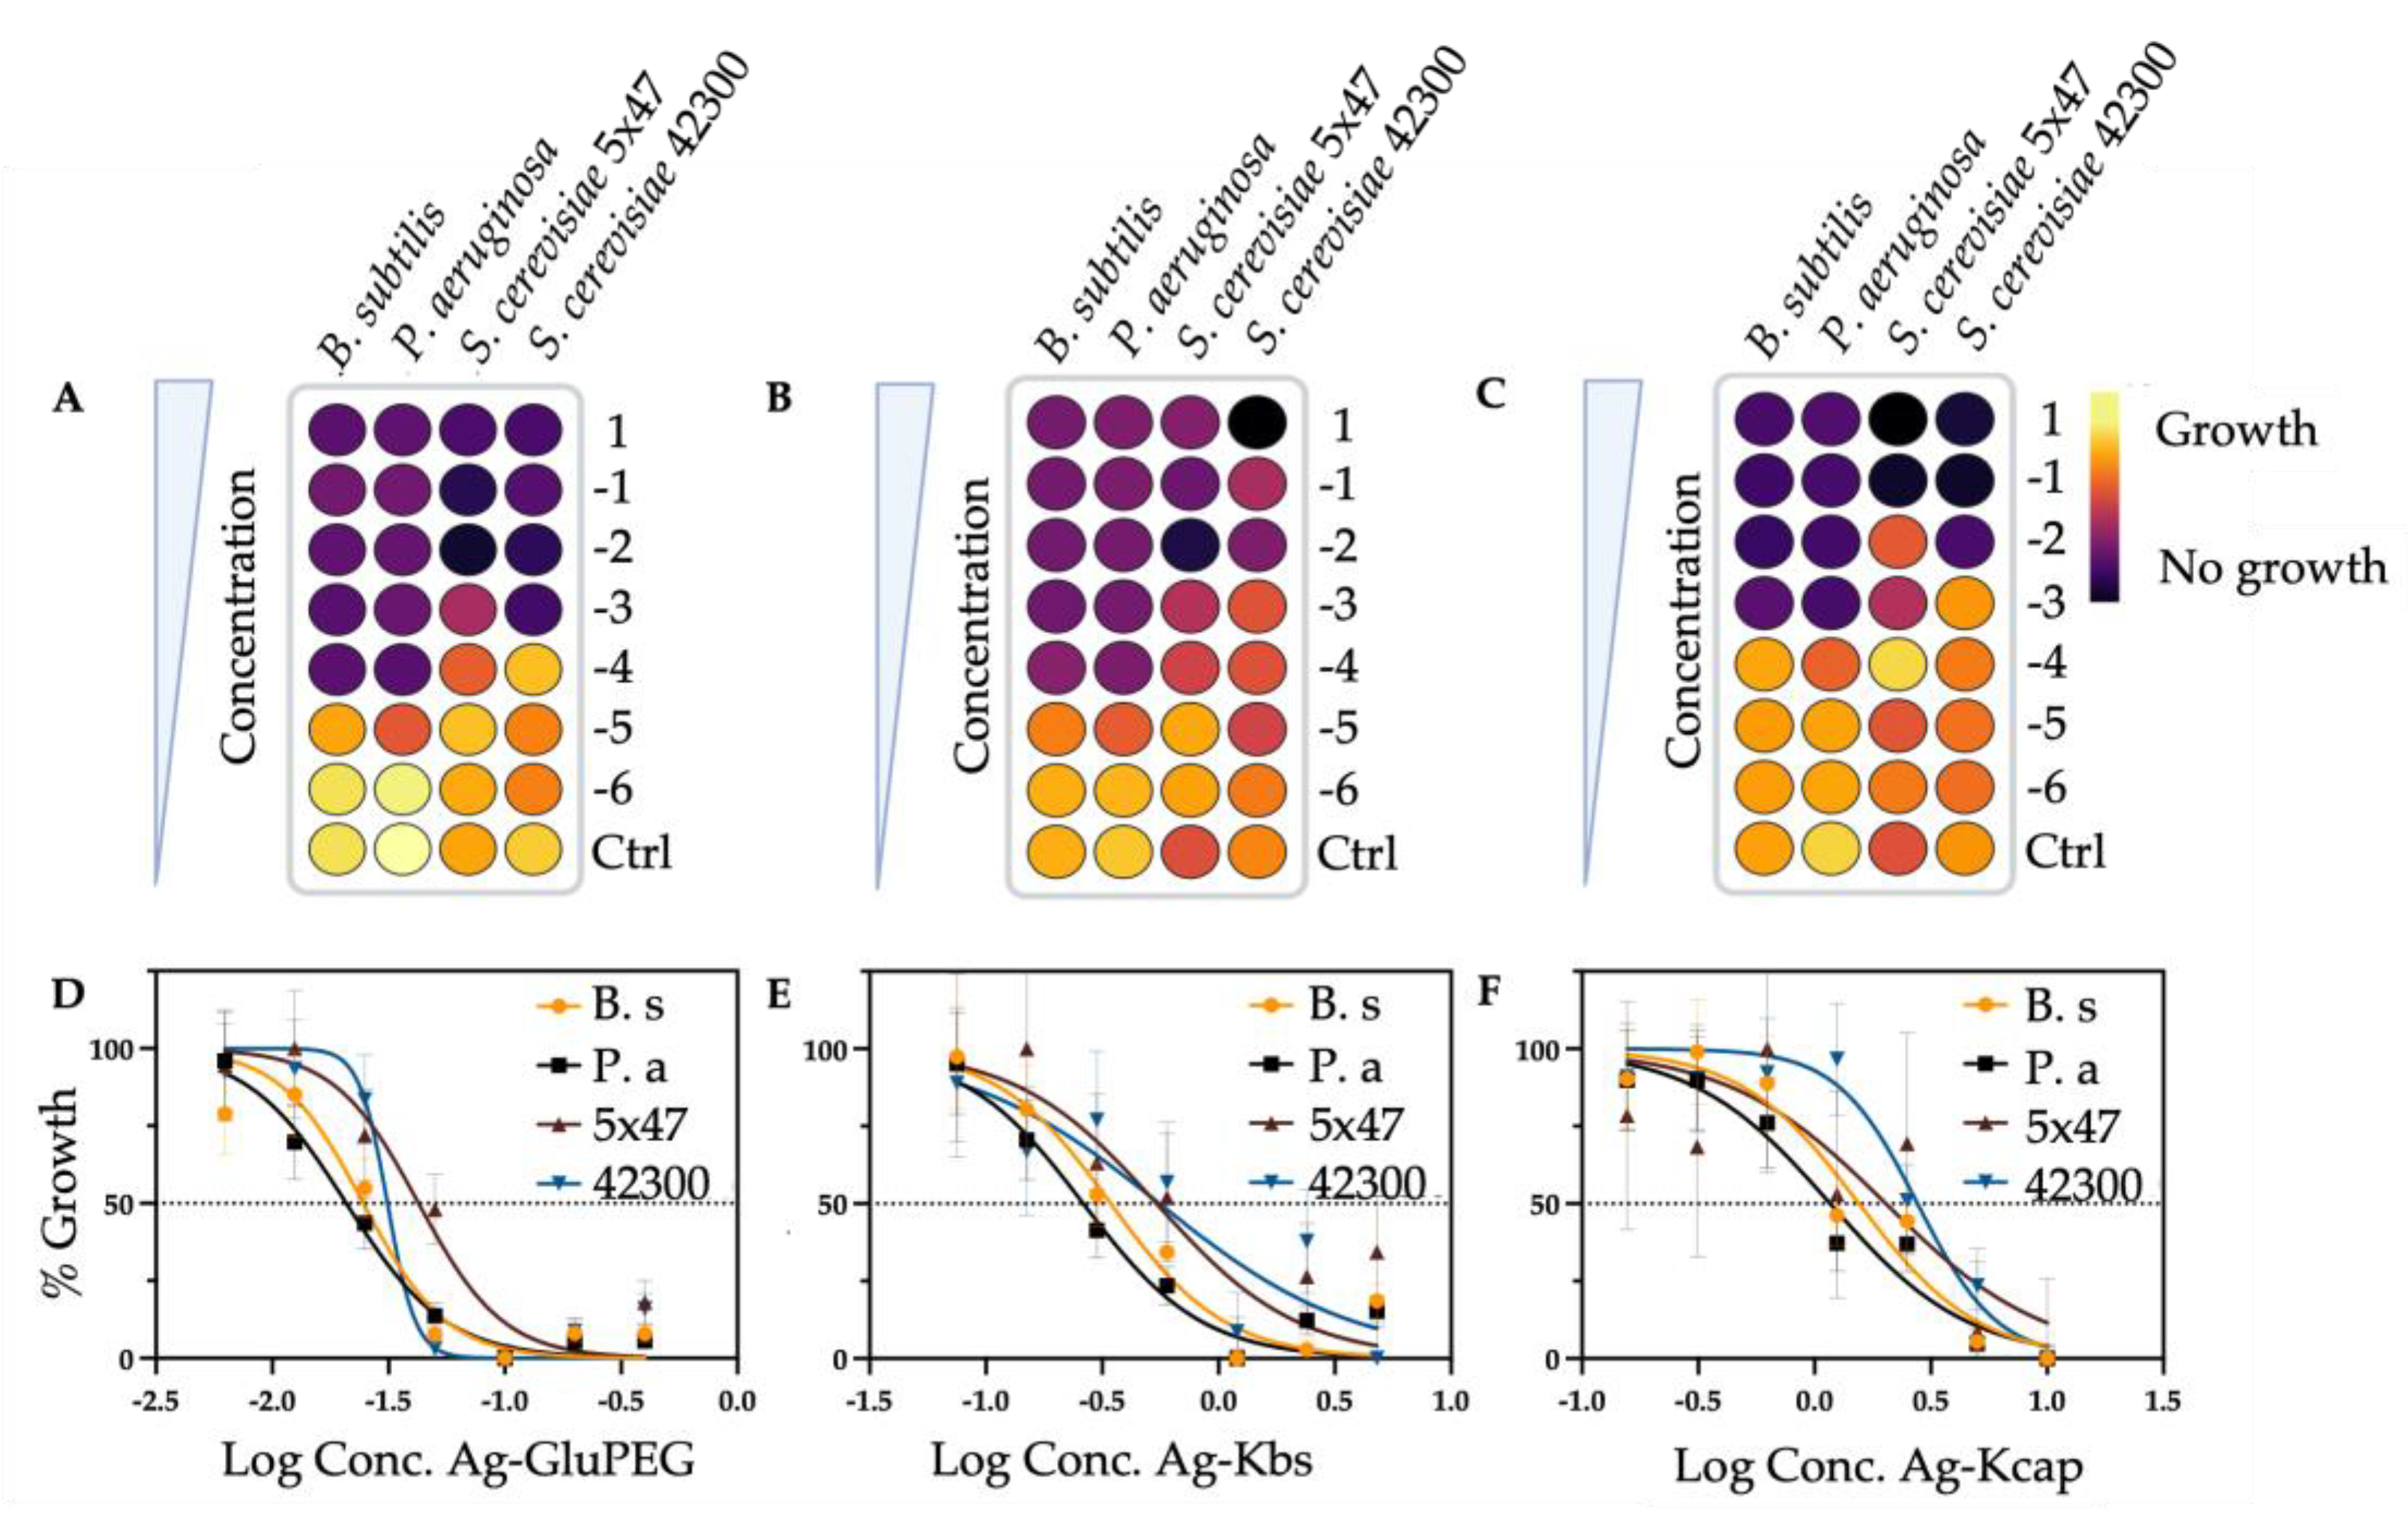
The development of novel antimicrobial agents involves several approaches, including the evaluation of efficacy and safety of new or improved or modified antimicrobial agents. To do so, methodologies involving the effect of novel antimicrobial agents on microorganisms can be assessed using standard or modified analyses like disk diffusion, agar dilution, and broth dilution [62]. Here, we combine several methodologies to gain a better understanding of the antimicrobial effect. For the MIC determination, a microdilution on a 96-well plate was established. MIC was defined as the lowest concentration exhibiting no detectable microbial growth [25]. The results of this analysis demonstrate a clear tendency of sensitivity of the bacterial strains, in contrast to yeast. For all three preparations, both B. subtilis and P. aeruginosa exhibit the same MIC: for the case of Ag-GluPEG, the MIC value was 0.025 mg/mL; meanwhile, for Ag-Kbs was 0.3 mg/mL, and 1.25 mg/mL for Ag-Kcap. However, in the case of yeast, we observed marked differences among the sensitive and killer strains, with S. cerevisiae 42300 more sensitive to all preparations. Overall, the yeast model is less sensitive to the NPs compared to bacteria. The MIC values for 5x47 and 42300, respectively, per preparation are: Ag-GluPEG 0.1 mg/mL and 0.05 mg/mL, Ag-Kbs 1.2 mg/mL for both, and for Ag-Kcap 5 mg/mL and 2.5 mg/mL. Summarizing the data, indicate a differential activity of the NPs depending on the type of synthesis and the presence of protein-associated components on the nanoparticle surface. Figure 5 A–C can clearly contrast the differences in MIC in a heatmap, demonstrating that the Ag-GluPEG and Ag-Kbs had the lowest inhibitory concentrations in comparison to the Ag-Kcap. Even though the NPs themselves had different weights, the dilution at which both preparations exhibit the MIC is the same for bacteria (Dilution 5). In contrast, the Ag-Kcap has its MIC at dilution 4 for bacteria, dilution 2 for 5x47, and dilution 3 for 42300. This data strongly suggests that the interaction of metal-protein on the synthesis and NP conjugation during the stabilization contributes to differences in antimicrobial activity, and it is equally efficient as a chemically synthesized NP.
To better understand the differences in toxicity and potency between the AgNPs, a dose-response analysis was conducted. The curves obtained demonstrate the differences in each preparation on the microorganisms. The antimicrobial response was represented as the percentage reduction in microbial growth as a function of nanoparticle concentration, as it is demonstrated in Figure 5D–F; the nanoparticles act differently on every microbial system. For all three preparations, the bacterial models were significantly more susceptible, exhibiting lower IC50 values compared to yeast models. Notably, P. aeruginosa is the most susceptible microorganism for all the preparations, with IC50 of 0.02081, 0.2622, and 1.167 mg/mL for Ag-GluPEG, Ag-Kbs, and Ag-Kcap, respectively. This effect can be driven by the structural composition of the external membrane of Gram-negative bacteria. Due to the presence of a Lipopolysaccharide (LPS) network, their negative charge allows the Ag+ ions to be attracted more efficiently to the membrane, leading to fast destabilization and growth inhibition of the bacteria [63]. Additionally, the presence of PEG-associated surface properties may influence nanoparticle–membrane interactions and silver ion availability. [64]. The Ag-GluPEG preparation was more potent than the Kcpf-associated NPs. This substantial difference in potency can be explained by the dynamics of the nanoparticle corona. The PEG coating may facilitate nanoparticle dispersion and influence silver ion availability. On the other hand, the Ag-Kbs, and Ag-Kcap containing protein-associated surface layers may reduce the accessibility of silver ions to microbial cells (Fig 3), [65,66]. In consequence, the concentration needed to reach the 50% inhibition of the strain is more elevated. Interestingly, the case of B. subtilis is similar to that of P. aeruginosa, with a low IC50 of 0.02464 mg/mL (Ag-GluPEG) and 0.3441 mg/mL (Ag-Kbs). However, for the Ag-Kcap preparation, the IC50 increases to 1.552 mg/mL, indicating that the nanoparticle core blended with the Kcpf forms a barrier that makes it difficult for the penetration of the cell-wall structure.
FTIR analysis confirmed the presence of a stable protein coat for Ag-Kbs and Ag-Kcap. Even though we couldn’t determine a specific proportion of killer toxin on the coating, we suggest that killer toxin-associated activity contributes to the antimicrobial behavior of the nanocomposite. This synergistic effect explains the shift observed in the killer strain compared to the sensitive strain (Fig 5E). Using the Ag-GluPEG baseline, the chemically synthesized NPs inhibit both strains of S. cerevisiae through a highly cooperative mechanism (Hill slope of -7.179 for 42300 and -2.390 for 5x47), indicating a synchronized threshold effect similar to the “all or nothing” effect, where at a critical particle concentration, the cellular homeostasis may be disrupted. However, when the Kcpf are present in the NP corona, the Hill slope for the killer strain is significantly decreased (-1.036) with an IC50 of 0.5574 mg/mL. This result can be attributed to a non-cooperative interaction, the reduction of the silver ion release rate, and intrinsic resistance mechanisms associated with the killer phenotype. In contrast, the sensitive strain 5x47 lacks those resistance mechanisms to the killer toxin, whose effect is observed by a cooperative Hill slope of -1.439 and a lower IC50 of 0.5418 mg/mL.
An interesting behavior is observed on the Ag-Kcap preparation (Fig 5F). In this assay, the killer strain’s Hill slope increases to -2.529 with an IC50 of 2.77 mg/mL, whereas the sensitive strain shows a flatter Hill slope of -1.276 and an IC50 of 2.026 mg/mL. In this preparation, the mixture of stable PEG-coated NP and the Kcpf interacts in a loose secondary outer layer. For the case of the strain 5x47, the nanocomposite generates a gradual cooperative mechanism of death (Hill slope of -1.276). Meanwhile, for the killer strain, the combination of PEG coating and killer protein fractions produces a distinct antimicrobial response profile. As it was shown in Fig 5D, this strain is particularly more sensitive to the AgNPs toxicity, and in addition to the effect of the Kcpf, the interaction of this preparation results in a a steeper concentration-dependent inhibition response (Hill slope of -2.529)
4. Conclusions
The present study evaluates for the first time the synthesis of silver nanoparticles with a killer strain of S. cerevisiae, demonstrating that killer concentrated protein fractions contribute to nanoparticle surface composition and influence their antimicrobial properties. UV–Vis spectroscopy confirmed the characteristic surface plasmon resonance (SPR) band of AgNPs in all formulations. However, there are substantial differences between them. In the first instance, the SPR of the Ag-GluPEG NPs is modulated by the glucose concentration and reaction time. Meanwhile, the incorporation of a Kcpf led to a spectral difference. The biosynthesized and capped NPs showed the SPR of the AgNPs and an intense signal at 280 nm, consistent with the presence of protein-associated components in the nanoparticle preparation.
On the other hand, the physicochemical characterization by HR-STEM, EDS, and FTIR demonstrates clear differences. The Ag-GluPEG exhibit a well-defined cap, while biosynthesized and capped nanoparticles show coatings of proteins and sugars with irregular morphologies, which can be related to the biomolecules present in Kcpf that may contribute to nanoparticle reduction and stabilization. In turn, this corona configuration may influence silver ion availability and nanoparticle–microbial interactions.
We observed a higher susceptibility of bacterial models compared with yeast models. For the case of P. aeruginosa and B. subtilis, all three preparations exhibited high toxicity compared to the yeast models; this difference may be associated with structural characteristics of bacterial envelopes, including LPS composition in Gram-negative bacteria and cell wall organization in Gram-positive bacteria. It is interesting to highlight that the Ag-Kbs and Ag-Kcap, despite exhibiting higher IC50, offered a mechanistic trade-off. Although the Ag-GluPEG had the lowest IC50 and thus the highest efficacy, the presence of the killer toxin embedded in the protein corona contributes to a broad mechanism of action, combining membrane-associated and oxidative stress to the reported mechanisms of action for killer toxin 1.
In the case of the killer strain, there was an interesting scenario. While the killer strain is immune to its own toxin, the combination of Ag-GluPEG nanoparticles and Kcpf-derived components resulted in increased susceptibility of the killer strain to nanoparticle-mediated inhibition. In comparison, when the nanoparticle was biosynthesized, we hypothesize that the Kcpf acts as a dynamic barrier that controls the release of toxic Ag+ ions, and the contribution of Kcpf-derived components appears to be limited in the killer strain under these conditions. This interaction could be observed by a flattened Hill slope. However, when the Ag-Kcap interacts with the killer strain, a synergy of the loose protein layer on a stable PEG-coated AgNP, causes a strong and sudden reaction in the yeast, making it very sensitive to the nanocomposite.
In summary, the incorporation of killer-derived proteins can be an attractive approach in the development of hybrid nano systems with enhanced antimicrobial properties. Our findings highlight the importance of bio-assisted synthesis of nanoparticles as a green, affordable, and potentially scalable approach. Future studies will be centered on stability, cytotoxicity, and mechanism of action of this novel hybrid nanomaterial to further evaluate their biomedical applicability and antimicrobial potential.
Supplementary Materials
The following supporting information can be downloaded at the website of this paper posted on Preprints.org, Figure S1: EDS analysis of AgNPs.
Author Contributions
Conceptualization, C. M. and C. S.; methodology, C. M., V. M. T., and C. S..; validation, C. M. and C. S. formal analysis, C. M.; investigation, C. M. and C. S.; data curation, C. M. and V. M. T.; writing—original draft preparation, C. M.; writing—review and editing, C. M., V. M. T. , J. C. G., J. L. C. S., and C. S.; imaging acquisition, C. M. and V. M. T.; supervision, V. M. T. J. C. G., J. L. C. S., and C. S.; project administration, C. S.; funding acquisition, C. S. All authors have read and agreed to the published version of the manuscript.
Funding
We extend our sincere gratitude to the funding institutions: FONDEC-UAQ, FONFIVE 2024, and SECIHTI A1-S-26966, to Carlos Saldaña. Carlos Molina-Vera CVU: 1003111.
Data Availability Statement
The data presented in this study are available on request from the corresponding author.
Acknowledgments
We extend our sincere gratitude to the Department of Reference Materials Analysis of Centro Nacional de Metrología (CENAM), PhD José Antonio Salas Téllez, PhD Armando López, PhD Yadira Maldonado, and PhD Samuel Gallardo for the technical and academic support. Also, we thank LaNCaM CFATA UNAM, PhD Porfirio Esau Martínez Muñoz, and Manuel Aguilar Franco for the instrumentation and technical support for FTIR, STEM, and EDS analysis; also, we thank MSc Adriana Gallardo and Lourdes Palma from Instituto de Neurobiología of the UNAM for the invaluable expertise, technical support, and instrumentation for UV-Vis and TEM. This work received support from Luis Aguilar, Alejandro De León, Alejandro Ávalos, and Jair García of the Laboratorio Nacional de Visualización Científica Avanzada”.
Conflicts of Interest
The authors declare no conflicts of interest.
References
- Shahcheraghi, N.; Golchin, H.; Sadri, Z.; Tabari, Y.; Borhanifar, F.; Makani, S. Nano-Biotechnology, an Applicable Approach for Sustainable Future. 3 Biotech. 2022, 12, 65. [Google Scholar] [CrossRef] [PubMed]
- Javed, M.; Sajid, A.; Bangash, K.; Abbas, M.; Ahmed, S.; Kaplan, A.; Iqbal, S.; Khan, M.; Adnan, M.; Ali, A.; et al. Potential and Challenges in Green Synthesis of Nanoparticles: A Review. Xi’an Shiyou Daxue Xuebao (Ziran Kexue Ban)/J. Xi’an Shiyou Univ. 2023, 19, 1155–1165. [Google Scholar]
- Ying, S.; Guan, Z.; Ofoegbu, P.C.; Clubb, P.; Rico, C.; He, F.; Hong, J. Green Synthesis of Nanoparticles: Current Developments and Limitations. Environ. Technol. Innov. 2022, 26, 102336. [Google Scholar] [CrossRef]
- Xu, L.; Wang, Y.-Y.; Huang, J.; Chen, C.-Y.; Wang, Z.-X.; Xie, H. Silver Nanoparticles: Synthesis, Medical Applications and Biosafety. Theranostics 2020, 10, 8996–9031. [Google Scholar] [CrossRef] [PubMed]
- Herring, A.J.; Bevan, E.A. Virus-like Particles Associated with the Double-Stranded RNA Species Found in Killer and Sensitive Strains of the Yeast Saccharomyces Cerevisiae. J. Gen. Virol. 1974, 22, 387–394. [Google Scholar] [CrossRef] [PubMed]
- Wickner, R.B.; Fujimura, T.; Esteban, R. Viruses and Prions of Saccharomyces Cerevisiae. Adv. Virus Res. 2013, 86, 1–36. [Google Scholar] [CrossRef] [PubMed]
- Bajaj, B.; Singh, S. Biology of Killer Yeast and Technological Implications. In Yeast Diversity in Human Welfare; 2017; pp. 163–190. ISBN 978-981-10-2620-1. [Google Scholar] [CrossRef]
- Gier, S.; Lermen, M.; Schmitt, M.J.; Breinig, F. Substitution of Cysteines in the Yeast Viral Killer Toxin K1 Precursor Reveals Novel Insights in Heterodimer Formation and Immunity. Sci. Rep. 2019, 9, 13127. [Google Scholar] [CrossRef] [PubMed]
- Schmitt, M.; Björn, B. Viral Killer Toxins. In; 2020 ISBN 978-0-12-809633-8.
- Gier, S.; Schmitt, M.; Breinig, F. Analysis of Yeast Killer Toxin K1 Precursor Processing via Site-Directed Mutagenesis: Implications for Toxicity and Immunity. mSphere 2020, 5. [Google Scholar] [CrossRef] [PubMed]
- Sesti, F.; Shih, T.M.; Nikolaeva, N.; Goldstein, S.A.N. Immunity to K1 Killer Toxin: Internal TOK1 Blockade. Cell 2001, 105, 637–644. [Google Scholar] [CrossRef] [PubMed]
- Ahmed, A.; Sesti, F.; Nitza, I.; Shih, T.M.; Sturley, S.L.; Goldstein, S.A.N. A Molecular Target for Viral Killer Toxin: TOK1 Potassium Channels. Cell 1999, 99, 283–291. [Google Scholar] [CrossRef] [PubMed]
- Kagan, B.L. Mode of Action of Yeast Killer Toxins: Channel Formation in Lipid Bilayer Membranes. Nature 1983, 302, 709–711. [Google Scholar] [CrossRef] [PubMed]
- Baev, D.; Rivetta, A.; Li, X.S.; Vylkova, S.; Bashi, E.; Slayman, C.L.; Edgerton, M. Killing of Candida Albicans by Human Salivary Histatin 5 Is Modulated, but Not Determined, by the Potassium Channel TOK1. Infect. Immun. 2003, 71, 3251–3260. [Google Scholar] [CrossRef] [PubMed]
- Schmitt, M.J.; Breinig, F. Yeast Viral Killer Toxins: Lethality and Self-Protection. Nat. Rev. Microbiol. 2006, 4, 212–221. [Google Scholar] [CrossRef] [PubMed]
- Breinig, F.; Tipper, D.J.; Schmitt, M.J. Kre1p, the Plasma Membrane Receptor for the Yeast K1 Viral Toxin. Cell 2002, 108, 395–405. [Google Scholar] [CrossRef] [PubMed]
- Hutchins, K.; Bussey, H. Cell Wall Receptor for Yeast Killer Toxin: Involvement of (1-6)-B-D-Glucan. J. Bacteriol. 1983, 154, 161–169. [Google Scholar] [CrossRef] [PubMed]
- Elwakkad, A.; Gamal El Din, A.A.; Saleh, H.A.; Ibrahim, N.E.; Hebishy, M.A.; Mourad, H.H.; El-Kassaby, M.I.; Abou-Seif, H.S.; Elqattan, G.M. Gold Nanoparticles Combined Baker’s Yeast as a Successful Approach for Breast Cancer Treatment. J. Genet Eng. Biotechnol. 2023, 21, 27. [Google Scholar] [CrossRef] [PubMed]
- Kthiri, A.; Hamimed, S.; Othmani, A.; Landoulsi, A.; O’Sullivan, S.; Sheehan, D. Novel Static Magnetic Field Effects on Green Chemistry Biosynthesis of Silver Nanoparticles in Saccharomyces Cerevisiae. Sci. Rep. 2021, 11, 20078. [Google Scholar] [CrossRef] [PubMed]
- Boroumand Moghaddam, A.; Namvar, F.; Moniri, M.; Md. Tahir, P.; Azizi, S.; Mohamad, R. Nanoparticles Biosynthesized by Fungi and Yeast: A Review of Their Preparation, Properties, and Medical Applications. Molecules 2015, 20, 16540–16565. [Google Scholar] [CrossRef] [PubMed]
- Salem, S.S. Baker’s Yeast-Mediated Silver Nanoparticles: Characterisation and Antimicrobial Biogenic Tool for Suppressing Pathogenic Microbes. BioNanoSci. 2022, 12, 1220–1229. [Google Scholar] [CrossRef]
- Sivaraj, A.; Kumar, V.; Sunder, R.; Parthasarathy, K.; Kasivelu, G. Commercial Yeast Extracts Mediated Green Synthesis of Silver Chloride Nanoparticles and Their Anti-Mycobacterial Activity. J. Clust. Sci. 2020, 31, 287–291. [Google Scholar] [CrossRef]
- Ranjani, D.V.A.; Rani, D.G.T.; Sowjanya, M.; Preethi, M.; Srinivas, M.; Nikhil, M. Yeast Mediated Synthesis of Iron Oxide Nano Particles: Its Characterization and Evaluation of Antibacterial Activity. Nano Part. 2022, 5. [Google Scholar]
- Chen, S.; Shan, B.; Luo, Y.; Mo, G.; Rasheed, U.; Lv, L.; Yang, X.; Lu, Q. Molecular Chaperone Effects on Recombinant Yield and Binding Characteristics of an ABA-Specific scFv in Escherichia Coli. Front. Bioeng. Biotechnol. 2025, 13, 1643833. [Google Scholar] [CrossRef] [PubMed]
- Kadeřábková, N.; Mahmood, A.J.S.; Mavridou, D.A.I. Antibiotic Susceptibility Testing Using Minimum Inhibitory Concentration (MIC) Assays. npj Antimicrob. Resist 2024, 2, 37. [Google Scholar] [CrossRef] [PubMed]
- Liu, J.; Qin, G.; Raveendran, P.; Ikushima, Y. Facile “Green” Synthesis, Characterization, and Catalytic Function of β-D-Glucose-Stabilized Au Nanocrystals. Chem. – A Eur. J. 2006, 12, 2131–2138. [Google Scholar] [CrossRef] [PubMed]
- Mansee, A.H.; Abdelgawad, D.M.; Ebrahim, A.M. Influence of Glucose as a Natural Reductant on Silver Nanoparticles Synthesis for Decontamination of P-Nitrophenol and Methylene Blue from Wastewater. Sci. Rep. 2025, 15, 27085. [Google Scholar] [CrossRef] [PubMed]
- Pattnaik, C.; Mishra, R.; K. Sahu, A.; Narayan Sahoo, L.; K. Sahoo, N.; Kumar Tripathy, S.; Sahoo, S. Green Synthesis of Glucose-Capped Stable Silver Nanoparticles: A Cost-Effective Sensor for the Selective Detection of Hg 2+ Ions in Aqueous Solutions. Sens. Diagn. 2023, 2, 647–656. [Google Scholar] [CrossRef]
- Kim, D.-Y.; Kim, M.; Sung, J.-S.; Koduru, J.R.; Nile, S.H.; Syed, A.; Bahkali, A.H.; Seth, C.S.; Ghodake, G.S. Extracellular Synthesis of Silver Nanoparticle Using Yeast Extracts: Antibacterial and Seed Priming Applications. Appl. Microbiol. Biotechnol. 2024, 108, 150. [Google Scholar] [CrossRef] [PubMed]
- Kharchenko, Y.; Lastovetska, L.; Maslak, V.; Sidorenko, M.; Vasylenko, V.; Shydlovska, O. Antibacterial Activity of Green Synthesised Silver Nanoparticles on Saccharomyces Cerevisiae. Appl. Sci. 2022, 12. [Google Scholar] [CrossRef]
- Shu, M.; He, F.; Li, Z.; Zhu, X.; Ma, Y.; Zhou, Z.; Yang, Z.; Gao, F.; Zeng, M. Biosynthesis and Antibacterial Activity of Silver Nanoparticles Using Yeast Extract as Reducing and Capping Agents. Nanoscale Res. Lett. 2020, 15, 14. [Google Scholar] [CrossRef] [PubMed]
- Aitken, A.; Learmonth, M.P. Protein Determination by UV Absorption. In The Protein Protocols Handbook; Walker, J.M., Ed.; Humana Press: Totowa, NJ, 2009; pp. 3–6. ISBN 978-1-59745-198-7. [Google Scholar]
- Kamga, M.-H.; Woo Lee, H.; Liu, J.; Yoon, S. Quantification of Protein Mixture in Chromatographic Separation Using Multi-Wavelength UV Spectra. Biotechnol. Prog. 2013, 29, 664–671. [Google Scholar] [CrossRef] [PubMed]
- Metsämuuronen, S.; Mänttäri, M.; Nyström, M. Comparison of Analysis Methods for Protein Concentration and Its Use in UF Fractionation of Whey. Desalination 2011, 283, 156–164. [Google Scholar] [CrossRef]
- Tonolini, M.; Skou, P.B.; van den Berg, F.W.J. UV Spectroscopy as a Quantitative Monitoring Tool in a Dairy Side-Stream Fractionation Process. Chemom. Intell. Lab. Syst. 2022, 225, 104561. [Google Scholar] [CrossRef]
- Bracesco, N.; Salvo, V.A.; Carrau, F.M.; Nunes, E. Physicochemical Modification of the Excretion Product of Saccharomyces Cerevisiae Killer Strains Results in Fungicidal Activity against Candida Albicans and Tricophyton Mentagrophytes. FEMS Microbiol. Lett. 2006, 256, 132–136. [Google Scholar] [CrossRef] [PubMed]
- Bhullar, S.; Goyal, N.; Gupta, S. FericipXT-Coated PEGylated Rutile TiO 2 Nanoparticles in Drug Delivery: In Vitro Assessment of Imatinib Release. RSC Adv. 2024, 14, 23886–23901. [Google Scholar] [CrossRef] [PubMed]
- Li, W.; Cao, Z.; Yu, L.; Huang, Q.; Zhu, D.; Lu, C.; Lu, A.; Liu, Y. Hierarchical Drug Release Designed Au @PDA-PEG-MTX NPs for Targeted Delivery to Breast Cancer with Combined Photothermal-Chemotherapy. J. Nanobiotechnol 2021, 19, 143. [Google Scholar] [CrossRef] [PubMed]
- Stiufiuc, R.; Iacovita, C.; Lucaciu, C.M.; Stiufiuc, G.; Dutu, A.G.; Braescu, C.; Leopold, N. SERS-Active Silver Colloids Prepared by Reduction of Silver Nitrate with Short-Chain Polyethylene Glycol. Nanoscale Res. Lett. 2013, 8, 47. [Google Scholar] [CrossRef] [PubMed]
- Zamora-Justo, J.A.; Abrica-González, P.; Vázquez-Martínez, G.R.; Muñoz-Diosdado, A.; Balderas-López, J.A.; Ibáñez-Hernández, M. Polyethylene Glycol-Coated Gold Nanoparticles as DNA and Atorvastatin Delivery Systems and Cytotoxicity Evaluation. J. Nanomater. 2019, 2019, 5982047. [Google Scholar] [CrossRef]
- Ling, K.; Jiang, H.; Zhang, Q. A Colorimetric Method for the Molecular Weight Determination of Polyethylene Glycol Using Gold Nanoparticles. Nanoscale Res. Lett. 2013, 8, 538. [Google Scholar] [CrossRef] [PubMed]
- Ali, I.A.M.; Ahmed, A.B.; Al-Ahmed, H.I. Green Synthesis and Characterization of Silver Nanoparticles for Reducing the Damage to Sperm Parameters in Diabetic Compared to Metformin. Sci. Rep. 2023, 13, 2256. [Google Scholar] [CrossRef] [PubMed]
- Iwuji, C.; Saha, H.; Ghann, W.; Dotson, D.; Bhuiya, Md.A.K.; Parvez, Md.S.; Jahangir, Z.S.; Rahman, M.M.; Chowdhury, F.I.; Uddin, J. Synthesis and Characterization of Silver Nanoparticles and Their Promising Antimicrobial Effects. Chem. Phys. Impact 2024, 9, 100758. [Google Scholar] [CrossRef]
- Kthiri, A.; Hamimed, S.; Othmani, A.; Landoulsi, A.; O’Sullivan, S.; Sheehan, D. Novel Static Magnetic Field Effects on Green Chemistry Biosynthesis of Silver Nanoparticles in Saccharomyces Cerevisiae. Sci. Rep. 2021, 11, 20078. [Google Scholar] [CrossRef] [PubMed]
- Antunes, M.; Sá-Correia, I. The Role of Ion Homeostasis in Adaptation and Tolerance to Acetic Acid Stress in Yeasts. FEMS Yeast Res. 2024, 24, foae016. [Google Scholar] [CrossRef] [PubMed]
- Stern, T. Deciphering the Triple-Peak C-O-C Stretching FTIR Absorbance Consistently Occurring in Semicrystalline PEG. Polymers 2025, 17. [Google Scholar] [CrossRef] [PubMed]
- Sedaghat, S.; ARSHADI, E.; AFSHAR, P.; NAFAR, A.; DABBAGH, R. Rapid Green Biosynthesis and Characterization of Silver Nanoparticles Using Glucose as a Green Route. Rev. Roum. De Chim. 2019, 64, 409–413. [Google Scholar] [CrossRef]
- Shameli, K.; Bin Ahmad, M.; Jazayeri, S.D.; Sedaghat, S.; Shabanzadeh, P.; Jahangirian, H.; Mahdavi, M.; Abdollahi, Y. Synthesis and Characterization of Polyethylene Glycol Mediated Silver Nanoparticles by the Green Method. Int. J. Mol. Sci. 2012, 13, 6639–6650. [Google Scholar] [CrossRef] [PubMed]
- Gbassi, G.; YOLOU, F.; Sarr, S.; Atheba, P.; Amin, C.; AKE, M. Whey Proteins Analysis in Aqueous Medium and in Artificial Gastric and Intestinal Fluids. Int. J. Biol. Chem. Sci. 2012, 6, 1828–1837. [Google Scholar] [CrossRef]
- Feyzioğlu Demir, E.; Öztürk Atay, N.; Koruyucu, M.; Kök, G.; Gül Salman, Y.; Akgöl, S. Mannose Based Polymeric Nanoparticles for Lectin Separation. Sep. Sci. Technol. 2018, 53, 1–11. [Google Scholar] [CrossRef]
- Torres-González, L.; Diaz-Ayala, R.; Vega, C.; López-Garriga, J. Characterization of Recombinant His-Tag Protein Immobilized onto Functionalized Gold Nanoparticles. Sensors 2018, 18, 4262. [Google Scholar] [CrossRef] [PubMed]
- Sizeland, K.; Hofman, K.; Hallett, I.; Martin, D.; Potgieter, J.; Kirby, N.; Hawley, A.; Mudie, S.; Ryan, T.; Haverkamp, R.; et al. Nanostructure of Electrospun Collagen: Do Electrospun Collagen Fibers Form Native Structures? Materialia 2018, 3. [Google Scholar] [CrossRef]
- L. Binati, R.; Ferremi Leali, N.; Avesani, M.; Salvetti, E.; Felis, G.E.; Monti, F.; Torriani, S. Application of FTIR Microspectroscopy in Oenology: Shedding Light on Cell Wall Composition of Saccharomyces Cerevisiae Strains. Food Bioprocess Technol. 2024, 17, 1596–1609. [Google Scholar] [CrossRef]
- Kayed, K.; Issa, M.; Al-ourabi, H. The FTIR Spectra of Ag/Ag2O Composites Doped with Silver Nanoparticles. J. Exp. Nanosci. 2024, 19, 2336227. [Google Scholar] [CrossRef]
- Yousefi, L.; Arianfar, A.; Mahdian, E.; Rafe, A. Enhancing the Techno-Functional Properties of Quinoa Protein Isolate through Cold Plasma Treatment: A Comprehensive Study on pH Effects. Sci. Rep. 2026, 16, 6608. [Google Scholar] [CrossRef] [PubMed]
- Salem, S.S. Baker’s Yeast-Mediated Silver Nanoparticles: Characterisation and Antimicrobial Biogenic Tool for Suppressing Pathogenic Microbes. BioNanoSci. 2022, 12, 1220–1229. [Google Scholar] [CrossRef]
- Moghaddam, A.B.; Namvar, F.; Moniri, M.; Tahir, P.M.; Azizi, S.; Mohamad, R. Nanoparticles Biosynthesized by Fungi and Yeast: A Review of Their Preparation, Properties, and Medical Applications. Molecules 2015, 20, 16540–16565. [Google Scholar] [CrossRef] [PubMed]
- Kharchenko, Y.; Lastovetska, L.; Maslak, V.; Sidorenko, M.; Vasylenko, V.; Shydlovska, O. Antibacterial Activity of Green Synthesised Silver Nanoparticles on Saccharomyces Cerevisiae. Appl. Sci. 2022, 12. [Google Scholar] [CrossRef]
- Ali, S.F.A.; Masroor, S.; Shaikh, M.K.; Jabeen, G.; Naz, S.A.; Aqeel, A.; Anjum, K. Biogenesis of Candida Glabrata-Mediated Silver Nanoparticles: Characterization and Antibacterial Effectiveness Against Human Pathogenic Bacteria. Int. J. Mol. Sci. 2026, 27. [Google Scholar] [CrossRef] [PubMed]
- Niknejad, F.; Nabili, M.; Daie Ghazvini, R.; Moazeni, M. Green Synthesis of Silver Nanoparticles: Advantages of the Yeast Saccharomyces Cerevisiae Model. Curr. Med. Mycol. 2015, 1, 17–24. [Google Scholar] [CrossRef] [PubMed]
- Long, M.S.; Keating, C.D. Nanoparticle Conjugation Increases Protein Partitioning in Aqueous Two-Phase Systems. Anal. Chem. 2006, 78, 379–386. [Google Scholar] [CrossRef] [PubMed]
- Puxeddu, S.; Canton, S.; Scano, A.; Delogu, I.; Pibiri, A.; Cabriolu, C.; Vascellari, S.; Pettinau, F.; Pivetta, T.; Ennas, G.; et al. Beyond One-Size-Fits-All: Addressing Methodological Constraints in Novel Antimicrobials Discovery. Antibiotics 2025, 14, 848. [Google Scholar] [CrossRef] [PubMed]
- Ansari, M.A.; Khan, H.M.; Khan, A.A.; Ahmad, M.K.; Mahdi, A.A.; Pal, R.; Cameotra, S.S. Interaction of Silver Nanoparticles with Escherichia Coli and Their Cell Envelope Biomolecules. J. Basic Microbiol. 2014, 54, 905–915. [Google Scholar] [CrossRef] [PubMed]
- Ciepluch, K.; Skrzyniarz, K.; Barrios-Gumiel, A.; Quintana, S.; Sánchez-Nieves, J.; de la Mata, F.J.; Maciejewska, B.; Drulis-Kawa, Z.; Arabski, M. Dendronized Silver Nanoparticles as Bacterial Membrane Permeabilizers and Their Interactions With P. Aeruginosa Lipopolysaccharides, Lysozymes, and Phage-Derived Endolysins. Front. Microbiol. 2019, 10. [Google Scholar] [CrossRef] [PubMed]
- Levak, M.; Burić, P.; Dutour Sikirić, M.; Domazet Jurašin, D.; Mikac, N.; Bačić, N.; Drexel, R.; Meier, F.; Jakšić, Ž.; Lyons, D.M. Effect of Protein Corona on Silver Nanoparticle Stabilization and Ion Release Kinetics in Artificial Seawater. Environ. Sci. Technol. 2017, 51, 1259–1266. [Google Scholar] [CrossRef] [PubMed]
- Miclăuş, T.; Beer, C.; Chevallier, J.; Scavenius, C.; Bochenkov, V.E.; Enghild, J.J.; Sutherland, D.S. Dynamic Protein Coronas Revealed as a Modulator of Silver Nanoparticle Sulphidation in Vitro. Nat. Commun. 2016, 7, 11770. [Google Scholar] [CrossRef] [PubMed]
Figure 1.
UV-Vis spectra of AgNPs. (A) Optimal concentrations were analyzed for synthesis standardization; inset shows the time (min) standardization for optimal synthesis. (B) Biosynthesis and passive conjugation of AgNPs with killer concentrated protein fraction were also analyzed. All reactions were performed using a final concentration of 2 mM AgNO3. Absorbance values are expressed in arbitrary units (a.u.).
Figure 1.
UV-Vis spectra of AgNPs. (A) Optimal concentrations were analyzed for synthesis standardization; inset shows the time (min) standardization for optimal synthesis. (B) Biosynthesis and passive conjugation of AgNPs with killer concentrated protein fraction were also analyzed. All reactions were performed using a final concentration of 2 mM AgNO3. Absorbance values are expressed in arbitrary units (a.u.).
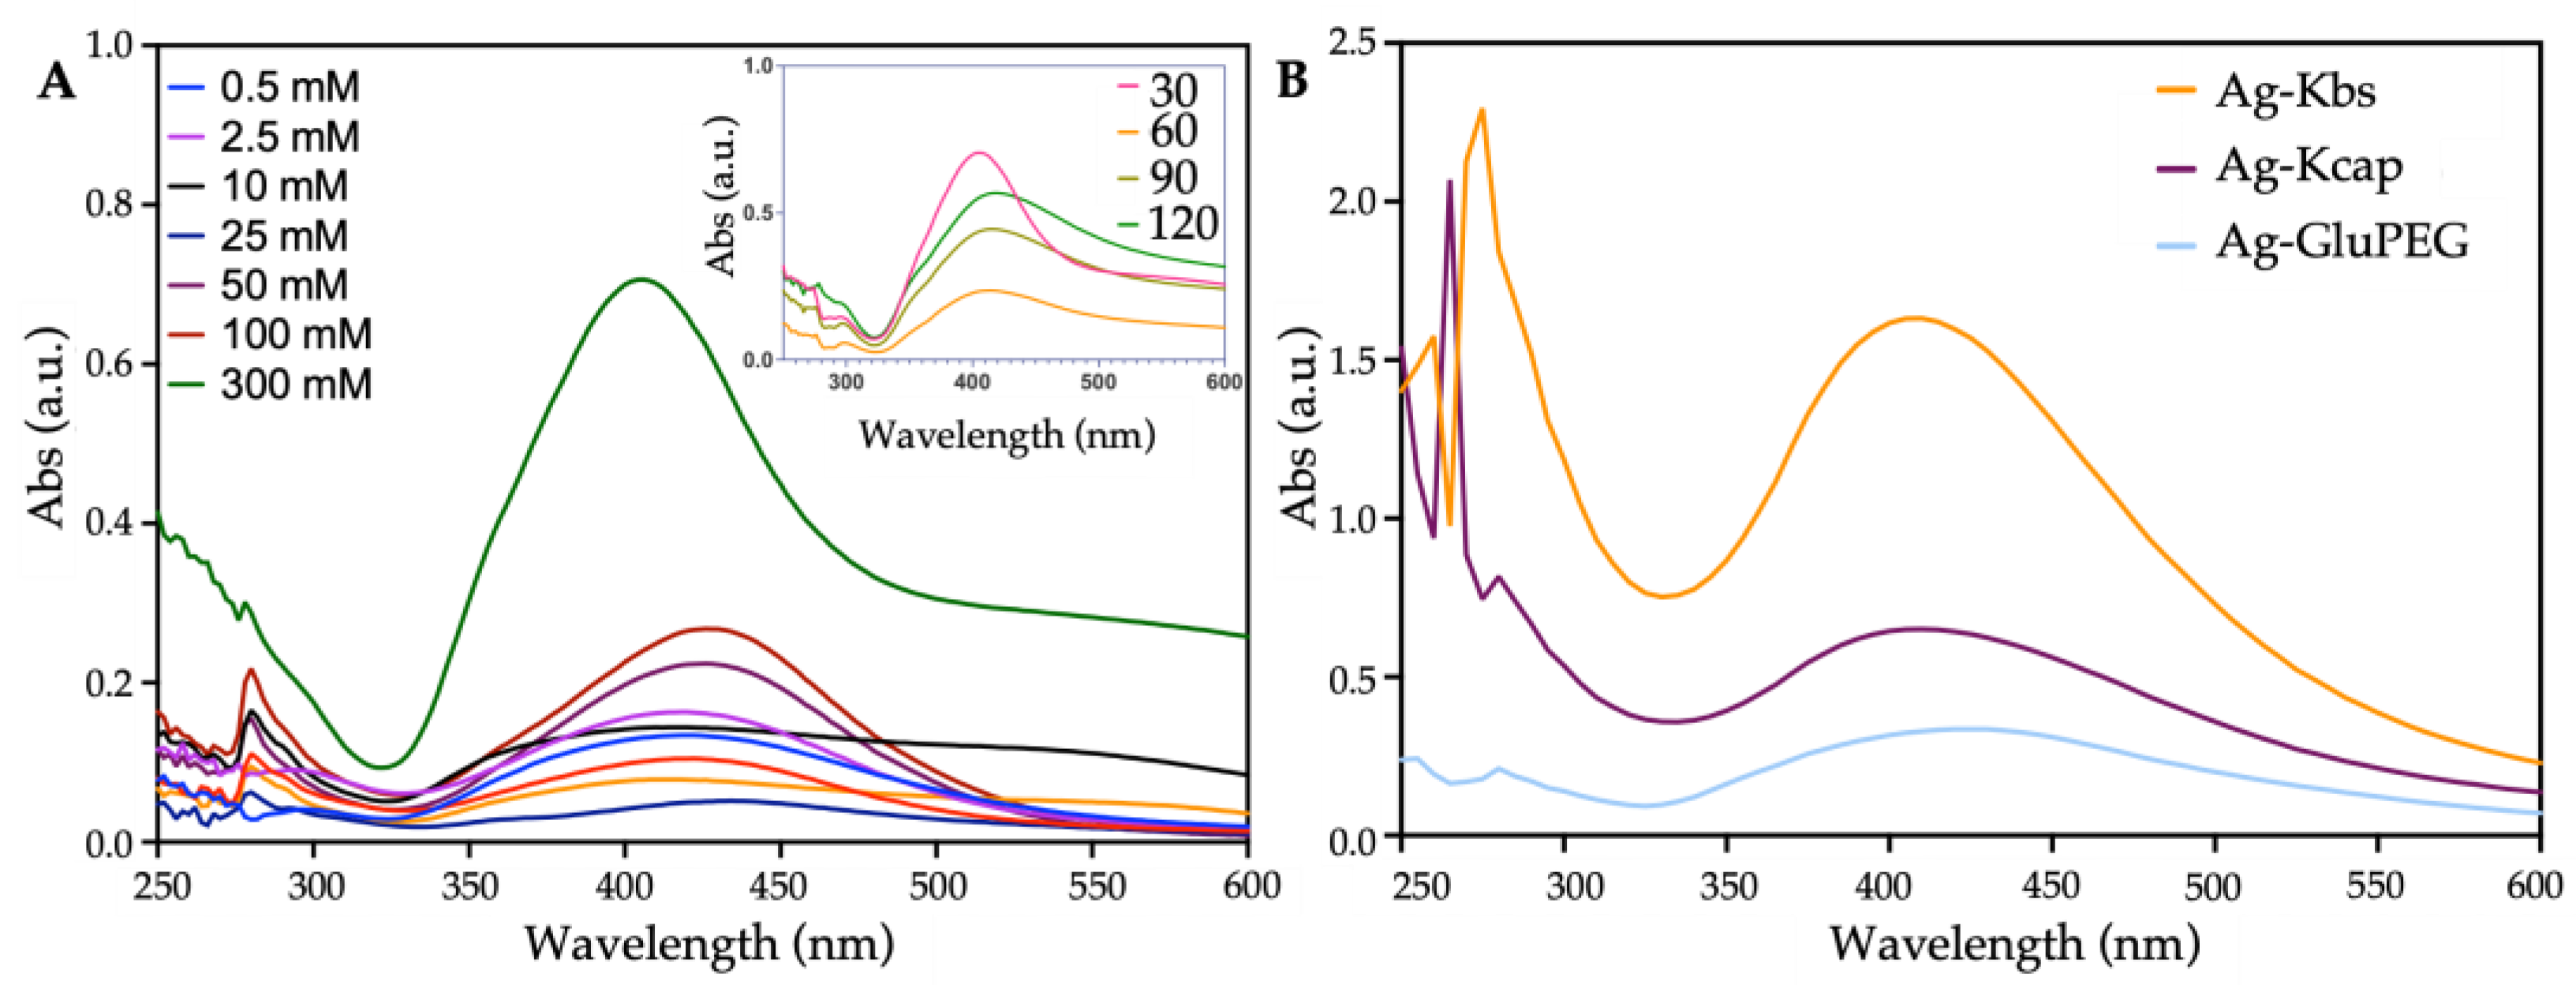
Figure 2.
HR-STEM images of AgNPs. (A) AgNPs synthesized with glucose and PEG showed a clear coating on the surface. (B) Meanwhile those biosynthesized have low electrodense cumulates and NPs of different sizes. (C) NPs conjugated with Kcpf conserve the coating and carries low electrodense protein clusters. Scale bars show 100 nm reference.
Figure 2.
HR-STEM images of AgNPs. (A) AgNPs synthesized with glucose and PEG showed a clear coating on the surface. (B) Meanwhile those biosynthesized have low electrodense cumulates and NPs of different sizes. (C) NPs conjugated with Kcpf conserve the coating and carries low electrodense protein clusters. Scale bars show 100 nm reference.
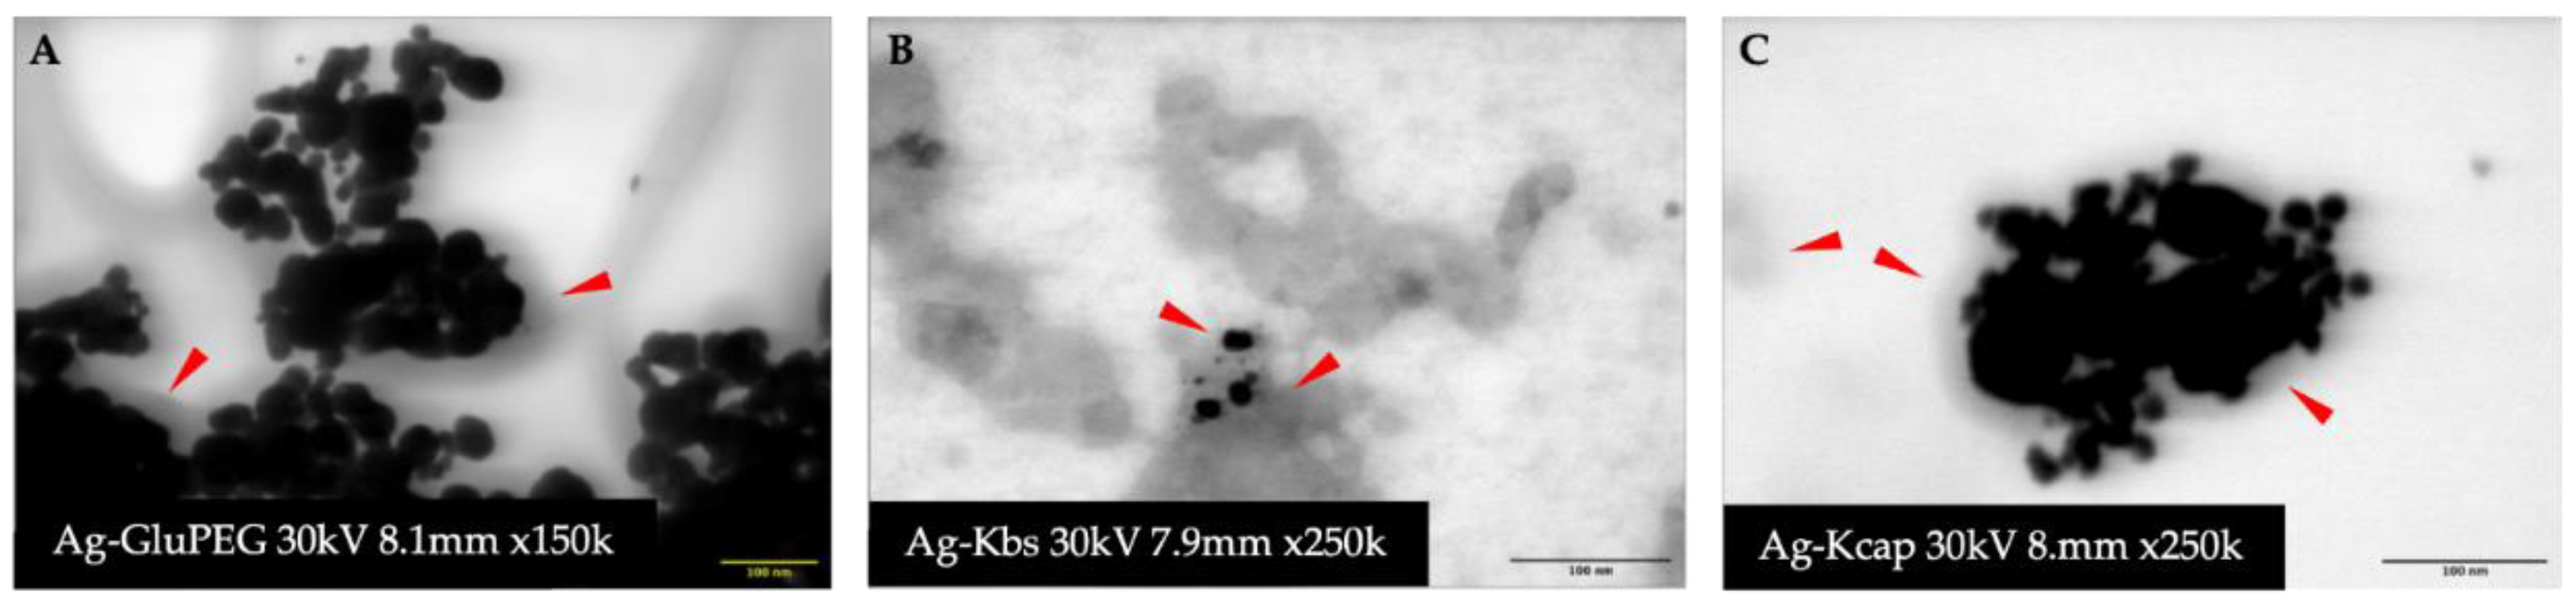
Figure 3.
FTIR spectra of AgNPs. (A) AgNPs synthesized with glucose and PEG, (B) AgNPs capped with Kcpf (B), and (C) AgNPs biosynthesized with Kcpf. Signal intensity is represented in arbitrary units (a.u.).
Figure 3.
FTIR spectra of AgNPs. (A) AgNPs synthesized with glucose and PEG, (B) AgNPs capped with Kcpf (B), and (C) AgNPs biosynthesized with Kcpf. Signal intensity is represented in arbitrary units (a.u.).
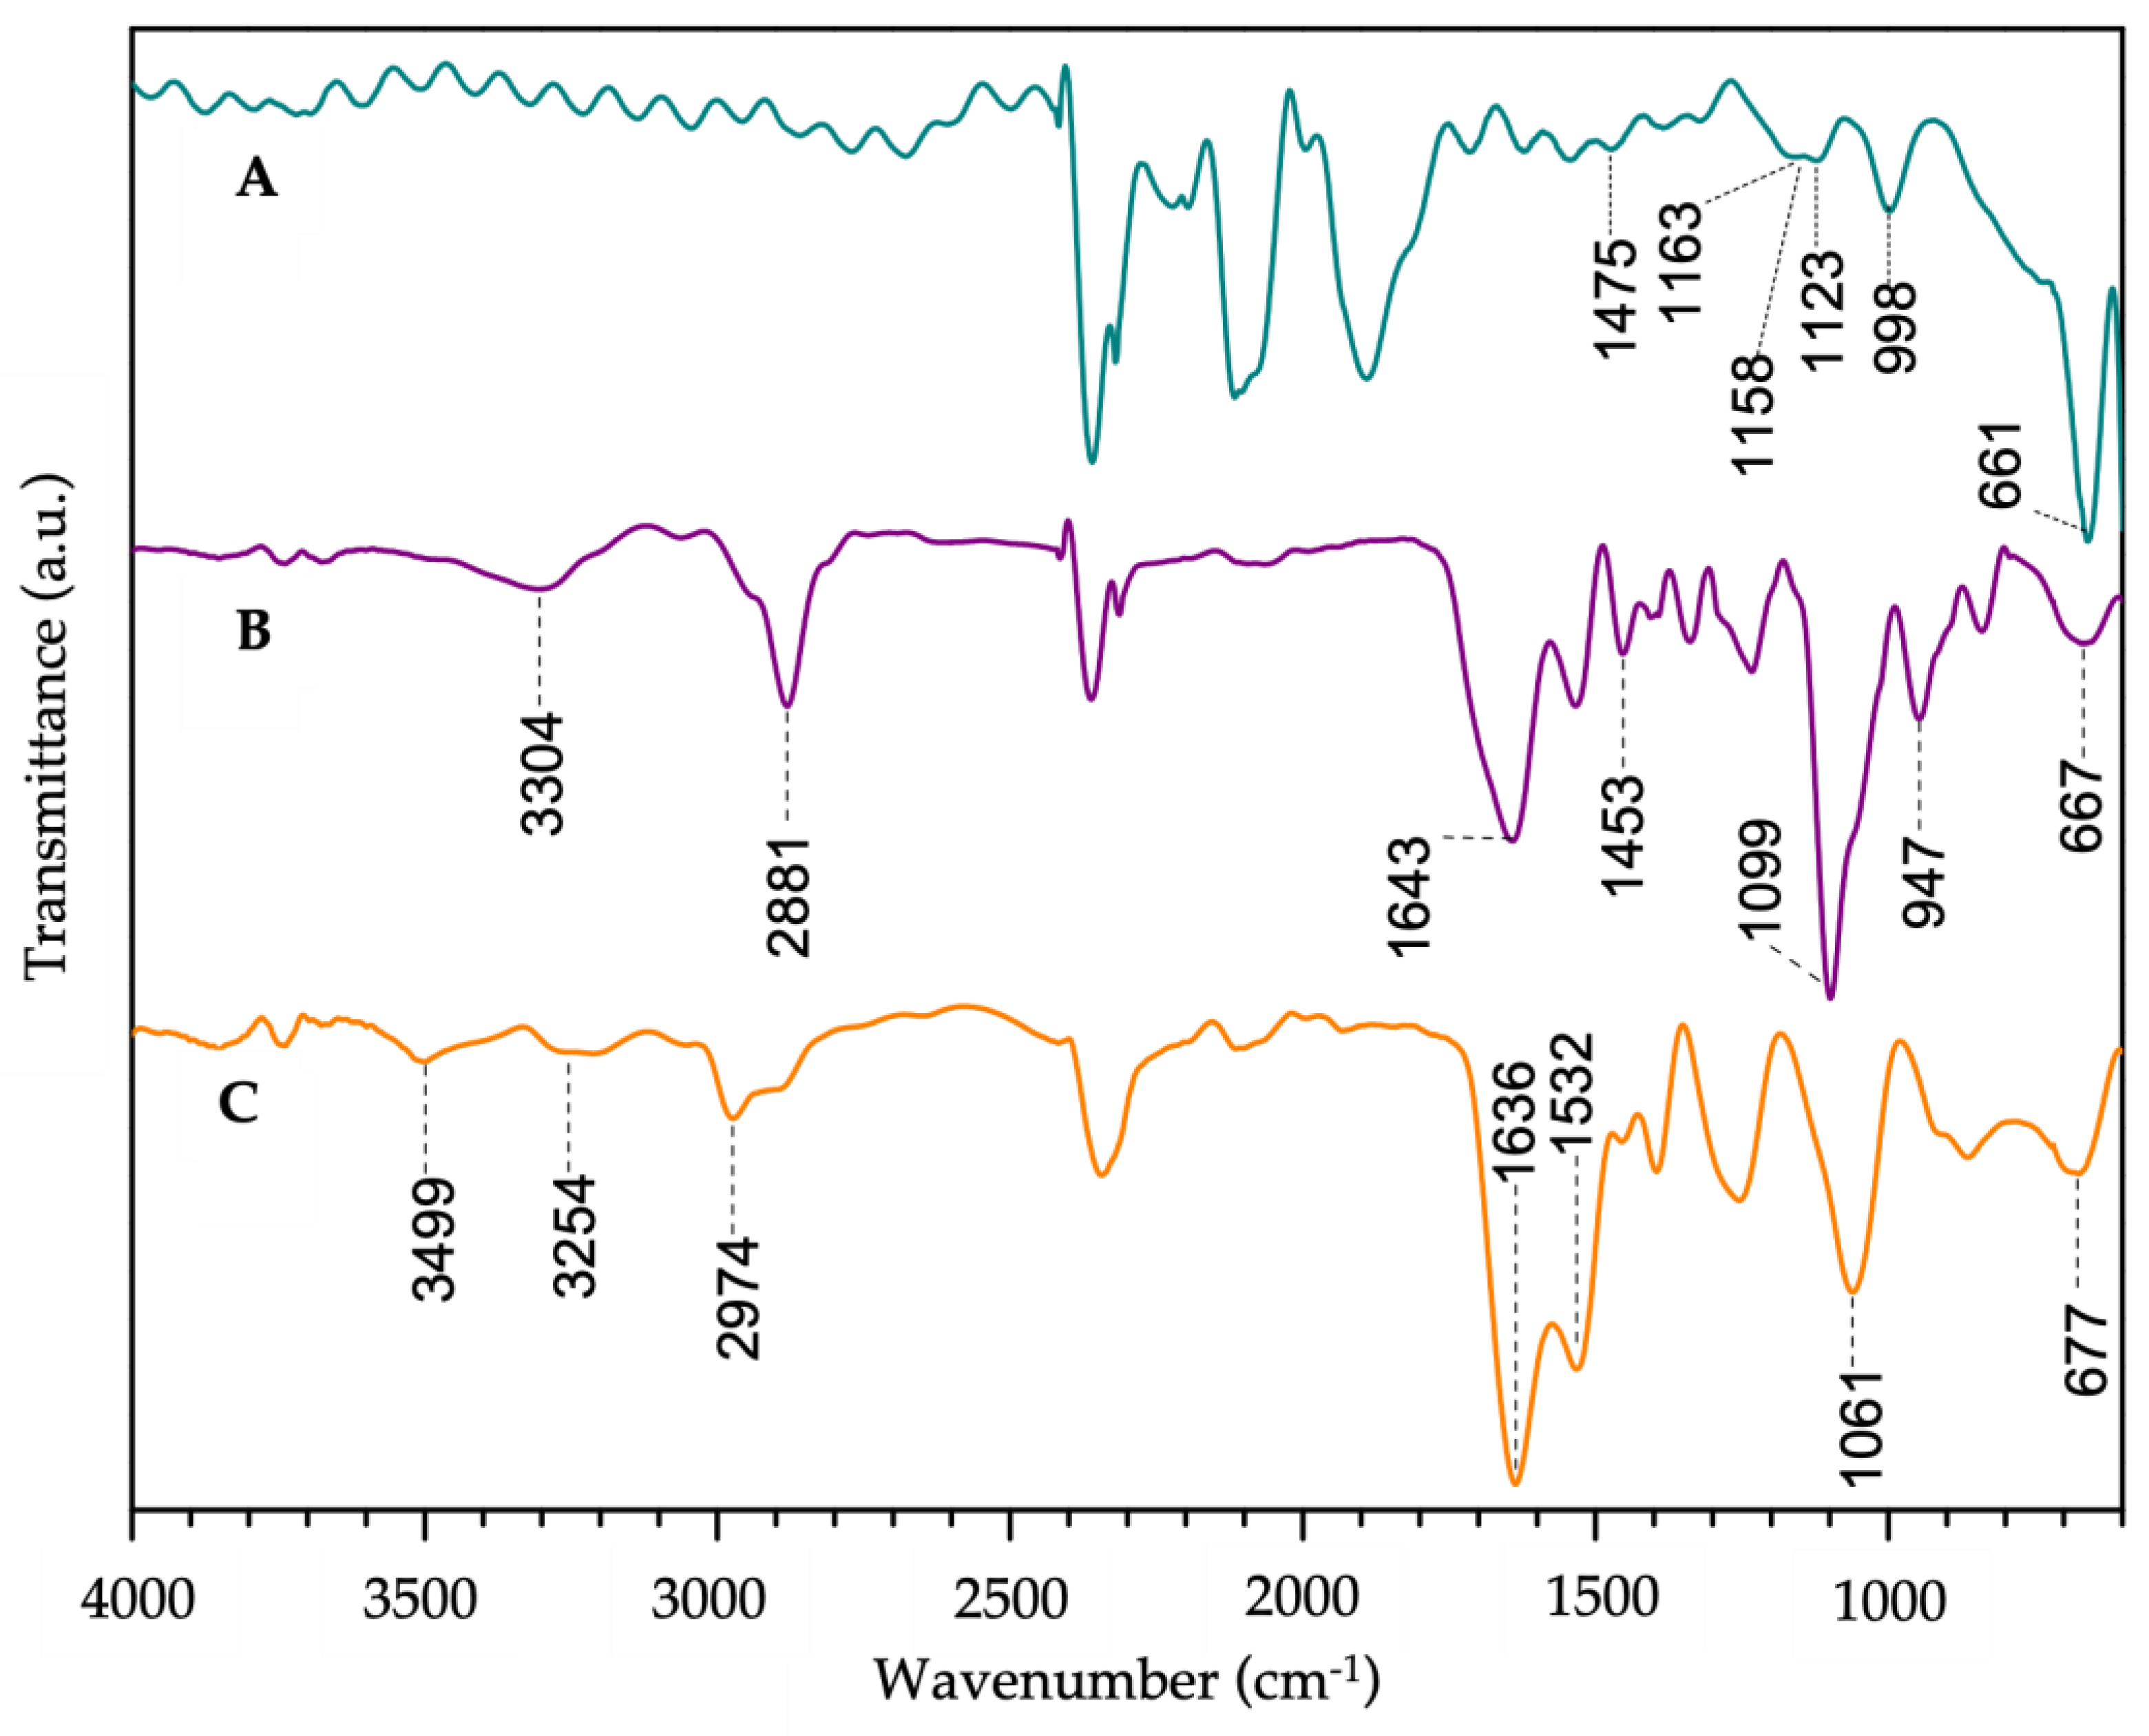
Figure 4.
Antimicrobial activity of AgNPs. Inhibition zones of the Ag-GluPEG, Ag-Kbs, and Ag-Kcap against (A) B. subtilis, (B) P. aeruginosa, and two strains of yeast, (C) a sensitive S. cerevisiae 5x47, and (D) the killer strain S. cerevisiae 42300. Representative images of the inhibition halos are shown in the E panel. *Significant differences in antimicrobial activity.
Figure 4.
Antimicrobial activity of AgNPs. Inhibition zones of the Ag-GluPEG, Ag-Kbs, and Ag-Kcap against (A) B. subtilis, (B) P. aeruginosa, and two strains of yeast, (C) a sensitive S. cerevisiae 5x47, and (D) the killer strain S. cerevisiae 42300. Representative images of the inhibition halos are shown in the E panel. *Significant differences in antimicrobial activity.
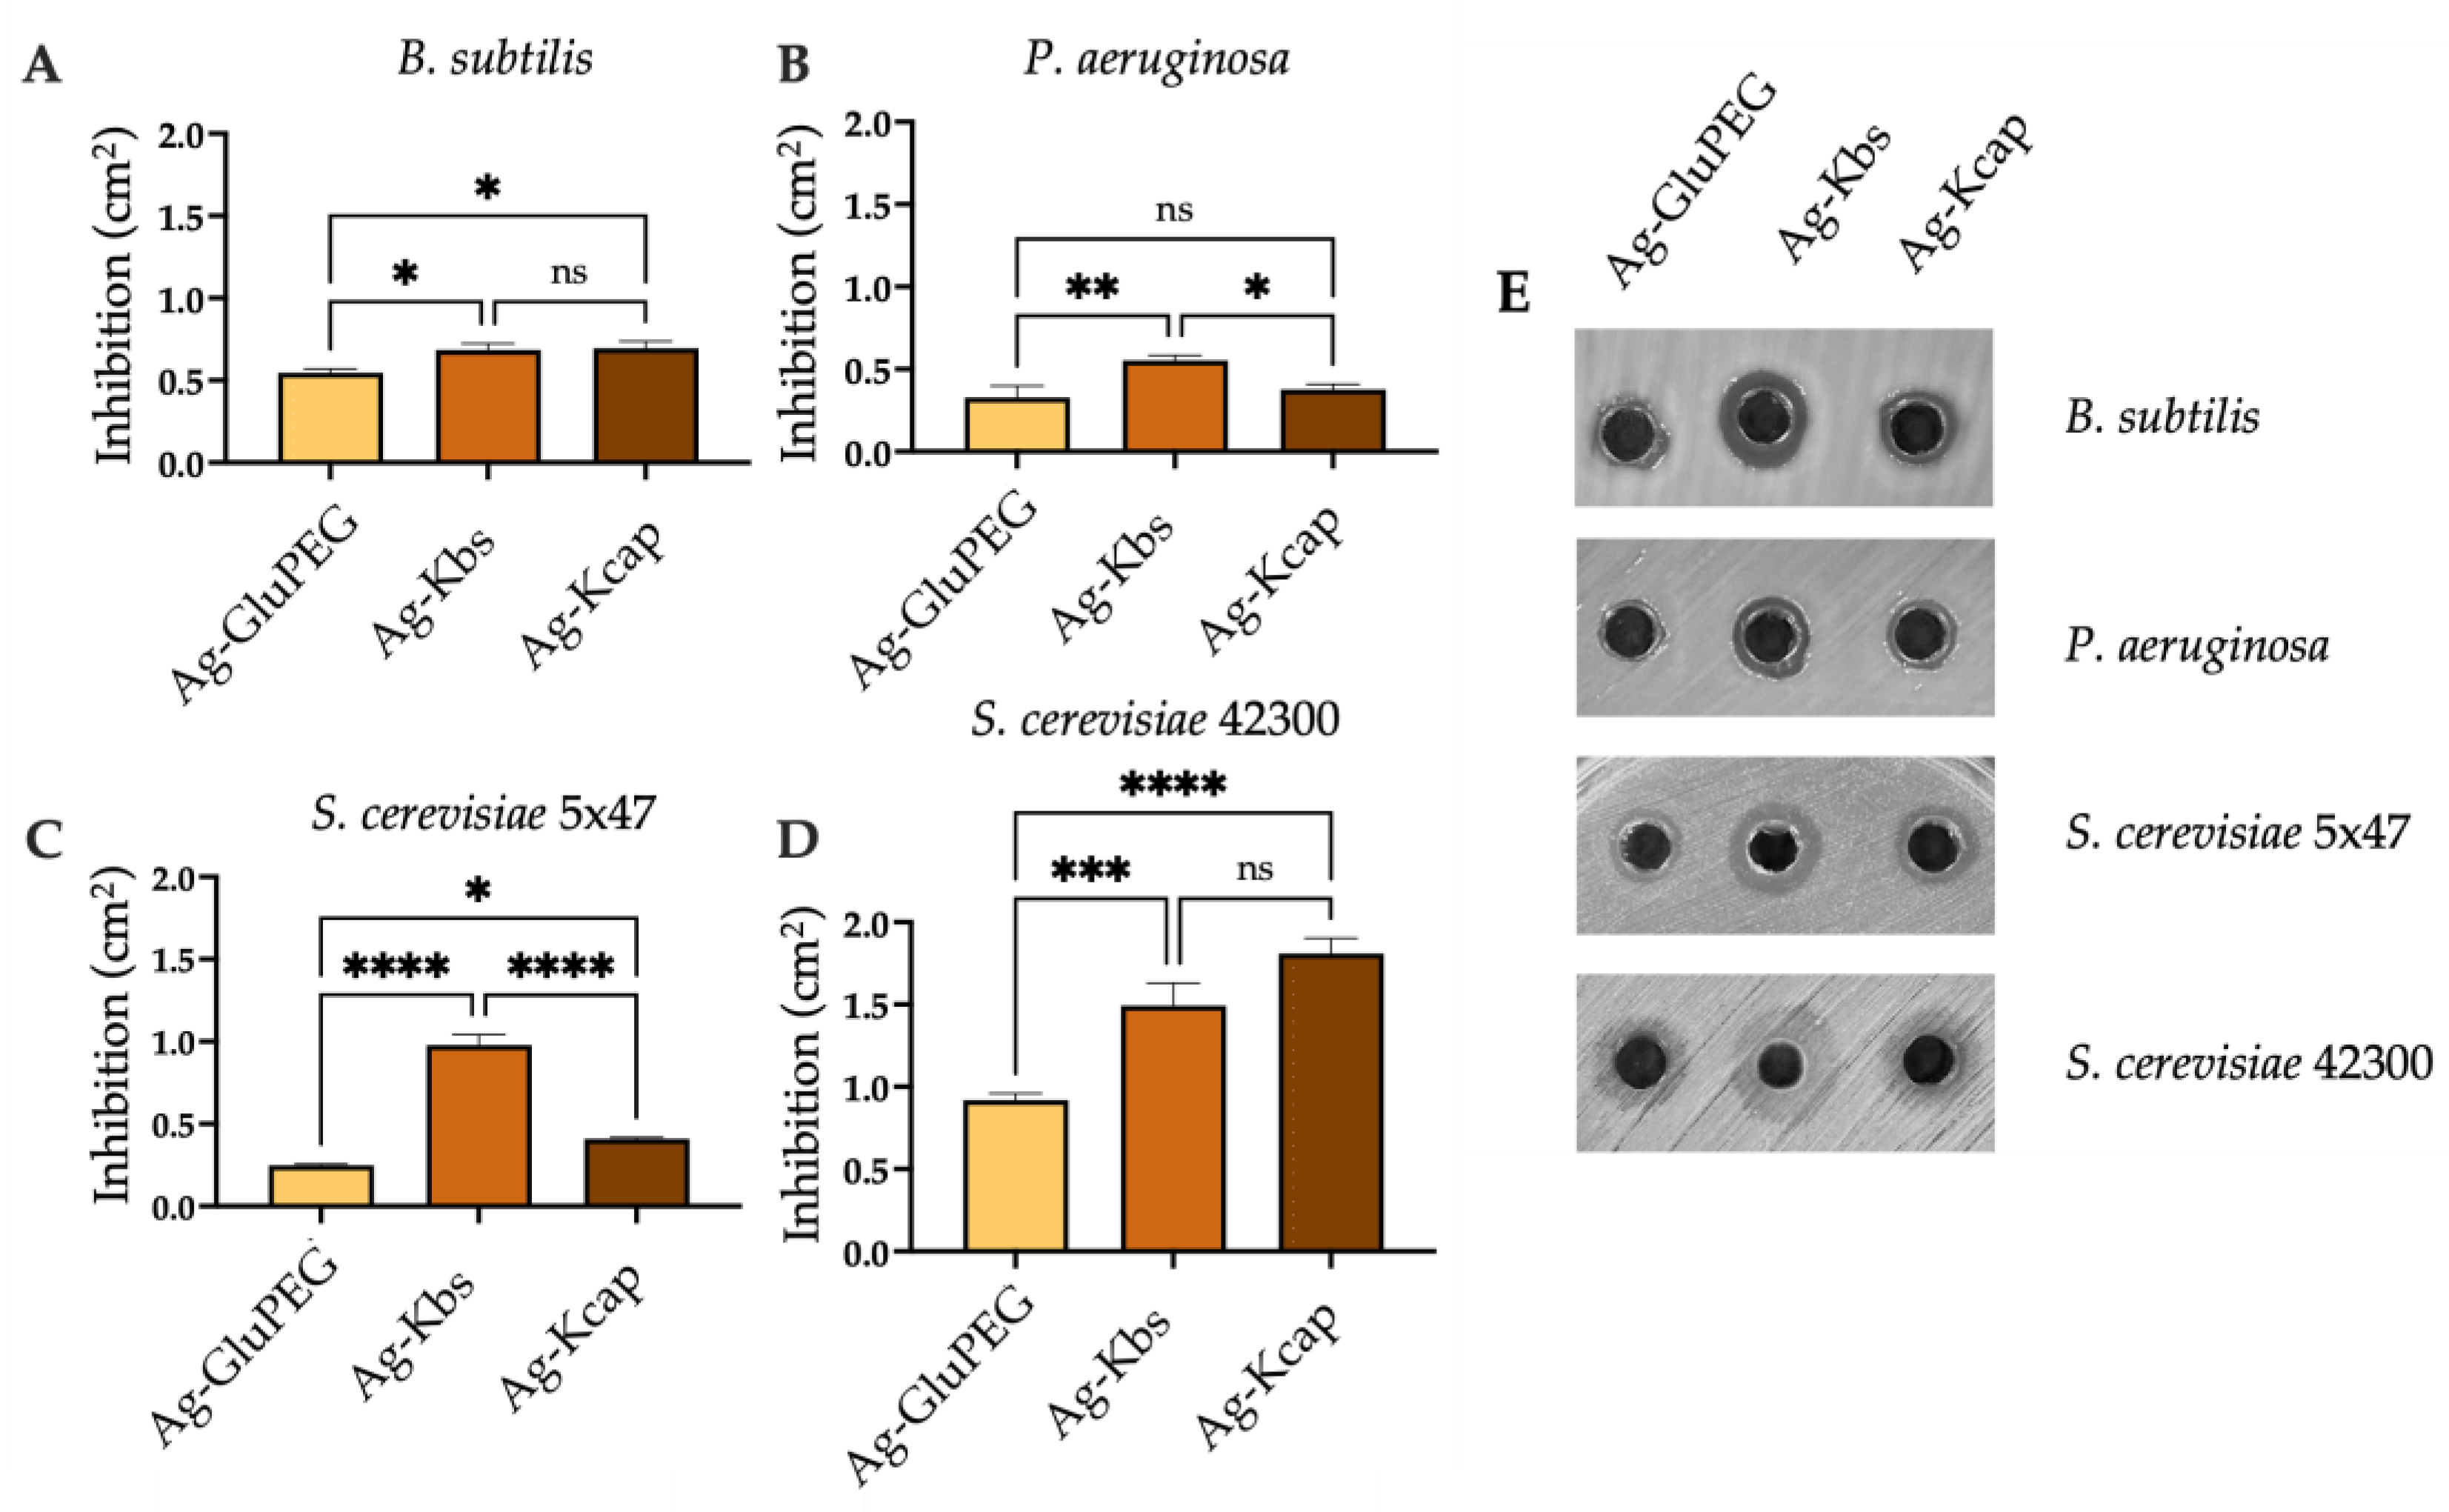
Figure 5.
MIC and Dose response modeling to determine the NPs’ dynamic differences. (A-C) Heatmaps present the normalized absorbance (O.D. at 600 nm) response of the bacterial and yeast strains, to serially diluted Ag-GluPEG (A), Ag-Kbs (B), and (C) Ag-Kcap nanoparticles. The MIC reported is the concentration at which there is no visible growth of the microorganism. (D-F) Dose-response curves of the normalized data are presented in the bottom panels. IC50 showed differences in the sensitivity of each microorganism against the different nanoparticles. The Heatmaps values are represented in arbitrary units. Heatmaps were generated in BioRender.
Figure 5.
MIC and Dose response modeling to determine the NPs’ dynamic differences. (A-C) Heatmaps present the normalized absorbance (O.D. at 600 nm) response of the bacterial and yeast strains, to serially diluted Ag-GluPEG (A), Ag-Kbs (B), and (C) Ag-Kcap nanoparticles. The MIC reported is the concentration at which there is no visible growth of the microorganism. (D-F) Dose-response curves of the normalized data are presented in the bottom panels. IC50 showed differences in the sensitivity of each microorganism against the different nanoparticles. The Heatmaps values are represented in arbitrary units. Heatmaps were generated in BioRender.
Disclaimer/Publisher’s Note: The statements, opinions and data contained in all publications are solely those of the individual author(s) and contributor(s) and not of MDPI and/or the editor(s). MDPI and/or the editor(s) disclaim responsibility for any injury to people or property resulting from any ideas, methods, instructions or products referred to in the content. |
© 2026 by the authors. Licensee MDPI, Basel, Switzerland. This article is an open access article distributed under the terms and conditions of the Creative Commons Attribution (CC BY) license (http://creativecommons.org/licenses/by/4.0/).
Copyright: This open access article is published under a Creative Commons CC BY 4.0 license, which permit the free download, distribution, and reuse, provided that the author and preprint are cited in any reuse.


