

Submitted:
14 July 2026
Posted:
15 July 2026
You are already at the latest version
Abstract
Adult crayfish P. leniusculus originating from wild stocks of northwestern Greece, Epirus County, were randomly allocated in indoor RAS aquaria, following two dietary protocols: a semi-purified diet by total substitution of fish oil and entire substitution of fishmeal with plant-derived materials, and a control diet consisting of fresh Pangasianodon spp. and mixed vegetables. The semi-purified diet had a P: E ratio of 22.74 mg Prot. kj-1, a Protein level of 38.68% and a Crude Lipid level of 9.51% (on a DM basis), while the control diet had a P: E ratio of 22.13 mg Prot. kj-1, a Protein level of 37% and a Crude Lipid level of 4.5% (on a DM basis). Despite the total substitution of corn oil by soy oil, the exclusion of fish oil and the entire substitution of fishmeal by other plant-derived materials, the semi-purified diet did not hinder growth throughout the experiment with acceptable survival rates. It has also been demonstrated that the signal crayfish P. leniusculus has limited dietary requirements for the PUFAs EPA & DHA and that dietary linoleic and linolenic acids are indispensable for the species. Finally, the ability of signal crayfish for bioconversion of EPA to DHA remains questionable.
Keywords:
Pasifastacus leniusculus
; signal crayfish
; freshwater crayfish
; EPA
; DHA
; semi-purified diets
; fishmeal & fish oil substitution
1. Introduction
The crayfish Pacifastacus leniusculus is a North American species, indigenous of the West Coast (California), first appearing around 1800 AC at the Lake Tahoe [1,2]; (Watkins 1986; Holdich et al. 2009). Nowadays, this species has a worldwide distribution, firstly introduced in Europe in the late 50’s in Sweden and then spread all around the European continent, particularly Central and Northern Europe and with some populations in the Iberian Peninsula [2] (Holdich et al., 2009). In Greece, on July 1982, a thousand (1000) juveniles (0.3g-0.5g) of P. leniusculus originating from the Swedish SIMONTROP station, were firstly introduced at the Kalamas River (North-western Greece, Epirus County) under the supervision of the scientific personnel of the Louros freshwater fish breeding station (North-western Greece, Epirus County). A month after their first introduction, these juveniles experienced high mortality which has been attributed mainly to the outbreak of Aphanomyces astaci, already existing and decimating local populations of Astacus astacus [3] (Theocharis 1986). In 1987, a new acclimatization attempt of P. leniusculus has taken place in the same area, but with no apparent success [4] (Koutrakis et al., 2007). Similar attempts with P. leniusculus in the early 80’s, have taken place in the artificial Agra lake, Region of Western Macedonia [4] (Koutrakis et al., 2007). More recent information confirms that populations of P. leniusculus still exist in the two abovementioned Counties of Epirus and Western Macedonia, Greece [5] (Perdikaris et al. 2017)
Previous investigation [6,7] (Pantazis et al. 2016; Pantazis et al. 2022) has demonstrated that corn oil, fish oil and fishmeal can be entirely of partially substituted with other plant-derived materials without negatively affecting growth and survival of Astacus astacus populations in semi-intensive / intensive recirculation systems.
This experiment aimed at refining the nutritional profile of a previously manufactured for A. astacus semi-purified diet [6,7] (Pantazis et al. 2016; Pantazis et al. 2022) by total substitution of fish oil and fishmeal with plant-derived materials, but for P. leniusculus kept in intensive recirculation systems.
2. Materials and Methods
2.1. Experimental Set Up and Husbandry
The experimental population originated from wild stocks of northwestern Greece, Epirus County.
Fifteen adult crayfish of an Average Weight (A.W.) = 35.93g (±6.28 SD) were randomly allocated in three indoor aquaria (5 individuals per aquarium) for ninety-two (92) days and fed a semi-purified diet (SPD). An additional stock of fifteen adult crayfish of an Average Weight (A.W.) = 32.68g (±8.61 SD) were randomly allocated in three (similar to the above) aquaria (5 individuals per aquarium) for the same time period and fed a control diet (CD) consisting of fresh fish (Pangasianodon spp.) and mixed vegetables (frozen pack supplied from local supermarket containing peas, carrots and potatoes).
Samplings to estimate the A.W. and the PUFAs profile of the tail muscle, were performed at regular intervals: Day-1, Day-32, Day-45, Day-62, Day-80 and Day-92.
Each aquarium had a capacity of 285L and individual biological filters to keep the recirculating water in a proper physicochemical condition. Each aquarium hosted five crayfish, each crayfish isolated from the rest within an individual chamber (20 cm Χ30 cm Χ50 cm) made by a stainless steel mesh to avoid intra-specific competition and cannibalism.
Two indices have been estimated as follows:
PWG (Percentage Weight Gain)=100*[(FBW–IBW)/IBW]
FBW = final body weight, IBW= initial body weight
SGR (Specific Growth Rate) = [(lnFBW-lnIBW)/(t1-t2)] *100
FBW = final body weight, IBW= initial body weight, t1-t2 = Number of days of trial
The moisture level (53.2%) of the semi-purified diet, the moisture level of the control diet (84.45%) and the incorporated raw materials and stability factors (gelatin, yeast, molasses, CMC - carboxymethylcellulose) allowed for the diets to keep their dough-like texture, be able to stay by the individual shelters and remain stable in the water for at least 1.0 h without experiencing any severe disintegration. Quantities of administered diets have been calculated based on previous observations [6] (Pantazis et al. 2016) and administered at 2.0% – 2.5% of Bodyweight (b.w).day– 1.individual-1.
Euthanasia of experimental animals has been accomplished by a two-step procedure [8] (AVMA 2020): overdose of a general anesthetic has been followed by an adjunctive method that destroys the brain or major ganglia physically (e.g., pithing, freezing).
2.2. Experimental Diet and Analytical Methods
The semi-purified diet has been an optimization of the previous ones [6,7] (Pantazis et al. 2016; Pantazis et al. 2022) by total exclusion of corn oil and fish oil and by entire substitution of fishmeal as follows: fishmeal 0.0 % (from previous 8%), fish oil 0.0 %(from previous 2%), soy oil at 8% (from previous 6%) casein at 19% (similar to previous %), gelatin at 10% (from previous 7%), CMC (carboxymethylcellulose) at 1%, molasses at 10% (from previous 8%), yeast at 11% (from previous 5%), gluten 4%( from previous 1%), vitamin and mineral premix at 10% and cholesterol 1% [9] (Zandee 1967).
The semi-purified diet was prepared manually at the Laboratory of Animal Husbandry and Nutrition (Faculty of Veterinary Medicine) with the aid of a mixer (Kenwood Cooking Chef, Kenwood, Hampshire, UK) and oven-dried at 40o - 45o C in order to achieve a moisture level of 53.2%. The nutritional profile of the diet has been determined by methods as described in EC regulation No 152/2009 (Official Journal of the European Union, L54/1, 26.02.2009). The diet had the following nutritional profile (on a Dry Matter –D.M.- basis): Crude Protein 38.68%, Crude Lipid 9.51%, Crude Fiber 10.30%, NFE 38.03%, Ash 3.46%, Gross Energy 17.00 kj.gr-1 (4.063 kcal. gr-1), Protein: Energy (P: E) ratio = 22.74 mg Prot. kj-1 (95.18 mg Prot.kcal-1).
The control diet (CD) consisted of fresh fish (Pangasianodon spp.) at 20% of wet weight and mixed vegetables at 80% of wet weight (frozen pack supplied from local supermarket containing peas, carrots and potatoes). The ingredients of the CD were grinded and mixed with CMC at 1.5% of the wet weight of the mixture in order to secure the stability of the control diet. The nutritional profile of the CD (on a D.M.- basis) has been determined as follows: Crude Protein 37%, Crude Lipid 4.5%, Crude Fiber 4.5%, NFE 50%, Ash 4.46%, Gross Energy 16.83 kj.gr-1 (4.022 kcal. gr-1), Protein: Energy (P: E) ratio = 22.13 mg Prot. kj-1 (93.1 mg Prot. kcal-1).
At the onset of the experiment and before the administration of experimental diets, six crayfish, one from each aquarium (there were six tanks = 3 tanks for treatment and 3 tanks for control) have been euthanized and their tail muscle has been subjected to fatty acid analysis [10] (O’Fallon et al. 2007). A similar sampling procedure and fatty acid analysis has been implemented at the following intervals after the onset of the experiment at Day-32, Day-45, Day-62 and Day-92.
2.3. Fatty Acid Methyl Ester (FAME) Synthesis and Determination
Total lipids of the tail muscle were determined according to the method of Weibull–Stoldt stated by Walstra and Mulder (1963) [11].
The fatty acids of the diets and the entire tail muscle fat were extracted and methylated directly, according to O’Fallon et al. (2007) [10]. Duplicate 1 g samples were hydrolyzed for 1.5 h at 55 oC in 1 N potassium hydroxide in methanol, containing a known amount (approx. 0.5 mg) of tridecanoic acid (C13:0) methyl ester as an internal standard. The free fatty acids were methylated by sulphuric acid catalysis for 1.5 h at 55 oC. The fatty acid methyl esters were pipetted into a clean reaction tube and evaporated under a nitrogen stream at 55 oC. Methyl esters were then rediluted in 0.5 ml hexane, transferred into gas chromatography vials and kept at –20 oC. They were subsequently analyzed by gas chromatography in a temperature-programmed run using a Hewlett Packard 5890 gas chromatograph equipped with a 60m x 0.25mm i.d.×0.2μm film thickness HΡ-88 capillary column and a flame ionisation detector (FID). Helium was the carrier gas at a constant pressure of 18 psi and the temperature of both the injector and FID was set at 250°C. Fatty acids were identified by comparison with standards purchased from Sigma-Aldrich Co. (FAME Mix 37 - CRM47885 Supelco). Quantification was achieved using the internal standard added prior to hydrolysis.
Saturated fatty acids (SFA) were the sum of C12:0, C14:0, C15:0, C16:0, C17:0, C18:0, C19:0 andC20:0. Monounsaturated fatty acids (MUFA) were the sum of C14:1, C15:1, C16:1n-7, C17:1n-7, trans-C18:1, C18:1n-9, C18:1n-7 and C20:1, where trans-18:1 was the total of trans-monoenoic isomers (mainly tC18:1n-9 and tC18:1n-7).
2.4. Water Quality and Other Analytical Methods
Conductivity (EC), total dissolved solids (TDS) and pH measurements were made using a Milwaukee digital laboratory versatile bench meter (model MW180 max) according to the official method by APHA (Standard Methods of Water Analysis). pH calibration has been performed by a 5-point calibration (using a selection of 7 standard calibration buffers and two custom buffers). Conductivity and TDS calibration has been performed using two standard solutions of 84 and 1413 μs/cm. Total hardness of the water samples has been determined using the EDTA (Ethylenediaminetetraacetic acid) method, which involves a titration with EDTA to complex with calcium and magnesium ions.
Ammonia, nitrites and nitrates have been recorded by a Hanna C200 / HI83000 spectrophotometer and oxygen has been recorded by a Handy Polaris Oxyguard oxygen meter.
For the statistical analysis of data, the SPSS 29.0.2.0. Software has been used. Experimental groups have been tested for normality by the Shapiro-Wilk and the Kolmogorov-Smirnov tests which have shown the lack of normal distribution for growth data. Consequently, the Mann–Whitney U non-parametric test has been used to estimate the significant differences in the growth among experimental animals. To compare values among specific fatty acids in time and in-between treatments, the paired sample t-test has been used.
3. Results
3.1. Water Quality
Water quality parameters in the tanks and at regular sampling intervals are shown in Table 1.
3.2. Husbandry, Growth and Survival
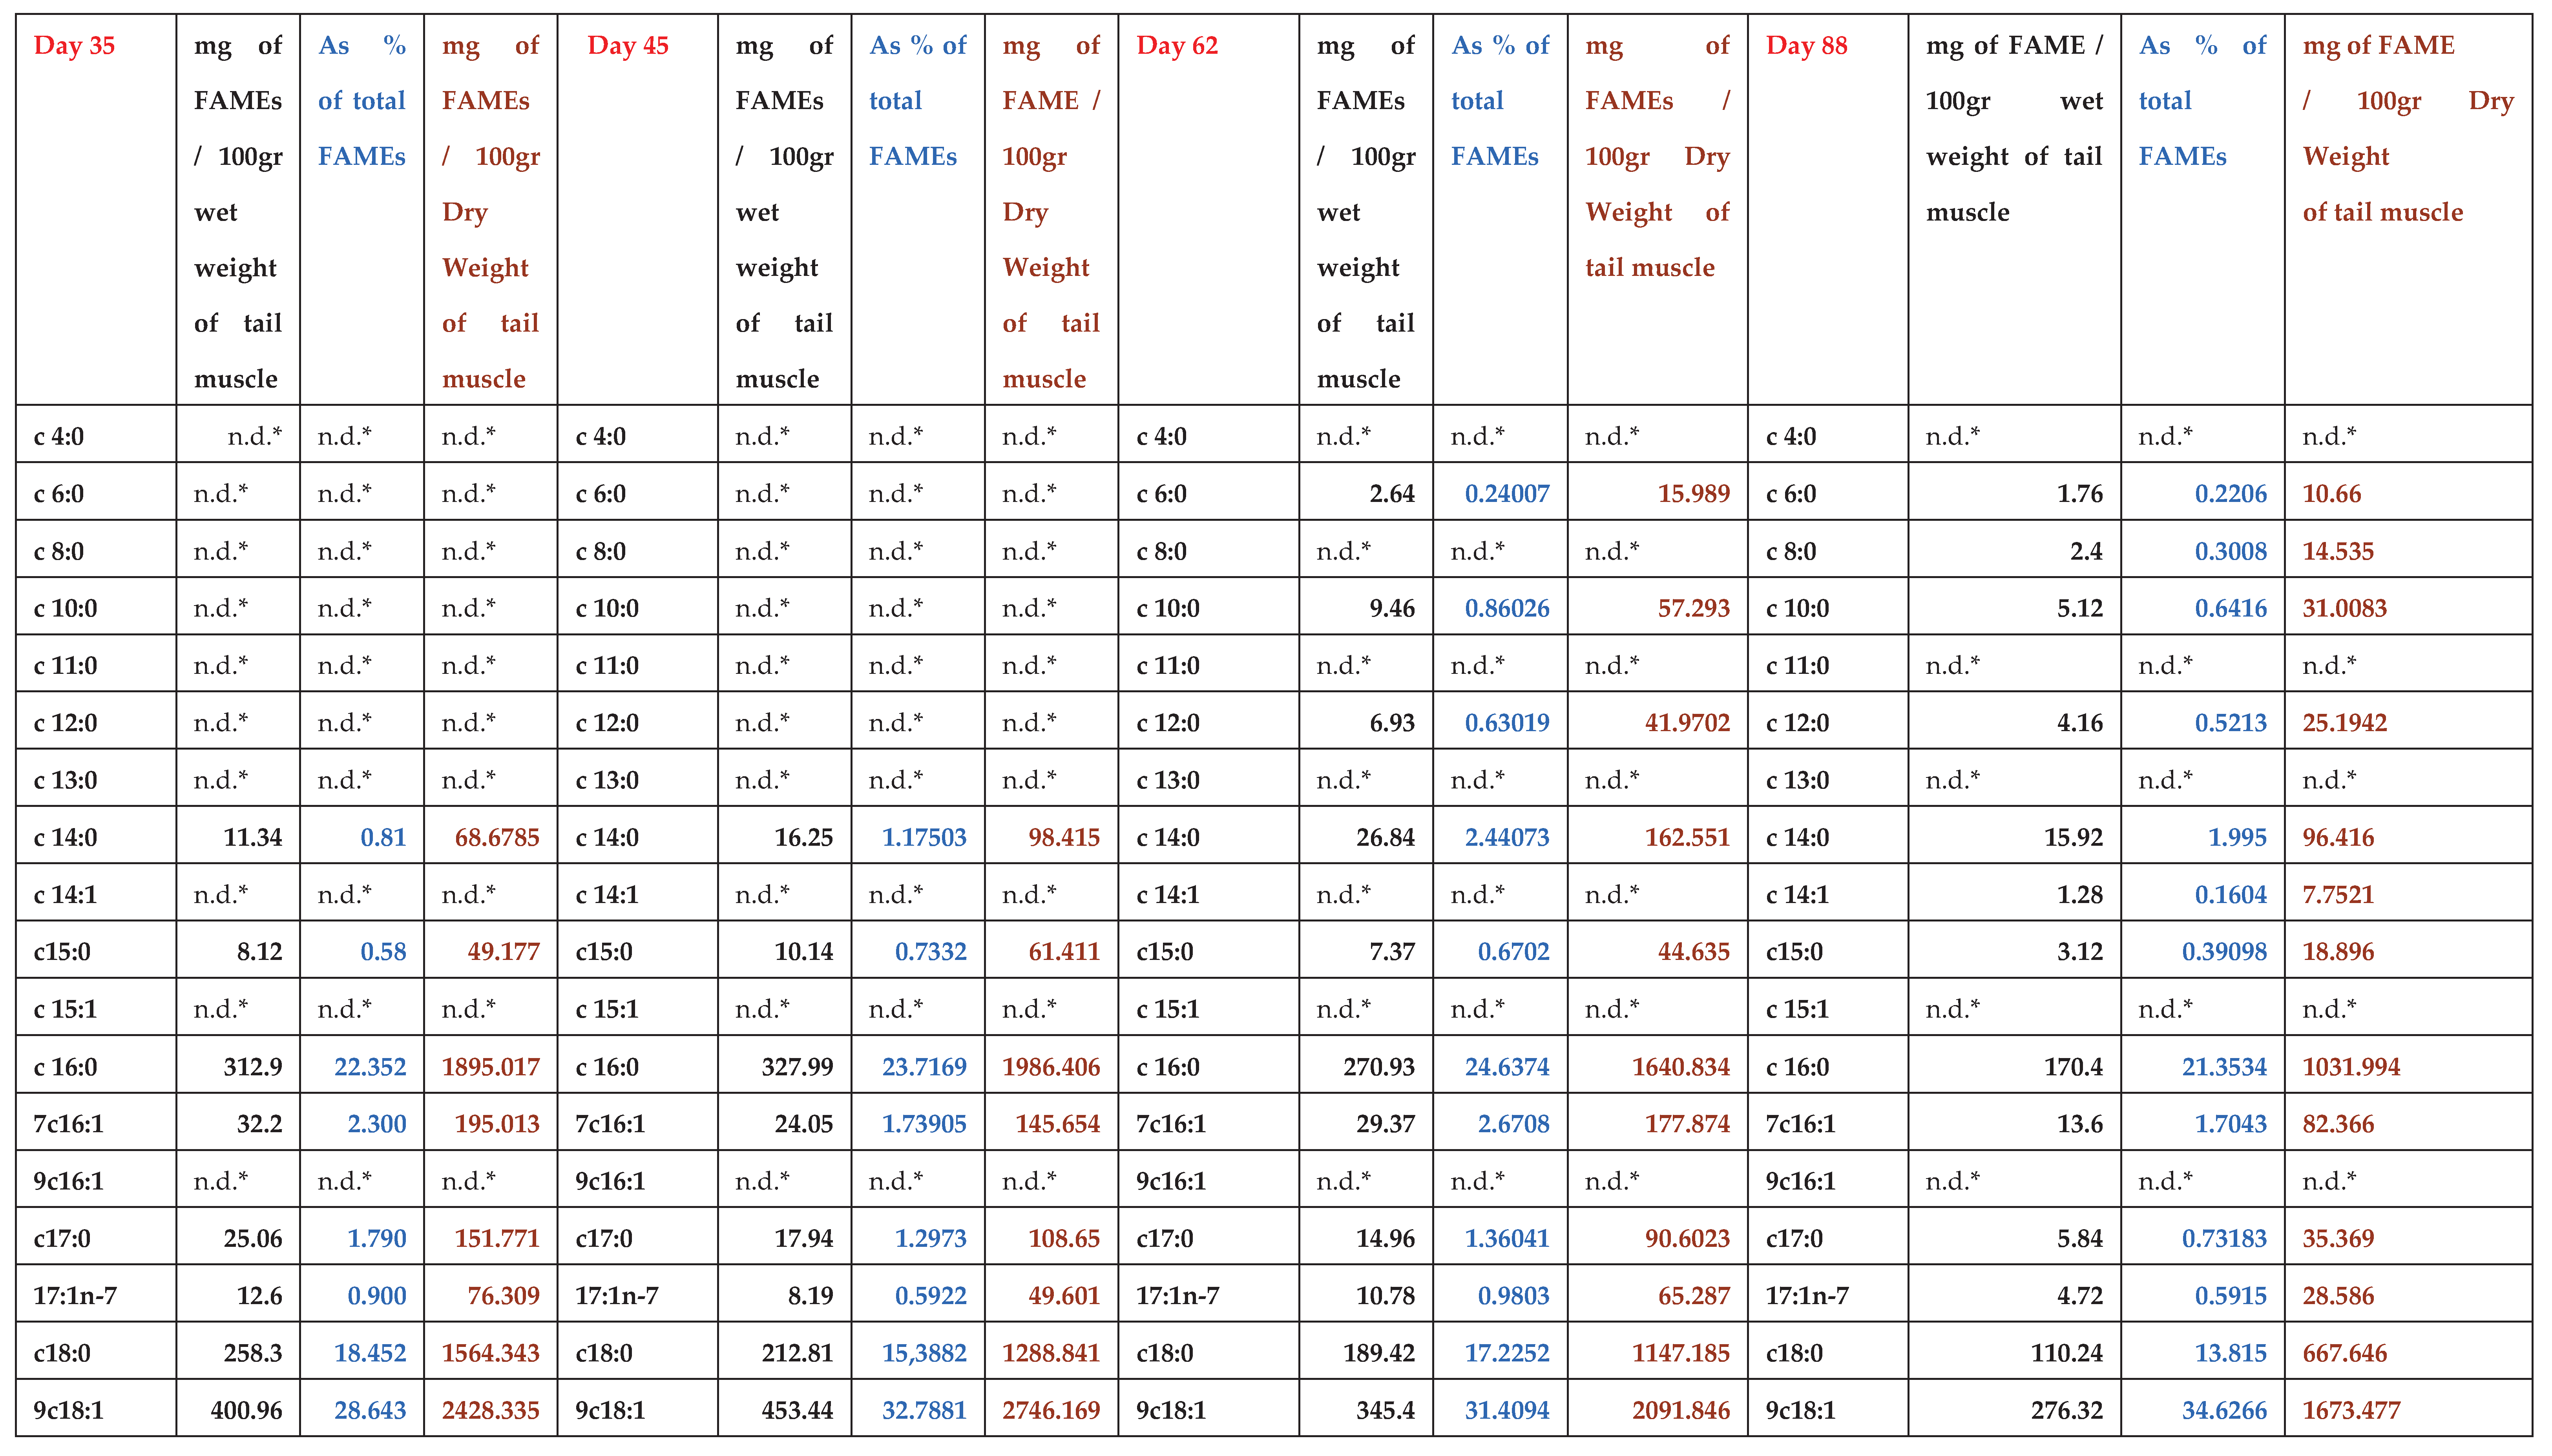
The Normality tests (Appendix, Table A1.) have shown that non-parametric tests should be used in order to compare Average Weights overtime. The Mann–Whitney U test (Appendix, Table A2.), has shown that there hasn’t been statistical difference in the Average Weights overtime in-between the two groups Treatment - Control (U = 381.000, Z = -0.107, p = 0.915). The Treatment Group had a higher Mean Rank (Treatment Mean Rank = 28.71) compared to the one of the Control Group (Control Mean Rank = 28.24), however these were not statistically different (Appendix, Table A2.).
Table 4 indicates the achieved values for PWG and SGR for treatment and control crayfishes.
3.3. Fatty Acid Profiles
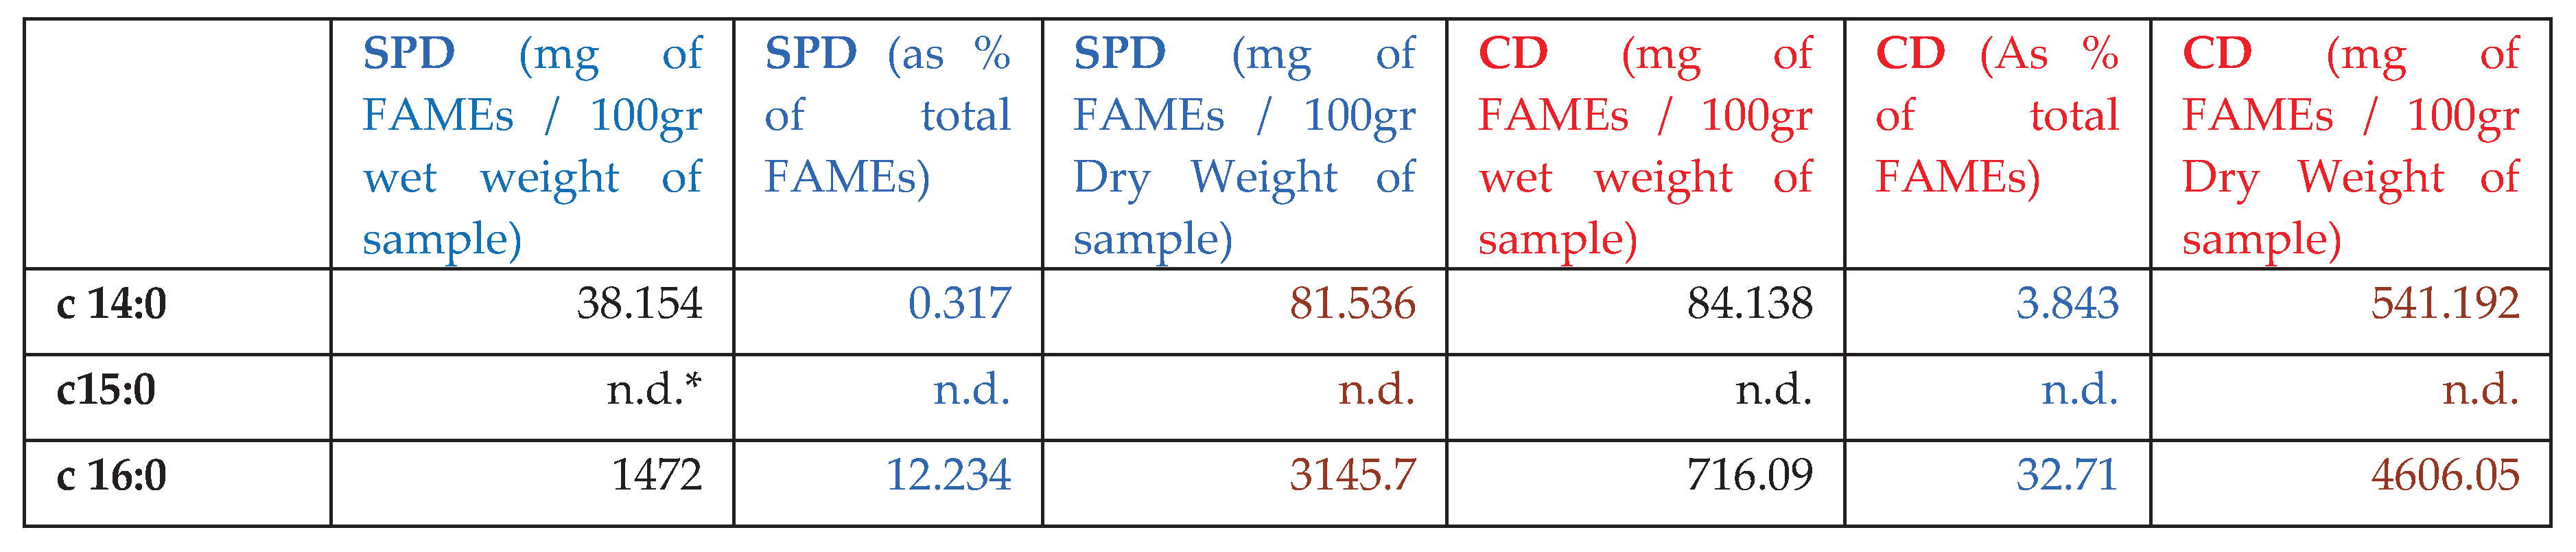
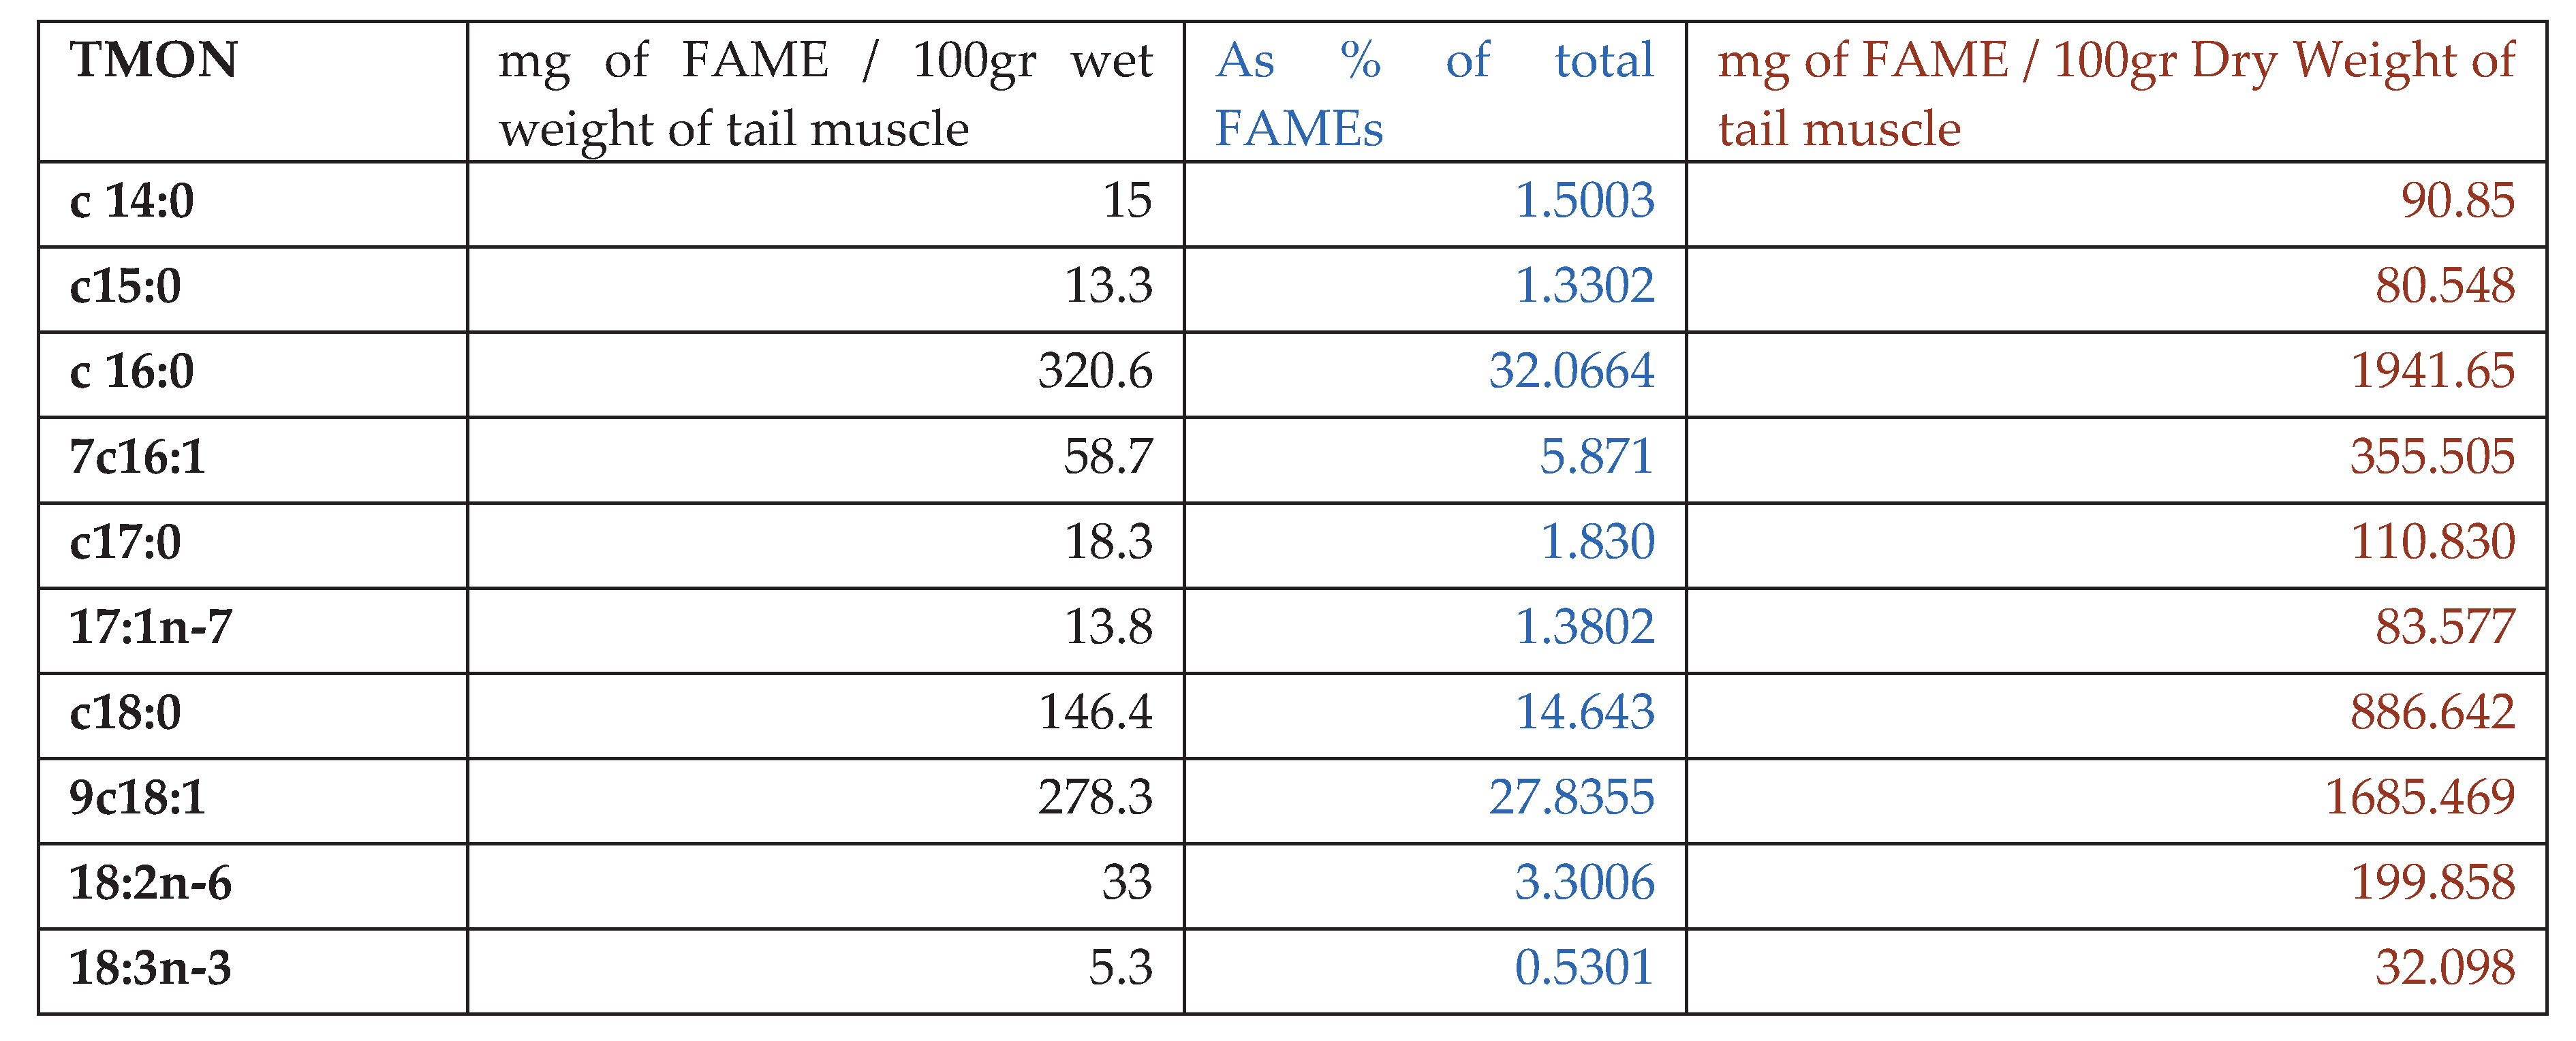
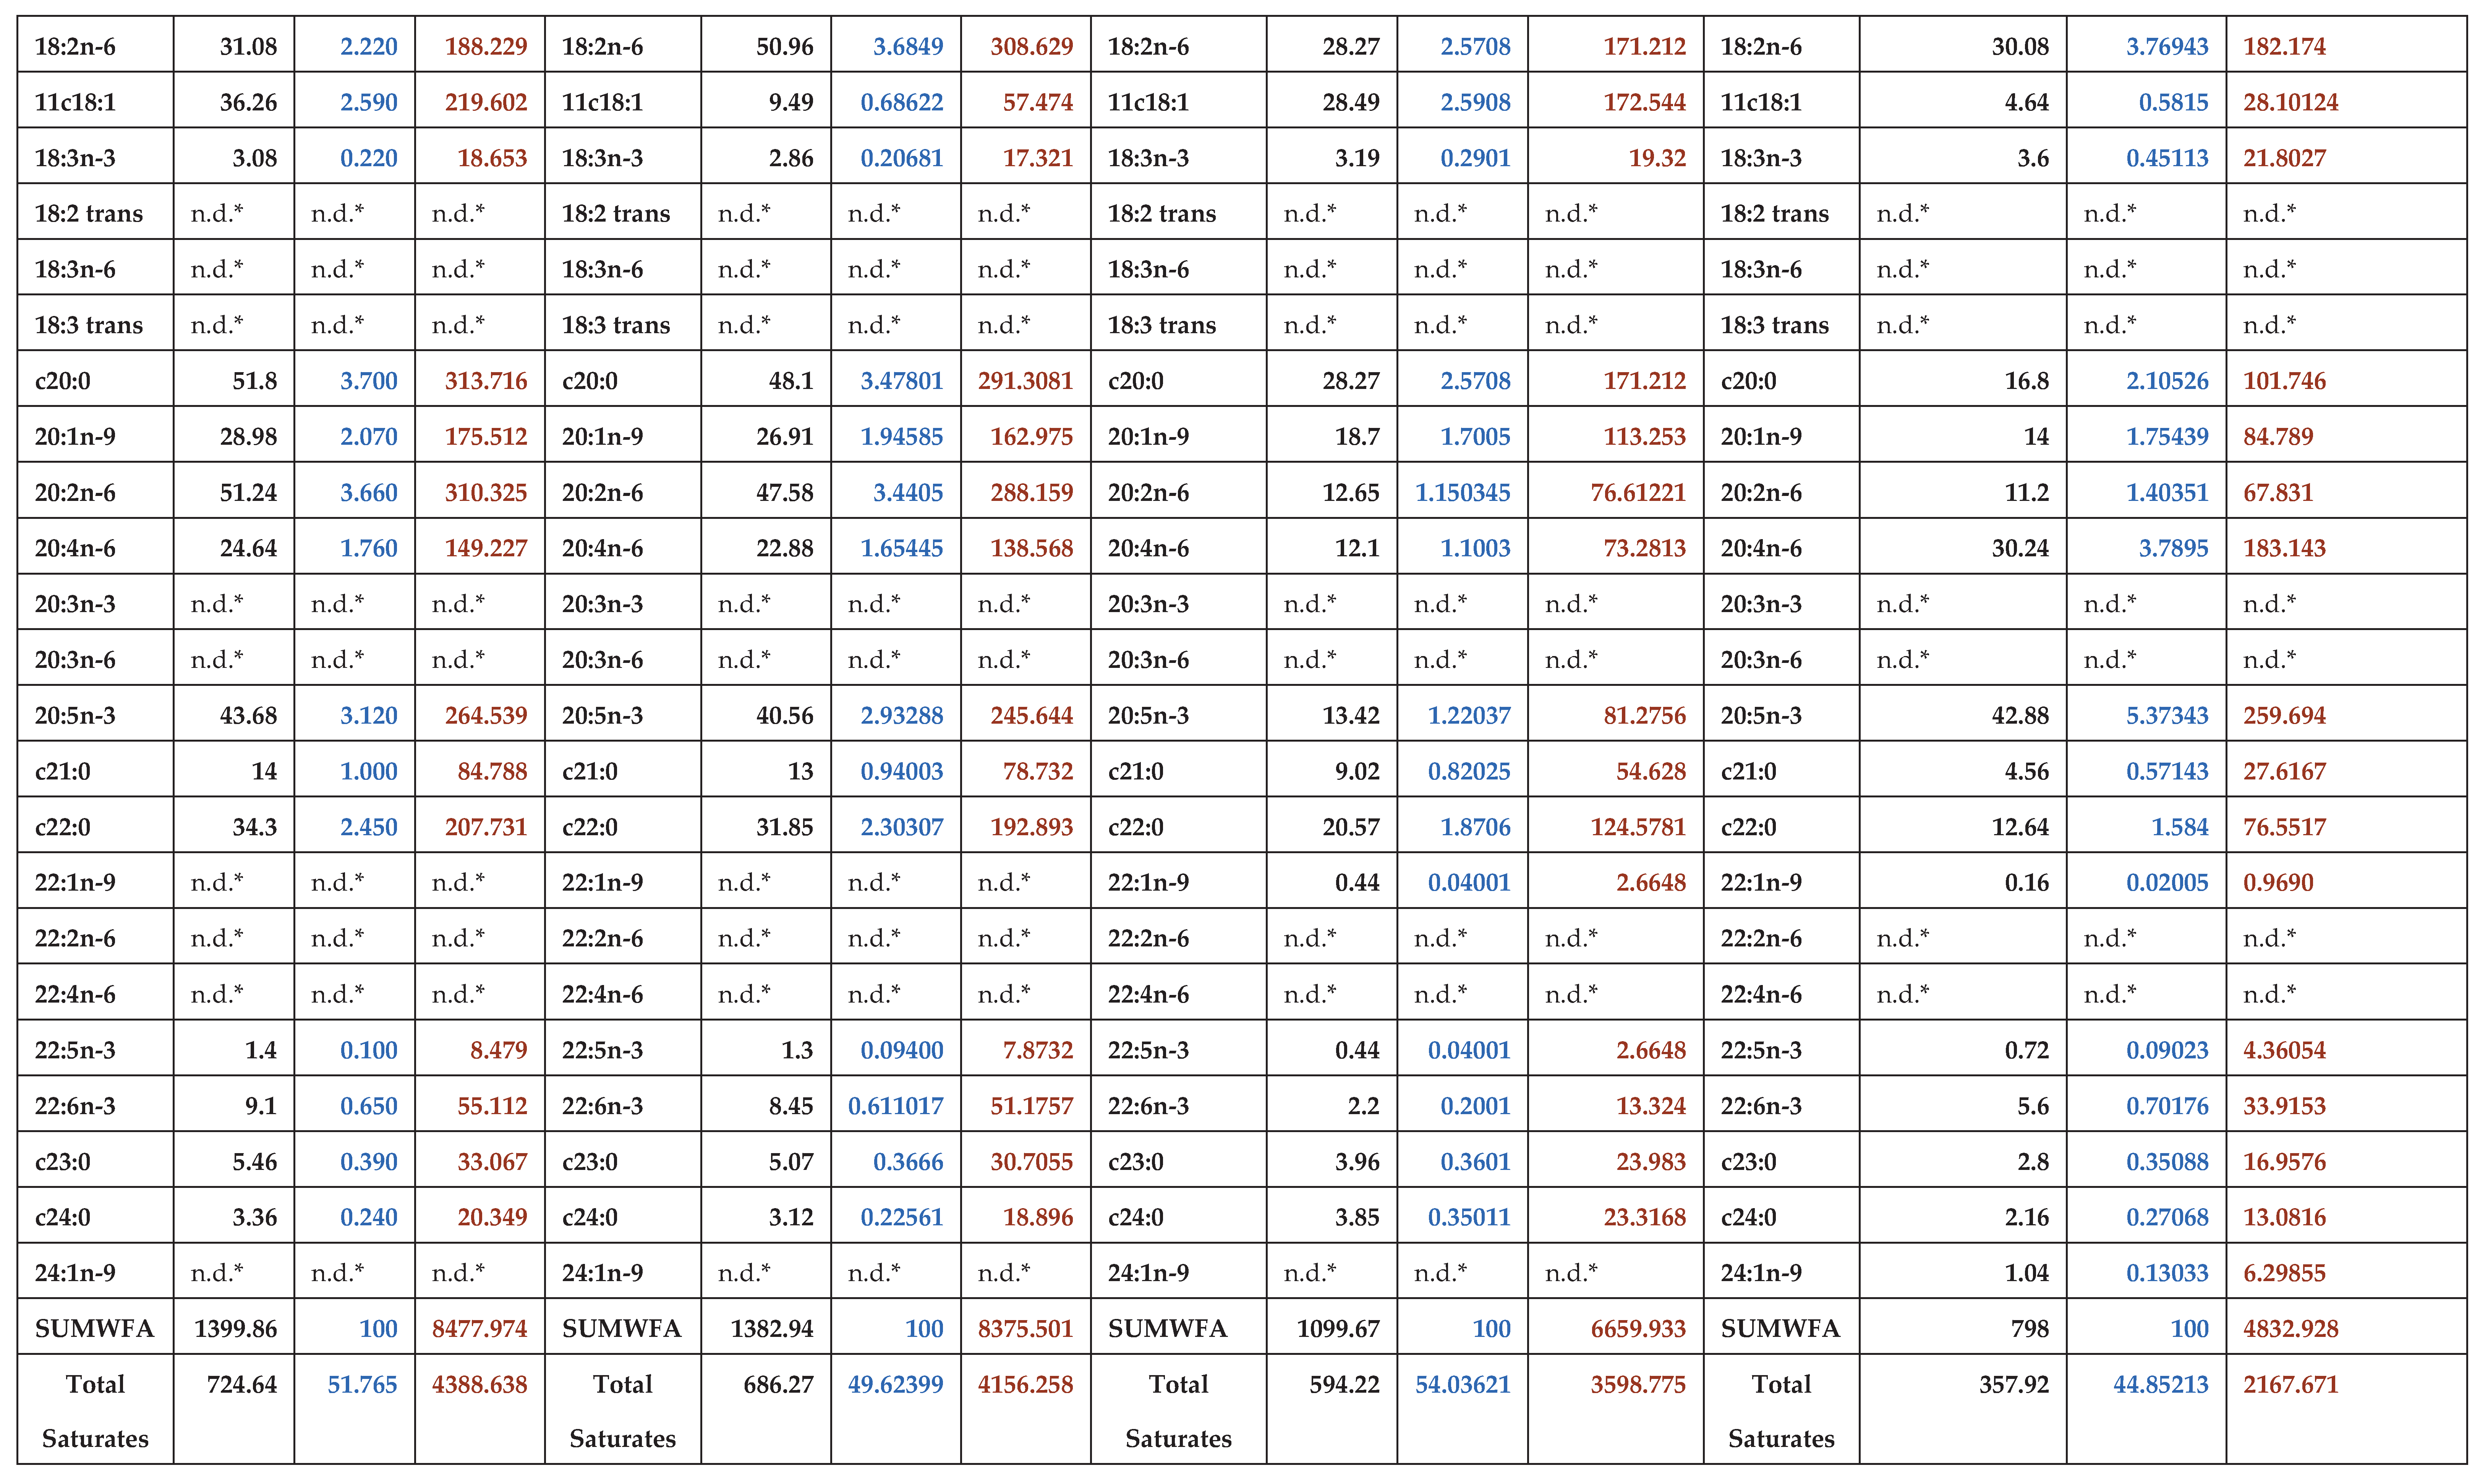
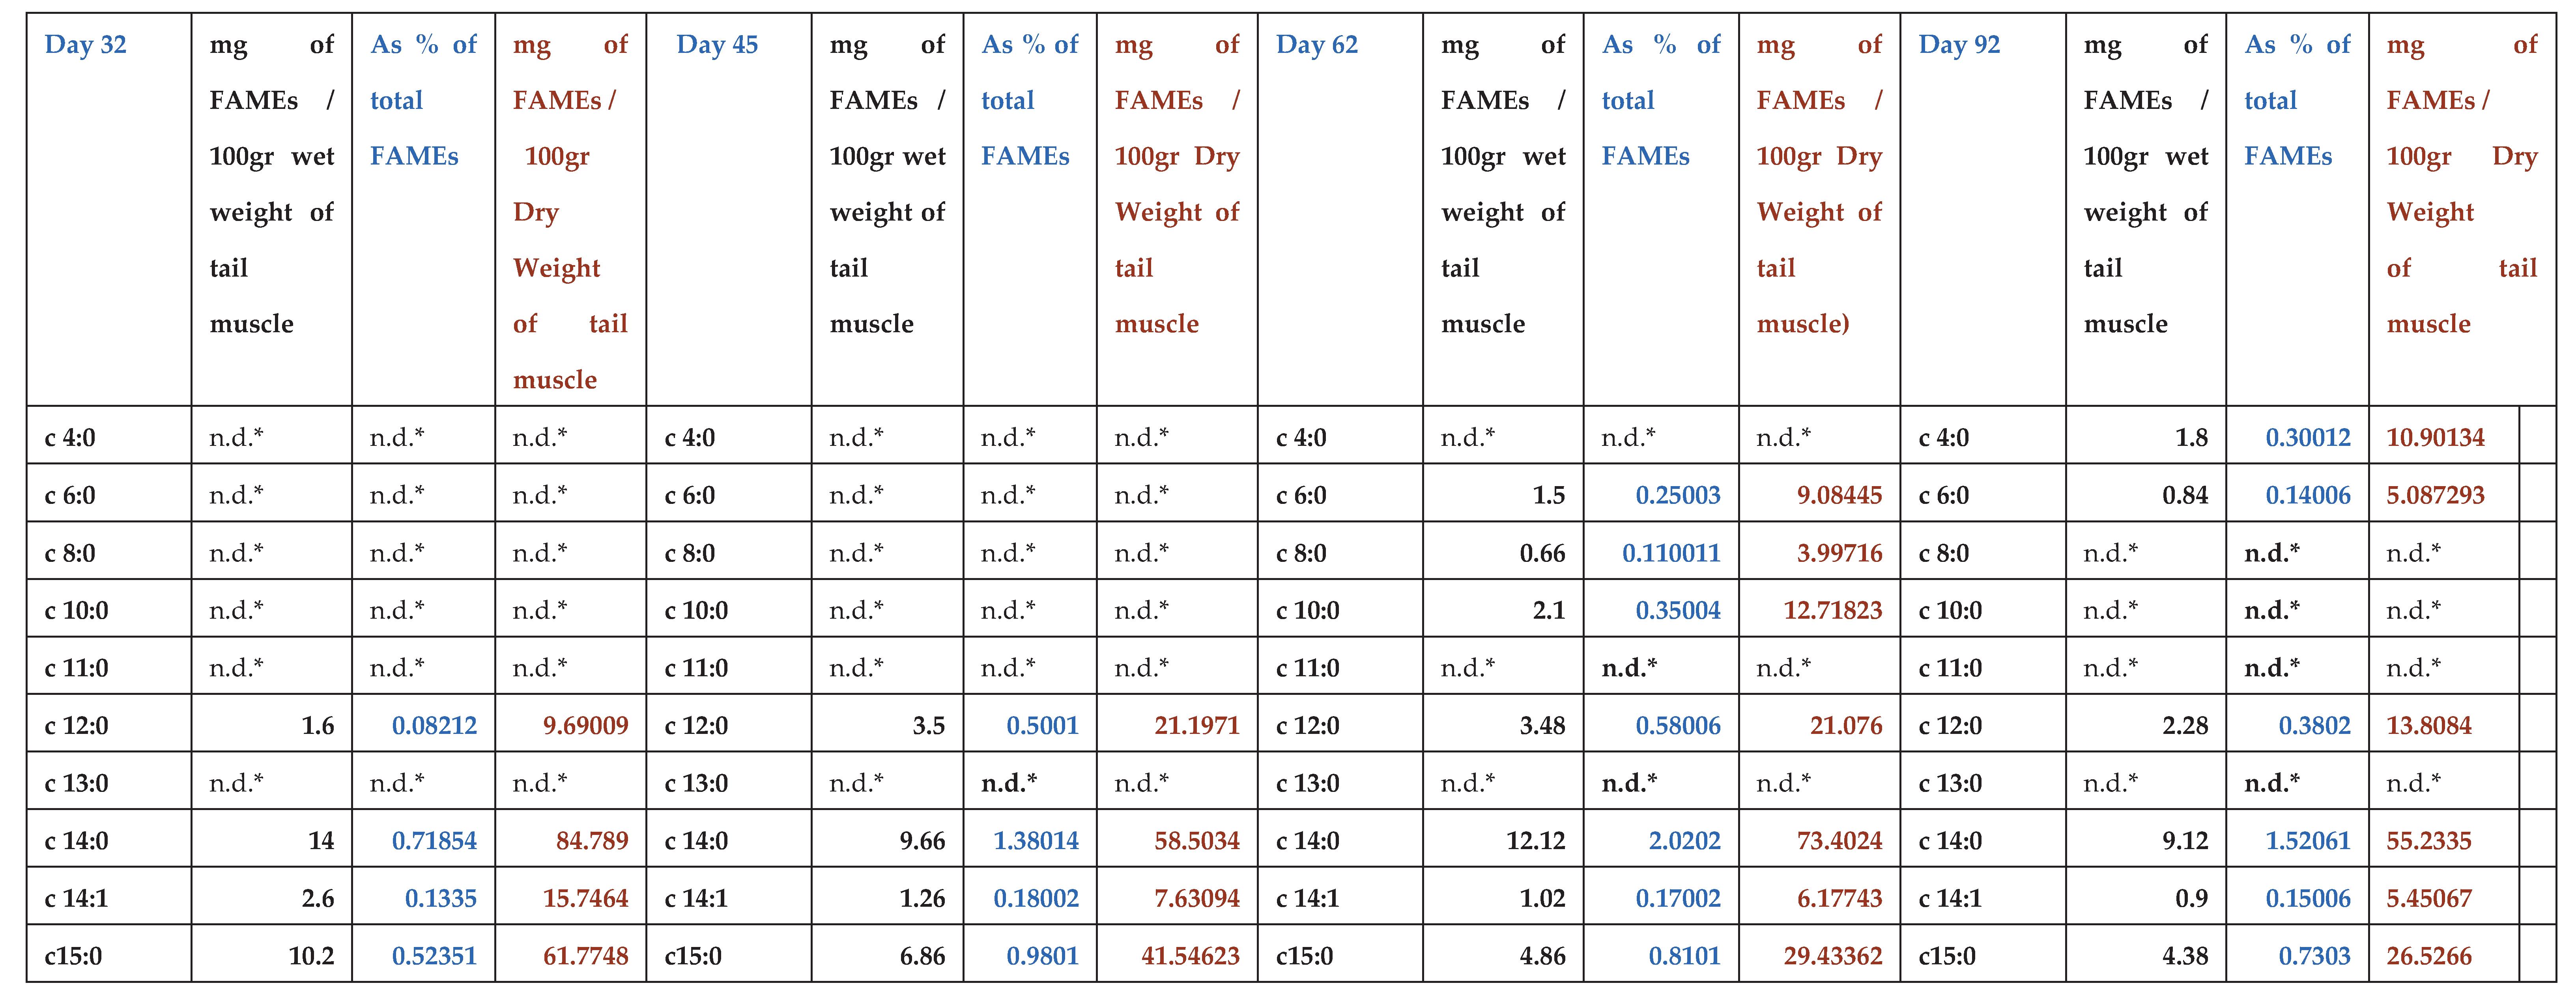
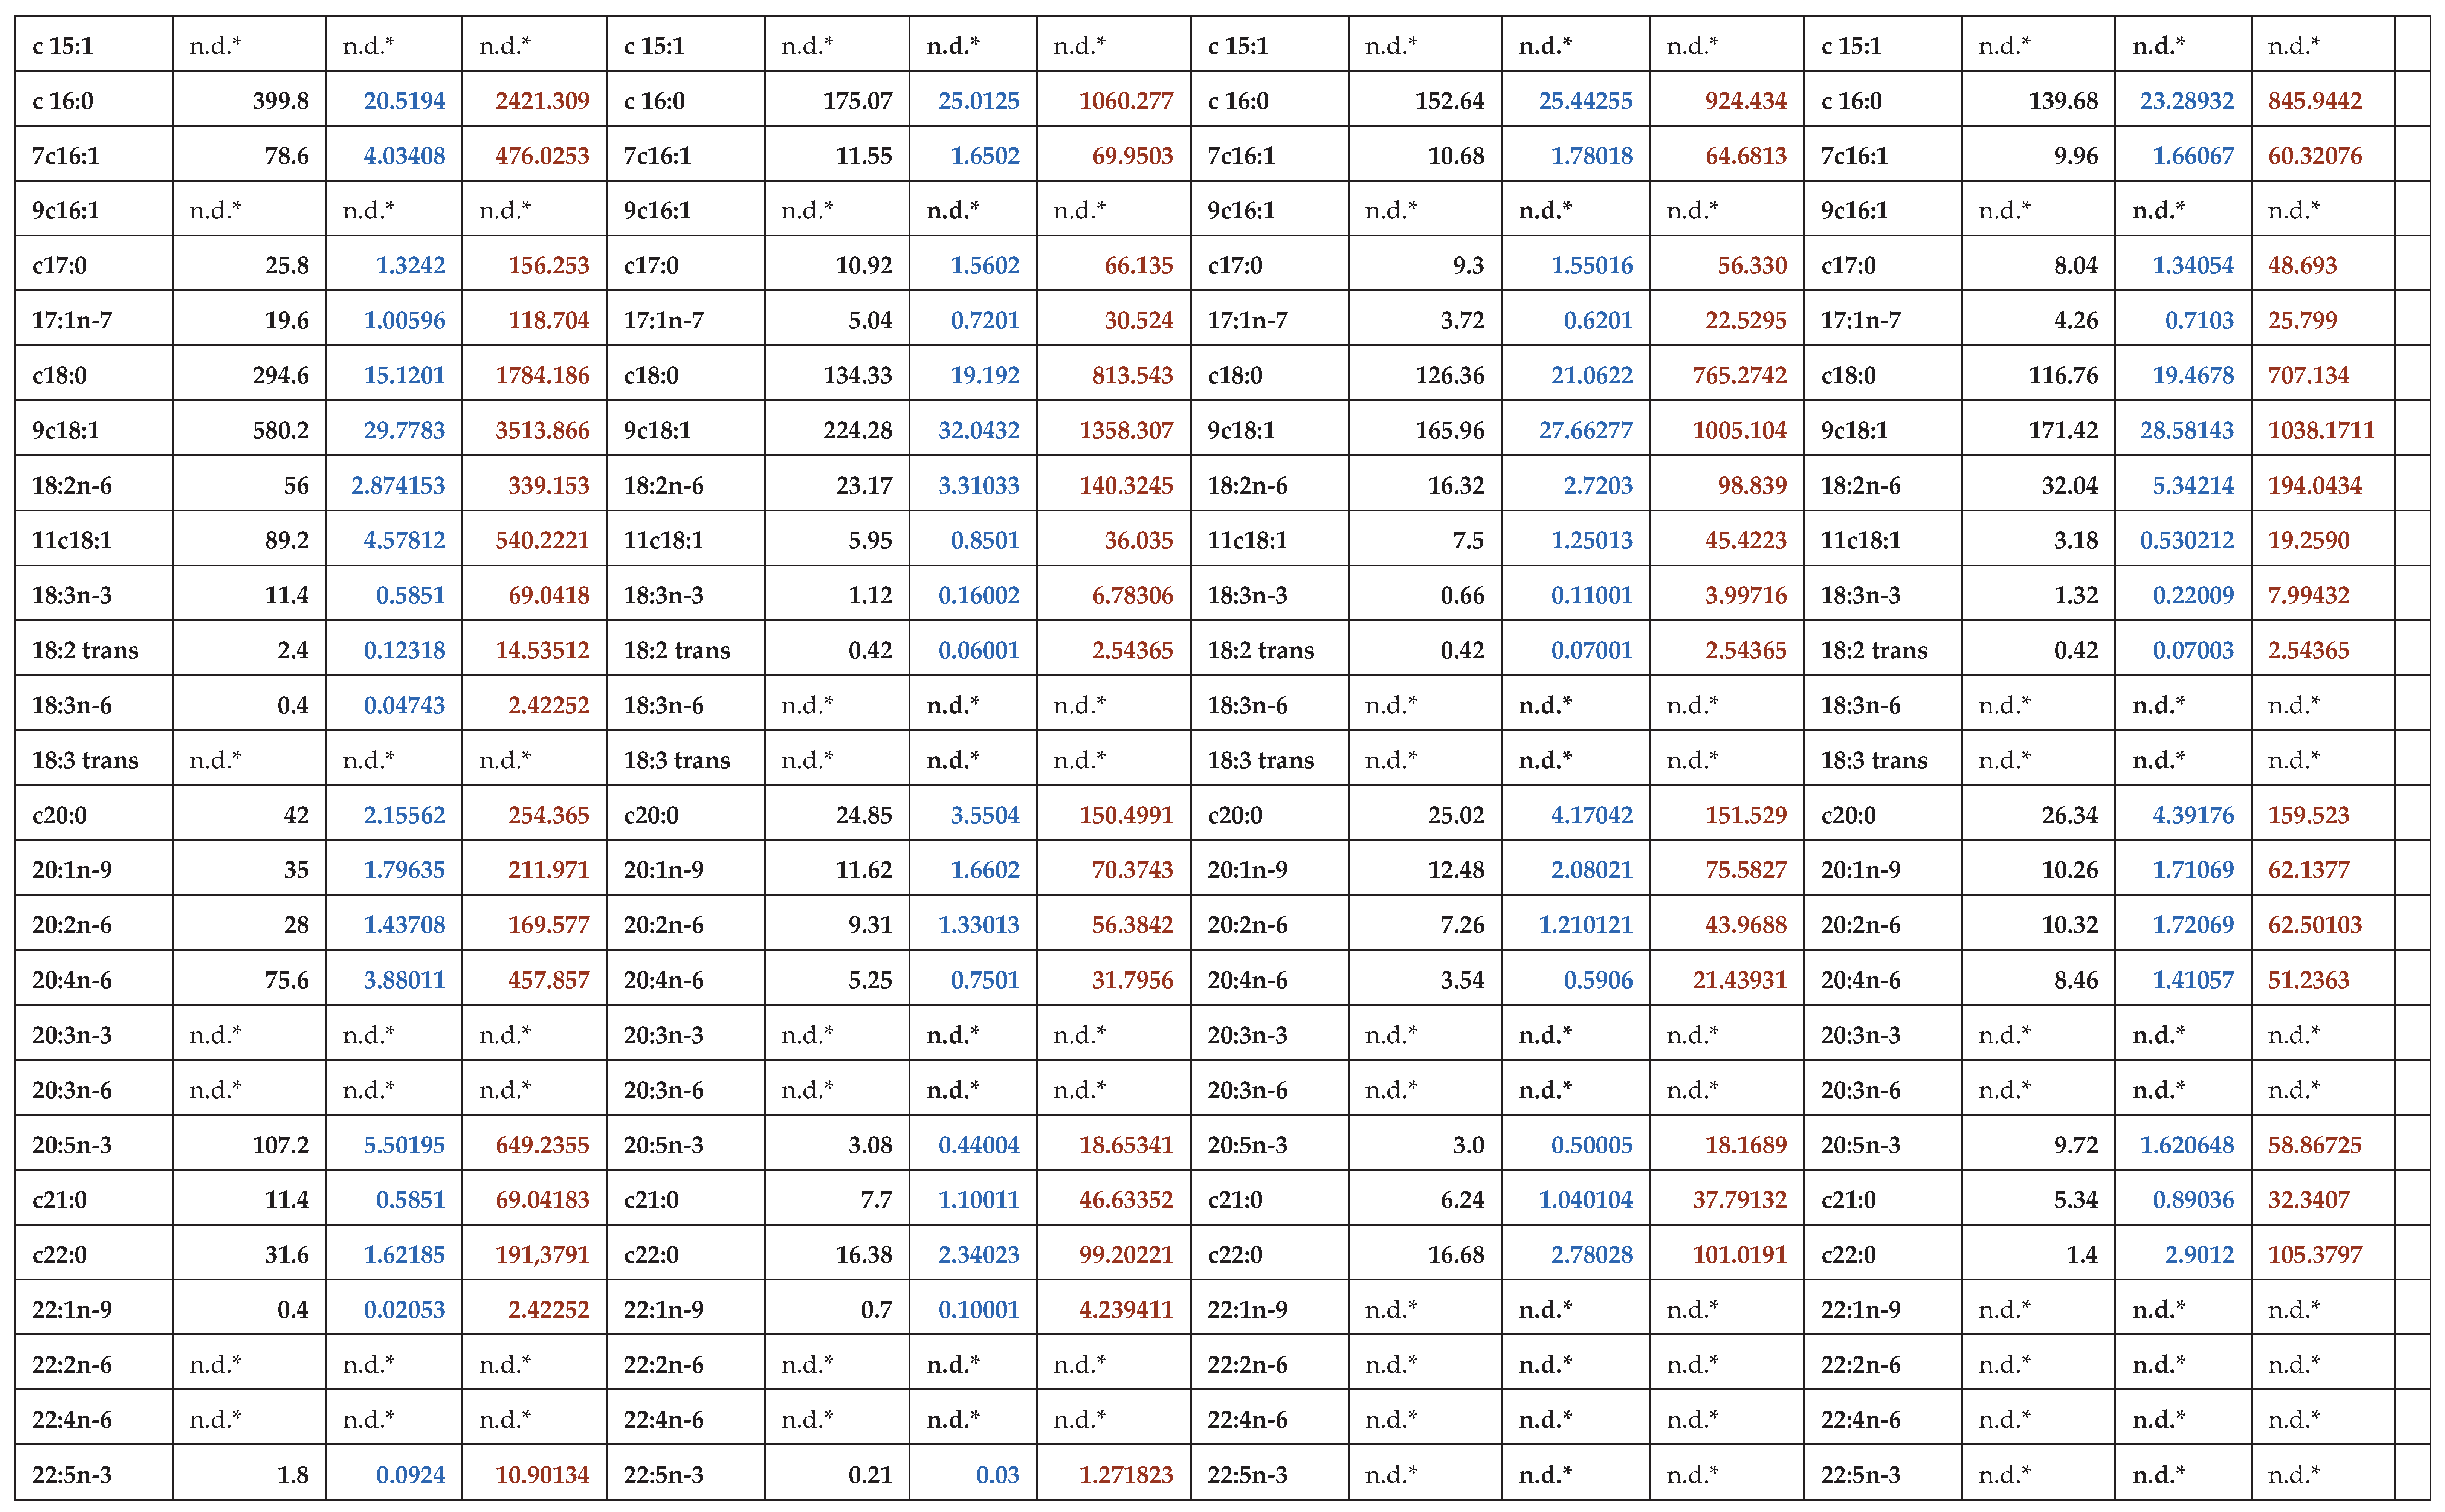
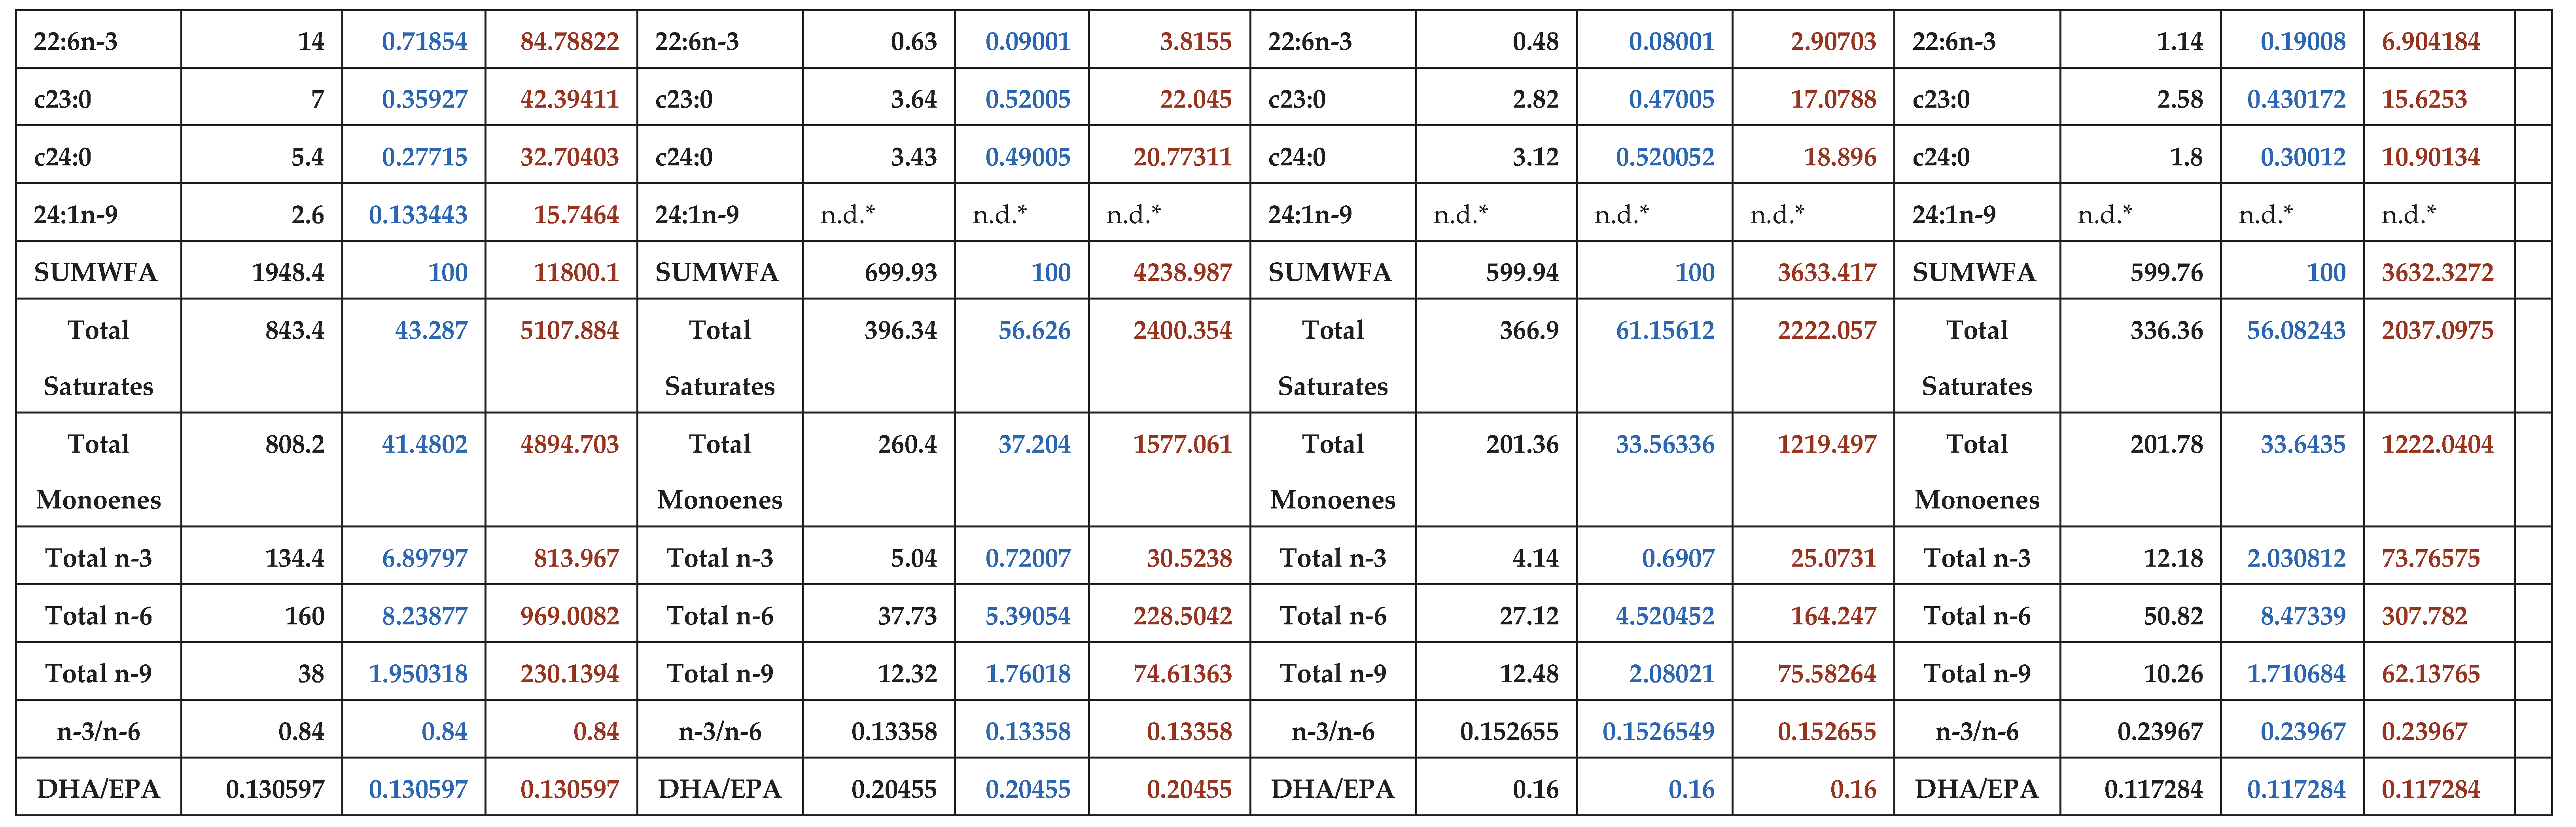
Table 5, Table 6, Table 7 and Table 8 indicate the fatty acid profile of the semi-purified (SPD) and the control diet (CD) as well as the fatty acid profiles of the crayfishes’ tail muscles of all crayfish fed the treatment and the control diet, at regular time intervals (Day-1, Day-32, Day-45, Day-62 and Day-92).
Paired Sample t-tests for the concentrations of fatty acids Arachidonic (20:4n-6 ARA), Eicosapentaenoic (20:5n-3 EPA) and Docosahexaenoic (22:6n-3 DHA) in the tail muscle between Treatment crayfish and Control crayfish (expressed as mg of FAME / 100gr Dry Weight of tail muscle) have shown that they were not statistical differences for these fatty acids among the quantities deposited at the tail muscle between the Treatment and the Control crayfish (Appendix, Table A3 and Table A4, A5).
The levels of total lipids on the tail muscle of Treatment and Control crayfish are shown on Table 9.
Paired Sample t-tests for the total lipids of tail muscle between Treatment crayfish and Control crayfish (expressed as % of Dry Weight of tail muscle) have shown that there are no statistical differences for these values overtime (Appendix, Table A6).
4. Discussion
Growth Rates for P. leniusculus in this experiment are similar to those observed in previous experiments for A. astacus [6,7] (Pantazis et.al. 2016; Pantazis et.al. 2022) and confirms the initial hypothesis that the total exclusion of corn oil and fish oil and the entire substitution of fishmeal by other protein sources, does not hinder growth and does not affect negatively the performance of crayfish.
In terms of dietary fatty acid utilization and their assimilation in the tail muscle of P. leniusculus, results of this experiment, are not strictly comparable to those of previous ones for the species. In more detail:
Ackefors et al. (1992) [12] have used early juveniles (A.W. 146 mg ± 56 SD) of Astacus astacus and therefore the protein dietary levels (on a wet basis) varied from 22% up to 40%, whereas the protein levels of this experiment were (on a DM basis) 37% for the control and 38.68% for the semi-purified diet, which means were much lower on a wet basis. Furthermore, Ackefors et al. (1992) [12] declare dietary Digestible Energy from 2.41-3.21 kcal.gr-1 on a wet basis. In this experiment the dietary Gross Energy (on a DM basis) was 4.063 kcal. gr-1 for the semi purified diet and 4.022 kcal.gr-1 for the Control Diet, which means that on a wet basis the energy level (2.12 kcal. gr-1) of the semi-purified diet in this experiment is comparable to those of Ackefors et al. (1992) [12] whereas the dietary energy level (on a wet basis) of the Control Diet of this experiment, has been much lower (0.58319 kcal.gr-1). As a result, the P:E levels in this experiment (93.1 mg Prot. kcal-1 for the Control Diet up to 95.18 mg Prot.kcal-1 for the semi purified diet) were within the range of the dietary P:E levels (91 to 125 mg Prot. kcal-1) in the experiment of Ackefors et al. (1992) [12], however, due to the considerable age / weight difference among experimental animals and the different species involved, results among that experiment and the present study are not strictly comparable.
Similarly, Ackefors et al. (1997) [13] have compared the hepatopancreas and tail muscle total lipids and fatty acids among A. astacus and P. leniusculus. Although they have used adult crayfish (as in this research), their dietary protocols varied a lot, among species and in-between species. For A. astacus they have used exclusively marine fish (herring and sprat), whereas for P. leniusculus they have used both diets of plant (frozen green peas, maize and alder leaves) and occasionally of animal origin (EWOS fish feed of a special brand). However, neither they do refer to the ration levels administered (% b.w.day– 1.individual-1) nor to the nutritional profile of the diet of plant origin. As a consequence, it is difficult again to compare results between that experiment and the present study.
Celada et al. (1989) [14] have experimented with P. leniusculus and a variety of dietary protocols, both fresh and artificially compounded diets. Some of the artificially compounded diets were of similar moisture content with the diets of this research and of similar nutritional profile with the exception of the fatty acid profiles, as they have used fish oil and corn oil, which have been totally excluded in the present study. Moreover, crayfish used by Celada et al.(1989) were post-molt juveniles, whereas in this experiment we have used sub-adults / adults crayfish. Finally, survival rates recorded in Celadas’ experiments were quite low compared to the survival rates in the present experiment. As a result, it is difficult again to compare results between that experiment and the present study.
The beneficial use of soybean oil in this experiment, has also been observed for the crayfish Cherax quadricarinatus, fed five dietary different lipid sources: fish oil, soybean oil, palm oil, rapeseed oil and linseed oil [15] (Chen et al., 2021). Crayfish fed diets with fish oil, soybean oil and linseed oil obtained significantly higher weight gain and specific growth rate than those fed the other two diets. Furthermore, crayfish fed the soybean oil diet experienced minimum concentrations of MDA which reflect in increased antioxidant capacity of edible tissues [15] (Chen et al., 2021).
McInerney et al. (2022) [16] have thoroughly conducted a 70-day feeding trial to compare growth and survival of the crayfish Cherax destructor fed three contrasting diets: a poor-quality detritus-based diet; a high protein invertebrate diet; and a high-quality commercial aquaculture pellet. Although they have drawn interesting results regarding the effect of dietary PUFAs on the performance of C. destructor, they have not taken into account the levels of other nutrients in their dietary regimes given that the dietary Protein: Energy ratio will affect the use of dietary protein and dietary energy and subsequently the use of dietary PUFAs.
Zandee (1966) [17] has demonstrated that in A.astacus, palmitic acid (16:0) is “de novo” synthesized by acetate by the non-mitochondrial system in the cytoplasm and has a central place in the fatty acid metabolism as it is also utilized for the synthesis of stearic (18:0) and myristic acid (14:0). Furthermore, he has demonstrated the indispensable role of linoleic acid (18:2) which in turn is elongated to 20:2 and successively dehydrogenated to 20:3 and 20:4 (within the mitochondrial system). The existence of palmitic (16:0) and linoleic acid (18:2) at quantifiable levels at the tail muscle of P. leniusculus at the Onset of the experiment (TMON / unfed), indicates the indispensable role of those two fatty acids for the signal crayfish P. leniusculus, as has been indicated for A. astacus [6,7] (Pantazis et al. 2016; Pantazis et al. 2022; Seemann et al. 2017). The levels of palmitic acid (16:0) at the tail muscle of crayfish fed the semi-purified diet-SPD (expressed as mg of FAME/100gr Dry Weight of tail muscle) have shown a downward trend throughout the experiment and were significantly lower than those of the SPD diet, indicating the over formulation of the SPD in terms of this fatty acid. This is also confirmed by the levels of palmitic acid (16:0) at the tail muscle of P.leniusculus wild stock at the Onset of the experiment (TMON / unfed). Similarly, the levels of stearic (18:0) acid at the tail muscle of crayfish fed the semi-purified diet-SPD (expressed as mg of FAME/100gr Dry Weight of tail muscle) were similar to those of the SPD and those of the stock at the Onset of the experiment (TMON / unfed).
The levels of arachidonic acid -ARA (expressed as mg of FAME/100gr Dry Weight of tail muscle) at the tail muscle of crayfish fed the semi-purified diet-SPD were high compared to the levels of ARA at the SPD diet, indicating that the dietary linoleic acid (18:2) contained at the SPD diet had also successfully elongated and desaturated to ARA, in the crayfish fed the SPD diet.
Crayfish fed the control diet (CD) have also shown, throughout the experiment, quantifiable levels (expressed as mg of FAME/100gr Dry Weight of tail muscle) of 9c18:1, 20:1n-9, 22:1n-9 & 24:1n-9 in their tail muscle, which were almost non-existent in the CD. This confirms the ability of P. leniusculus to metabolize stearic acid (18:0) into its elongation products, as observed in teleost fishes. The high levels of linoleic acid (18:2) in the CD due to the inclusion of fresh vegetables, and the respective low levels in the tail muscle of the crayfish of the Control Group, coupled with the high levels of arachidonic acid (20:4) in the tail muscle of the Control Group, indicate that P. leniusculus is able to elongate and desaturate, linoleic acid (18:2) into ARA (20:4), successfully.
Similarly, the existence of linolenic acid (18:3) at quantifiable levels (expressed as mg of FAME / 100gr Dry Weight of tail muscle) in the control diet (CD) and its respective low levels in the tail muscle of the crayfish of the Control Group, coupled with the high levels of ΕΡA (20:5n-3) in the tail muscle of the Control Group, indicate that P. leniusculus is able to elongate and desaturate linolenic acid to EPA, successfully. On the contrary, DHA (22:6n-3) levels both in the control diet and the tail muscle of the Control Group throughout the experiment, were low and at similar levels, indicating that DHA is most probably not metabolized in P. leniusculus as effectively as EPA, a finding that is accordance with the limited ability of A. astacus to metabolize and bio-convert EPA to DHA [7] (Pantazis et. al. 2022). This is also confirmed by the very low levels of DHA at the tail muscle of P.leniusculus wild stock at the Onset of the experiment (TMON / unfed). It is difficult, however to conclude that these EPA, DHA levels constitute the nutritional requirements of this species, as the respective values of the crayfish fed the semi-purified diet have varied and in some cases have been lower than those observed at the Control Group or even the Group at the Onset of the experiment (TMON / unfed).
Due to the increased levels of inclusion of soy oil in the SPD diet (in this experiment) the levels of linolenic acid (18:3) in the SPD diet were much higher than the respective ones of the CD diet. However, the respective levels of ΕΡA (20:5n-3) in the tail muscle of the crayfish fed the SPD diet were lower than the respective ones of the crayfish fed the CD diet, confirming that although linolenic acid (18:3) is an indispensable fatty acid for P.leniusculus , its capacity to elongate and desaturate to ΕΡA (20:5n-3) is limited. Similarly, the total exclusion of fish oil in the SPD diet coupled with the very low levels of DHA (22:6n-3) in this diet and the existence of DHA (22:6n-3) at very low levels at the tail muscle of the crayfish fed the semi-purified diet-SPD, confirm the limited ability of P.leniusculus to elongate and desaturate EPA to DHA. As crayfish fed the SPD diet have shown higher PWG and SGR than those fed the CD diet, it is assumed that fish oil can safely be excluded in diets for P.leniusculus without negatively affecting their growth and survival. This is also confirmed by the very low levels of DHA (22:6n-3) found in the tail muscle of the crayfish stock at the Onset of the experiment (TMON / unfed).
In this study, total lipids of the tail muscle for both treatment and control crayfish have been much lower than those observed for A. astacus in previous experiments [6]. This is somehow expected as the dietary lipid levels of both diets in this study ranged from 4.5 to 9.5% (on a D.M. basis) and have been lower than the ones used for A. astacus ranging from 5% to 13.08% (on a D.M. basis). It is noteworthy that tail muscle total lipid levels in this study have not been statistically different between treatment and control crayfish, however control crayfish seem to be able to accumulate more total lipids in their tale muscle compared to those of treatment crayfish, even though not statistically different among them (Table 9). As a result, we could infer that for P. leniusculus, muscle total lipid levels are not directly proportional to the dietary ones and might not follow a similar accumulation pattern as for A. astacus.
5. Conclusions
This research confirms the initial hypothesis that the freshwater crayfish P.leniusculus has limited dietary requirements for the PUFAs (EPA, DHA) which are usually indispensable for other freshwater or marine species, vertebrates or invertebrates. Therefore, corn oil and fish oil can safely be excluded from P.leniusculus diets and dietary soy oil incorporation can further be reduced to lower levels that those applied in this research. It is therefore suggested that the requirement for total dietary lipid levels for P.leniusculus can be lower than those applied in this research. Linoleic (18:2) and linolenic (18:3) acids seem to be indispensable for P.leniusculus , however it is difficult to conclude their exact dietary quantitative requirements for the species. Similarly, this research has also demonstrated that fish meal can entirely be excluded from P.leniusculus diets as long as it is substituted by other protein sources of a similar amino acid profile. However, this research has not determined accurately the levels of substitution of fish meal by other protein sources, of animal or vegetable origin on a quantitative level. Further research is needed to establish the qualitative and quantitative requirements for fish meal substitution.
It is evident that dietary optimization for the signal crayfish has partially been achieved and therefore coupled with the respective minimization of its culture costs, culture optimization of the species is feasible.
Author Contributions
Conceptualization, Panagiotis Pantazis and John Ch. Karamaligas; Methodology, Panagiotis Pantazis, John Ch. Karamaligas, Ilias Giannenas ; software, John Ch. Karamaligas ; validation, Panagiotis Pantazis and John Ch. Karamaligas and Eugene Gourzioti; formal analysis, John Ch. Karamaligas and Eugene Gourzioti ; investigation, Panagiotis Pantazis, John Ch. Karamaligas, Ilias Giannenas ; resources, Panagiotis Pantazis and John Ch. Karamaligas and Eugene Gourzioti; X.X.; data curation, John Ch. Karamaligas and Eugene Gourzioti ; writing—original draft preparation, John Ch. Karamaligas , Eugene Gourzioti, Ilias Giannenas ; writing—review and editing, Panagiotis Pantazis ,John Ch. Karamaligas, Ilias Giannenas; visualization, Panagiotis Pantazis and John Ch. Karamaligas ; supervision, Panagiotis Pantazis ; project administration, Panagiotis Pantazis ; funding acquisition, Panagiotis Pantazis . All authors have read and agreed to the published version of the manuscript.
Funding
This research was funded by University of Thessaly Research Committee, Project Code Nos 3747 & 4510.
Institutional Review Board Statement
Based on European Legislation (European Directive 2010/63/EU, 20.10.2010 Official Journal of the European Union L276/33 - On the protection of animals used for scientific purposes) and the Legislation of the Hellenic Republic (Presidential Decree 56, Φ.Ε.Κ. 106/τ.A΄/30-4-2013), this study did not require specific ethical approval by the Institutional Ethics Committee of the Faculty as it concerns invertebrate crustaceans.
Informed Consent Statement
Not applicable.
Data Availability Statement
As this research has been funded by the University of Thessaly Research Committee, original datasets are the property of the University of Thessaly and are subject to Intellectual Property protection as a Patent is prepared and underway for submission. Requests for access to the datasets should be directed to Dr. Panagiotis A. Pantazis at "ppantazis@vet.uth.gr".
Conflicts of Interest
The authors declare no conflicts of interest.
Appendix A
Appendix A.1

Table A1.
Non-parametric tests for Average Weights overtime.
| Normality Tests | ||||||
| Groups | Kolmogorov-Smirnova | Shapiro-Wilk | ||||
| Statistic | df | Sig. | Statistic | df | Sig. | |
| Treatment Control |
0.236 | 31 | <0.001 | 0.873 | 31 | 0.002 |
| 0.133 | 25 | 0.200* | 0.961 | 25 | 0.428 | |
| * This is a lower bound of the true significance. a. Lilliefors corrected | ||||||
Table A2.
Mean Rank of groups and Non-parametric test Mann-Whitney U. p<0.05.
| Values | |||
| Groups | N | Mean Rank | Sums of Μ.R. |
| Treatment Control Total |
31 | 28.71 | 890.00 |
| 25 | 28.24 | 706.00 | |
| 56 | |||
| Statistical Tests a | |||
| Average Weights | |||
| Mann-Whitney U | 381.000 | ||
| Wilcoxon W | 706.000 | ||
| Z | -0.107 | ||
| Asymp. Sig. (2-tailed) p | 0.915 | ||
| a. Grouping Variable: Treatment - Control | |||
Table A3.
Paired t-test for Arachidonic acid (ARA).
| Paired Samples t-test | |||||||||
| ARA 20:4n-6 | Paired Differences | t | df | Significance | |||||
| Mean | SD | SE | 95% Confidence Interval of the Difference | One-Sided p | Two-Sided p | ||||
| Lower | Upper | ||||||||
| Control - Treatment | -0.362 | 177.952063 | 79.582582 | -224.5766 | 217.33667 | -0.045 | 4 | 0.420 | 0.841 |
Table A3.
(continued). Paired Samples Effect Sizes for Arachidonic acid (ARA).
| Effect Sizes | |||||
| SD Standardizera | Point Estimate | 95% Confidence Interval | |||
| Lower | Upper | ||||
| Control - Treatment | Cohen’s d | 177.952063 | -0.020 | -0.896 | 0.858 |
| Hedges’ correction | 223.029836 | -0.016 | -0.715 | 0.684 | |
| a. The denominator used in estimating the effect sizes. Cohen's d uses the sample standard deviation of the mean difference. Hedges' correction uses the sample standard deviation of the mean difference, plus a correction factor. | |||||
Table A4.
Paired t-test for Eicosapentaenoic (EPA).
| Paired Samples t-test | |||||||||
|
EPA 20:5n-3 |
Paired Differences | t | df | Significance | |||||
| Mean | SD | SE | 95% Confidence Interval of the Difference | One-Sided p | Two-Sided p | ||||
| Lower | Upper | ||||||||
| Control - Treatment | 21.2460 | 245.746535 | 109.901192 | -283.88862 | 326.380625 | 0.193 | 4 | 0.428 | 0.856 |
Table A4.
(continued). Paired Samples Effect Sizes for EPA.
| Effect sizes | |||||
| Standardizera | Point Estimate | 95% Confidence Interval | |||
| Lower | Upper | ||||
| Control - Treatment | Cohen's d | 245.746535 | 0.086 | -0.797 | 0.960 |
| Hedges' correction | 307.997607 | 0.069 | -0.636 | 0.766 | |
| a. The denominator used in estimating the effect sizes. Cohen's d uses the sample standard deviation of the mean difference. Hedges' correction uses the sample standard deviation of the mean difference, plus a correction factor. | |||||
Table A5.
Paired t-test for Docosahexaenoic (DHA).
| Paired Samples t-test | |||||||||
|
DHA 22:6n-3 |
Paired Differences | t | df | Significance | |||||
| Mean | SD | SE | 95% Confidence Interval of the Difference | One-Sided p | Two-Sided p | ||||
| Lower | Upper | ||||||||
| Control - Treatment | 11.0200 | 28.957604 | 12.950234 | -24.935615 | 46.975615 | 0.851 | 4 | 0.221 | 0.443 |
Table A5.
(continued). Paired Samples Effect Sizes for DHA.
| Effect sizes | |||||
| Standardizera | Point Estimate | 95% Confidence Interval | |||
| Lower | Upper | ||||
| Control - Treatment | Cohen's d | 28.957604 | 0.381 | -0.553 | 1.272 |
| Hedges' correction | 36.292975 | 0.304 | -0.441 | 1.015 | |
| a. The denominator used in estimating the effect sizes. Cohen's d uses the sample standard deviation of the mean difference. Hedges' correction uses the sample standard deviation of the mean difference, plus a correction factor. | |||||
Table A6.
Paired Samples t-test for total lipids (expressed as % Dry Weight of tail muscle).
| Paired Samples t-test for Total Lipids on a D.M. basis | |||||||||
| Paired Differences | t | df | Significance | ||||||
| Mean | Std. Deviation | Std. Error Mean | 95% Confidence Interval of the Difference | One-Sided p | Two-Sided p | ||||
| Lower | Upper | ||||||||
| Control - Experiment | 0.84598 | 2.89548 | 1.29490 | -2.74923 | 4.44120 | 0.653 | 4 | 0.275 | 0.549 |
Table A6.
(continued). Paired Samples Effect Sizes for total lipids.
| Paired Sample Effect Sizes for Total Lipids on a D.M. basis | |||||
| Standardizera | Point Estimate | 95% Confidence Interval | |||
| Lower | Upper | ||||
| Control - Experiment | Cohen's d | 2.89548 | 0.292 | -0.622 | 1.174 |
| Hedges' correction | 3.62895 | 0.233 | -0.497 | 0.936 | |
| a. The denominator used in estimating the effect sizes. Cohen's d uses the sample standard deviation of the mean difference. Hedges' correction uses the sample standard deviation of the mean difference, plus a correction factor. | |||||
References
- Watkins, B. Freshwater crayfish. Skin Diver Magazine, April 1986, p. 26-27.
- Holdich, D.M., Reynolds, J.D., Souty-Grosset, C., and Sibley, P.J. 2009. A review of the ever increasing threat to European crayfish from non-indigenous crayfish species. Knowledge and Management of Aquatic Ecosystems, 2009. 11: p.394-395.
- Theocharis, V. La pêche a l’écrevisse dans la région d’Hipiros en Grèce. Station de recherches de Louros, Ministère Grec de l’Agriculture, Ioannina. Bulletin publie par l’Association des Astaciculteurs de France, 1986. Bulletin No 8, France.
- Koutrakis, E., Perdikaris, C., Machino, Y., Savvidis, G. and Margaris, N. 2007. Distribution, recent mortalities and conservation measures of crayfish in Hellenic freshwaters. Bulletin français de la Pêche et de la Pisciculture, 2007. 385: p. 25-44.
- Perdikaris, C., Konstantinidis, E., Georgiadis, C., Kouba, A. Freshwater crayfish distribution update and maps for Greece: combining literature and citizen-science data. Knowl. Manag. Aquat. Ecosyst., 2017. 418: p51. [CrossRef]
- Pantazis, P., G. Papadomichelakis, G., Karamaligas, J.Ch. 2016. Growth, Survival and Fatty Acid Content of Astacus astacus (Linnaeus 1758) In A Water Recirculation System Fed a Semi- Purified Diet. International Journal of Innovative Studies in Aquatic Biology and Fisheries (IJISABF), 2016. Vol 2(3): p 30-36. [CrossRef]
- Pantazis, P.A., Karamaligas, J.Ch., Xydia, V., Papadomichelakis,G. Partial Substitution of Fishmeal and Fish Oil in a Semi-Purified Diet for Noble Crayfish, Astacus astacus (Linnaeus, 1758). Journal of Shellfish Research, 2022. 41(2): p.255-261.
- AVMA Guidelines for the Euthanasia of Animals: 2020 Edition*. Part III, S6.3 Aquatic invertebrates, pp. 89-90, American Veterinary Medical Association, Schaumburg, IL 60173, USA. ISBN 978-1-882691-54-8, Version 2020.0.1.
- Zandee, D.I. 1967. Absence of cholesterol synthesis as contrasted with the presence of fatty acids synthesis in some arthropods. Comparative Biochemistry Physiology, 1967. 20: p. 811-822.
- O’Fallon, J.V., Busboom, J.R., Nelson, M.L., Gaskins, C.T. A direct method for fatty acid methyl ester synthesis: Application to wet meat tissues, oils, and feedstuffs. Journal of Animal Science, 2007. 85: p. 1511-1521.
- Walstra, P., & Mulder, H. The Weibull–Stoldt method, Neth. Milk and Dairy Journal, 1963. 83: p. 347–351.
- Ackefors, H., Castell, J.D., Boston, L.D., Raty, P. & M. Svensson. Standard experimental diets for crustacean nutrition research. II. Growth and survival of juvenile crayfish Astacus astacus (Linné) fed diets containing various amounts of protein, carbohydrate and lipid. Aquaculture,1992. 104 (3–4): p. 341-356.
- Ackefors, H., Castell, J., Orde-Ostrom I-L. Preliminary Results on the Fatty Acid Composition of Freshwater Crayfish, Astacus astacus and Pacifastacus leniusculus, Held in Captivity. Journal of the World Aquaculture Society, 1997. 28 (1): p. 97-105.
- Celada, J. D., Carral, J., Gaudioso, V., Temiño, C., Fernández, R. Response of Juvenile Freshwater Crayfish (Pacifastacus leniusculus Dana) to Several Fresh and Artificially Compounded Diets. Aquaculture, 1989. 76 (1–2): p. 67-78.
- Chen, C., Xu, C., Yang, X., Qian, D., Gu, Z., Jia, Y., & Li, E. Growth, antioxidant capacity, intestine histology and lipid metabolism of juvenile red claw crayfish, Cherax quadricarinatus, fed different lipid sources. Aquaculture Nutrition, 2021. 27(1): p. 261–273.
- McInerney, P. J., Stoffels, R. J., Shackleton, M. E., Davey, C. D., Albert, J., & Rees, G. N. Dietary fatty acid profiles shape crayfish biosynthesis and performance: Implications for riverine food webs. Freshwater Biology, 2022. 67: p. 978–990.
- Zandee, D.I. 1966. Metabolism in the crayfish Astacus astacus (L.). IV. The fatty acid composition and the biosynthesis of the fatty acids. Archives Internationales de Physiologie et de Biochimie, 1966. 74(4): p. 614-626.
Table 1.
Water quality parameters in the experimental tanks (n=3).
| Day - 0 | Day -15 | Day - 45 | Day - 75 | |
| Conductivity (μS/cm) | ||||
| Control | 845 | 1041 | 2058 | 2517 |
| Treatment | 845 | 934 | 1881 | 2557 |
| Total Dissolved Solids - TDS (ppm) | ||||
| Control | 426 | 502 | 1043 | 1279 |
| Treatment | 426 | 456 | 959 | 1256 |
| pH | ||||
| Control | 7.27 | 7.57 | 7.95 | 8.1 |
| Treatment | 7.27 | 7.65 | 7.82 | 8.0 |
| Total Hardness as CaCO3 (ppm) | ||||
| Control | 130 | 135 | 160 | 175 |
| Treatment | 130 | 135 | 150 | 165 |
| NH3-N (mg/L) | ||||
| Control | 0.02 | 0.03 | 0.02 | 0.02 |
| Treatment | 0.12 | 0.14 | 0.12 | 0.1 |
| NO3-N (mg/L) | ||||
| Control | 2.15 | 2.25 | 2.12 | 2.1 |
| Treatment | 3.1 | 3.35 | 3.25 | 3.0 |
| NO2-N (mg/L) | ||||
| Control | 1.15 | 1.3 | 1.25 | 1.1 |
| Treatment | 1.2 | 1.5 | 1.35 | 1.25 |
| Temperature °C | 25 °C | 27 °C | 25 °C | 23 °C |
Table 2.
Average Weights (g) – A.W. throughout the experiment.
| Day-1 | Day-42 | Day-88 | |
| A.W. treatment | 35.76 a * ± 6.28 ** (n=15) | 36.57 a ± 9.02 (n= 13) | 39.67 a ± 16.52 (n = 10) |
| A.W. control | 31.76 a * ± 7.5 (n = 15) | 33.13 a ± 7.5 (n = 12) | 33.50 a ± 3.53 (n= 9) |
* Similar Superscripts in the same row indicate no differences among the sampling days (P>0.05) ** Represents Standard Deviation.
Table 3.
Survival rates among the sampling periods.
| Period | Day-1→Day-41 | Day-42→Day -88 | Day-1→Day-88 |
| Survival Rate % treatment | 86.66 | 76.92 | 73.33 |
| Survival Rate % control | 80.00 | 83.33 | 66.66 |
Table 4.
Achieved weight gains (PWG) and growth rates (SGR).
| Treatment | Control | |
| PWG for the first 41Days % | 2.25 | 4.32 |
| SGR for the first 41Days | 0.331 | 0.12 |
| PWG for the next 46 Days % | 7.82 | 1.12 |
| SGR for the next 46 Days | 0.3068 | 0.104 |
Table 5.
Fatty acid profile of the Semi-Purified Diet (SPD / n=3) and the Control Diet (CD / n = 3).
Table 5.
Fatty acid profile of the Semi-Purified Diet (SPD / n=3) and the Control Diet (CD / n = 3).
 |
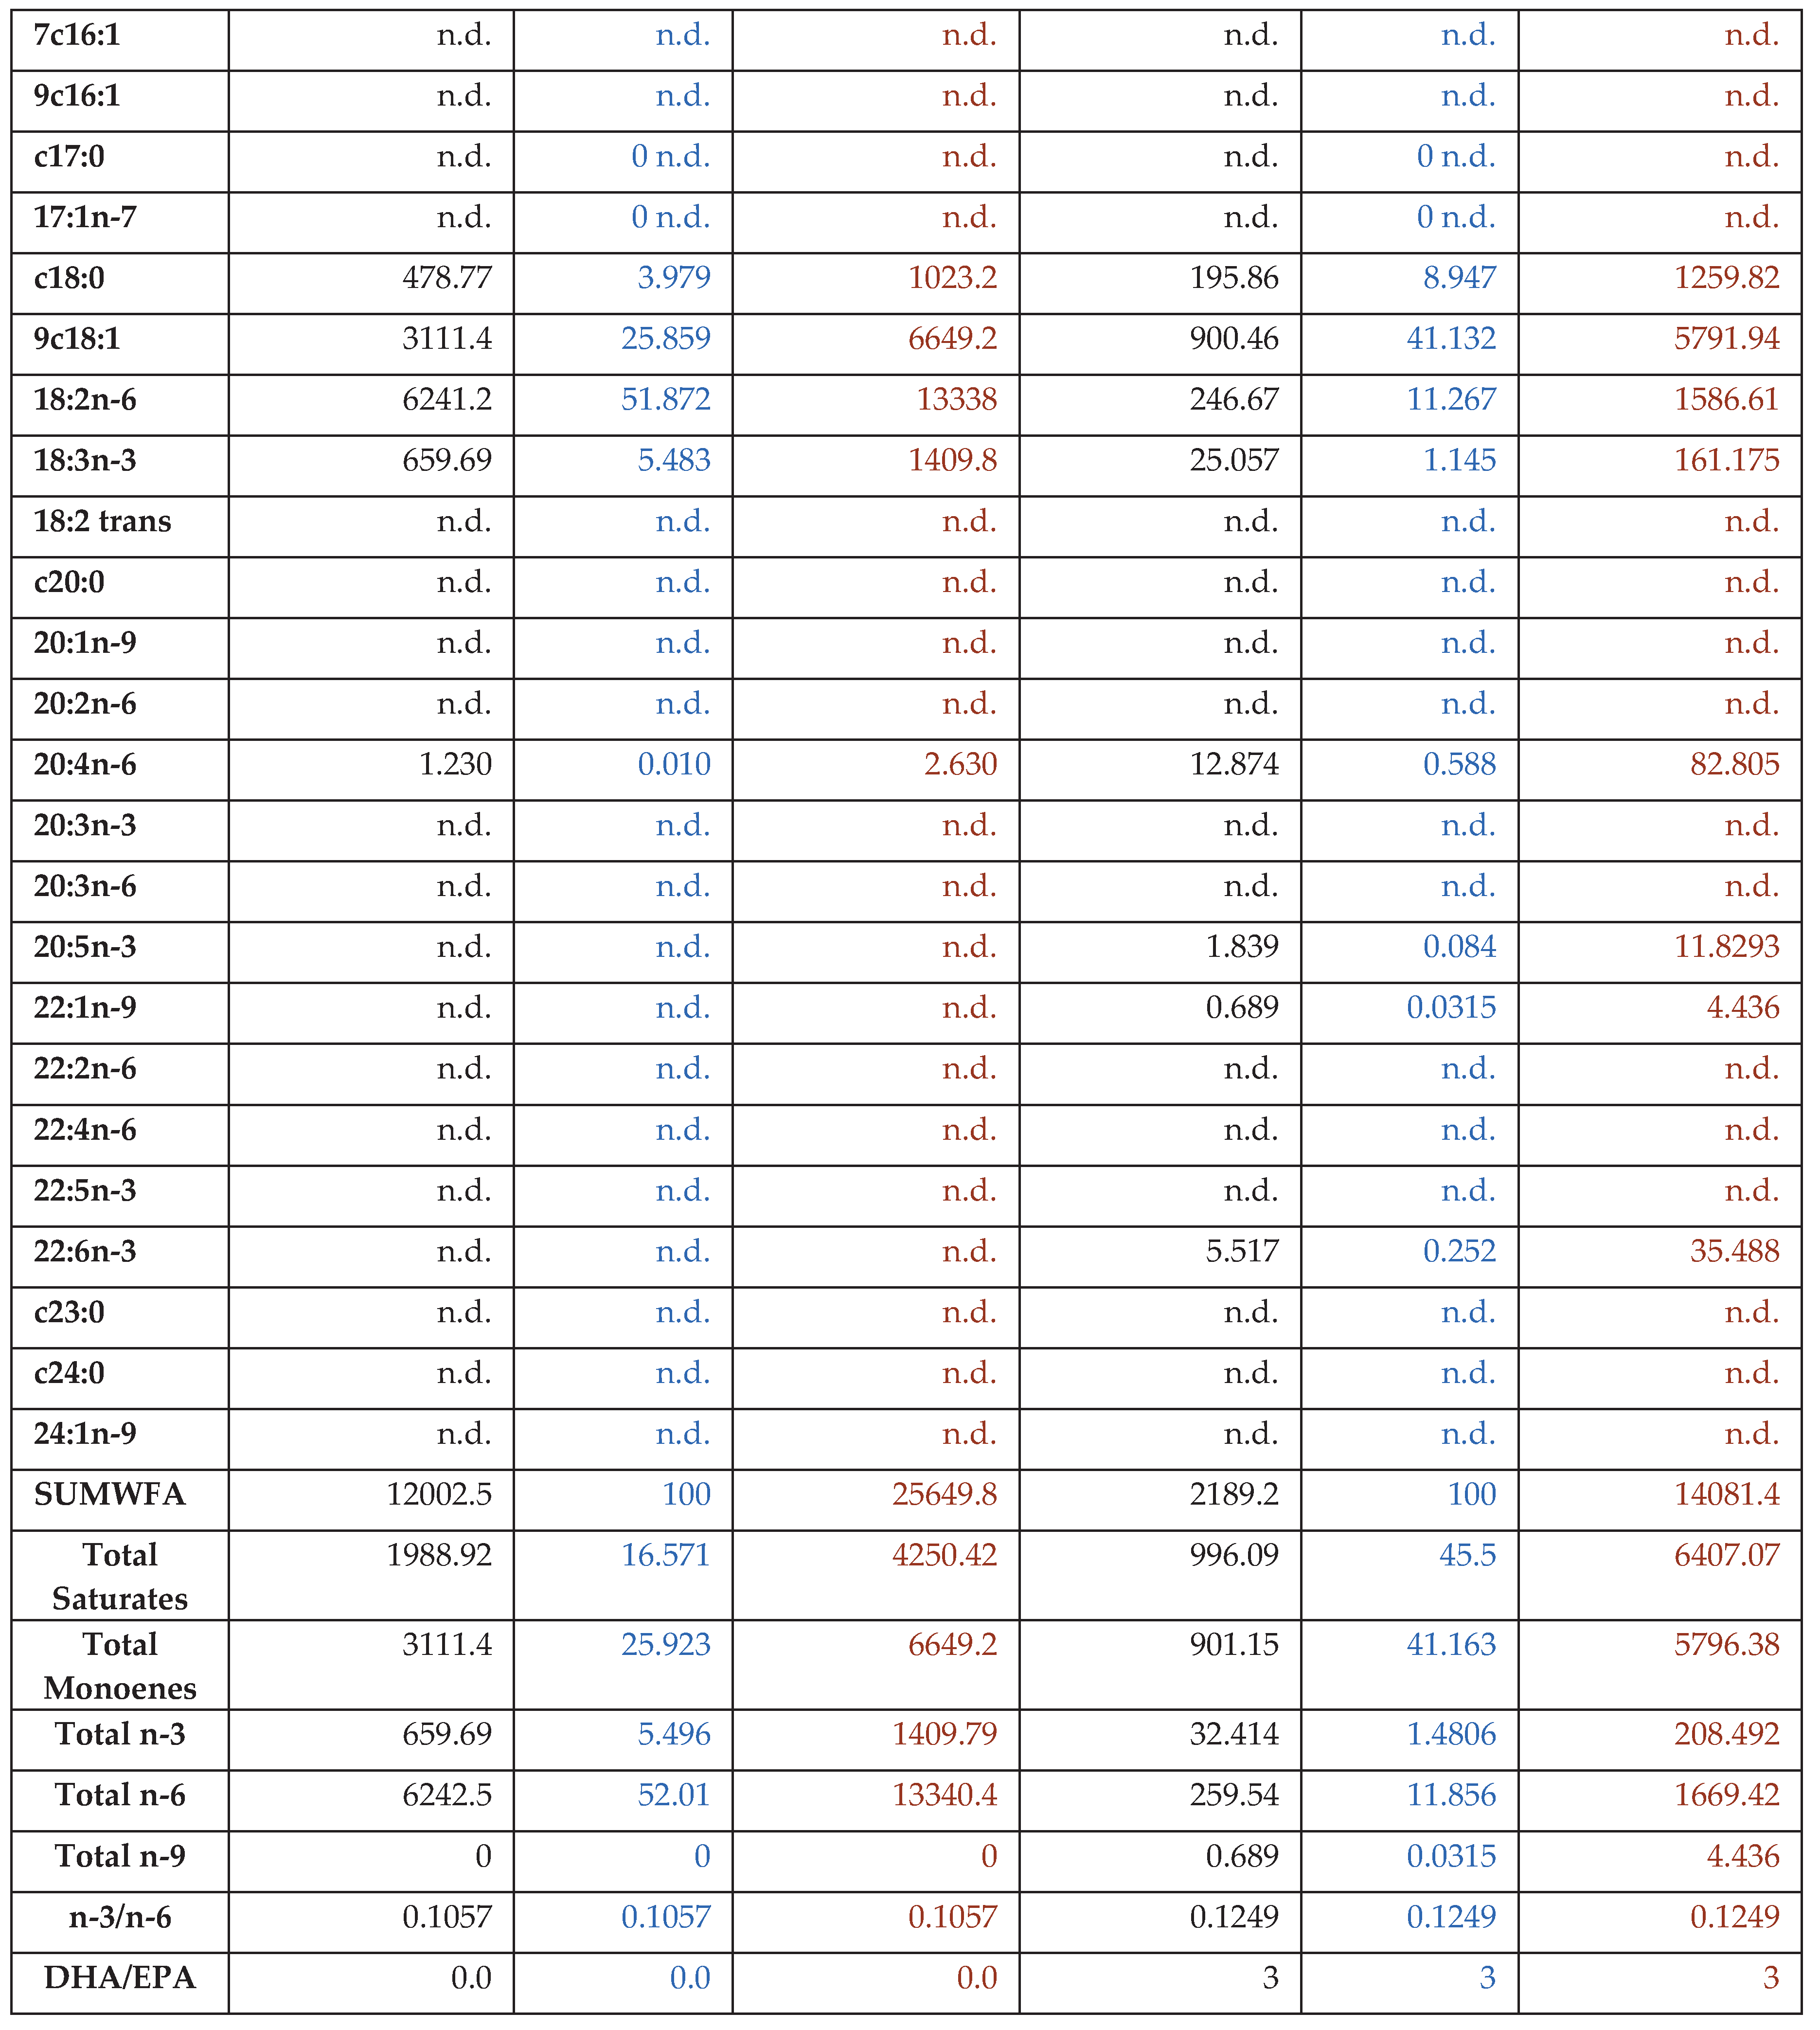 |
Table 6.
Fatty acid profile of the Tail Muscle of the crayfish at the Onset of the experiment, unfed (TMON / n = 6).
Table 6.
Fatty acid profile of the Tail Muscle of the crayfish at the Onset of the experiment, unfed (TMON / n = 6).
 |
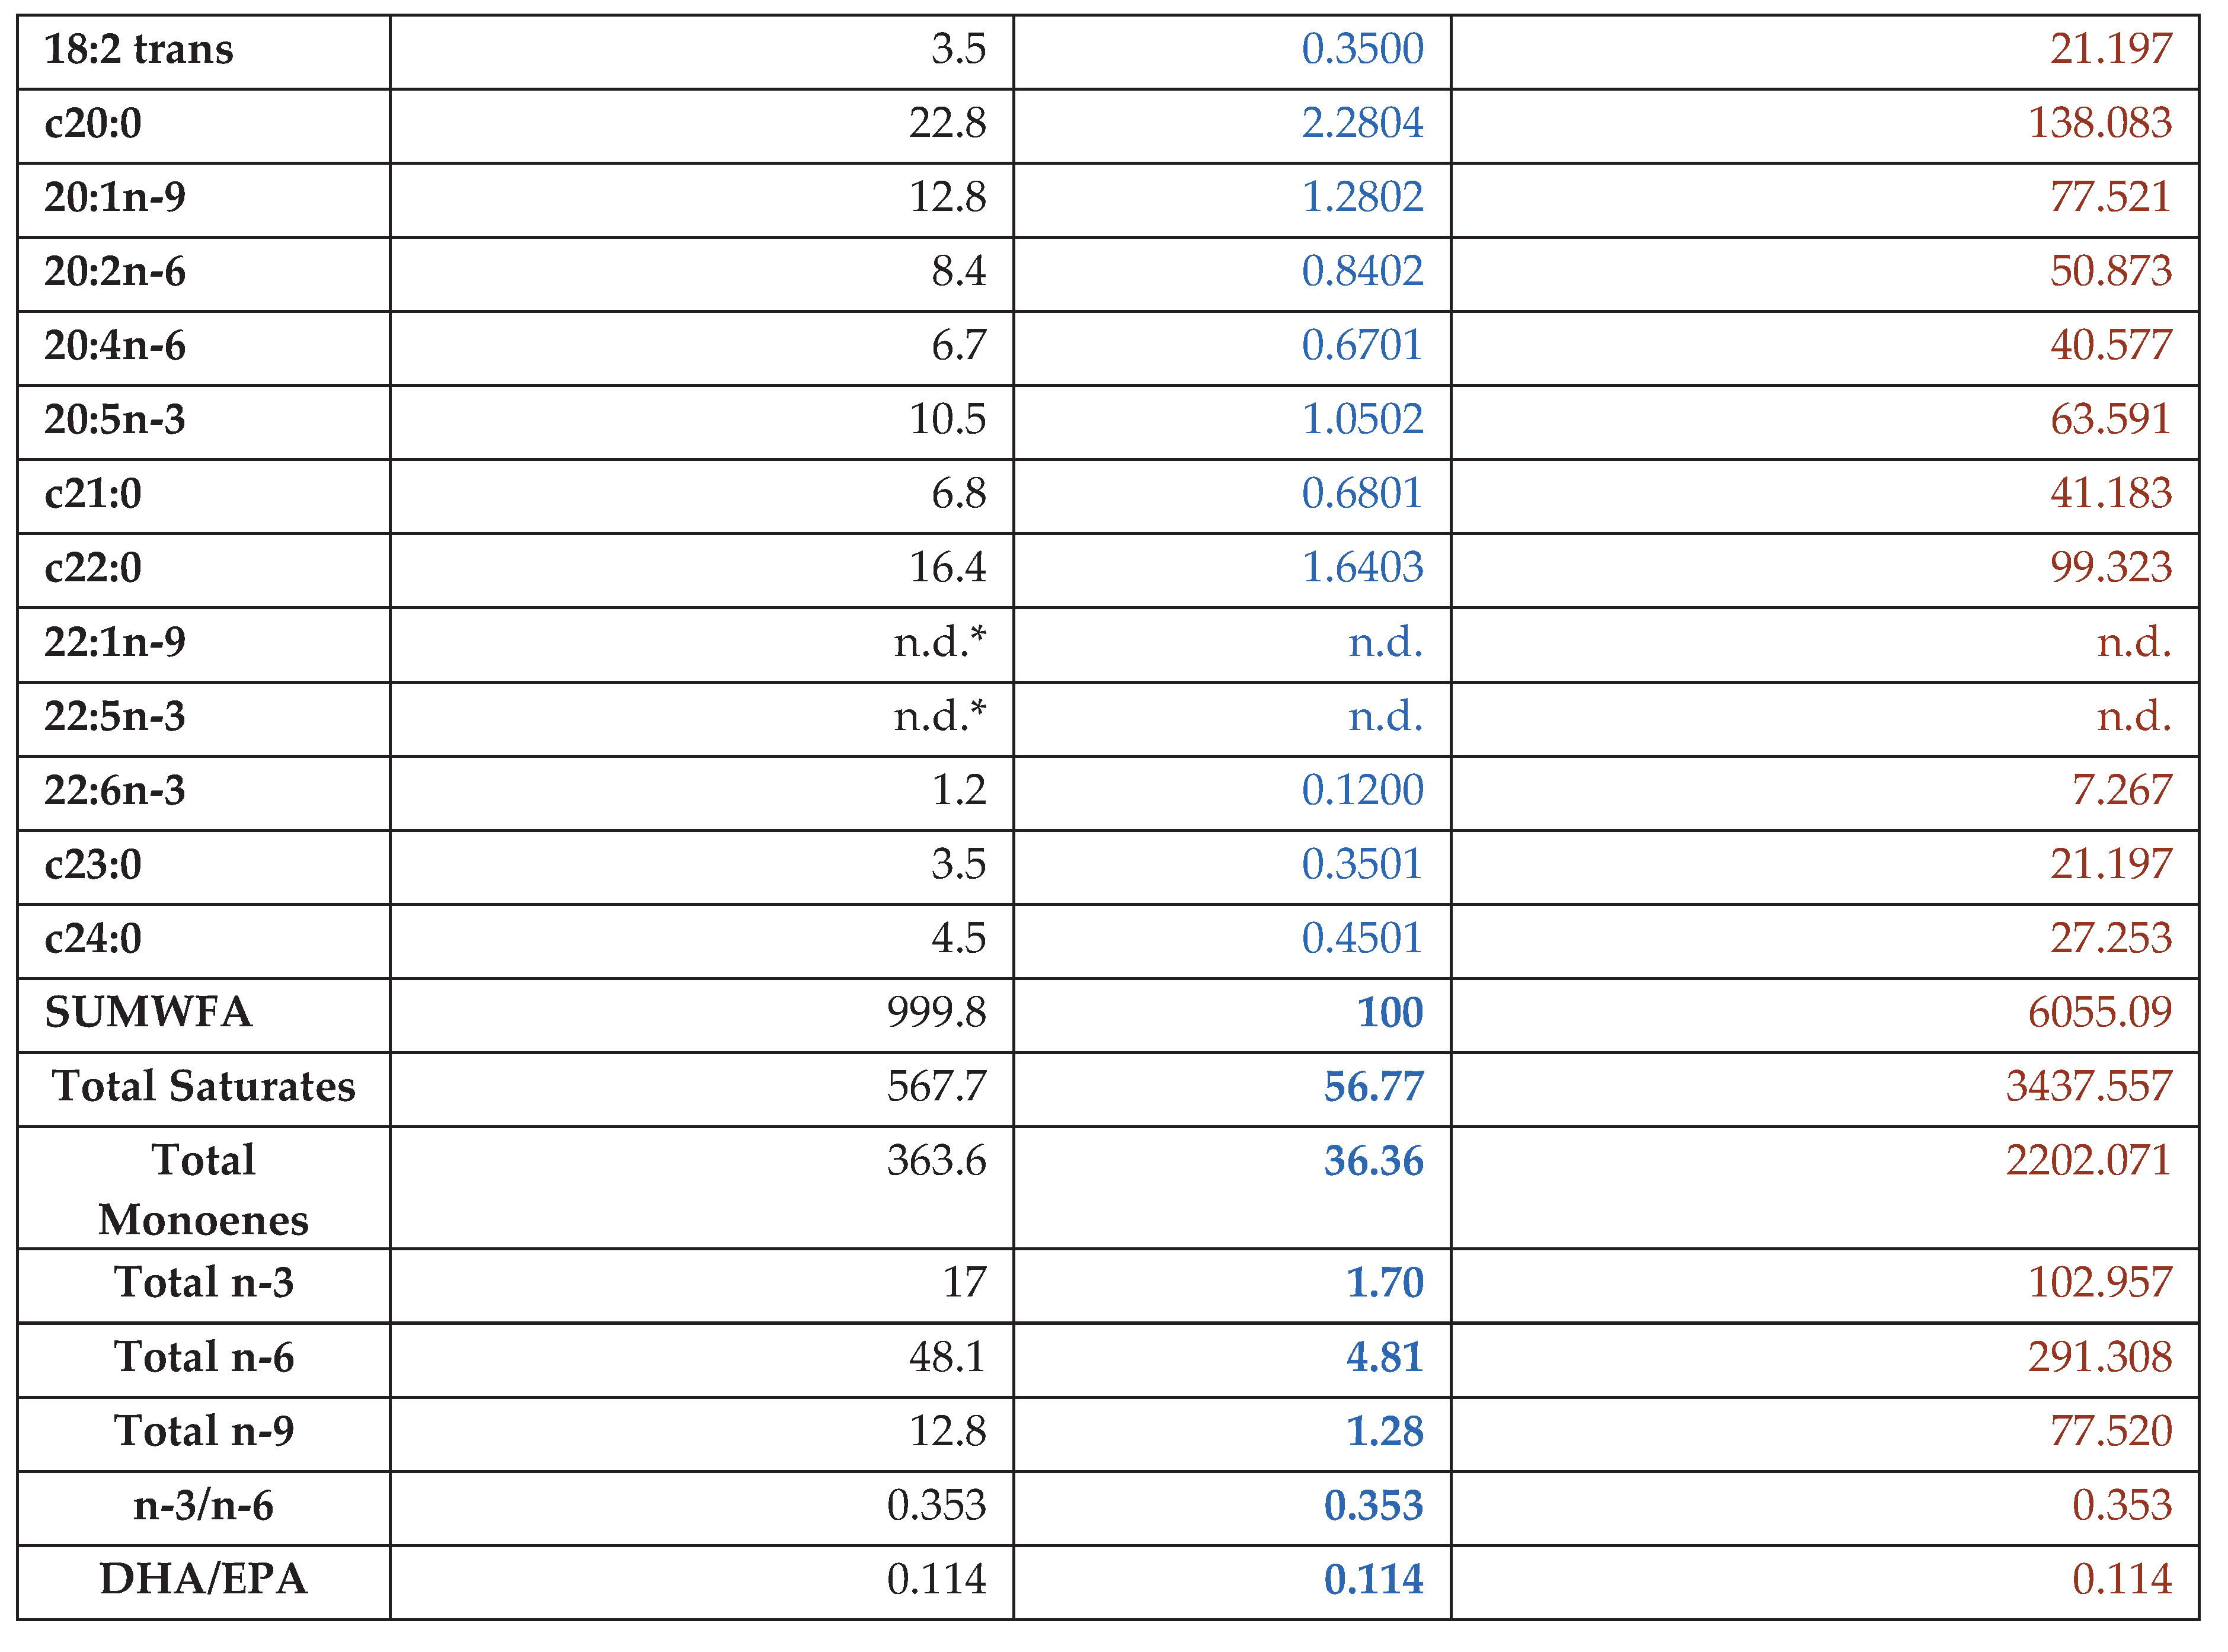 |
Table 7.
Fatty acid profile of the Tail Muscle of the crayfish fed the Control Diet (CD / n = 3) at regular time intervals.
Table 7.
Fatty acid profile of the Tail Muscle of the crayfish fed the Control Diet (CD / n = 3) at regular time intervals.
 |
 |
 |
*Non Detected / Limit of Detection (LOD) = 0.003.
Table 8.
Fatty acid profile of the Tail Muscle of the crayfish fed the Semi Purified Diet (SPD/ n = 3) at regular time intervals.
Table 8.
Fatty acid profile of the Tail Muscle of the crayfish fed the Semi Purified Diet (SPD/ n = 3) at regular time intervals.
 |
 |
 |
*Non Detected / Limit of Detection (LOD) = 0.003.
Table 9.
Total lipids of tail muscle for experimental crayfish.
| % on a Wet Basis | % on a Dry Matter basis | |
| Start - At the Onset of the experiment (n=4) | 1 | 6.0563 |
| D-35 Control (n=3) | 1.4 | 8.4789 |
| D-45 Control (n=2) | 1.3 | 7.8732 |
| D-62 Control (n=3) | 1.1 | 6.6619 |
| D-88 Control (n=2) | 0.8 | 4.8450 |
| Control Average | 1.15 (±0.229*) | 6.9647 (±1.3876) |
| D-35 Treatment (n=4) | 2 | 12.1126 |
| D-45 Treatment (n=3) | 0.7 | 4.2394 |
| D-62 Treatment (n=2) | 0.6 | 3.6338 |
| D-88 Treatment (n=2) | 0.6 | 3.6338 |
| Treatment Average | 0.975 (±0.593) | 5,90489 (±3.5925) |
* Represents Standard Deviation.
Disclaimer/Publisher’s Note: The statements, opinions and data contained in all publications are solely those of the individual author(s) and contributor(s) and not of MDPI and/or the editor(s). MDPI and/or the editor(s) disclaim responsibility for any injury to people or property resulting from any ideas, methods, instructions or products referred to in the content. |
© 2026 by the authors. Licensee MDPI, Basel, Switzerland. This article is an open access article distributed under the terms and conditions of the Creative Commons Attribution (CC BY) license (http://creativecommons.org/licenses/by/4.0/).
Copyright: This open access article is published under a Creative Commons CC BY 4.0 license, which permit the free download, distribution, and reuse, provided that the author and preprint are cited in any reuse.


