
Submitted:
14 July 2026
Posted:
15 July 2026
You are already at the latest version
Abstract
The current system of state land cadastral valuation relies predominantly on economic indicators, overlooking natural and environmental hazards in its calculations. Ignoring these local risks severely distorts the objective value of land parcels in complex territo-ries such as the Bostandyk District of Almaty. Determining fair property values re-quires implementing a methodology capable of mathematically accounting for tectonic faults, zones of 9- and 10-point seismic intensity, and environmental discomfort indi-cators. A GIS-based spatial analysis of 62 cadastral blocks, utilizing up-to-date seismic microzoning maps, enabled the calculation of an integrated risk coefficient for each specific location. Mathematical modeling demonstrated the impact of negative exter-nalities on land pricing. Accounting for geological hazards results in a proportional 20–45% reduction in the unit cadastral value for the most vulnerable areas. This new valu-ation paradigm shifts the focus toward urban environmental safety and restores the so-cial equity of the cadastre. Establishing objective, discounted prices creates a natural economic barrier against urban densification in hazardous zones. The developed ana-lytical algorithm is universal and can be scaled to other seismically active regions in Central Asia.
Keywords:
cadastral valuation
; natural hazards
; seismic risk
; negative externalities
; GIS-based spatial analysis
; sustainable land management
; Bostandyk District
1. Introduction
Sustainable spatial planning and objective land valuation are essential conditions for the high-quality development of modern cities. In the vast majority of countries, real estate taxation is based on mass property valuation algorithms [1]. Global guidelines established by the UN’s 11th Sustainable Development Goal (SDG 11) are gradually transforming purely fiscal cadastral registries into multifunctional mechanisms for managing spatial risks [2]. However, a different situation is observed in countries with transition economies, where a conservative and overly rigid administrative approach persists. In these countries, state land registration often exists in isolation from environmental constraints and up-to-date natural hazard maps.
In Kazakhstan, the initial allocation of municipal lands relies predominantly on spatial macro-indicators. The base value of a land parcel is determined by the prestige of its location, proximity to the city center, and the density of utility networks. Nevertheless, a purely commercial perspective on the urban environment is already proving to be inadequate. Ignoring local hazards inevitably distorts the true value of a territory. Such overvaluation of potentially high-risk areas sends false economic signals and essentially encourages the active development of tectonically unstable zones. The purpose of this study is to develop an applied methodology for incorporating factors of seismic activity and environmental deterioration into state cadastral valuation procedures. The Bostandyk District of Almaty serves as the empirical basis for this research [3,4,5,6,7,8].
The digitalization of economic processes has turned geographic information systems (GIS) and spatial analysis into routine yet mandatory tools for real estate management. In mass valuation calculations, it is no longer possible to ignore those negative externalities that the market mechanism is unable to compensate for [9,10,11]. In the scientific literature, such externalities are most often interpreted as direct financial losses for property owners. Additional health risks and an overall decline in the quality of life significantly narrow the permissible use scenarios for land parcels. Therefore, embedding parameters of environmental discomfort into cadastral algorithms becomes a key condition for social equity in determining property value [12].
Modern research is gradually shifting away from purely macroeconomic constructs toward a detailed study of local site characteristics. The necessity to consider the environmental situation and the specific features of the immediate surroundings has been convincingly substantiated in a number of recent studies [13]. In practice, however, these significant price-forming parameters continue to remain outside the scope of calculations, which naturally leads to overvaluations. Base rates can only be adjusted by directly incorporating actual natural constraints into the mathematical model of land valuation [14].
The development of adequate valuation algorithms begins with a clear definition of the concept of spatial vulnerability itself. In contemporary studies, the social and material instability of the urban environment is directly linked to high environmental and economic uncertainty [15]. Special indices allow the multidimensional nature of risks to be aggregated into a single calculated indicator, significantly facilitating spatial analysis and enabling the precise localization of potentially critical zones. When natural vulnerability parameters are included in the calculation of cadastral value, it establishes a fundamental basis for territorial protection within the framework of sustainable development.
High-hazard zones—such as areas along tectonic faults—are often characterized by minimal market activity or a complete lack of commercial transactions. Under such conditions, traditional direct sales comparison methods simply do not work. A solution is found in spatial extrapolation [16,17,18]: the essence of this approach lies in clustering settlements with a similar structure of price-forming factors. Geostatistics and spatial interpolation tools make it possible to compensate for the lack of market statistics and build mathematically robust models even with sparse initial data.
Global practice in mass real estate valuation has long been based on the integration of geospatial constraints and vulnerability indices. The Kazakhstani land administration system, however, significantly lags behind in this regard—local environmental and geological hazards continue to be left out of the calculations. The contradiction between purely economic pricing principles and the actual safety of sites in seismically active or debris flow-prone areas requires new mathematical tools. The development of adjustment coefficients will not only help achieve fairness in fiscal calculations but also create an economic barrier against the development of high-risk territories [19].
2. Materials and Methods
1. Study Area
The validation of the developed mathematical model was carried out using data from the Bostandyk District of Almaty. This location was not chosen randomly: it is here that the conflict between high urban development attractiveness and a dense complex of environmental risks is particularly pronounced. For the purposes of spatial modeling, the study area was divided into 62 cadastral blocks numbered from 20313001 to 20313062. Such strict linkage of objects to local boundaries allows for the accurate aggregation of spatial data and its subsequent use in fiscal calculations [20].
The cartographic base was prepared using the ArcMap 10.8.2 software environment. Initial geodata regarding municipal divisions were extracted from the Unified State Real Estate Cadastre (USREC). The resulting polygon layer of the district served as the basis for the manual vectorization of each cadastral block.
OpenStreetMap (OSM) data were utilized as a basemap for spatial detailing. This open-source service facilitated the supplementary digitization of key urban environment elements: building footprints, the road network, green spaces, and administrative boundaries. The final map layout and the export of the finished materials were performed using standard cartographic layout tools (Figure 1) [21].
2. Spatial Data and Risk Factors
The integration of the seismic factor (Kseis) became a key element in forming the digital geodatabase. Spatial modeling was based on the archival materials of the Institute of Seismology, which provide a detailed presentation of the microzoning results for the study area. Hard-copy maps were converted into a vector format, allowing for the precise delineation of areas with 9- and 10-point earthquake intensity, as well as the identification of buffer zones along tectonic faults. If a parcel falls directly on a geological fault line or within the epicentral zone of potential 10-point tremors, it automatically imposes severe restrictions on any permanent construction.
The precise localization of hidden faults has acquired particular significance against the backdrop of the metropolis’s consistently high background seismicity. Using ArcMap tools, the administrative boundaries of the district were carefully digitized, and tectonic fault lines were manually mapped. Following a similar principle, data regarding the surface urban infrastructure—the road network and residential areas—were overlaid. The final step involved differentiating the landscape according to the degree of geological hazard, after which the final cartographic layout was composed and exported (Figure 2) [22,23,24,25].
The calculation of the environmental factor (Kenv) is based on remote sensing data obtained from Sentinel and Landsat satellites. Satellite monitoring enables the accurate detection of the urban heat island effect through Land Surface Temperature (LST) anomalies and the mapping of green spaces based on vegetation indices.
The condition of the vegetation cover was assessed using the NDVI indicator. For this purpose, optical multispectral Sentinel-2 imagery was utilized, serving as the primary data source. The required scenes were selected from the open Copernicus Data Space Ecosystem catalog, with mandatory filtering by the season of image acquisition and the cloud cover level over the study area [27,28,29].
Raster data processing was performed within the ArcGIS environment. The index calculation algorithm involved the separate extraction of values from the red (Band 4) and near-infrared (Band 8) bands. The final mathematical transformation was executed via the Raster Calculator tool according to the standard formula.
The mathematical validity of the calculations is confirmed by all generated values falling within the standard range of -1 to +1. The spatial localization of the dataset was ensured by applying the Extract by Mask tool, which allowed the initial raster to be clipped precisely to the administrative boundaries of the study area. The final stage of geoprocessing involved differentiating the index values using a color scale for a clear visualization of the green infrastructure density, which concluded with the layout and export of the final cartographic materials (Figure 3).
The calculation of Land Surface Temperature (LST) parameters utilized the computational capabilities of the Google Earth Engine cloud architecture. Multispectral imagery from the Landsat 8 mission (Collection 2, Level 2) served as the foundation for the monitoring. The filtering of the source data strictly excluded non-summer scenes and images with cloud cover exceeding 10 percent. Cloud cover isolation was achieved through algorithmic masking using the specialized QA_PIXEL band.
The transformation of raw thermal band (ST) values into the standard Celsius temperature scale was performed by applying standard scaling factors. The generated array of averaged values was exported as a GeoTIFF raster file. The final geoprocessing of the spatial data was conducted in a local ArcGIS environment. Applying the Extract by Mask tool allowed the overall raster to be clipped strictly to the administrative boundaries of the Bostandyk District. The thermal heterogeneity of the territory is visualized on the map layout (Figure 4) using a continuous color gradient, where cooler areas are depicted in dark blue and the epicenters of intense heating are highlighted in the red spectrum.
3. Methodology
In international mass valuation practice, any territorial constraints—whether they be regulations for zones with special conditions—are interpreted as negative externalities. Ultimately, these externalities translate into direct financial losses for real estate owners. Economic damage arises from the restriction of development rights, additional health risks, and a decline in overall environmental quality. To establish a socially fair value for land parcels, such hidden locational defects must be recorded in cadastral registries; otherwise, the calculations will remain incomplete [10].
The weight of each individual hazard is determined using the Analytic Hierarchy Process (AHP) or Multi-Attribute Value Theory (MAVT). The MAVT framework allows for the construction of a branching dendrogram and a step-by-step adjustment of the base land price, taking into account the natural vulnerability of the territory. In this process, the multidimensional nature of local risks is aggregated into a single index. Consolidating disparate parameters into a common indicator of socio-material vulnerability significantly facilitates comparative spatial analysis [13].
In this study, the AHP modeling is focused on the mathematical weighting of two fundamental criteria: seismic hazard (C1) and environmental discomfort (C2). The numerical values for the second factor are calculated based on remote sensing data. The algorithm for calculating the weight coefficients of spatial factors using the AHP method is illustrated in Figure 5.
Multi-Attribute Value Theory. Multi-Attribute Value Theory (MAVT) helps structure complex multi-criteria problems through the construction of hierarchical decision trees. This method is employed because it allows for the mathematical integration of vastly different phenomena, such as geological hazards and microclimatic parameters, within a single measurement scale [30].
The MAVT framework is based on compensatory logic: when calculating the final score, some criteria can offset others. In cadastral practice, this manifests quite clearly—extensive green spaces can algorithmically mitigate the impact of certain locational defects, whereas pronounced environmental discomfort, conversely, accelerates the decline in land value. The degree of such mitigation is strictly constrained by the assigned system of weights. Since the model is additive, weights are introduced as scalar constants, and all marginal value functions must operate within the same numerical intervals [31].
Each spatial alternative (x) is evaluated against a specific attribute (i) through an individual value function (vi(x)) [32]. The final aggregated indicator is obtained by summing all the functions multiplied by their corresponding weights.
In our model for calculating the integral risk (K risk) for a cadastral block, this formula is expressed as follows:
V(x) - the K risk coefficient for a specific cadastral block x.
N - the number of attributes, where in our model n = 2 (attribute 1 is seismic hazard; attribute 2 is environmental discomfort). Here, n is the number of attributes, wi is the weight of attribute i, and vi(x) is the value function for an individual attribute, reflecting the performance of alternative x with respect to attribute i.
wi — are scalar constants obtained previously by us using the Analytic Hierarchy Process (AHP). For the seismic factor, w1 = 0.833, and for the environmental factor, w2 = 0.167.
vi(x)- the attribute value function. It is not feasible to directly input “seismic intensity points” or “surface temperature degrees” into the equation. The function vi(x) transforms actual physical measurements into a normalized scale ranging from 0 to 1.
4. Practical Application of the Value Functions Vi(x):
- For the seismic factor (v1): The value function is calculated as the proportion of the cadastral block area covered by a 10-point seismic intensity zone or a tectonic fault. If the block is completely intersected by a fault, v1(x) = 1.0. If it is half-covered, v1(x) = 0.5. In the absence of a fault, v1(x) = 0.0.
- For the environmental factor (v2): This function utilizes satellite monitoring data (NDVI and LST). If the block consists of continuous concrete development experiencing the urban heat island effect with an absence of vegetation, the function v2(x) approaches 1.0 (maximum discomfort). Conversely, if it is a green park area, v2(x) approaches 0.0.
Final Calculation Example
Suppose a cadastral block located in the foothills is being evaluated. It is 50% intersected by a tectonic fault (v1 = 0.50) but possesses excellent environmental conditions with abundant vegetation (v2 = 0.10). Substituting these values into the MAVT equation yields:
Krisk = (0.833 × 0.50) + (0.167 × 0.10) = 0.4165 + 0.0167 = 0.433
Thus, the final risk coefficient for this cadastral block amounts to 0.433. It is mathematically justified that its base cadastral value should be reduced by exactly this percentage (43.3%).
5. the Dendrogram Is Presented in Figure 6
The specific nature of real estate segments in high-hazard areas, particularly those situated directly over tectonic faults, is characterized by minimal market activity or a complete absence of commercial transactions. The resulting information deficit renders the application of the traditional sales comparison approach impossible. This lack of data can be compensated for through the methodology of spatial extrapolation of base parameters. By grouping parcels with similar spatial characteristics into homogeneous clusters, a foundation is established for constructing a generalized statistical model.
The determination of an objective cadastral value is achieved using regression equations. The baseline mathematical framework, which accounts for traditional macro-factors such as distance from the city center and infrastructure provision, is expanded through local spatial adjustments. The calculation of the unit cadastral value relies on classic linear regression analysis or hybrid algorithms capable of simultaneously processing macroeconomic markers and qualitative descriptors of environmental conditions.
A GIS overlay of the water network and seismic hazard vector layers enables the calculation of a precise reduction coefficient for vulnerable locations, including cadastral block 20313054, which is intersected by a fault. The final equation for the modified value takes the following form:
- the cadastral value of the land parcel; SICV- is the base unit cadastral value accounting for infrastructure; S- is the area of the parcel; and Krisk - is the cumulative coefficient reflecting the impact of negative external factors (debris flows, seismicity, environmental conditions). The determination of the exact K risk coefficient is carried out through GIS spatial analysis of the proportion of the block’s area exposed to natural hazards.
3. Results
3.1. Spatial Distribution of Natural Hazards
To spatially localize the epicenters of natural and environmental vulnerability, the overlay method was applied. The base vector grid, encompassing the 62 cadastral blocks of the Bostandyk District, was sequentially superimposed with seismic microzoning maps based on the MSK-64(K) scale.
The GIS synthesis revealed substantial spatial heterogeneity in the distribution of hazards. The northern and northwestern blocks (numbers 20313001–20313010) are consistently located within the 9-point zone. Moving toward the southern foothills, the calculated seismic intensity increases to a critical 10 points. Additional restrictions on permanent construction are imposed by active tectonic faults that intersect the central and southern parts of the district. The situation is exacerbated by river arteries: their channels pose a direct debris flow hazard and necessitate the establishment of water protection strips, which further narrows the possibilities for economic development.
For each registered block, an integral risk coefficient (Krisk) was calculated, summarizing the local territorial defects. The minimum value (0) was assigned to parcels with a standard 9-point background and no additional complications. The highest values, reaching 0.3–0.4, were recorded where 10-point seismicity overlaps with fault lines and proximity to debris flow-prone channels.
The modified unit cadastral value (SICV new) is determined using the following formula:
The final fair cadastral price of the land parcel (CVnew) is determined by multiplying the modified unit cadastral value by the parcel’s area (Slp):
To derive the local coefficients from the final table, the Multi-Attribute Value Theory (MAVT) formula introduced in the methodology is applied:
where:
w1 = 0.833 is the weighting coefficient for seismic hazard.
w2 = 0.167 is the weighting coefficient for environmental risk (dependent on the NDVI and LST indices).
v1- is the normalized seismic risk function (ranging from 0 to 1, where 1 represents maximum hazard, such as complete intersection by a tectonic fault).
v2 - is the normalized environmental risk function (ranging from 0 to 1, where 0 represents a high NDVI vegetation value and a favorable LST thermal background, whereas 1 denotes continuous built-up areas with a pronounced urban heat island effect).
Given that the final Krisk values are known, the mathematical calculations demonstrating precisely which v1 and v2 parameters (in terms of NDVI and LST) determine the final value for each cadastral block are presented below.
1. Cadastral Block 20313003 (Zone I)
Conditions: 9-point seismic intensity, no tectonic fault. Final Krisk = 0.05.
Logic for v1: Since there is no fault and the conditions are standard, v1 is set to 0.0 (in accordance with the methodology: “In the absence of a fault, v1 = 0.0”).
Mathematical derivation of v2 (Environmental factor):
A v2 value of 0.30 indicates a moderate level of environmental discomfort. Satellite data demonstrate average Normalized Difference Vegetation Index (NDVI) values alongside a neutral thermal regime (LST). Vegetation is present; however, the area lacks dense park coverage.
2. The analysis of cadastral block 20313034 (Zone II) is predicated on a final risk coefficient (Krisk) recorded at 0.20. The background seismicity of the location is 9 points, and the area is simultaneously intersected by a tectonic fault and a water artery.
The seismic hazard function (v1) assumes a value of 0.20 in this context. The presence of a geological fault outside the critical 10-point zone imposes strict urban planning restrictions on one-fifth of the cadastral unit’s area. The mathematical extraction of the environmental component (v2) is executed through the following sequence of calculations:
A v2 value of 0.20 based on remote sensing data indicates high environmental quality. The presence of a nearby water artery stimulates an increase in vegetation density, driving the Normalized Difference Vegetation Index (NDVI) towards 1.0. This effectively stabilizes the Land Surface Temperature (LST) through evaporative cooling.
The calculation of the integral risk for cadastral block 20313054 (Zone II) is conducted in the absence of open water bodies, yet in the presence of destructive factors: 10-point seismic activity and a tectonic fault. The final Krisk coefficient for this territory amounts to 0.35.
The geological hazard function (v1) assumes a value of 0.40, reflecting that the buffer zone of the tectonic fault extends across 40% of the analyzed block’s area. The subsequent extraction of the pure environmental component (v2) is executed through the following mathematical transformations:
Satellite imagery data fully corroborate the minimal discomfort value (v2 = 0.10). The foothill location ensures exceptional environmental quality: dense vegetation yields peak NDVI values, and the thick green canopy reliably mitigates local thermal anomalies, a phenomenon clearly visible on LST rasters.
A starkly different situation is observed in cadastral block 20313060 (Zone IV). Here, the final risk coefficient (Krisk) reaches a critical value of 0.45—the territory is subject to 10-point seismic intensity, is intersected by an active fault, and is additionally burdened by a debris flow-prone river channel.
The proportion of geological impact (v1) for this block was intentionally maintained at the same level as in the previous case, at 0.40. This decision allows the tectonic baseline to remain constant, making it possible to isolate exactly how the water artery influences the environmental component. The variable (v2) was recalculated according to the following procedure:
A v2 value of 0.70 indicates a high level of discomfort and vulnerability. In this scenario, the river functions not as a source of vegetation, but as a catalyst for a negative externality—the debris flow hazard. This proximity drastically degrades the v2 indicator, even if the NDVI values themselves appear quite acceptable (Table 1).
3.2. Modeling the Fair Cadastral Value
The calculation of the baseline regression model (SICV base) was conducted in strict accordance with the current state valuation regulations. The normative land tariff for the Bostandyk District is fixed at 6,200 tenge per square meter. The internal administrative division splits the study area into four urban planning sectors. The commercially attractive northern blocks (Zone I) are tariffed with a maximum correction multiplier (Kzone) reaching 1.50. Shifting toward the southern periphery of the district (Zone IV) naturally decreases this corrective value to a minimum of 1.03. The mathematical definition of the initial plot price is described by the following equation:
For the sample of the investigated areas, the baseline parameters were as follows:
- Cadastral block 20313003 belongs to Zone I (coefficient 1.50) → Baseline value = 9,300 tenge.
- Cadastral block 20313034 belongs to Zone II (coefficient 1.33) → Baseline value = 8,246 tenge.
- Cadastral block 20313054 belongs to Zone II (coefficient 1.33) → Baseline value = 8,246 tenge.
- Cadastral block 20313060 belongs to Zone IV (coefficient 1.03) → Baseline value = 6,386 tenge.
The official valuation methodology relies exclusively on macroeconomic zoning and fails to account for specific local natural hazards, which simply remain outside the scope of state calculations. The recalculation results of the unit cadastral value for parcels with varying degrees of spatial vulnerability are summarized in Table 2.
The combination of real base rates with remote sensing data reveals an intriguing urban planning paradox typical of foothill areas. Block 20313054 falls within valuation zone II, and according to the official methodology, its value is high—8,246 KZT per square meter, which is attributed to the prestige of the location. Satellite data confirms the environmental well-being of this territory: dense vegetation (high NDVI) and the absence of thermal anomalies ensure a low level of discomfort (v2 = 0.10). However, the block is located in a 10-point seismic zone and is additionally intersected by an active tectonic fault (v1 = 0.40). The integral natural risk coefficient (Krisk = 0.35) corrects this imbalance, justifiably reducing the value to 5,360 KZT per square meter.
The method also highlights the compensatory role of ecosystems. In block 20313034, a tectonic fault (v1 = 0.20) is partially offset by the proximity of a river, which provides a mild microclimate and an abundance of greenery (v2 = 0.20). The resulting risk here is 0.20, and the value decreases moderately—by 20%, down to 6,597 KZT per square meter.
The most dramatic situation is observed in block 20313060 (zone IV). A destructive synergistic effect occurs here: the 10-point seismicity and a tectonic fault (v1 = 0.40) are compounded by the threat of mudflows from the waterway, which results in extremely high environmental discomfort (v2 = 0.70). Consequently, the real cadastral value drops by nearly half—by 45%, down to 3,512 KZT per square meter. This serves as a strong economic signal preventing dense construction in a critically hazardous zone.
4. Discussion
Spatial modeling of the Bostandyk District has revealed a profound conflict between market pricing and actual geological safety. The prestigious southern foothills historically attract buyers with their favorable microclimate, while simultaneously being situated at the epicenter of maximum hazards due to their intersection by active faults and their location within a 10-point seismic zone. The developed algorithm resolves this paradox through the mathematical accounting of territorial vulnerability. Recent studies (Bykova E. et al., 2024, 2025) demonstrate a direct correlation between the disregard for local defects and the unjustified inflation of fiscal indicators. The integration of the risk coefficient (Krisk) shifts natural hazards into the category of negative externalities, algorithmically discounting the base unit cadastral value (SICV).
The practical application of the proposed methodology fundamentally alters the principles of land resource administration. A 20–45% reduction in cadastral value for parcels located in debris flow-prone channels and along tectonic fault lines establishes a mechanism of social equity, compensating property owners for the detriments of residing in extreme conditions. The objective depreciation of high-risk sites generates a powerful economic signal, deterring developers from planning dense multi-story construction. The scientific soundness and absolute transparency of the calculations are achieved through the cross-overlay of GIS layers of cadastral blocks and seismic microzoning maps.
The functioning of the mathematical model is strictly limited by the quality and granularity of the initial spatial databases. The high precision of available seismic maps for the Bostandyk District coexists with an acute deficit of micro-scale environmental statistics, including local measurements of PM 2.5 particle concentrations at the specific block level. An additional obstacle may arise from the inertia of the real estate market itself. Speculative frenzy surrounding elite territories has the potential to completely ignore objective threats, thereby perpetuating a substantial gap between the scientifically justified cadastral value and the actual commercial price.
5. Conclusions
The study culminated in the development and validation of a novel methodology for the cadastral valuation of urban lands. The mathematical incorporation of natural and environmental vulnerability factors confirmed its operational viability across 62 registered blocks of the Bostandyk District in Almaty. Traditional macroeconomic calculations were found incapable of adequately reflecting either the true value of the territory or its actual safety.
GIS tools, in conjunction with seismic microzoning maps, enabled the derivation of a precise integral risk coefficient. When 10-point seismicity, debris flows, and concealed faults are factored into the calculation, a strict mathematical justification emerges for a significant reduction in the value of the most hazardous parcels.
The transition from a purely fiscal logic to a model of sustainable development becomes not merely desirable, but inevitable for countries with a high level of natural hazards. The natural depreciation of high-risk sites restores social equity within the primary land market and reliably safeguards the property interests of citizens. Furthermore, the developed analytical framework is easily scalable: its computational scheme is ready for algorithmization and software integration into the Unified State Real Estate Cadastre (USREC) throughout Kazakhstan, with the prospect of future adaptation for other seismically active countries in Central Asia.
Author Contributions
Conceptualization R.K. and D.M. methodology, M.Sh. and G.A.; software, B.D. and G.Sh.; validation, E.M. and A.Zh.; formal analysis, D.M. and A.B.; investigation, A.B., D.M. and A.Zh.; resources, E.M. and R.K.; data curation, A.B. and A.Zh.; writing—original draft preparation, A.B. and D.M.; writing—review and editing, B.D. and G.Sh.; visualization, A.B. and D.M.; supervision, A.B.; project administration, R.K.; A.B., and G.A. funding acquisition. All authors have read and agreed to the published version of the manuscript.
Funding
The primary findings of this research are detailed within the paper. Please address any further questions to the corresponding author.
Data Availability Statement
The original contributions presented in the study are included in the article/supplementary material; further inquiries can be directed to the corresponding author.
Conflicts of Interest
The authors declare no conflicts of interest.
References
- Hernandi, A.; Meilano, I.; Saptari, A.Y.; Suwardhi, D.; Abdulharis, R.; Handayani, A.P.; Nurmaulia, S.L.; Putri, N.S.E.; Widyastuti, R.; Merdekawati, P.; Cahyani, F.N. Transforming Property Tax Administration: Spatially Adaptive Land Assessment Model (SALAD) for Modernizing the Tax Cadastre. Geographies 2026, 6, 56. [CrossRef]
- United Nations. Sustainable Development Goals. Available online: https://sdgs.un.org/ru/goals (accessed on 30 June 2026).
- Land Code of the Republic of Kazakhstan; Law of the Republic of Kazakhstan No. 442; 20 June 2003.
- On Approval of the Boundaries of Price Zoning of Lands and Correction Factors to the Base Rate of Payment for Land Plots; Decision of the Maslikhat of Almaty City No. 356; Registered by the Department of Justice of Almaty City No. 1202; 23 July 2015.
- Official Information Source of the Akimat of Almaty City. Available online: https://www.gov.kz/memleket/entities/almaty/ (accessed on 30 June 2026).
- Bykova, E.N. Assessment of Negative Infrastructural Externalities in Determining the Value of Land. J. Min. Inst. 2021, 247, 154–170. [CrossRef]
- Vasilyeva, N.V. Cadastres and Cadastral Valuation of Land, 3rd ed.; Yurayt: Moscow, Russia, 2026; p. 140. ISBN 978-5-534-19513-2.
- On Approval of the Rules for Maintaining the State Land Cadastre in the Republic of Kazakhstan; Order of the Minister of National Economy of the Republic of Kazakhstan No. 160; Registered by the Ministry of Justice of the Republic of Kazakhstan No. 10147; 23 December 2014.
- Bykowa, E.; Skachkova, M.; Raguzin, I.; Dyachkova, I.; Boltov, M. Automation of Negative Infrastructural Externalities Assessment Methods to Determine the Cost of Land Resources Based on the Development of a “Thin Client” Model. Sustainability 2022, 14, 9383. [CrossRef]
- Kilić Pamuković, J.; Rogulj, K.; Jajac, N. Assessing the Bonitet of Cadastral Parcels for Land Reallocation in Urban Consolidation. Land 2021, 10, 9. [CrossRef]
- Volkova, J.; Bykowa, E.; Hełdak, M.; Przybyła, K.; Pawlak, S. Territorial Extrapolation of Basic Data as a Solution of the Problem of Its Deficiency during Mass Appraisal. Land 2021, 10, 750. [CrossRef]
- Mokhele, M. Analysing the Market Value of Land Accommodating Logistics Facilities in the City of Cape Town Municipality, South Africa. Sustainability 2025, 17, 5776. [CrossRef]
- Bykowa, E.; Skachkova, M.; Raguzin, I.; Dyachkova, I.; Boltov, M. Automation of Negative Infrastructural Externalities Assessment Methods to Determine the Cost of Land Resources Based on the Development of a “Thin Client” Model. Sustainability 2022, 14, 9383. [CrossRef]
- Bykova, E.; Banikevich, T.; Zalivatskaya, N.; Pirogova, O. Modeling the Cadastral Value of Land Plots of Horticultural Non-Profit Partnerships Taking into Account the Influence of Local Territorial Factors. Land 2024, 13, 1004. [CrossRef]
- Nasca, L.; Giuffrida, S.; Trovato, M.R. Value and Quality in the Dialectic of Human and Urban Capital of City Networks on the Land District Scale. Land 2022, 11, 34. [CrossRef]
- Volkova, J.; Bykowa, E.; Hełdak, M.; Przybyła, K.; Pawlak, S. Territorial Extrapolation of Basic Data as a Solution of the Problem of Its Deficiency during Mass Appraisal. Land 2021, 10, 750. [CrossRef]
- Jasińska, E.; Preweda, E. Determining the cadastral-tax areas for the real estate premises based on the model of qualitative and quantitative. In Proceedings of the Environmental Engineering 10th International Conference, 27–28 April 2017.
- Manganelli, B.; Morano, P.; Rosato, P.; De Paola, P. The Effect of Taxation on Investment Demand in the Real Estate Market: The Italian Experience. Buildings 2020, 10, 115. [CrossRef]
- Simakov, A.V.; Simakova, T.V.; Evtushkova, E.P.; et al. GIS Technologies in Land Management and Cadastre; Northern Trans-Ural State Agricultural University: Tyumen, Russia, 2022; p. 254.
- Official Information Source of the Akimat of Bostandyk District. Available online: https://www.gov.kz/memleket/entities/almaty-bostandyk?lang=ru (accessed on 30 June 2026).
- Unified State Real Estate Cadastre (EGKN). Available online: https://map.gov4c.kz/egkn/?ref=bluescreen.kz (accessed on 30 June 2026).
- Rustam, O.; Sanjarbek, S. Creation of a complex electronic map of agriculture and agro-geo databases using GIS techniques. 2021, 2–5.
- Assessment of the Danger of Mudflow and Landslide Phenomena in Kazakhstan. Available online: https://www.чс-ник.kz/opasnosti/sel/item/575-otsenka-opasnosti-sele-opolznevykh-yavlenij-kazakhstana (accessed on 30 June 2026).
- Talanov, E.A. Mudflow risk: Theoretical foundations and practical significance. In Proceedings of the International Conference “Debris Flows: Disasters, Risk, Forecast, Protection”, Pyatigorsk, Russia, 2018; Institute “Sevkavgiprovodkhoz”: Pyatigorsk, Russia, 2018; p. 396.
- Medeu, A.R.; Blagoveshchenskiy, V.P.; Baymoldayev, T.A.; Kirenskaya, T.L.; Stepanov, B.S. Mudflow Phenomena of South-Eastern Kazakhstan. Vol. 2. Part 2. Fundamentals of Monitoring in the Ile Alatau; Institute of Geography: Almaty, Kazakhstan, 2018.
- Suleyev, D.K.; Uzbekov, N.B. (Eds.); Sadykova, A.B.; Beloslyudtsev, V.M.; et al. Maps of Seismic Microzoning SMZ-2_2475 of Almaty Territory in Points of Macroseismic Scale MSK-64(K) for a Return Period of 2475 Years (Probability of Exceedance 2% in 50 Years) [Maps]; Scale 1:10 000; Almaty, Kazakhstan.
- Egorova, A.V.; Zhukovsky, A.Y. Methodology of Accounting the Environmental Factor when Conducting State Cadastral Valuation. Int. Res. J. 2020, 102.
- Otvagina, M.G. Actualization of Information and Cartographic Support of Complex Cadastral Works Using GIS Technologies. Int. J. Appl. Sci. Technol. Integral 2019, 2, 114.
- GISCloud. GIS Mapping and Benefits of Online Solutions. 2020. Available online: https://www.giscloud.com/blog/gis-mapping-and-benefits-of-onlinesolutions/#evolution (accessed on 6 March 2026).
- Kilić Pamuković, J.; Rogulj, K.; Jajac, N. Assessing the Bonitet of Cadastral Parcels for Land Reallocation in Urban Consolidation. Land 2021, 10, 9. [CrossRef]
- Bykowa, E.; Skachkova, M.; Raguzin, I.; Dyachkova, I.; Boltov, M. Automation of Negative Infrastructural Externalities Assessment Methods to Determine the Cost of Land Resources Based on the Development of a “Thin Client” Model. Sustainability 2022, 14, 9383. [CrossRef]
- Malczewski, J. GIS-based multicriteria decision analysis: A survey of the literature. Int. J. Geogr. Inf. Sci. 2006, 20, 703–726. [CrossRef]
- Boroushaki, S.; Malczewski, J. Using the fuzzy majority approach for GIS-based multicriteria group decision-making. Comput. Geosci. 2010, 36, 302–312. [CrossRef]
- Measuring land use accessibility using GIS-based fuzzy majority multi-criteria decision analysis case study: Malayer City. Int. Arch. Photogramm. Remote Sens. Spatial Inf. Sci. 2014, XL-2/W3, 255–260. [CrossRef]
Figure 1.
Cadastral blocks of the Bostandyk District of Almaty. Compiled by the authors.
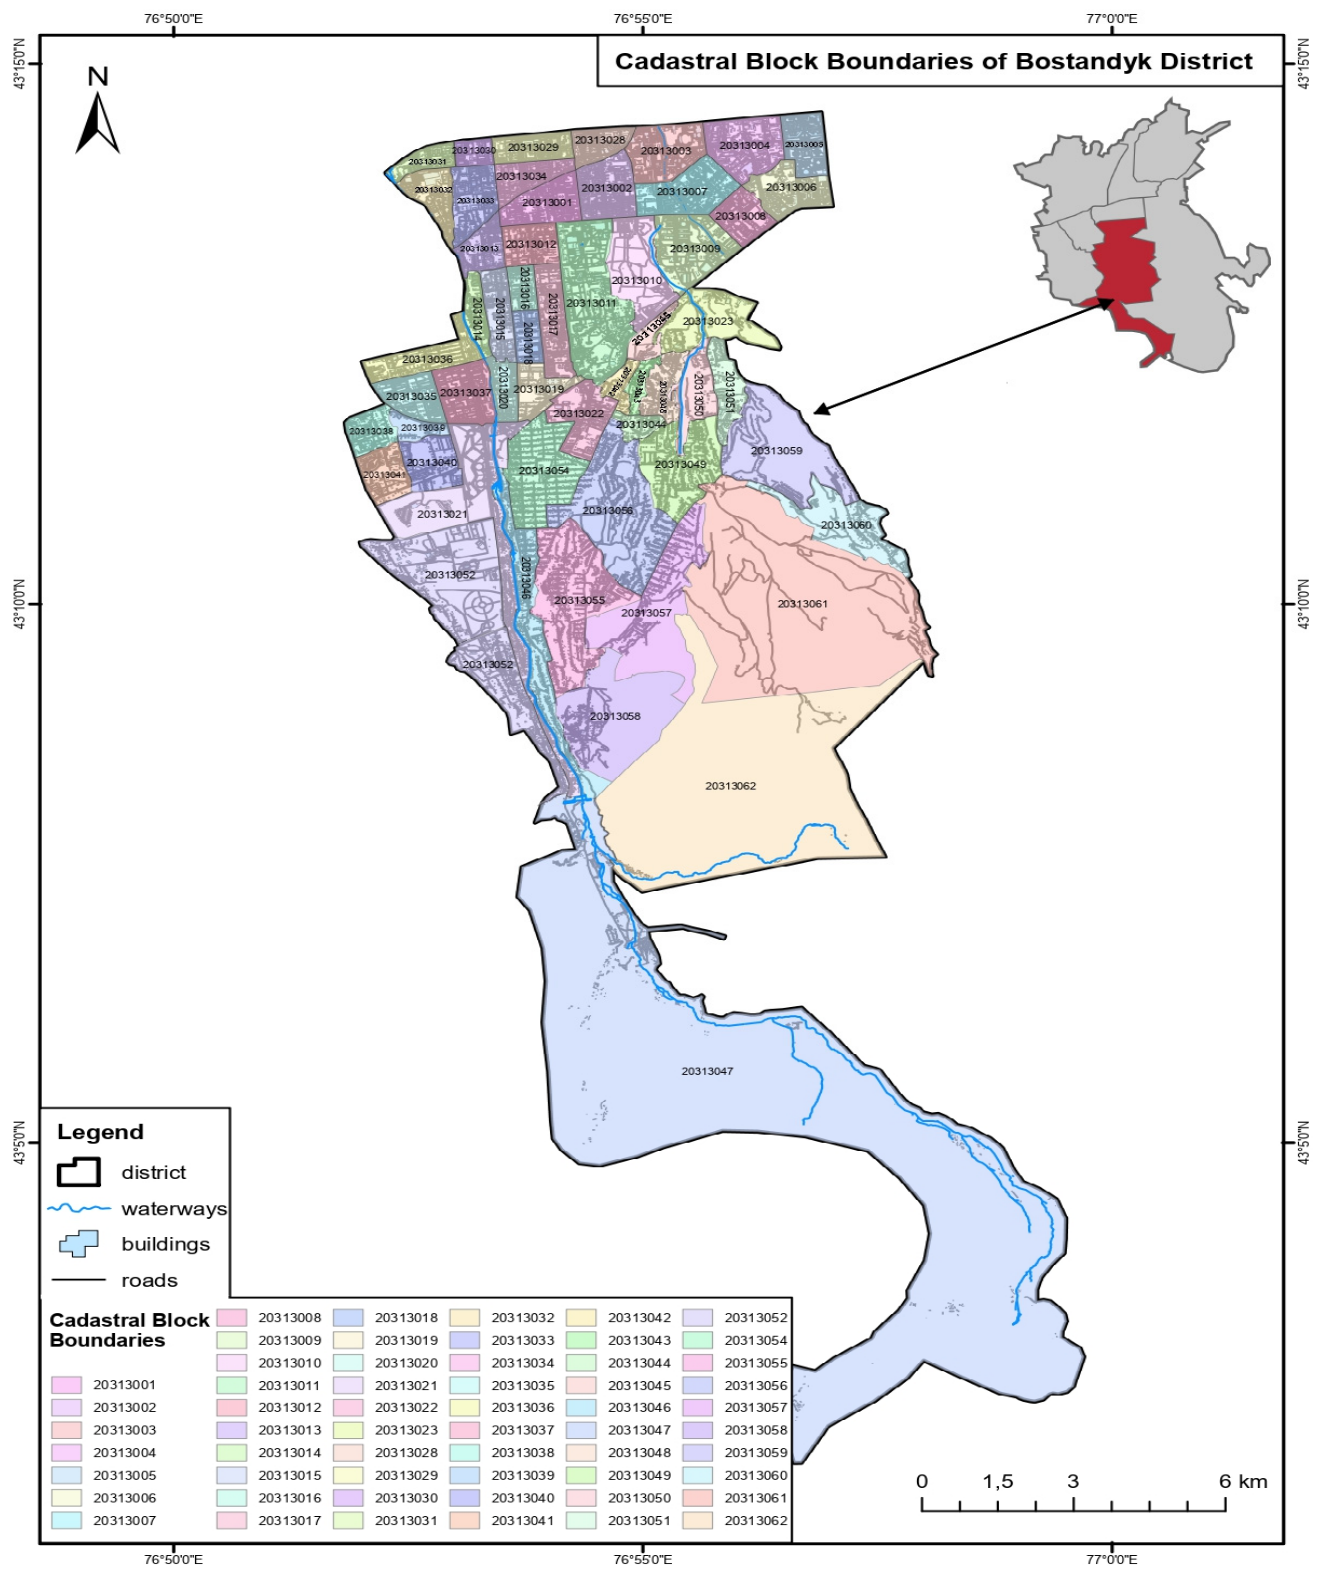
Figure 2.
Seismic map of the Bostandyk District of Almaty. (Developed by the authors based on [26]).
Figure 2.
Seismic map of the Bostandyk District of Almaty. (Developed by the authors based on [26]).
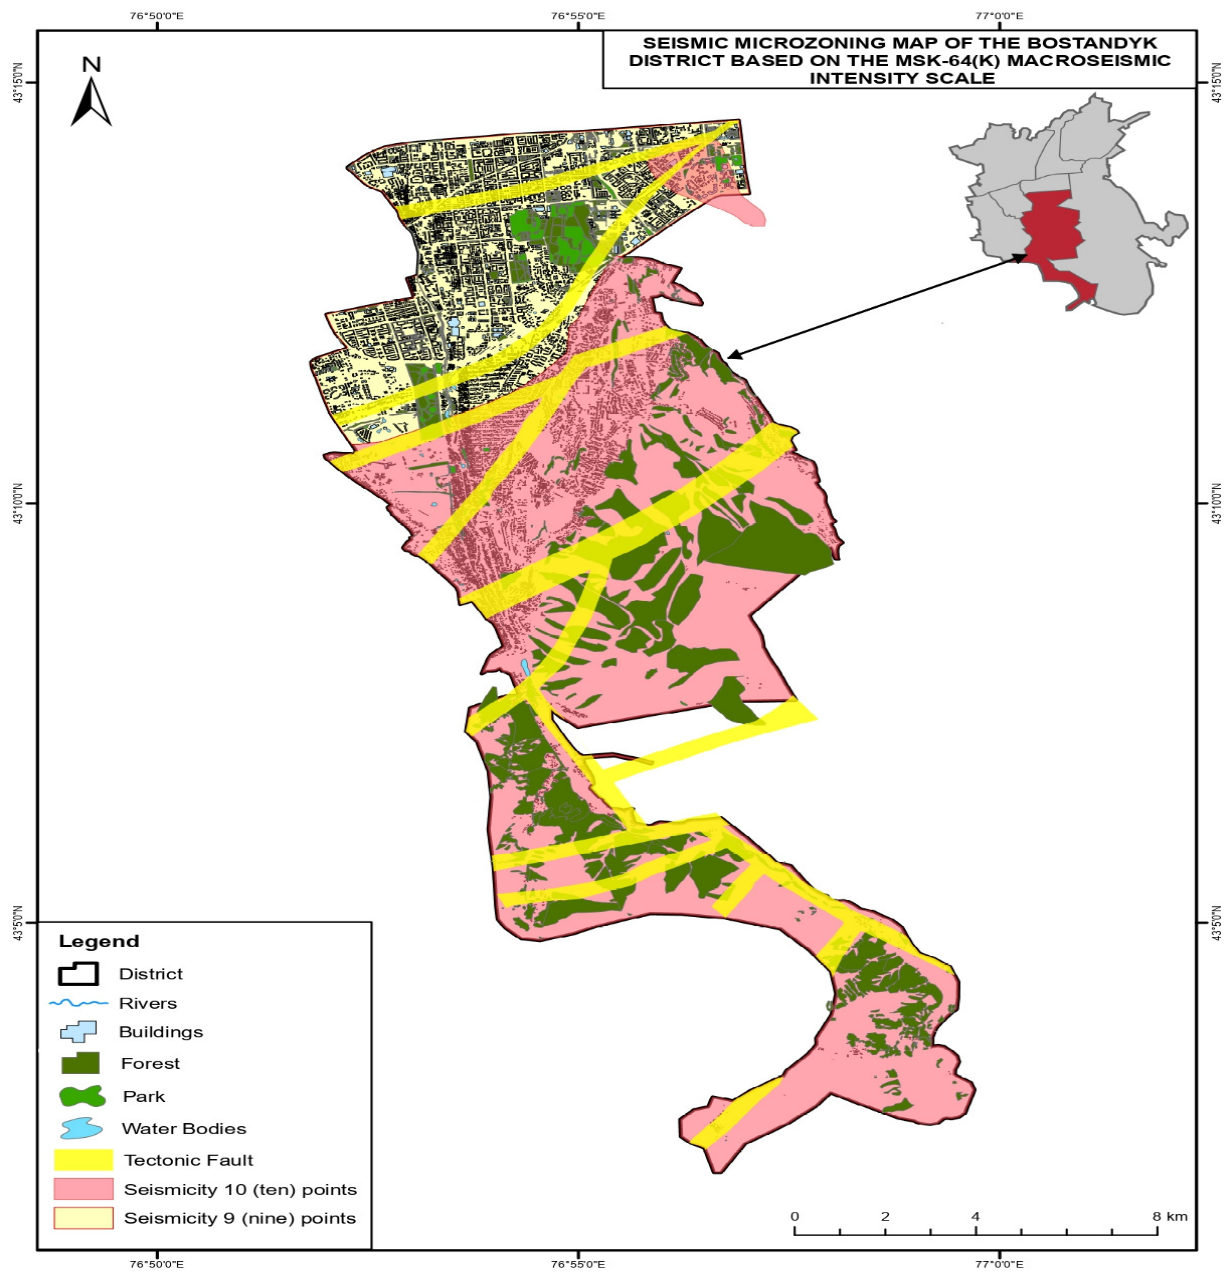
Figure 3.
Land Surface Temperature (LST) distribution map of the Bostandyk District of Almaty (2015 and 2025).
Figure 3.
Land Surface Temperature (LST) distribution map of the Bostandyk District of Almaty (2015 and 2025).
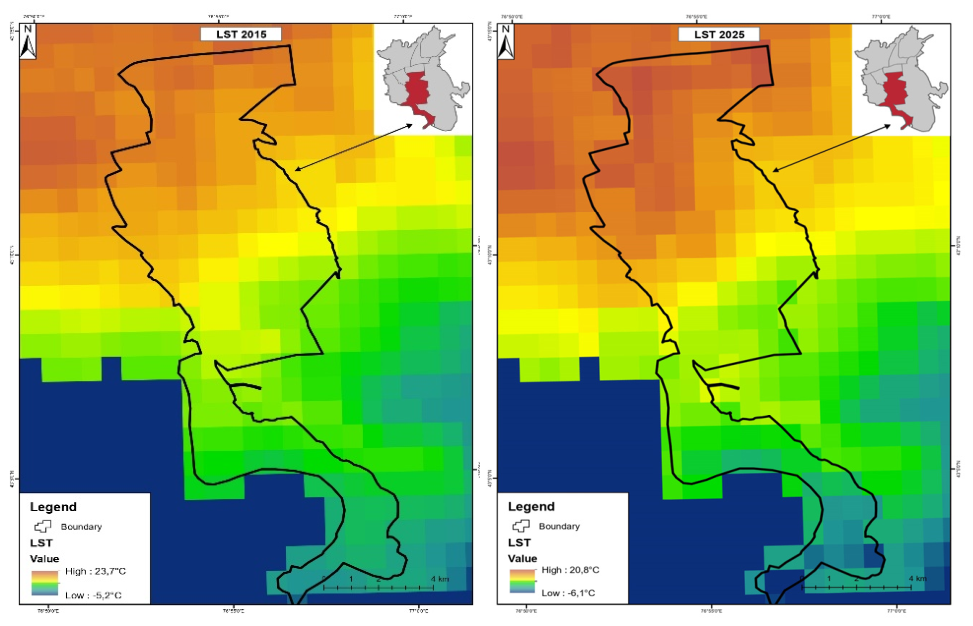
Figure 4.
Distribution map of the Normalized Difference Vegetation Index (NDVI) in the Bostandyk District of Almaty for the years 2016, 2020, and 2025.
Figure 4.
Distribution map of the Normalized Difference Vegetation Index (NDVI) in the Bostandyk District of Almaty for the years 2016, 2020, and 2025.
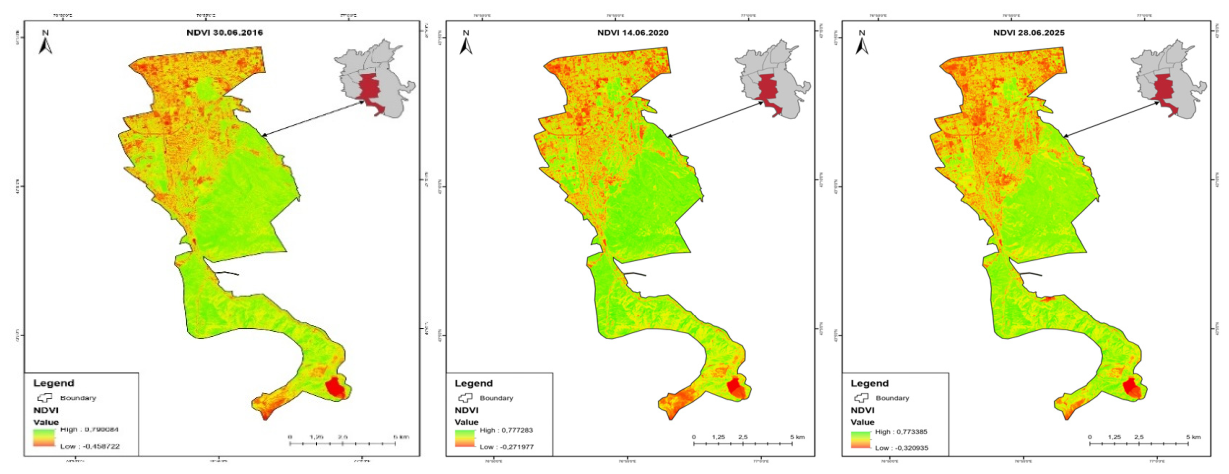
Figure 5.
Algorithm for calculating spatial factor weights using the AHP method.
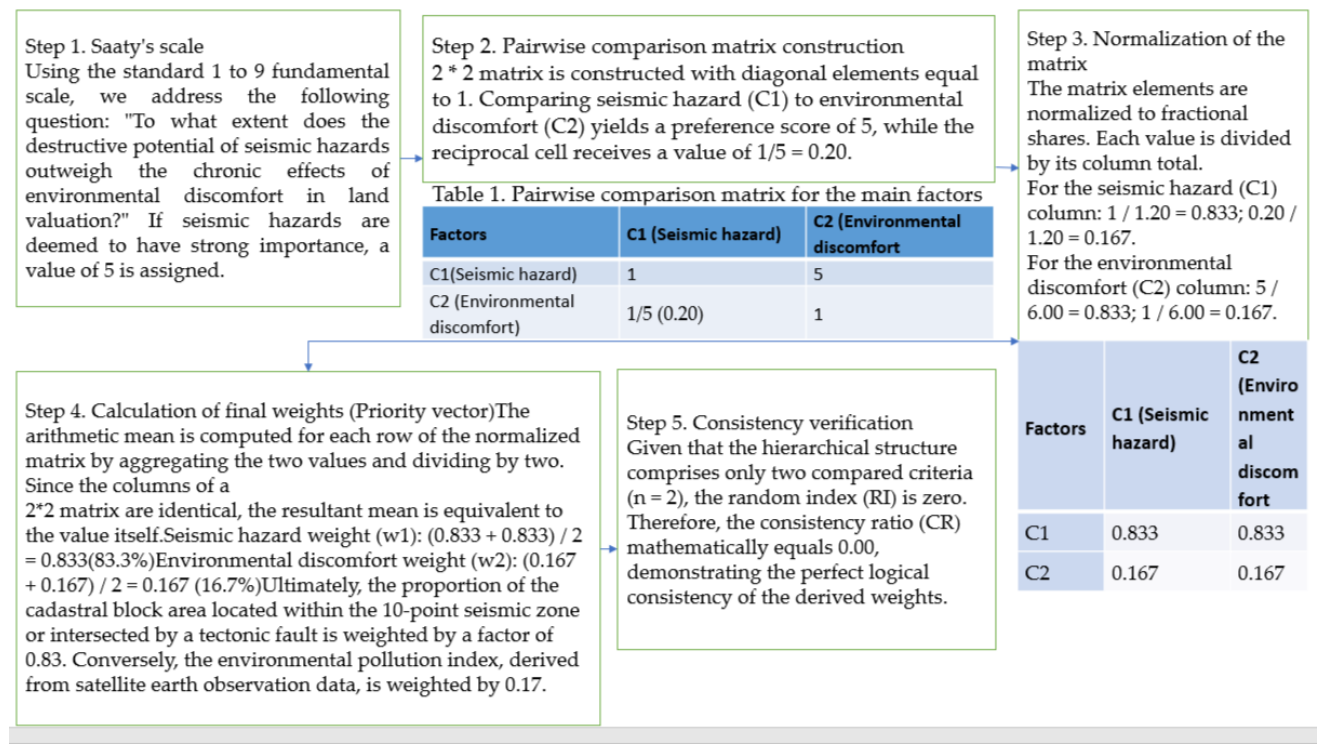
Figure 6.
Structural-logical model of integrating seismotectonic and environmental factors for cadastral value adjustment.
Figure 6.
Structural-logical model of integrating seismotectonic and environmental factors for cadastral value adjustment.
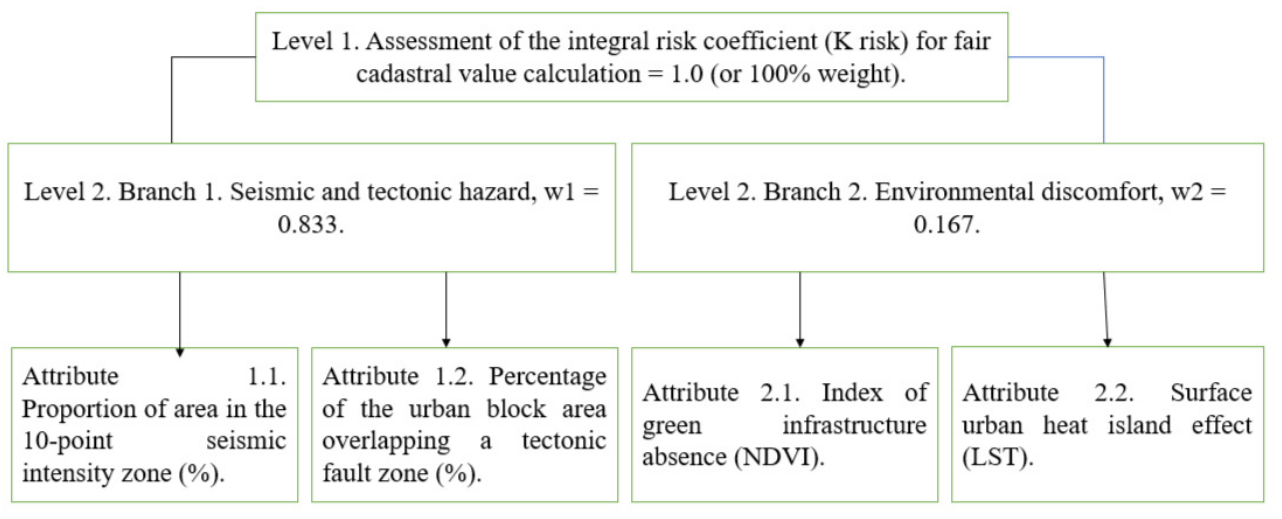

Table 1.
Summary table of reverse-calculated coefficients.
| Cadastral block | Seismic hazard function (v1) | Environmental function (v2) based on NDVI/LST data | Weighted total 0.833v1 +0.167v2 | Krisk |
| 20313003 | 0.00 (no faults) | 0.30 (moderate vegetation) | 0.000 + 0.050 | 0.05 |
| 20313034 | 0.20 (partial fault) | 0.20 (good vegetation) | 0.167 + 0.033 | 0.20 |
| 20313054 | 0.40 (significant fault) | 0.10 (foothills, high NDVI) | 0.333 + 0.017 | 0.35 |
| 20313060 | 0.40 (significant fault) | 0.70 (high debris flow hazard) | 0.333 + 0.117 | 0.45 |
Table 2.
Results of determining the new cadastral value accounting for negative externalities.
| Cadastral block number (Zone) | Seismic intensity (points) | Tectonic fault (v1) | Environmental RS data (v2) | SICVbase (tenge/m2) | Risk integral (Krisk) | SICVnew (tenge/m2) | Change (%) |
| 20313003 (Zone I) | 9 | No (v1=0.0) | Moderate (v2=0.30) | 9,300 | 0.05 | 8,835 | -5.0% |
| 20313034 (Zone II) | 9 | Yes (v1=0.20) | Comfortable (v2=0.20) | 8,246 | 0.20 | 6,597 | -20.0% |
| 20313054 (Zone II) | 10 | Yes (v1=0.40) | High quality (v2=0.10) | 8,246 | 0.35 | 5,360 | -35.0% |
| 20313060 (Zone IV) | 10 | Yes (v1=0.40) | Discomfort (v2=0.70) | 6,386 | 0.45 | 3,512 | -45.0% |
Disclaimer/Publisher’s Note: The statements, opinions and data contained in all publications are solely those of the individual author(s) and contributor(s) and not of MDPI and/or the editor(s). MDPI and/or the editor(s) disclaim responsibility for any injury to people or property resulting from any ideas, methods, instructions or products referred to in the content. |
© 2026 by the authors. Licensee MDPI, Basel, Switzerland. This article is an open access article distributed under the terms and conditions of the Creative Commons Attribution (CC BY) license (http://creativecommons.org/licenses/by/4.0/).
Copyright: This open access article is published under a Creative Commons CC BY 4.0 license, which permit the free download, distribution, and reuse, provided that the author and preprint are cited in any reuse.


