

Submitted:
14 July 2026
Posted:
15 July 2026
You are already at the latest version
Abstract
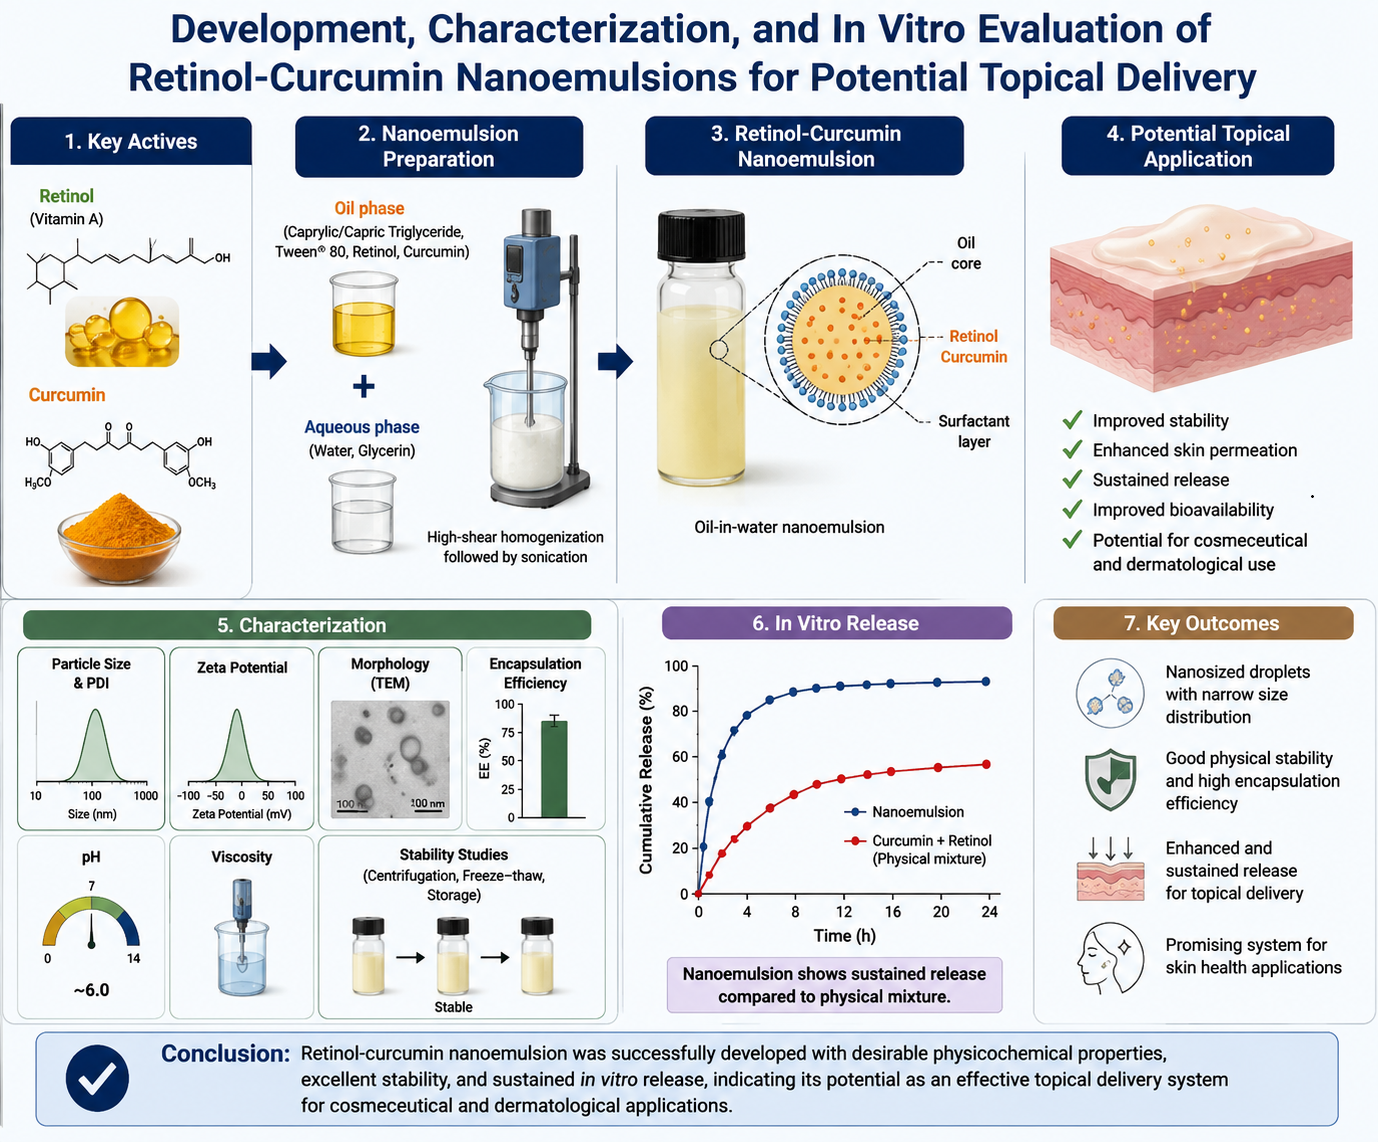
Retinol and curcumin are bioactive compounds with promising dermatological applications; however, their poor aqueous solubility, instability, and limited bioavailability may restrict their therapeutic performance. This study aimed to develop and evaluate retinol-curcumin nanoemulsions (RCNEs) as a co-delivery system with antioxidant, anti-inflammatory, antibacterial, and in vitro safety potential. Curcumin and retinol were quantified using UV-visible spectrophotometry, and the nanoemulsions were prepared by mixing the aqueous and oily phases followed by sonication. The prepared formulations were evaluated for particle size, polydispersity index (PDI), zeta potential, encapsulation efficiency, loading efficiency, and stability under different storage conditions. Antioxidant activity was determined using the DPPH radical scavenging assay, cytotoxicity was evaluated using the MTT assay on EaHY.926 endothelial cells, anti-inflammatory activity was assessed by measuring TNF-α inhibition, and antibacterial activity was tested against Staphylococcus aureus and Escherichia coli using the Kirby-Bauer well diffusion method. The optimized RCNE formulation showed an average particle size of 117 ± 0.1 nm, PDI of 0.138 ± 0.010, and zeta potential of −12.7 ± 0.2 mV. Encapsulation efficiencies were 77.0±1.1% for curcumin and 91.1±0.8% for retinol. RCNEs exhibited the strongest antioxidant activity, with an EC50 of 56.04±1.95 µg/mL compared with 90.03±3.15 µg/mL for curcumin nanoemulsions and 227.3±8.4 µg/mL for retinol nanoemulsions (p≤0.05). The RCNE formulation also produced the highest TNF-α inhibitory activity, reducing TNF-α concentration to 76.5±5.2 pg/mL and achieving 86.2±1.8% inhibition, which was significantly higher than curcumin nanoemulsions (36.6±2.4%) and retinol nanoemulsions (39.1±2.1%) (p≤0.05). No marked cytotoxicity was observed within the tested concentration range. The formulation also demonstrated antibacterial activity against both tested bacterial strains, with larger inhibition zones against E. coli. These findings suggest that RCNEs may serve as a promising in vitro platform for co-delivering retinol and curcumin in topical pharmaceutical applications.
Keywords:
curcumin
; retinol
; nanoemulsion
; antioxidant
; anti-inflammatory
; antibacterial
1. Introduction
Nanoemulsions are colloidal dispersions composed of two immiscible liquid phases stabilized by surfactants or co-surfactants, typically producing droplets in the nanometer range. Their small droplet size, high surface area, and kinetic stability make them useful carriers for hydrophobic drugs and bioactive compounds [1]. Nanoemulsion-based systems have been widely investigated in pharmaceutical and cosmetic research because they can improve solubility, protect unstable active ingredients, enhance permeability, and increase the apparent bioavailability of poorly water-soluble compounds [2]. These properties are particularly important for topical and cutaneous drug delivery, where the skin barrier limits the penetration of many active compounds [3].
Retinol, a vitamin A derivative, is widely used in dermatological and cosmeceutical formulations due to its ability to promote epidermal renewal, regulate keratinocyte differentiation, stimulate collagen-related processes, and improve the appearance of photoaged skin [4]. Retinol has also been used in acne management because of its effect on cell turnover and follicular obstruction [5]. However, its therapeutic and cosmetic application can be limited by chemical instability, irritation potential, photosensitivity, and poor compatibility with some formulation systems [6]. Therefore, suitable delivery systems are required to improve its stability and enhance its performance while reducing undesirable effects.
Curcumin, the major polyphenolic compound derived from Curcuma longa, has attracted considerable interest because of its antioxidant, anti-inflammatory, antimicrobial, and wound-healing-related activities [7]. Its biological activity is associated with modulation of oxidative stress, inflammatory mediators, and microbial growth pathways [8]. These properties make curcumin a relevant candidate for skin-related applications, including inflammatory conditions, microbial skin infections, and oxidative stress-associated skin damage [9]. Nevertheless, curcumin has poor aqueous solubility, limited stability, rapid degradation, and low bioavailability, which restrict its direct use in conventional formulations [10]. Nanoemulsion-based delivery may overcome some of these drawbacks by improving curcumin dispersion, protecting it within the oily phase, and facilitating contact with biological membranes [11].
The combination of retinol and curcumin may provide complementary benefits for topical pharmaceutical applications. Retinol contributes to skin renewal and remodeling, while curcumin may provide antioxidant, anti-inflammatory, and antimicrobial support. In addition, the anti-inflammatory properties of curcumin may help counterbalance irritation commonly associated with retinoid-based formulations. Co-delivery of both compounds in a nanoemulsion could therefore provide a rational strategy to improve solubility, stability, and biological performance while allowing both compounds to act within the same delivery platform. Although nanoemulsions containing individual natural compounds or single active pharmaceutical ingredients have been widely investigated, limited research has focused on the co-loading of retinol and curcumin in one nanoemulsion system and the simultaneous evaluation of its antioxidant, anti-inflammatory, antibacterial, and safety profiles.
Therefore, this study aimed to prepare retinol-curcumin nanoemulsions and evaluate their physicochemical characteristics, encapsulation and loading efficiency, stability, antioxidant activity, cytotoxicity, TNF-α inhibitory activity, and antibacterial activity against Gram-positive and Gram-negative bacterial strains. The study was designed as an in vitro proof-of-concept investigation to assess the potential of RCNEs as a co-delivery platform for future topical pharmaceutical development.
2. Materials and Methods
2.1. Materials
Curcumin (CUR) was obtained from ICT, Japan, and retinol (RTN; purity 99%) was obtained from Aktin Chemicals, China. Tween 80 was purchased from Sigma-Aldrich, Sweden, while propylene glycol, methanol HPLC grade, and ethanol HPLC grade were obtained from Merck, Germany. Dimethyl sulfoxide (DMSO) and trypan blue dye were supplied by GCC, UK. Coconut oil, sunflower oil, jojoba oil, and ceramide were obtained from Ayuroma Centre, India. 2,2-Diphenyl-1-picrylhydrazyl radical (DPPH; purity 98%) was obtained from Sisco Research Laboratories Pvt. Ltd., India. Dulbecco’s Modified Eagle Medium (DMEM) was obtained from Dulbecco, Italy, and phosphate-buffered saline (PBS; pH 7.4, high glucose) and trypsin were supplied by EuroClone, Italy. MTT reagent powder was obtained from Promega, USA. Human tumor necrosis factor alpha (TNF-α) ELISA kit was purchased from Genochem World, China. The EaHY.926 normal endothelial cell line, Staphylococcus aureus, and Escherichia coli were obtained from ATCC, USA. Mueller-Hinton broth was obtained from Oxoid Ltd., UK. All chemicals and reagents were used as received.
2.2. Instruments
A UV-visible spectrophotometer (Shimadzu, Japan) was used for analytical quantification of CUR and RTN and for DPPH measurements. A Zetasizer Nano-ZS instrument (Malvern, UK) was used to measure droplet size, polydispersity index (PDI), and zeta potential. A probe sonicator (Bandelin, Germany) was used for nanoemulsion preparation. A hot plate magnetic stirrer (Erweka, Germany), vortex mixer (Witeg, Korea), centrifuge (Centurion Scientific Ltd., UK), universal oven (Memmert, Germany), refrigerator (Esco, Singapore), and pH meter (Jenway, UK) were used during formulation and stability testing. Cell culture and biological assays were performed using a CO2 incubator (Thermo Scientific, Germany), laminar flow hood (Thermo Scientific, Germany), automated cell counter (Accuris Instruments, USA), 96-well plates (EuroClone, Italy), and ELISA microplate reader (BioTek, USA).
2.3. UV-Visible Spectrophotometric Analysis of Curcumin and Retinol
Stock solutions of CUR and RTN were prepared at a concentration of 1 mg/mL. CUR was dissolved in ethanol, while RTN was dissolved in DMSO. Serial dilutions were prepared to obtain concentrations of 500, 250, 125, and 62.5 µg/mL. The absorbance of CUR and RTN was measured using a UV-visible spectrophotometer at their respective maximum absorption wavelengths. Preliminary scanning showed maximum absorbance for CUR at 412 nm and for RTN at 331 nm. Calibration curves were constructed by plotting absorbance against concentration, and linear regression was used to determine the equation, slope, intercept, and correlation coefficient. Blank samples containing formulation components without the corresponding active compound were used to assess selectivity.
2.4. Preparation of Retinol-Curcumin Nanoemulsions
Retinol-curcumin nanoemulsions (RCNEs) were prepared using a high-energy ultrasonication method with slight modification.¹² The aqueous phase was prepared by mixing 1 mL propylene glycol, 3 mL Tween 80, and 16 mL distilled water, followed by stirring using a magnetic stirrer for 10 min. The oily phase was prepared by dissolving predetermined amounts of CUR and RTN in 5 mL of selected oil phase, including sunflower oil, jojoba oil, or coconut oil. In some formulations, ceramide was added to the oily phase.
The oily phase was heated using a hot plate magnetic stirrer, and the aqueous phase was added dropwise under continuous stirring at 700 rpm for 15 min. For selected formulations, stirring was continued for 1 h at 45°C to improve solubilization and emulsification. The resulting coarse emulsion was then sonicated using a probe sonicator for 10 min to reduce droplet size and obtain the nanoemulsion. The prepared formulations were visually inspected and further evaluated for particle size, PDI, zeta potential, pH, precipitation tendency, encapsulation efficiency, and loading efficiency.

Table 1.
Composition of the prepared retinol-curcumin nanoemulsion formulations.
| Formula code | CUR amount (mg) | RTN amount (mg) | Oil phase | Additives | Aqueous phase | Final volume |
| F1 | 10 | 10 | Sunflower oil | - | Propylene glycol/Tween 80/water | 25 mL |
| F2 | 10 | 10 | Jojoba oil | - | Propylene glycol/Tween 80/water | |
| F3 | 30 | 30 | Sunflower oil | - | Propylene glycol/Tween 80/water | |
| F4 | 30 | 30 | Sunflower oil | Ceramide | Propylene glycol/Tween 80/water | 27 mL |
| F5 | 10 | 10 | Sunflower oil | Ceramide | Propylene glycol/Tween 80/water | |
| F6 | 10 | 10 | Sunflower oil | Ceramide + extended stirring/heating | Propylene glycol/Tween 80/water | |
| F7 | 10 | 10 | Coconut oil | Ceramide + extended stirring/heating | Propylene glycol/Tween 80/water |
2.5. Determination of Encapsulation Efficiency and Loading Efficiency
Encapsulation efficiency (EE%) and loading efficiency (LE%) of CUR and RTN were determined using the developed UV-visible spectrophotometric method. The free, non-encapsulated drug was separated from the nanoemulsion droplets using dialysis bags with a molecular weight cut-off of 7000 Da. Samples were washed three times with PBS, using a total washing volume of 5 mL. The washing solution was collected and analyzed spectrophotometrically to determine the amount of free CUR and RTN. The amount of encapsulated drug was calculated by subtracting the amount of free drug from the total drug initially added to the formulation [13].
The nanoemulsion droplets retained in the dialysis bag were collected, filtered, and dried in a universal oven at 40°C to determine the carrier weight. EE% and LE% were calculated using the following equations:
2.6. Particle Size, Polydispersity Index, and Zeta Potential Measurement
The average droplet size, PDI, and zeta potential of the prepared formulations were measured using a Malvern Zetasizer Nano-ZS. Each formulation was diluted with deionized water at a ratio of 1:999 to avoid multiple scattering and to reduce interference with droplet surface charge. The diluted samples were vortexed for 2 min before measurement to ensure homogeneous dispersion. Samples were allowed to stand in the Zetasizer cuvette for 2 min before each measurement. All measurements were performed at room temperature, and the formulations were diluted until an acceptable attenuator value was obtained [14].
2.7. Selection of the Optimized Formulation
The optimized RCNE formulation was selected based on physicochemical characteristics and physical stability. The selection criteria included small droplet size, low PDI, acceptable zeta potential, high encapsulation efficiency, high loading efficiency, and absence of visible precipitation after centrifugation. Formulations prepared using sunflower oil and jojoba oil showed precipitation after centrifugation and were excluded from further biological evaluation. The coconut oil-based formulation was selected for stability testing and biological activity evaluation because it showed better physical stability and encapsulation performance.
2.8. Stability Study
The optimized RCNE formulation was divided into four samples and stored under different conditions: 40°C in a universal oven, 4°C in a refrigerator, alternating oven-refrigerator cycles every 24 h, and room temperature at 25°C. The formulations were evaluated at predetermined intervals for particle size, PDI, zeta potential, and visual appearance. The aim of this test was to determine the most suitable storage condition and to assess whether the optimized formulation maintained its physicochemical characteristics over time.
Table 2.
Storage conditions used for stability study.
| Sample code | Storage condition |
| S1 | 40°C, universal oven |
| S2 | 4°C, refrigerator |
| S3 | Alternating 40°C/4°C cycles every 24 h |
| S4 | 25°C, room temperature |
2.9. DPPH Free Radical Scavenging Assay
The antioxidant activity of the prepared nanoemulsions was evaluated using the DPPH free radical scavenging assay [15]. Four formulations were evaluated: curcumin nanoemulsions (CNEs), retinol nanoemulsions (RNEs), retinol-curcumin nanoemulsions (RCNEs), and blank nanoemulsions (NEs). A freshly prepared 0.1 mM DPPH solution in methanol was kept in the dark at room temperature for 30 min before use. Then, 1 mL of each nanoemulsion formulation at different concentrations was mixed with 3 mL of DPPH solution. The mixture was vortexed and incubated in the dark at room temperature for 30 min. Absorbance was measured at 517 nm using a UV-visible spectrophotometer. Methanol was used as the blank, and DPPH solution without nanoemulsion was used as the control.
All measurements were performed in triplicate. The percentage of DPPH radical scavenging activity was calculated using the following equation:
2.10. Cytotoxicity Study Using MTT Assay
The cytotoxicity of CNEs, RNEs, RCNEs, and blank NEs was evaluated using the MTT assay on the EaHY.926 normal endothelial cell line [16]. Cells were sub-cultured and seeded into 96-well plates using DMEM, followed by incubation in a CO2 incubator under standard cell culture conditions. Before treatment, cell count and viability were assessed using an automated cell counter and trypan blue dye to ensure uniform seeding density. The cells were treated with different concentrations of each nanoemulsion formulation ranging from 0.1 to 1 mg/mL. After treatment, MTT reagent was added, and the absorbance was measured using an ELISA microplate reader. The assay was used to assess cell viability and determine whether the prepared nanoemulsions showed cytotoxic effects within the tested concentration range.
2.11. TNF-α Inhibitory Activity
The anti-inflammatory activity of CNEs, RNEs, RCNEs, and blank NEs was evaluated by measuring TNF-α levels using a human TNF-α ELISA kit based on a sandwich enzyme immunoassay technique [17]. EaHY.926 cells were treated with non-toxic concentrations of each nanoemulsion formulation based on the MTT assay results. After treatment, samples were centrifuged at 1000 × g for 20 min, and the supernatants were either used immediately or stored in aliquots at -20°C to avoid repeated freeze-thaw cycles.
The ELISA kit reagents were allowed to reach room temperature before use. Then, 100 µL of diluted standards ranging from 1000 to 15.63 pg/mL or sample was added to each well and incubated at 37°C for 80 min. The wells were washed three times with 200 µL wash buffer, followed by the addition of 100 µL biotinylated antibody working solution and incubation at 37°C for 50 min. After washing, 100 µL streptavidin-HRP working solution was added and incubated at 37°C for 50 min. The wells were washed again, and 90 µL TMB substrate solution was added and incubated in the dark at 37°C for 20 min. Finally, 50 µL stop solution was added to each well, and the optical density was measured immediately at 450 nm using an ELISA microplate reader. All measurements were performed in triplicate.
2.12. Antibacterial Activity
The antibacterial activity of RCNEs, free CUR, free RTN, and the CUR-RTN physical mixture was evaluated against Staphylococcus aureus as a Gram-positive bacterium and Escherichia coli as a Gram-negative bacterium using the Kirby-Bauer well diffusion method [18]. Bacterial cultures were propagated in Mueller-Hinton broth and incubated overnight. Mueller-Hinton agar plates were prepared and wells were formed after solidification. The surface of each agar plate was uniformly inoculated with bacterial suspension adjusted to the 0.5 McFarland standard. The tested samples were introduced into the wells, and the plates were incubated under suitable conditions. Antibacterial activity was evaluated by measuring the diameter of the inhibition zone around each well.
2.13. Statistical Analysis
All experiments were performed in triplicate unless otherwise stated. Data were expressed as mean ± standard deviation. Statistical analyses were performed using GraphPad’s (Prism 11.0.2) software. Differences among groups was analyzed using one-way analysis of variance (ANOVA), followed by a suitable post-hoc test. A p-value of less than 0.05 should be considered statistically significant.
3. Results and Discussion
3.1. UV-Visible Spectrophotometric Analysis of Curcumin and Retinol
The developed UV-visible spectrophotometric method showed well-defined absorption peaks for CUR and RTN at 412 nm and 331 nm, respectively. The calibration curves showed a linear relationship between concentration and absorbance over the tested concentration range of 0.0625–1 mg/mL. The regression equation for CUR was y = 1.4084x + 0.0363 with a correlation coefficient of R² = 0.9923, while the regression equation for RTN was y = 1.2542x + 0.0100 with R² = 0.9954, as shown in Figure 1. These results indicated acceptable linearity for quantitative analysis of both active compounds within the selected range.
The blank sample containing RTN and other formulation components but excluding CUR showed no absorbance at 412 nm. Similarly, the blank sample containing CUR and formulation components but excluding RTN showed no absorbance at 331 nm. This confirmed the selectivity of the method for the simultaneous formulation work, since CUR and RTN could be detected at their selected wavelengths without evident interference from the other compound or excipients. A selective and linear UV method is important in nanoformulation studies because it directly affects the accuracy of encapsulation efficiency, loading efficiency, and release-related calculations [19].
3.2. Encapsulation Efficiency and Loading Efficiency
The encapsulation efficiency and loading efficiency of CUR and RTN varied among the seven prepared formulations, as shown in Table 3. CUR encapsulation efficiency ranged from 22.2±1.2% to 77.0±1.1%, while RTN encapsulation efficiency ranged from 23.8±2.1% to 91.1±0.8%. Formula 7, which contained coconut oil as the oil phase with ceramide and extended stirring/heating, showed the highest encapsulation efficiency for both CUR and RTN, reaching 77.0±1.1% and 91.1±0.8%, respectively. Formula 7 also showed the highest loading efficiency for CUR, with a value of 21.1±0.9%, and the second-highest loading efficiency for RTN, with a value of 24.9±1.1%.
The encapsulation efficiencies of CUR and RTN in F7 were significantly higher than those of the other formulations (p ≤ 0.05), confirming the superior ability of the coconut oil-based formulation to co-encapsulate both active compounds.
The higher encapsulation efficiency of Formula 7 may be related to the compatibility of coconut oil with the lipophilic structures of both CUR and RTN. CUR and RTN are poorly water-soluble compounds, and their incorporation into the dispersed oil phase is strongly influenced by oil type, surfactant distribution, and the capacity of the oil phase to solubilize the actives.20 The use of coconut oil may have provided a more suitable lipophilic microenvironment for the simultaneous incorporation of both compounds. The addition of ceramide may also have contributed to improved structural organization within the formulation, while extended stirring and heating may have enhanced solubilization before ultrasonication.
Although Formula 5 showed the highest RTN loading efficiency, its CUR encapsulation efficiency was low. Since the aim of this study was to co-deliver both CUR and RTN in a single nanoemulsion system, Formula 7 was considered the most suitable formulation based on the combined EE and LE results. A balanced encapsulation of both active compounds is more relevant for co-delivery than optimizing one active compound alone.
3.3. Preparation and Physical Screening of Retinol-Curcumin Nanoemulsions
Seven RCNE formulations were prepared by varying the type of oil phase, the amount of active compounds, the presence of ceramide, and the stirring/heating condition. After preparation and centrifugation, formulations prepared using sunflower oil and jojoba oil showed visible precipitation, while the formulation prepared using coconut oil did not show precipitation and maintained better physical appearance. Therefore, Formula 7 was selected as the optimized RCNE formulation for further characterization, stability testing, and biological evaluation.
The precipitation observed in sunflower oil- and jojoba oil-based formulations may be attributed to insufficient solubilization of CUR in the oil phase or incompatibility between the active compounds and the selected oil system. Curcumin is highly hydrophobic but has limited solubility in many oils, and precipitation may occur when the oil phase cannot maintain the compound in a dissolved or dispersed state.21 The absence of precipitation in the coconut oil-based formula suggests better compatibility between the oil phase and the co-loaded compounds. This observation supports the selection of coconut oil as the preferred carrier oil for the final RCNE formulation.
3.4. Particle Size, PDI, and Zeta Potential
The particle size, PDI, and zeta potential of the prepared formulations are presented in Table 4. The particle size of the prepared RCNEs ranged from 117 ± 0.1 to 216 ± 2 nm. All formulations were below 200 nm except Formula 2, which had a particle size of 216 ± 2 nm. Formula 7 showed the smallest droplet size, 117 ± 0.1 nm, followed by Formula 6 with 120 ± 0.8 nm. The PDI values ranged from 0.138 ± 0.01 to 0.184 ± 0.01, indicating narrow droplet size distribution and good homogeneity among the prepared formulations. Formula 7 showed the lowest PDI value of 0.138 ± 0.01.
The optimized formulation had a particle size suitable for nanoemulsion-based topical delivery. Smaller droplets provide a larger surface area, which may improve contact between the formulation and biological membranes and may also support better dispersion of hydrophobic active compounds [22]. The low PDI value of Formula 7 suggests that the formulation had a relatively uniform droplet size distribution. In nanocarrier systems, lower PDI values are generally associated with more homogeneous systems and lower probability of droplet aggregation [23].
The zeta potential of the prepared formulations ranged from −7.9 ± 0.8 to −17.5 ± 0.8 mV. Formula 7 showed a zeta potential of −12.7 ± 0.2 mV. Although this value does not indicate strong electrostatic stabilization, the negative surface charge may still contribute to repulsion between droplets. In systems stabilized with non-ionic surfactants such as Tween 80, low or moderate zeta potential values are commonly observed because steric stabilization rather than electrostatic repulsion may play a major role in maintaining dispersion stability.24 Therefore, the stability of the optimized formulation should be interpreted together with PDI and storage stability results rather than zeta potential alone.
3.5. Stability Study
The optimized RCNE formulation was stored under four different storage conditions for four weeks: oven at 40°C, refrigerator at 4°C, room temperature at 25°C, and alternating oven/refrigerator cycles every 24 h. The particle size, zeta potential, and PDI were monitored throughout the study period, as shown in Table 5.
The formulation stored at 4°C showed the best stability in terms of particle size, with only a slight change from 117 nm in week 1 to 119 nm in week 4. The formulation subjected to alternating oven/refrigerator cycles also showed acceptable stability, with particle size increasing from 132 to 144 nm over four weeks. In contrast, the formulation stored at 40°C showed a marked increase in particle size from 175 to 279 nm, while the room-temperature sample increased from 124 to 192 nm by week 4.
The increase in droplet size under elevated temperature may be related to increased kinetic energy and enhanced droplet collision frequency, which can promote coalescence, flocculation, or Ostwald ripening [25]. The room-temperature sample also showed signs of physical instability by week 4, which may be related to temperature fluctuation during the storage period. The zeta potential of the refrigerated sample remained relatively stable, changing from −12.7 to −12.2 mV over four weeks. The PDI values remained low for all storage conditions, indicating that the droplet size distribution did not become highly heterogeneous during the study period. Overall, refrigeration at 4°C was considered the most suitable storage condition for maintaining the physicochemical stability of the optimized RCNE formulation.
3.6. DPPH Radical Scavenging Activity
The antioxidant activity of CNEs, RNEs, RCNEs, and blank NEs was evaluated using the DPPH radical scavenging assay. The blank nanoemulsion did not show detectable free radical scavenging activity under the tested conditions. CNEs showed an EC50 of 90.03±3.15 µg/mL, while RNEs showed an EC50 of 227.3±8.4 µg/mL. The co-loaded RCNEs showed the strongest antioxidant activity, with an EC50 of 56.04±1.95 µg/mL, as shown in Table 6.
The antioxidant activity of RCNEs was significantly higher than that of CNEs and RNEs at the tested concentrations, and the EC50 value of RCNEs was significantly lower than those of the single-loaded nanoemulsions (p ≤ 0.05).
The stronger antioxidant effect of RCNEs compared with single-loaded nanoemulsions may be attributed to the combined antioxidant contribution of CUR and RTN. CUR is known for its phenolic structure and ability to donate hydrogen atoms or electrons to neutralize free radicals, while RTN can contribute to antioxidant defense through retinoid-related mechanisms [26,27]. The lower EC50 of the co-loaded formulation indicates that less RCNE was required to achieve 50% DPPH scavenging compared with CNEs or RNEs. This result supports the rationale of co-loading CUR and RTN in one nanoemulsion platform, as the combined formulation showed higher antioxidant capacity than each single-loaded system.
3.7. Cytotoxicity and TNF-α Inhibitory Activity
The cytotoxicity of CNEs, RNEs, RCNEs, and blank NEs was evaluated using the MTT assay on EaHY.926 endothelial cells. No measurable IC50 value was observed within the tested concentration range of 0.1–1 mg/mL, suggesting that the prepared nanoemulsion formulations did not show marked cytotoxicity under the tested in vitro conditions. Therefore, 0.1 mg/mL was selected for the anti-inflammatory assay, representing a concentration 10-fold lower than the highest tested safe concentration.
The anti-inflammatory activity was evaluated by measuring TNF-α levels in treated and untreated cell samples. The untreated cells showed a TNF-α concentration of 554.2 pg/mL. Blank NEs caused only 3.1% inhibition, indicating that the blank carrier alone had minimal effect on TNF-α reduction. CNEs and RNEs reduced TNF-α levels by 36.6% and 39.1%, respectively. RCNEs showed the strongest TNF-α inhibitory activity, reducing TNF-α levels by 86.2%, as shown in Table 7 and Figure 2.
The TNF-α inhibitory activity of RCNEs was significantly higher than that of CNEs, RNEs, blank NEs, and untreated cells (p ≤ 0.05).
The marked reduction in TNF-α after treatment with RCNEs suggests that co-delivery of CUR and RTN may produce stronger anti-inflammatory activity than individual nanoemulsions. CUR has been widely associated with inhibition of inflammatory mediators, including TNF-α and related signaling pathways [28]. RTN and related retinoids may also affect inflammatory responses through modulation of cell differentiation, immune response, and epithelial regulation [29]. The limited effect of blank NEs supports that the observed TNF-α inhibition was mainly related to the encapsulated active compounds rather than the carrier system alone. This finding strengthens the biological relevance of RCNEs as a dual-active nanoemulsion formulation.
However, the TNF-α calibration curve showed moderate linearity compared with the UV-visible calibration curves. Therefore, the anti-inflammatory data should be presented as preliminary in vitro evidence and interpreted cautiously. Repeating the ELISA assay with additional replicates and a wider validated standard range would strengthen the reliability of this result before submission.
3.8. Antibacterial Activity
The antibacterial activity of the optimized RCNEs was evaluated against S. aureus and E. coli and compared with free CUR, free RTN, and the physical mixture of CUR and RTN. The optimized RCNE formulation showed larger inhibition zones than the free compounds and the physical mixture. The inhibition zone of RCNEs against E. coli was 4.5 cm, while the inhibition zone against S. aureus was 3.0 cm, as shown in Figure 3. The physical mixture of CUR and RTN showed smaller inhibition zones, with 0.9 cm against E. coli and 1.1 cm against S. aureus.
The stronger antibacterial activity of RCNEs compared with the physical mixture may be related to improved dispersion of CUR and RTN in the nanoemulsion system, enhanced contact with bacterial cells, and increased apparent availability of the active compounds. Nano-sized droplets can increase the interfacial contact area between the formulation and microbial membranes, which may improve the interaction of hydrophobic bioactive compounds with bacterial cell surfaces [30].
Interestingly, RCNEs showed a larger inhibition zone against E. coli than S. aureus. This finding differs from the common expectation that Gram-negative bacteria are generally more resistant to many hydrophobic compounds because of their outer lipopolysaccharide layer [31]. The enhanced activity against E. coli may suggest that the nanoemulsion system improved interaction with or penetration through the Gram-negative outer membrane. In contrast, the physical mixture showed slightly higher activity against S. aureus than E. coli, which supports the idea that nanoemulsification changed the biological performance of the active compounds. Further studies using minimum inhibitory concentration, minimum bactericidal concentration, and time-kill assays are recommended to confirm this antibacterial effect quantitatively [32].
Overall, the physicochemical and biological results indicate that the coconut oil-based RCNE formulation was the most suitable formulation among those prepared in this study. Formula 7 combined small droplet size, low PDI, acceptable physical stability under refrigeration, high encapsulation efficiency for both CUR and RTN, strong antioxidant activity, marked TNF-α inhibition, and antibacterial activity against both tested bacterial strains. These findings support the potential of RCNEs as an in vitro co-delivery platform for topical pharmaceutical applications. Nevertheless, the study remains limited to in vitro testing. Future work should include ex vivo skin permeation, skin irritation testing, long-term stability testing, and in vivo evaluation to confirm topical performance and therapeutic relevance.
4. Conclusion
Retinol-curcumin nanoemulsions were successfully prepared using a high-energy ultrasonication method. Among the prepared formulations, the coconut oil-based formulation containing ceramide showed the most suitable physicochemical characteristics, with small droplet size, low PDI, acceptable zeta potential, and high encapsulation efficiency for both CUR and RTN. The optimized RCNE formulation also showed better stability under refrigerated conditions compared with room temperature and elevated temperature storage. In vitro biological evaluation demonstrated that the co-loaded formulation had stronger DPPH radical scavenging activity and TNF-α inhibitory activity than single-loaded nanoemulsions. RCNEs also exhibited antibacterial activity against both S. aureus and E. coli, with higher activity against E. coli. These findings suggest that RCNEs may be a promising co-delivery system for potential topical pharmaceutical applications. However, further ex vivo skin permeation, skin irritation, long-term stability, and in vivo studies are required to confirm their therapeutic applicability.
9. Ethics Approval
This study did not involve human participants or animal experiments. The in vitro experiments were conducted using commercially obtained cell lines and bacterial strains.
Funding
This research received no external funding.
6. Author Contribution
H.H. performed the experimental work, collected the data, analyzed the results, and prepared the original thesis draft. N.S. supervised the research design, formulation development, data interpretation, and manuscript revision. B.A. contributed to experimental planning, methodological guidance, and critical revision of the manuscript. All authors reviewed and approved the final version of the manuscript.
5. Acknowledgements
The authors would like to thank the Faculty of Pharmacy, Al-Ahliyya Amman University, for providing laboratory facilities and academic support during this work. The authors also extend their appreciation to the supervisors and technical staff who contributed to the completion of the experimental study.
7. Conflict of Interest
The authors declare no conflict of interest.
References
- Souto, E.B.; Cano, A.; Martins-Gomes, C.; Coutinho, T.E.; Zielińska, A.; Silva, A.M. Microemulsions and nanoemulsions in skin drug delivery. Bioengineering 2022, 9(4), 158. [Google Scholar] [CrossRef] [PubMed]
- Sambhakar, S.; Malik, R.; Bhatia, S.; Al Harrasi, A.; Rani, C.; Preeti; et al. Nanoemulsion: an emerging novel technology for improving the bioavailability of drugs. Scientifica 2023, 2023, 6640103. [Google Scholar] [CrossRef]
- Rastogi, V.; Yadav, P. Transdermal drug delivery system: an overview. Asian J. Pharm. 2014, 6(3), 161–70. [Google Scholar]
- Zasada, M.; Budzisz, E. Retinoids: active molecules influencing skin structure formation in cosmetic and dermatological treatments. Adv. Dermatol. Allergol. 2019, 36(4), 392–7. [Google Scholar] [CrossRef]
- Leyden, J.; Stein-Gold, L.; Weiss, J. Why topical retinoids are mainstay of therapy for acne. Dermatol. Ther. 2017, 7(3), 293–304. [Google Scholar] [CrossRef]
- Zaenglein, A.L.; Pathy, A.L.; Schlosser, B.J.; Alikhan, A.; Baldwin, H.E.; Berson, D.S.; et al. Guidelines of care for the management of acne vulgaris. J. Am. Acad. Dermatol. 2016, 74(5), 945–73.e33. [Google Scholar] [CrossRef] [PubMed]
- Memarzia, A.; Saadat, S.; Behrouz, S.; Gholamnezhad, Z.; Boskabady, M.H. Experimental and clinical reports on anti-inflammatory, antioxidant, and immunomodulatory effects of Curcuma longa and curcumin: an updated and comprehensive review. Biofactors 2021, 47(3), 311–50. [Google Scholar] [CrossRef] [PubMed]
- Hewlings, S.J.; Kalman, D.S. Curcumin: a review of its effects on human health. Foods 2017, 6(10), 92. [Google Scholar] [CrossRef] [PubMed]
- Kasprzak-Drozd, K.; Niziński, P.; Hawrył, A.; Gancarz, M.; Hawrył, D.; Oliwa, W.; et al. Potential of curcumin in the management of skin diseases. Int. J. Mol. Sci. 2024, 25(7), 3617. [Google Scholar] [CrossRef] [PubMed]
- Anand, P.; Kunnumakkara, A.B.; Newman, R.A.; Aggarwal, B.B. Bioavailability of curcumin: problems and promises. Mol. Pharm. 2007, 4(6), 807–18. [Google Scholar] [CrossRef] [PubMed]
- Iqbal, R.; Mehmood, Z.; Baig, A.; Khalid, N. Formulation and characterization of food grade O/W nanoemulsions encapsulating quercetin and curcumin: insights on enhancing solubility characteristics. Food Bioprod. Process. 2020, 123, 304–11. [Google Scholar] [CrossRef]
- Ahmad, N.; Ahmad, R.; Al-Qudaihi, A.; Alaseel, S.E.; Fita, I.Z.; Khalid, M.S.; et al. Preparation of a novel curcumin nanoemulsion by ultrasonication and its comparative effects in wound healing and the treatment of inflammation. RSC Adv. 2019, 9(35), 20192–206. [Google Scholar] [CrossRef] [PubMed]
- Jiang, S.P.; He, S.N.; Li, Y.L.; Feng, D.L.; Lu, X.Y.; Du, Y.Z.; et al. Preparation and characteristics of lipid nanoemulsion formulations loaded with doxorubicin. Int. J. Nanomed. 2013, 8, 3141–50. [Google Scholar] [CrossRef]
- Babick, F. Dynamic light scattering. In Characterization of Nanoparticles; Elsevier: Amsterdam, 2020; pp. 137–72. [Google Scholar]
- Gulcin, İ.; Alwasel, S.H. DPPH radical scavenging assay. Processes 2023, 11(8), 2248. [Google Scholar] [CrossRef]
- Mosmann, T. Rapid colorimetric assay for cellular growth and survival: application to proliferation and cytotoxicity assays. J. Immunol. Methods 1983, 65(1-2), 55–63. [Google Scholar] [CrossRef] [PubMed]
- Valaperti, A.; Li, Z.; Vonow-Eisenring, M.; Probst-Müller, E. Diagnostic methods for the measurement of human TNF-alpha in clinical laboratory. J. Pharm. BioMed Anal. 2020, 179, 113010. [Google Scholar] [CrossRef] [PubMed]
- Bauer, A.W.; Kirby, W.M.; Sherris, J.C.; Turck, M. Antibiotic susceptibility testing by a standardized single disk method. Am. J. Clin. Pathol. 1966, 45(4), 493–6. [Google Scholar] [CrossRef] [PubMed]
- Telange, T.S.; Pawar, S.S.; Amkar, A.J.; Rane, B.R.; Jain, A.S. Development of nanoemulsion loaded acyclovir nanogel for transdermal delivery and its evaluation. Pharm. Sci. Asia 2023, 50(4), 347–60. [Google Scholar] [CrossRef]
- Azeem, A.; Rizwan, M.; Ahmad, F.J.; Iqbal, Z.; Khar, R.K.; Aqil, M.; et al. Nanoemulsion components screening and selection: a technical note. AAPS PharmSciTech 2009, 10(1), 69–76. [Google Scholar] [CrossRef] [PubMed]
- Anuchapreeda, S.; Fukumori, Y.; Okonogi, S.; Ichikawa, H. Preparation of lipid nanoemulsions incorporating curcumin for cancer therapy. J. Nanotechnol. 2012, 2012, 270383. [Google Scholar] [CrossRef]
- Romes, N.B.; Wahab, R.A.; Hamid, M.A.; Rahman, N.A.; Naina-Mohamed, I. The role of bioactive phytoconstituents-loaded nanoemulsions for skin improvement: a review. Biotechnol. Biotechnol. Equip. 2021, 35(1), 711–25. [Google Scholar] [CrossRef]
- Tamma, M.A.; Nsairat, H.; El-Tanani, M.; Madi, R. In vitro evaluation of lipidic nanocarriers for mebendazole delivery to improve anticancer activity. Drug Dev. Ind. Pharm. 2024, 50(11), 917–26. [Google Scholar] [CrossRef] [PubMed]
- Tadros, T.F. Emulsion formation and stability; Wiley-VCH: Weinheim, 2013. [Google Scholar]
- Lordi, N.G.; Scott, M.W. Stability charts: design and application to accelerated stability testing of pharmaceuticals. J. Pharm. Sci. 1965, 54(4), 531–7. [Google Scholar] [CrossRef]
- Ak, T.; Gülçin, İ. Antioxidant and radical scavenging properties of curcumin. Chem. Biol. Interact. 2008, 174(1), 27–37. [Google Scholar] [CrossRef] [PubMed]
- Edge, R.; Truscott, T.G. Singlet oxygen and free radical reactions of retinoids and carotenoids: a review. Antioxidants 2018, 7(1), 5. [Google Scholar] [CrossRef] [PubMed]
- Zhang, Y.; Liu, Z.; Wu, J.; Bai, B.; Chen, H.; Xiao, Z.; et al. New MD2 inhibitors derived from curcumin with improved anti-inflammatory activity. Eur. J. Med. Chem. 2018, 148, 291–305. [Google Scholar] [CrossRef] [PubMed]
- Gudas, L.J. Retinoid metabolism: new insights. J. Mol. Endocrinol. 2022, 69(4), T37–49. [Google Scholar] [CrossRef] [PubMed]
- Miksusanti; Apriani, E.F.; Bihurinin, A.H.B. Optimization of Tween 80 and PEG-400 concentration in Indonesian virgin coconut oil nanoemulsion as antibacterial against Staphylococcus aureus. Sains Malays. 2023, 52(4), 1259–72. [Google Scholar] [CrossRef]
- Silhavy, T.J.; Kahne, D.; Walker, S. The bacterial cell envelope. Cold Spring Harb. Perspect. Biol. 2010, 2(5), a000414. [Google Scholar] [CrossRef] [PubMed]
- Mahmood, Tabarek H.; Mahmood, Ghufran H.; Al-Samydai, Ali. Antibacterial-enhancing efficacy of aloe vera and honey in salicylic acid topical formulations against acne. Trop. J. Pharm. Res. 2025, 24.9. [Google Scholar]
Figure 1.
Calibration curves of curcumin and retinol using UV-visible spectrophotometry.
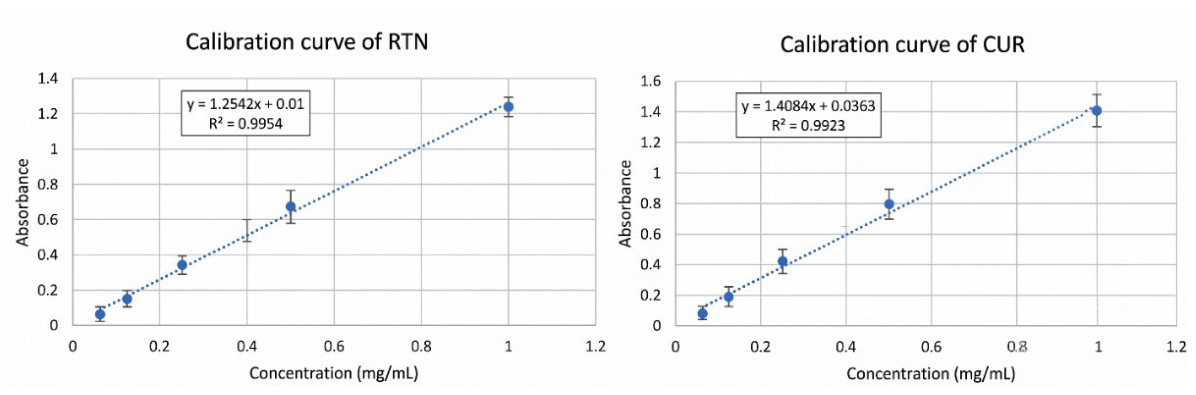
Figure 2.
TNF-α inhibitory activity of CNEs, RNEs, RCNEs, and blank NEs.
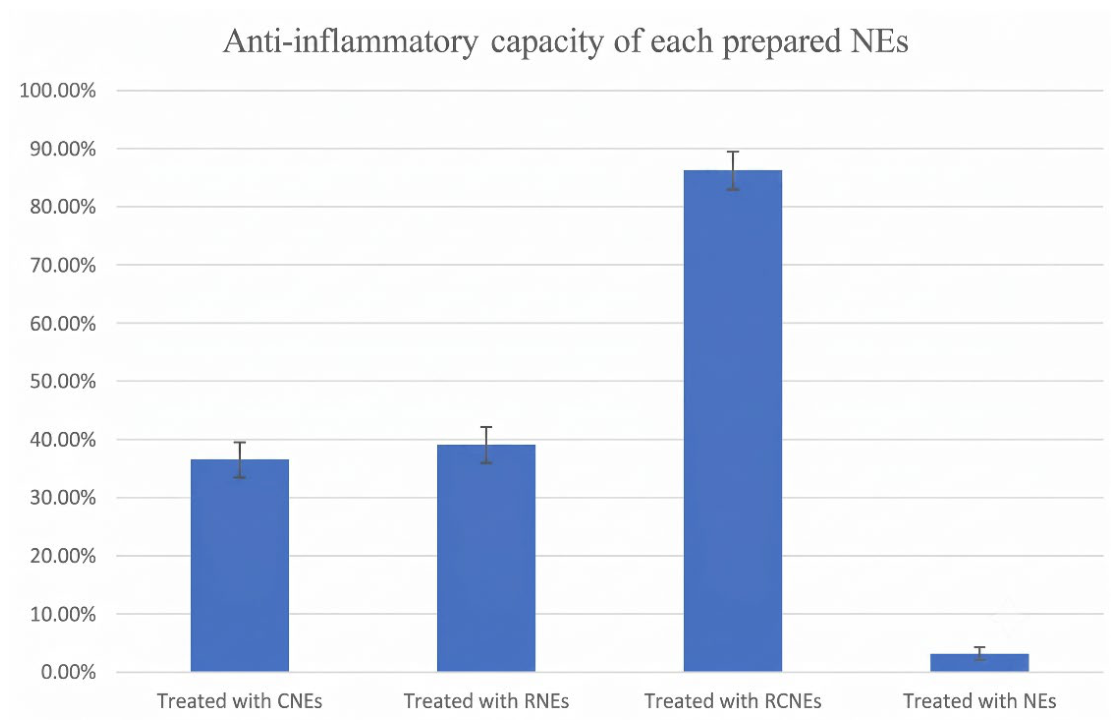
Figure 3.
Antibacterial activity of RCNEs (+ve), free CUR, free RTN, and CUR-RTN physical mixture (M.) against S. aureus and E. coli.
Figure 3.
Antibacterial activity of RCNEs (+ve), free CUR, free RTN, and CUR-RTN physical mixture (M.) against S. aureus and E. coli.
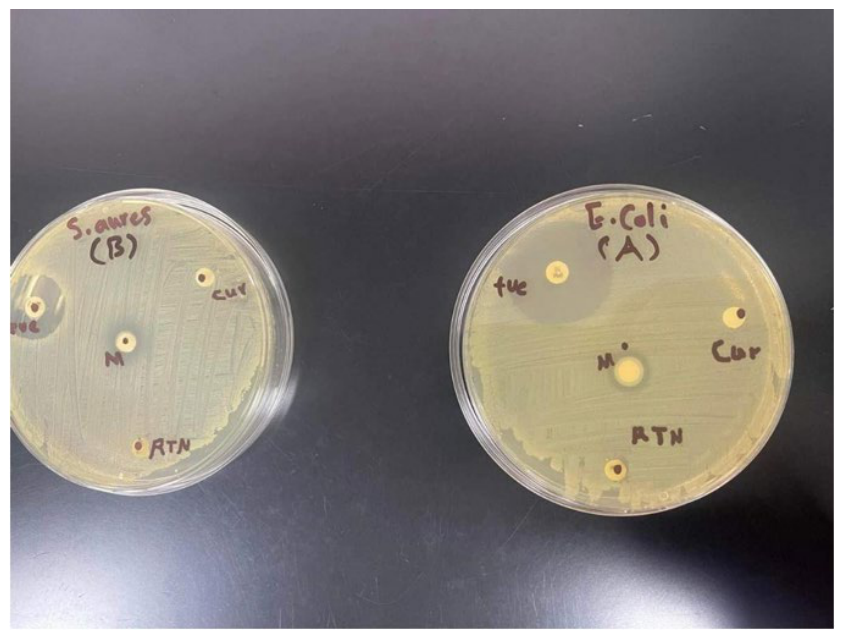
Table 3.
Encapsulation efficiency and loading efficiency of CUR and RTN in the prepared RCNE formulations.
Table 3.
Encapsulation efficiency and loading efficiency of CUR and RTN in the prepared RCNE formulations.
| Formula code | CUR EE (%) | RTN EE (%) | CUR LE (%) | RTN LE (%) |
| F1 | 57.0±1.8 | 23.8±2.1 | 11.0±0.6 | 4.6±0.3 |
| F2 | 61.0±2.4 | 63.6±1.7 | 14.4±0.8 | 15.0±0.9 |
| F3 | 59.0±1.5 | 69.9±2.8 | 12.4±0.4 | 14.7±0.7 |
| F4 | 46.0±3.1 | 44.3±2.5 | 12.6±0.7 | 12.1±0.5 |
| F5 | 22.2±1.2 | 67.0±3.4 | 14.5±0.5 | 43.9±1.4 |
| F6 | 44.8±2.0 | 56.5±1.9 | 13.3±0.6 | 16.7±0.8 |
| F7 | 77.0±1.1 | 91.1±0.8 | 21.1±0.9 | 24.9±1.1 |
*Values are expressed as mean ± SD (n = 3). Statistical significance was determined by one-way ANOVA followed by post-hoc analysis. Differences were considered significant at p ≤ 0.05.
Table 4.
Particle size, zeta potential, and PDI of the prepared RCNE formulations.
| Formula code | Particle size (nm) | Zeta potential (mV) | PDI |
| F1 | 193 ± 1 | −17.5 ± 0.8 | 0.177 ± 0.020 |
| F2 | 216 ± 2 | −12.1 ± 1.1 | 0.155 ± 0.060 |
| F3 | 141.5 ± 0.1 | −10.5 ± 0.9 | 0.165 ± 0.015 |
| F4 | 140 ± 0.4 | −17.2 ± 0.5 | 0.150 ± 0.030 |
| F5 | 145.3 ± 0.5 | −7.9 ± 0.8 | 0.184 ± 0.010 |
| F6 | 120 ± 0.8 | −13.4 ± 0.1 | 0.169 ± 0.012 |
| F7 | 117 ± 0.1 | −12.7 ± 0.2 | 0.138 ± 0.010 |
Table 5.
Stability study of the optimized RCNE formulation under different storage conditions.
| Parameter | Storage condition | Week 1 | Week 2 | Week 3 | Week 4 |
| Particle size (nm) | Oven | 175±4.2 | 216±5.8 | 213±6.1 | 279±9.4 |
| Refrigerator | 117±2.1 | 121±1.8 | 124±2.5 | 119±2.3 | |
| Room temperature | 124±2.8 | 126±3.1 | 133±4.0 | 192±7.2 | |
| Oven/Refrigerator | 132±3.5 | 129±2.9 | 141±4.4 | 144±4.8 | |
| Zeta potential (mV) | Oven | −8.8±0.6 | −7.9±0.7 | −6.3±0.5 | −7.3±0.8 |
| Refrigerator | −12.7±0.9 | −12.1±0.8 | −11.9±0.7 | −12.2±0.6 | |
| Room temperature | −10.5±0.8 | −11.0±1.1 | −7.1±0.6 | −7.1±0.5 | |
| Oven/Refrigerator | −12.2±1.0 | −11.2±0.7 | −11.7±0.9 | −10.9±0.8 | |
| PDI | Oven | 0.195±0.012 | 0.195±0.015 | 0.193±0.011 | 0.197±0.018 |
| Refrigerator | 0.138±0.005 | 0.140±0.007 | 0.141±0.006 | 0.139±0.008 | |
| Room temperature | 0.132±0.006 | 0.134±0.008 | 0.134±0.009 | 0.138±0.011 | |
| Oven/Refrigerator | 0.144±0.009 | 0.153±0.012 | 0.159±0.014 | 0.160±0.013 |
Table 6.
DPPH radical scavenging activity of CNEs, RNEs, and RCNEs.
| Concentration (µg/mL) | CNE inhibition | RNE inhibition | RCNE inhibition |
| 6.25 | 0.8±0.2% | 1.8±0.3% | 7.8±0.6% |
| 12.5 | 5.0±0.6% | 4.2±0.5% | 13.9±0.9% |
| 25 | 11.2±0.9% | 9.9±0.8% | 27.3±1.5% |
| 50 | 20.9±1.4% | 13.2±1.1% | 49.1±2.3% |
| 100 | 58.1±2.1% | 22.4±1.3% | 83.5±1.8% |
| EC50 | 90.03±3.15 µg/mL | 227.3±8.4 µg/mL | 56.04±1.95 µg/mL |
*Values are expressed as mean ± SD (n = 3). Statistical significance was determined by one-way ANOVA followed by post-hoc analysis. Differences were considered significant at p ≤ 0.05.
Table 7.
TNF-α concentration and inhibition after treatment with nanoemulsion formulations.
| Sample | Average OD | TNF-α concentration (pg/mL) | TNF-α inhibition (%) |
| CNEs | 0.977±0.032 | 351.4±14.8 | 36.6±2.4 |
| RNEs | 0.957±0.028 | 337.5±12.5 | 39.1±2.1 |
| RCNEs | 0.592±0.019 | 76.5±5.2 | 86.2±1.8 |
| Blank NEs | 1.237±0.041 | 537.0±21.0 | 3.1±0.9 |
| Untreated | 1.261±0.038 | 554.2±18.5 | — |
*Values are expressed as mean ± SD (n = 3). Statistical significance was determined by one-way ANOVA followed by post-hoc analysis. Differences were considered significant at p ≤ 0.05.
Disclaimer/Publisher’s Note: The statements, opinions and data contained in all publications are solely those of the individual author(s) and contributor(s) and not of MDPI and/or the editor(s). MDPI and/or the editor(s) disclaim responsibility for any injury to people or property resulting from any ideas, methods, instructions or products referred to in the content. |
© 2026 by the authors. Licensee MDPI, Basel, Switzerland. This article is an open access article distributed under the terms and conditions of the Creative Commons Attribution (CC BY) license.
Copyright: This open access article is published under a Creative Commons CC BY 4.0 license, which permit the free download, distribution, and reuse, provided that the author and preprint are cited in any reuse.


