
Submitted:
13 July 2026
Posted:
15 July 2026
You are already at the latest version
Abstract
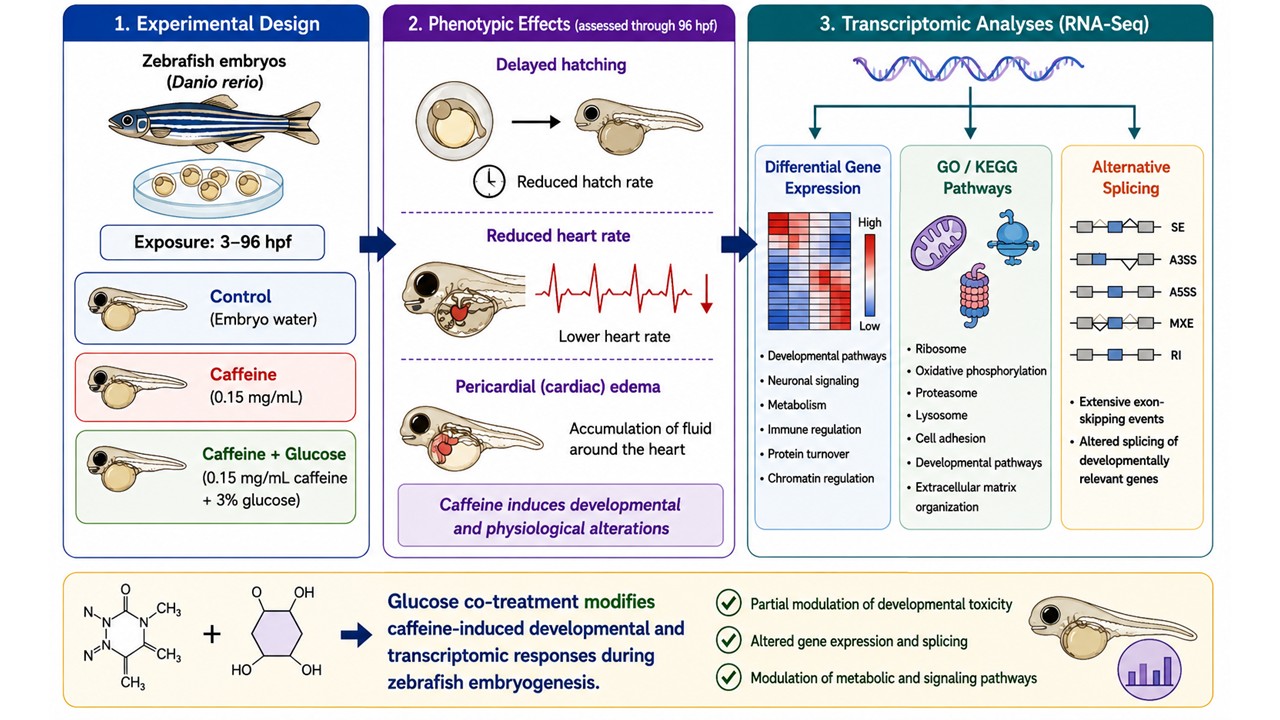
Caffeine exposure during pregnancy has been associated with developmental abnormalities; however, the combined effects of caffeine and glucose on embryogenesis remain unclear. In this study, zebrafish embryos were exposed to caffeine or caffeine plus glucose co-treatment from 3 hours post-fertilization to 96 hours post-fertilization to evaluate developmental, physiological, and transcriptomic changes. Morphological analyses revealed developmental abnormalities in treatment groups, including pericardial edema, abnormal body curvature, delayed tail extension, and enlarged yolk sac morphology. Significant alterations in hatch rate and heart rate were also observed following treatment exposure. RNA sequencing analysis demonstrated that caffeine induced broad transcriptomic disruption involving neuronal signaling, embryonic development, metabolism, mitochondrial activity, immune regulation, and protein turnover pathways. Compared with caffeine treatment alone, glucose co-treatment reduced the magnitude of differential gene expression and modulated developmental and metabolic signaling pathways. Alternative splicing analysis further identified widespread exon-skipping events and altered splicing patterns in genes associated with developmental and neuronal regulation. Collectively, these findings demonstrate that glucose supplementation partially reshapes caffeine-induced developmental and transcriptomic dysregulation during zebrafish embryogenesis.
Keywords:
caffeine
; glucose
; RNA-seq
; transcriptomic
; development
; zebrafish embryo
1. Introduction
Caffeine is one of the most widely consumed psychoactive substances worldwide and is commonly present in beverages such as coffee, tea, soft drinks, energy drinks, and chocolate-containing products [1]. Moderate caffeine consumption has been associated with beneficial physiological effects, including increased alertness, enhanced cognitive performance, antioxidant activity, and reduced risk of certain cardiometabolic diseases [2,3,4]. However, excessive caffeine intake has raised concerns regarding adverse health outcomes, particularly during pregnancy and early embryonic development [5,6,7,8,9,10,11]. Recent reviews have further emphasized that physiological changes during pregnancy alter caffeine metabolism, resulting in prolonged caffeine half-life and increased fetal exposure throughout gestation [12]. In addition, maternal caffeine consumption has been associated with an increased risk of adverse birth outcomes, including delivery of small-for-gestational-age infants and altered fetal growth trajectories [13].
During pregnancy, caffeine readily crosses the placental barrier and can accumulate in fetal tissues because the developing fetus has limited capacity to metabolize caffeine [5,6]. Epidemiological studies and meta-analyses have linked excessive maternal caffeine consumption to adverse pregnancy outcomes, including miscarriage, fetal growth restriction, low birth weight, preterm birth, gestational hypertension, and preeclampsia [7,8,9]. An integrative review by Silva et al. further summarized evidence supporting associations between maternal caffeine intake and adverse reproductive and developmental outcomes, while highlighting the need for continued investigation of underlying biological mechanisms [14]. Recent epigenetic studies further suggest that prenatal caffeine exposure may induce long-term alterations in Deoxyribonucleic acid (DNA) methylation and developmental programming, potentially affecting offspring health beyond embryonic development [10]. Experimental evidence indicates that caffeine may influence embryogenesis through alterations in oxidative stress, cardiovascular physiology, cellular metabolism, angiogenesis, and gene regulation [5,11].
The zebrafish (Danio rerio) is a well-established vertebrate model for investigating embryonic development, toxicology, genetics, and human disease because of its rapid external development, optical transparency, high fecundity, and extensive genetic conservation with humans [15,16]. Previous studies have demonstrated that caffeine exposure can induce developmental abnormalities in zebrafish embryos, including altered locomotor activity, impaired neuromuscular development, angiogenic defects, cardiac dysfunction, behavioral changes, and oxidative stress responses [17,18,19,20,21,22,23]. Caffeine has also been shown to alter cardiac gene expression, skeletal development, and developmental signaling pathways during embryogenesis [23,24]. These findings suggest that caffeine may influence multiple biological processes during early vertebrate development.
In addition to caffeine exposure, maternal metabolic disorders such as gestational diabetes mellitus (GDM) represent major risk factors for adverse fetal development [25]. Hyperglycemia during pregnancy has been associated with congenital abnormalities, altered organogenesis, cardiovascular defects, and long-term metabolic dysfunction in offspring [25]. To model these conditions experimentally, zebrafish embryos have been widely utilized to investigate the effects of glucose dysregulation on embryonic development and metabolism [26].
Our laboratory previously demonstrated that high glucose exposure disrupts zebrafish embryogenesis by delaying hatching, altering heart rate, modifying embryonic morphology, and dysregulating multiple developmental pathways, including oxidative phosphorylation, glycolysis/gluconeogenesis, Wnt signaling, and Notch signaling [27]. More recently, we reported that high-salt exposure induced cardiovascular developmental abnormalities through disruption of calcium signaling and Mitogen-Activated Protein Kinase (MAPK) pathways during embryogenesis [28]. Together, these studies suggest that environmental and metabolic stressors converge on common developmental signaling networks that regulate cardiovascular function, energy metabolism, and embryonic growth.
Although the developmental effects of caffeine and glucose have been studied independently, relatively little is known about how glucose influences caffeine-induced transcriptomic responses during embryogenesis. Given the widespread consumption of caffeine and the increasing prevalence of gestational diabetes worldwide, understanding the interaction between caffeine exposure and altered glucose metabolism is of considerable biological and public health significance.
Therefore, the objective of the present study was to investigate the effects of caffeine and caffeine-plus-glucose co-treatment on zebrafish embryonic development using phenotypic assessments and transcriptomic analyses. Hatch rate, heart rate, morphology, differential gene expression, pathway enrichment, and alternative splicing events were examined to determine how glucose co-treatment modifies caffeine-induced developmental responses. We hypothesized that glucose co-treatment would significantly alter caffeine-induced transcriptomic signatures and developmental pathways associated with metabolism, cardiovascular development, and embryonic growth.
2. Materials and Methods
2.1. Zebrafish Husbandry and Embryo Collection
Adult fish were housed in a recirculating aquatic system at 28.5 °C under a 14 h light/10 h dark photoperiod. Fertilized embryos were obtained through natural spawning and collected within 3 h post-fertilization (hpf). Embryos were examined microscopically, and only normally fertilized embryos were selected for subsequent experiments.
2.2. Experimental Design and Treatments
Building upon our previous investigations of glucose-induced developmental dysregulation and salt-induced cardiovascular abnormalities in zebrafish embryos [27,28], embryos were randomly assigned to one of three treatment groups: 1. Control group (embryo medium only); 2. Caffeine group (0.15 mg/mL caffeine); 3. Caffeine plus glucose group (0.15 mg/mL caffeine + 3% glucose).
Treatment solutions were prepared fresh and renewed every 24 h throughout the experimental period. Embryos were exposed continuously from 3 hpf until 96 hpf. Each treatment consisted of three biological replicates. Embryonic development was monitored daily throughout the exposure period.
2.3. Morphological Assessment, Hatch Rate, and Heart Rate Measurements
Embryos were examined at 24, 48, 72, and 96 hpf using a stereomicroscope. Morphological observations included body shape, developmental progression, edema formation, and overall appearance. Representative images were captured for each treatment group.
Hatch rates were recorded at designated developmental time points and calculated as the percentage of embryos successfully emerging from the chorion. Heart rates were measured at 72 and 96 hpf by counting cardiac contractions under microscopic observation. Measurements were performed on multiple embryos from each replicate, and average values were calculated for statistical analysis.
2.4. RNA Extraction and Sequencing
At 96 hpf, embryos from each treatment group were collected for transcriptomic analysis. Total RNA was extracted using standard procedures previously established in our laboratory [27,28]. RNA quality and integrity were evaluated prior to sequencing.
RNA libraries were prepared and sequenced by Novogene Corporation (Sacramento, CA, USA). High-throughput sequencing was performed using the Illumina platform to generate paired-end reads. Raw sequence data were subjected to quality control filtering before downstream analyses.
2.5. Differential Gene Expression Analysis
Clean reads were aligned to the zebrafish reference genome, and transcript abundance was quantified. Differentially expressed genes (DEGs) were identified using established bioinformatic pipelines. Genes with an adjusted p-value < 0.05 and biologically meaningful fold-change thresholds were considered significantly differentially expressed.
Three pairwise comparisons were performed: Caffeine vs. Control; Caffeine + Glucose vs. Control; Caffeine + Glucose vs. Caffeine.
Volcano plots, Venn diagrams, and hierarchical clustering analyses were generated to visualize transcriptomic differences among treatment groups.
2.6. Gene Ontology and KEGG Pathway Enrichment Analysis
Functional enrichment analyses were performed using Gene Ontology (GO) and Kyoto Encyclopedia of Genes and Genomes (KEGG) databases. Significantly enriched biological processes, cellular components, molecular functions, and pathways were identified using adjusted p-values < 0.05.
2.7. Alternative Splicing Analysis
Alternative splicing events were analyzed from RNA sequencing data to identify transcriptomic changes associated with caffeine exposure and glucose co-treatment. Splicing categories examined included skipped exons (SE), alternative 5′ splice sites (A5SS), alternative 3′ splice sites (A3SS), mutually exclusive exons (MXE), and retained introns (RI). Developmentally relevant genes exhibiting differential splicing patterns were further evaluated and visualized using heatmaps and sashimi plots.
2.8. Statistical Analysis
Data are presented as mean ± standard error of the mean (SEM). Statistical analyses were performed using GraphPad Prism software. Differences among groups were evaluated using one-way analysis of variance (ANOVA) followed by appropriate post hoc comparisons. Statistical significance was defined as p < 0.05.
3. Results
3.1. Developmental Effects of Caffeine and Glucose Co-Treatment
3.1.1. Morphology Changes
Morphological examination revealed several developmental abnormalities in caffeine-treated and caffeine plus glucose-treated embryos compared to controls (Figure 1). Embryonic developmental stages were evaluated according to established zebrafish staging criteria [15]. Control embryos exhibited normal developmental progression, whereas treated embryos displayed delayed development, enlarged yolk sacs, body curvature, and pericardial edema. These abnormalities were more apparent in the caffeine-treated group and remained evident in the caffeine plus glucose co-treatment group.
3.1.2. Hatch Rate and Heart Rate
Caffeine exposure significantly affected hatch rate and heart rate during embryonic development (Figure 2). Heart rate and developmental progression are commonly used indicators of embryonic health and developmental toxicity in zebrafish models [15,21]. Both caffeine-treated and caffeine plus glucose-treated embryos exhibited delayed hatching and altered cardiac function compared to controls. The caffeine plus glucose group demonstrated partial modification of caffeine-induced physiological responses but did not completely restore normal developmental parameters.
3.2. Transcriptomic Responses to Caffeine and Glucose Co-Treatment
3.2.1. RNA Sequencing Quality Assessment
Pearson correlation analysis and hierarchical clustering demonstrated strong reproducibility among biological replicates and clear separation among experimental groups (Figure 3). Replicates within each treatment group clustered closely together, indicating high consistency in gene expression profiles. Distinct clustering patterns were observed among the control, caffeine-treated, and caffeine plus glucose-treated groups, demonstrating that both caffeine exposure and glucose co-treatment induced substantial transcriptomic alterations during zebrafish embryogenesis.
3.2.2. Differential Gene Expression Analysis
Volcano plot analysis identified substantial transcriptomic changes among treatment groups (Figure 4). Caffeine exposure alone induced extensive differential gene expression compared with the control group, with 1486 upregulated genes and 1687 downregulated genes identified. Similarly, the caffeine plus glucose co-treatment group exhibited 1043 upregulated genes and 1419 downregulated genes relative to the control group. When the caffeine plus glucose group was compared directly with the caffeine-treated group, 1166 genes were upregulated and 1341 genes were downregulated. Overall, caffeine exposure alone produced the greatest transcriptomic disruption, whereas glucose co-treatment reduced the magnitude of differential gene expression relative to caffeine exposure alone (Figure 4).
Venn diagram analysis demonstrated substantial overlap among treatment groups (Figure 5). A total of 20,064 genes were shared between the control and caffeine-treated groups, while 20,332 genes were shared between the control and caffeine plus glucose groups. Similarly, 20,209 genes were shared between the caffeine-treated and caffeine plus glucose groups. Comparison of all three groups revealed 19,550 commonly expressed genes, indicating that core developmental transcriptional programs were maintained despite treatment-associated alterations. However, each treatment group also exhibited unique sets of differentially expressed genes, suggesting treatment-specific transcriptomic responses during zebrafish embryogenesis.
3.2.3. Top Differentially Expressed Genes
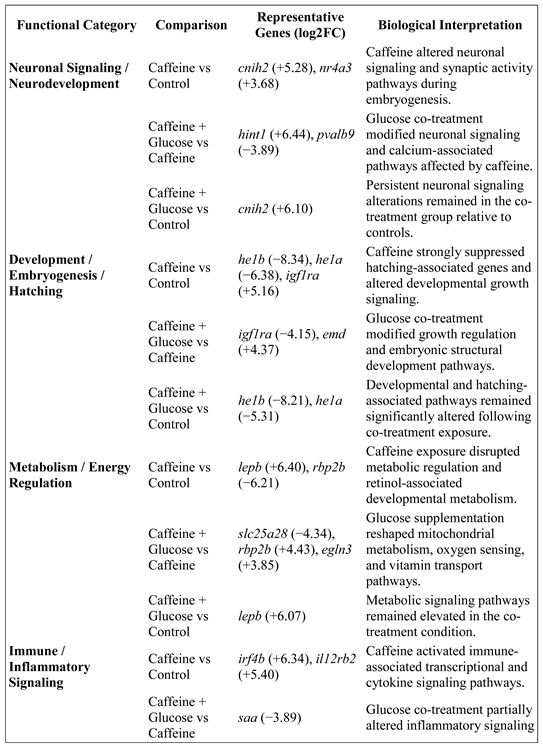
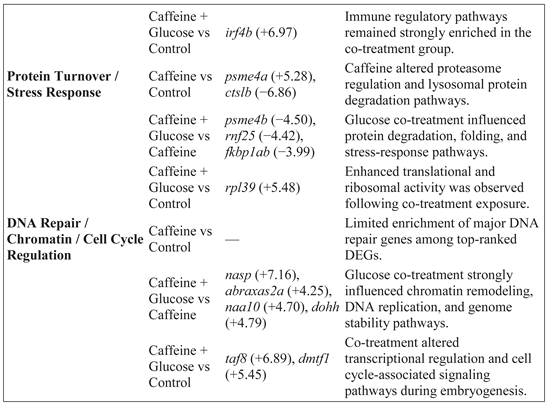
Analysis of the top 10 upregulated and top 10 downregulated genes revealed distinct functional categories associated with neuronal signaling, embryonic development, metabolism, immune regulation, protein turnover, and chromatin regulation (Table 1). Among the top differentially expressed genes in the caffeine versus control comparison were cnih2, lepb, irf4b, il12rb2, and igf1ra, whereas he1a and he1b were among the most strongly downregulated genes. Comparison of the caffeine plus glucose co-treatment group with the caffeine-treated group identified additional highly regulated genes involved in developmental regulation, metabolism, and chromatin organization.
3.2.4. Gene Ontology Enrichment Analysis
GO enrichment analysis revealed significant alterations in biological process, cellular component, and molecular function categories across all comparisons (Figure 6). Enriched GO terms in the caffeine versus control comparison were primarily associated with ribosome biogenesis, translation, mitochondrial activity, and developmental processes. Glucose co-treatment altered enrichment patterns related to metabolism, extracellular matrix organization, cell adhesion, and developmental regulation.
3.2.5. KEGG Pathway Enrichment Analysis
KEGG pathway analysis demonstrated substantial pathway alterations associated with caffeine exposure and glucose co-treatment (Figure 7). In the caffeine versus control comparison, the most significantly enriched pathways included ribosome, oxidative phosphorylation, drug metabolism, vitamin digestion and absorption, and cytoskeleton in muscle cells. The caffeine plus glucose versus control comparison showed enrichment of pathways related to ribosome, oxidative phosphorylation, proteasome, lysosome, and spliceosome function. Direct comparison of the caffeine plus glucose and caffeine-treated groups identified enrichment of pathways associated with focal adhesion, extracellular matrix–receptor interaction, adherens junctions, and developmental signaling pathways.
3.2.6. Alternative Splicing Analysis
Alternative splicing analysis revealed extensive transcriptomic remodeling following caffeine exposure and glucose co-treatment (Figure 8). Skipped exon (SE) events represented the predominant splicing category across all comparisons, followed by alternative 3′ splice site (A3SS), alternative 5′ splice site (A5SS), mutually exclusive exon (MXE), and retained intron (RI) events. Several genes involved in calcium signaling, neuronal function, embryonic development, and cellular regulation exhibited differential splicing patterns among treatment groups. Representative alternatively spliced genes included atp2a2a, cacna1aa, tfeb, and polg2, indicating widespread effects of caffeine and glucose exposure on post-transcriptional regulation during zebrafish embryogenesis.
4. Discussion
The present study demonstrated that caffeine exposure induced significant developmental, physiological, and transcriptomic alterations during zebrafish embryogenesis, while glucose co-treatment partially modified these responses. Morphological abnormalities observed in the treatment groups, including pericardial edema, abnormal body curvature, delayed tail extension, and enlarged yolk sac morphology, suggest that caffeine exposure disrupts normal embryonic and cardiovascular development. Similar developmental defects have previously been reported in zebrafish embryos following caffeine exposure, including impaired angiogenesis, developmental delay, cardiovascular abnormalities, and movement disorders [17,18,19,20]. Rana et al. demonstrated that caffeine exposure significantly alters zebrafish embryonic heart rate through calcium-associated signaling pathways [21], while Abdelkader et al. reported altered heartbeat and cell damage-related gene expression during early developmental stages [22]. Fang et al. further showed that caffeine exposure modifies cardiac developmental gene expression in embryonic cardiomyocytes [23]. These findings are consistent with the altered hatch rate, heart rate, and cardiovascular abnormalities observed in the present study.
RNA-seq analysis revealed that caffeine exposure alone induced the greatest transcriptomic disruption among the treatment groups, suggesting broad molecular dysregulation during embryonic development. Differentially expressed genes were strongly associated with neuronal signaling, embryogenesis, metabolism, mitochondrial function, immune regulation, and protein turnover pathways. Particularly notable was the suppression of hatching-associated genes he1a and he1b together with altered expression of neuronal signaling genes such as cnih2 and nr4a3. Previous studies have demonstrated that caffeine exposure induces neuromuscular and developmental abnormalities in zebrafish embryos [17], while Stengel et al. emphasized the importance of neuronal signaling pathways during zebrafish neurotoxicity assessment [31]. White et al. identified dynamic transcriptomic regulation during zebrafish embryogenesis [29], supporting the sensitivity of developmental signaling pathways during early vertebrate development. Amsterdam et al. similarly identified numerous genes essential for vertebrate embryonic development and organogenesis [30]. The altered neuronal-associated genes identified in the current study therefore suggest that caffeine exposure may interfere with neural signaling and developmental communication pathways during embryogenesis.
GO and KEGG enrichment analyses demonstrated that caffeine exposure strongly affected oxidative phosphorylation, ribosomal activity, spliceosome regulation, and metabolic pathways. Mitochondrial activity and oxidative phosphorylation are essential for embryonic energy production and organogenesis, particularly during periods of rapid cellular growth and differentiation. Disruption of these pathways may contribute to the developmental delay and physiological abnormalities observed in the treatment groups. Dhillon et al. characterized dynamic metabolic changes throughout zebrafish embryogenesis [32], while Konadu et al. demonstrated that altered glucose exposure significantly affects metabolic and appetite-related gene expression during zebrafish development [26]. Our previous study demonstrated that high glucose exposure disrupts zebrafish embryological development through modulation of Wnt signaling and metabolic pathways [27]. In addition, we recently reported that high-salt exposure induces cardiovascular developmental abnormalities through disruption of calcium signaling and MAPK pathways [28]. Together, these findings suggest that diverse environmental and metabolic stressors converge on common developmental signaling networks that regulate embryonic growth, cardiovascular development, and energy metabolism. The enrichment of proteasome and lysosomal pathways in caffeine-treated embryos also suggests activation of cellular stress and protein degradation mechanisms following developmental exposure.
An important finding of the present study was that glucose co-treatment partially reshaped caffeine-induced transcriptomic responses. Compared with caffeine exposure alone, the caffeine plus glucose group exhibited fewer differentially expressed genes and altered pathway enrichment associated with extracellular organization, metabolism, developmental signaling, and mitochondrial regulation. Although glucose supplementation did not completely reverse caffeine-induced dysregulation, it appeared to modify several developmental and metabolic pathways disrupted by caffeine exposure. Previous studies have shown that high glucose environments independently alter embryonic signaling pathways, oxidative stress responses, and developmental progression in zebrafish embryos [26,27]. The interaction observed in the current study may therefore reflect altered energy utilization, metabolic compensation, or stress-response signaling during embryogenesis. Because many caffeinated beverages consumed worldwide also contain high levels of sugar, these findings may provide important insight into combined dietary exposures during pregnancy and development.
Alternative splicing analysis demonstrated widespread transcriptomic remodeling following caffeine exposure and glucose co-treatment. Skipped exon events represented the predominant alternative splicing category across all treatment comparisons, while genes associated with calcium regulation, developmental signaling, and neuronal pathways displayed altered splicing patterns. The ATP2a2a gene, which plays an important role in calcium transport and cardiac muscle function, exhibited altered exon inclusion patterns in treatment groups. Alternative splicing is a critical regulatory mechanism during vertebrate embryogenesis and contributes to tissue differentiation, developmental timing, and organogenesis [16,30]. Increasing evidence suggests that environmental stressors and metabolic disturbances can alter RNA processing and spliceosomal regulation during development. Therefore, altered splicing patterns identified in the current study may contribute to the developmental and physiological abnormalities observed following caffeine exposure.
Caffeine exerts diverse physiological effects in both humans and vertebrate animal models through modulation of adenosine receptor signaling, neurotransmitter activity, cardiovascular function, metabolism, and oxidative stress responses. Previous reviews have highlighted both beneficial and adverse effects of caffeine depending on dose, developmental stage, and duration of exposure, emphasizing the importance of understanding caffeine-mediated physiological regulation during development [33,34,35]. In addition, long-term exposure studies in zebrafish have demonstrated that environmentally relevant caffeine concentrations can alter behavioral responses, biochemical parameters, and physiological homeostasis, suggesting that caffeine may exert persistent effects on multiple biological systems [36]. These findings support the broad transcriptomic alterations observed in the present study and further indicate that caffeine-induced developmental effects likely involve coordinated changes across metabolic, neurological, and cardiovascular pathways.
The findings of this study also support growing epidemiological and experimental evidence suggesting that prenatal caffeine exposure may influence fetal growth, cardiovascular development, metabolism, and neurodevelopment. Previous studies have associated maternal caffeine intake with altered implantation, placentation, fetal growth, low birth weight, childhood obesity, gestational hypertension, preeclampsia, preterm birth, and other adverse developmental outcomes [1,2,4,5,6,7,8,9,10]. Together, these studies support the potential developmental and metabolic risks associated with prenatal caffeine exposure and further highlight the translational relevance of the current zebrafish model.
Recent zebrafish studies have demonstrated that caffeine exposure can alter behavioral responses, locomotor activity, biochemical parameters, sensory development, sleep regulation, respiratory physiology, social behavior, and skeletal development [24,36,37,38,39,40,41,42]. In addition, developmental stage-specific caffeine uptake, metabolism, and xenobiotic processing may influence embryonic susceptibility to caffeine exposure [43,44,45]. Together with the transcriptomic findings presented here, these observations suggest that caffeine affects multiple developmental, metabolic, neurological, cardiovascular, and physiological pathways during embryogenesis, highlighting the importance of understanding combined dietary exposures such as caffeine and glucose during development.
Several limitations should be considered in the present study. Only a single caffeine concentration and glucose concentration were evaluated, limiting dose-dependent interpretation of developmental responses. In addition, transcriptomic analysis was performed at a single developmental time point, which may not fully capture dynamic molecular changes occurring throughout embryogenesis. Future studies should examine multiple exposure concentrations, oxidative stress pathways, behavioral outcomes, protein-level validation, and longer developmental windows to further characterize the molecular mechanisms underlying caffeine and glucose interactions during vertebrate development.
5. Conclusions
In conclusion, caffeine exposure induced significant developmental, physiological, and transcriptomic alterations during zebrafish embryogenesis, including morphological abnormalities, altered hatch rate, altered heart rate, and widespread changes in gene expression. Transcriptomic analyses revealed that caffeine affected pathways associated with neuronal signaling, embryonic development, metabolism, mitochondrial function, and alternative splicing regulation. Importantly, glucose co-treatment partially reshaped caffeine-induced molecular responses by modifying developmental and metabolic pathway regulation. Although glucose supplementation did not completely reverse caffeine-associated dysregulation, it altered several transcriptomic and physiological responses during embryonic development. Overall, these findings provide new insight into the molecular mechanisms underlying combined caffeine and glucose exposure and highlight the potential developmental consequences of excessive consumption of caffeinated and sugar-containing beverages during embryogenesis and vertebrate development.
Supplementary Materials
The following supporting information can be downloaded at the website of this paper posted on Preprints.org. RNA-Seq raw and processed data can be found at NCBI GEO website with ID GSE334680.
Author Contributions
Conceptualization, R.S.T.; Methodology, R.S.T.; Investigation, O.A. and K.S.; Data Curation, O.A. and K.S.; Writing—Original Draft Preparation, R.S.T.; Writing—Review and Editing, O.A., K.S. and R.S.T.; Visualization, O.A. and K.S.; Supervision, R.S.T.; Funding Acquisition, R.S.T.
Funding
This research was supported by the Anderson University Faculty Development Committee Grant awarded to R.S.T.
Institutional Review Board Statement
The study was conducted according to the guidelines of the Organization for Research Review Board (RRB) No. 21 according to the regulations of Public Health Service (PHS), the Animal Welfare Act (AWA) and Institutional Animal Care and Use Committee (IACUC).
Informed Consent Statement
Not applicable.
Data Availability Statement
RNA-Seq raw data can be found at NCBI GEO website with ID GSE334680.
Acknowledgments
The authors used ChatGPT (OpenAI) to assist with language editing and graphical abstract development. The authors independently reviewed, verified, and revised all generated content. All scientific analyses, interpretations, conclusions, and final manuscript content were developed and approved by the authors, who assume full responsibility for the accuracy and integrity of the work.
Abbreviations
The following abbreviations are used in this manuscript:
| GDM | Gestational Diabetes Mellitus |
| MAPK | Mitogen-Activated Protein Kinase |
| hpf | post-fertilization |
| GO | Gene Ontology |
| KEGG | Kyoto Encyclopedia of Genes and Genomes |
| SE | Skipped Exons |
| A5SS | Alternative 5′ Splice Sites |
| A3SS | Alternative 3′ Splice Sites |
| MXE | Mutually Exclusive Exons |
| RI | Retained Introns |
| DEGs | Differentially Expressed Genes |
References
- Temple, J.L.; Bernard, C.; Lipshultz, S.E.; Czachor, J.D.; Westphal, J.A.; Mestre, M.A. The safety of ingested caffeine: A comprehensive review. Front. Psychiatry 2017, 8, 80. [Google Scholar] [CrossRef] [PubMed]
- Qian, J.; Chen, Q.; Ward, S.M.; Duan, E.; Zhang, Y. Impacts of caffeine during pregnancy. Trends Endocrinol. Metab. 2020, 31, 218–227. [Google Scholar] [CrossRef] [PubMed]
- Schellhas, L.; Monasso, G.S.; Felix, J.F.; Jaddoe, V.W.; Huang, P.; Fernández-Barrés, S.; Vrijheid, M.; Pesce, G.; Annesi-Maesano, I.; Page, C.M.; et al. Maternal caffeine consumption during pregnancy and offspring cord blood DNA methylation: An epigenome-wide association study meta-analysis. Epigenomics 2023, 15, 1179–1193. [Google Scholar] [CrossRef] [PubMed]
- James, J.E. Maternal caffeine consumption and pregnancy outcomes: A narrative review with implications for advice to mothers and mothers-to-be. BMJ Evid.-Based Med. 2021, 26, 114–115. [Google Scholar] [PubMed]
- Chen, B.; Zhang, M.; He, Y.; Si, Y.; Shi, Y.; Jiang, K.; Shen, J.; Hong, J.; Ni, S. The association between caffeine exposure during pregnancy and risk of gestational hypertension/preeclampsia: A meta-analysis and systematic review. J. Obstet. Gynaecol. Res. 2022, 48, 3045–3055. [Google Scholar] [CrossRef] [PubMed]
- Jin, F.; Qiao, C. Association of maternal caffeine intake during pregnancy with low birth weight, childhood overweight, and obesity: A meta-analysis of cohort studies. Int. J. Obes. 2021, 45, 279–287. [Google Scholar]
- Maslova, E.; Bhattacharya, S.; Lin, S.-W.; Michels, K.B. Caffeine consumption during pregnancy and risk of preterm birth: A meta-analysis. Am. J. Clin. Nutr. 2010, 92, 1120–1132. [Google Scholar] [CrossRef] [PubMed]
- Emadi, R.C.; Kamangar, F. Coffee’s impact on health and well-being. Nutrients 2025, 17, 2558. [Google Scholar] [CrossRef] [PubMed]
- Higdon, J.V.; Frei, B. Coffee and health: A review of recent human research. Crit. Rev. Food Sci. Nutr. 2006, 46, 101–123. [Google Scholar] [CrossRef] [PubMed]
- Ungvari, Z.; Kunutsor, S.K. Coffee consumption and cardiometabolic health: A comprehensive review of the evidence. Geroscience 2024, 46, 6473–6510. [Google Scholar] [CrossRef] [PubMed]
- Reddy, V.S.; Shiva, S.; Manikantan, S.; Ramakrishna, S. Pharmacology of caffeine and its effects on the human body. Eur. J. Med. Chem. Rep. 2024, 10, 100138. [Google Scholar] [CrossRef]
- Struniewicz, K.M.; Ptaszek, M.M.; Ziółkowska, A.M.; Nitsch-Osuch, A.; Kozłowska, A. Pregnancy and caffeine metabolism: Updated insights and implications for maternal-fetal health. Nutrients 2025, 17, 3173. [Google Scholar] [CrossRef] [PubMed]
- Kukkonen, A.; Hantunen, S.; Voutilainen, A.; Ruusunen, A.; Backman, K.; Kirjavainen, P.V.; Ylilauri, M.; Voutilainen, R.; Pasanen, M.; Keski-Nisula, L. Maternal caffeine intake during pregnancy and the risk of delivering a small for gestational age baby: Kuopio Birth Cohort. Arch. Gynecol. Obstet. 2024, 310, 359–368. [Google Scholar] [CrossRef] [PubMed]
- Silva, C.G.; Bertoldi, A.D.; Domingues, M.R. Caffeine intake during pregnancy and adverse outcomes: An integrative review. Reprod. Toxicol. 2023, 117, 108518. [Google Scholar] [CrossRef]
- Kimmel, C.B.; Ballard, W.W.; Kimmel, S.R.; Ullmann, B.; Schilling, T.F. Stages of embryonic development of the zebrafish. Dev. Dyn. 1995, 203, 253–310. [Google Scholar] [CrossRef] [PubMed]
- Kudoh, T.; Tsang, M.; Hukriede, N.A.; Chen, X.; Dedekian, M.; Clarke, C.J.; Kiang, A.; Schultz, S.; Epstein, J.A.; Toyama, R.; et al. A gene expression screen in zebrafish embryogenesis. Genome Res. 2001, 11, 1979–1987. [Google Scholar] [CrossRef] [PubMed]
- Chen, Y.H.; Huang, Y.H.; Wen, C.C.; Wang, Y.H.; Chen, W.L.; Chen, L.C.; Tsay, H.J. Movement disorder and neuromuscular change in zebrafish embryos after exposure to caffeine. Neurotoxicol. Teratol. 2008, 30, 440–447. [Google Scholar] [CrossRef] [PubMed]
- Yeh, C.H.; Liao, Y.F.; Chang, C.Y.; Tsai, J.N.; Wang, Y.H.; Cheng, C.C.; Wen, C.C.; Chen, Y.H. Caffeine treatment disturbs the angiogenesis of zebrafish embryos. Drug Chem. Toxicol. 2012, 35, 361–365. [Google Scholar] [CrossRef] [PubMed]
- Basnet, R.M.; Zizioli, D.; Muscò, A.; Finazzi, D.; Sigala, S.; Rossini, E.; Tobia, C.; Guerra, J.; Presta, M.; Memo, M. Caffeine inhibits direct and indirect angiogenesis in zebrafish embryos. Int. J. Mol. Sci. 2021, 22, 4856. [Google Scholar] [CrossRef] [PubMed]
- Ionescu, C.; Lungu, P.F.; Rarinca, V.; Visternicu, M.; Ciobica, A.; Burlui, V.; Albert, C.; Nicoara, M.N.; Plavan, G.I.; Novac, B.; et al. Caffeine toxicity in zebrafish: Neurobehavioral changes, developmental defects, and oxidative stress. Biomol. Biomed. 2025, 26, 1032–1043. [Google Scholar] [CrossRef] [PubMed]
- Rana, N.; Moond, M.; Marthi, A.; Bapatla, S.; Sarvepalli, T.; Challa, A.K. Caffeine-induced effects on heart rate in zebrafish embryos and possible mechanisms of action. Zebrafish 2010, 7, 69–81. [Google Scholar] [CrossRef] [PubMed]
- Abdelkader, T.S.; Chang, S.N.; Kim, T.H.; Song, J.; Kim, D.S.; Park, J.H. Exposure time to caffeine affects heartbeat and cell damage-related gene expression of zebrafish embryos at early developmental stages. J. Appl. Toxicol. 2013, 33, 1277–1283. [Google Scholar] [CrossRef] [PubMed]
- Fang, X.; Mei, W.; Barbazuk, W.B.; Rivkees, S.A.; Wendler, C.C. Caffeine exposure alters cardiac gene expression in embryonic cardiomyocytes. Am. J. Physiol. Regul. Integr. Comp. Physiol. 2014, 307, R1471–R1487. [Google Scholar] [CrossRef] [PubMed]
- Bertassoli, B.M.; Santana, G.C.; Nogueira, J.M.; Paula, R.S.; Jorge, E.C.; Guilherme, H.O.; Alves, E.G.L.; Reis, A.M.S.; Serakides, R.; Ocarino, N.M. Caffeine exposure causes downregulation of genes related to osteogenesis and chondrogenesis in zebrafish. Braz. J. Vet. Pathol. 2024, 17, 1–10. [Google Scholar] [CrossRef]
- Moon, J.H.; Jang, H.C. Gestational diabetes mellitus: Diagnostic approaches and maternal-offspring complications. Diabetes Metab. J. 2022, 46, 3–14. [Google Scholar] [CrossRef] [PubMed]
- Konadu, B.; Cox, C.K.; Garrett, M.R.; Gibert, Y. Excess glucose or fat differentially affects metabolism and appetite-related gene expression during zebrafish embryogenesis. iScience 2023, 26, 107063. [Google Scholar] [CrossRef] [PubMed]
- Thompson, E.; Hensley, J.; Taylor, R.S. Effect of high glucose on embryological development of zebrafish, Brachydanio rerio, through Wnt pathway. Int. J. Mol. Sci. 2024, 25, 9443. [Google Scholar] [CrossRef] [PubMed]
- Thompson, E.; Hensley, J.; Taylor, R.S. High-salt exposure disrupts cardiovascular development in zebrafish embryos, Brachydanio rerio, via calcium and MAPK signaling pathways. J 2025, 8, 26. [Google Scholar] [CrossRef]
- White, R.J.; Collins, J.E.; Sealy, I.M.; et al. A high-resolution mRNA expression time course of embryonic development in zebrafish. eLife 2017, 6, e30860. [Google Scholar] [CrossRef] [PubMed]
- Amsterdam, A.; Nissen, R.M.; Sun, Z.; Swindell, E.C.; Farrington, S.; Hopkins, N. Identification of 315 genes essential for early zebrafish development. Proc. Natl. Acad. Sci. USA 2004, 101, 12792–12797. [Google Scholar] [CrossRef] [PubMed]
- Stengel, D.; Wahby, S.; Braunbeck, T. In search of a comprehensible set of endpoints for the routine monitoring of neurotoxicity in vertebrates. Environ. Sci. Pollut. Res. 2018, 25, 4066–4084. [Google Scholar]
- Dhillon, S.S.; Torell, F.; Donten, M.; et al. Metabolic profiling of zebrafish embryo development from blastula period to early larval stages. PLoS ONE 2019, 14, e0213661. [Google Scholar] [CrossRef] [PubMed]
- Nawrot, P.; Jordan, S.; Eastwood, J.; Rotstein, J.; Hugenholtz, A.; Feeley, M. Effects of caffeine on human health. Food Addit. Contam. 2003, 20, 1–30. [Google Scholar] [CrossRef] [PubMed]
- Reyes, C.M.; Cornelis, M.C. Dietary sources, health benefits, and risks of caffeine. Crit. Rev. Food Sci. Nutr. 2022, 64, 1–24. [Google Scholar] [CrossRef]
- Rodak, K.; Kokot, I.; Kratz, E.M. Caffeine as a factor influencing the functioning of the human body—Friend or foe? Nutrients 2021, 13, 3088. [Google Scholar] [CrossRef] [PubMed]
- Santos, N.; Picolo, V.; Domingues, I.; et al. Behavioral and biochemical effects of environmental concentrations of caffeine in zebrafish after long-term exposure. J. Environ. Sci. Health A 2024, 59, 453–465. [Google Scholar] [CrossRef]
- Santos, N.; Picolo, V.; Domingues, I.; et al. Effects of environmental concentrations of caffeine on adult zebrafish behaviour. Environ. Sci. Pollut. Res. 2023, 30, 63776–63787. [Google Scholar] [CrossRef]
- Rah, Y.C.; Yoo, M.H.; Choi, J.; et al. In vivo assessment of hair cell damage and developmental toxicity caused by gestational caffeine exposure using zebrafish models. Neurotoxicol. Teratol. 2017, 64, 1–7. [Google Scholar] [CrossRef] [PubMed]
- Martini, G.A.; Montagner, C.C.; Viveiros, W.; et al. Emerging contaminant occurrence and toxic effects on zebrafish embryos. Environ. Sci. Pollut. Res. 2021, 28, 20313–20329. [Google Scholar] [CrossRef]
- Wei, Y.; Miao, Z.; Ye, H.; et al. The effect of caffeine exposure on sleep patterns in zebrafish larvae and its underlying mechanism. Clocks Sleep 2024, 6, 749–763. [Google Scholar] [CrossRef] [PubMed]
- Harada, Y.; Soh, Z.; Wakitani, S.; et al. Pharmacological effects of caffeine on ventilation in adult zebrafish under free-swimming conditions. Sci. Rep. 2022, 12, 17649. [Google Scholar] [CrossRef] [PubMed]
- Wilson, L.C.; Lyttle, M.; Kanan, A.; Le, A. Social stimuli impact behavioral responses to caffeine in the zebrafish. Sci. Rep. 2024, 14, 29645. [Google Scholar] [CrossRef] [PubMed]
- Nawaji, T.; Mizoguchi, N.; Ono, M.; et al. Comparing time-series of chemical concentrations in zebrafish embryos/larvae exposed to teratogens with different hydrophobicity. J. Toxicol. Sci. 2018, 43, 267–273. [Google Scholar] [CrossRef] [PubMed]
- Nawaji, T.; Yamashita, N.; Umeda, H.; et al. Cytochrome P450 expression and chemical metabolic activity before full liver development in zebrafish. Pharmaceuticals 2020, 13, 456. [Google Scholar] [CrossRef] [PubMed]
Figure 1.
Representative images of zebrafish embryos at 96 hpf. (A) Control group. (B) Caffeine-treated group. (C) Caffeine plus glucose co-treatment group. Images were captured using a stereomicroscope at 4× magnification.
Figure 1.
Representative images of zebrafish embryos at 96 hpf. (A) Control group. (B) Caffeine-treated group. (C) Caffeine plus glucose co-treatment group. Images were captured using a stereomicroscope at 4× magnification.
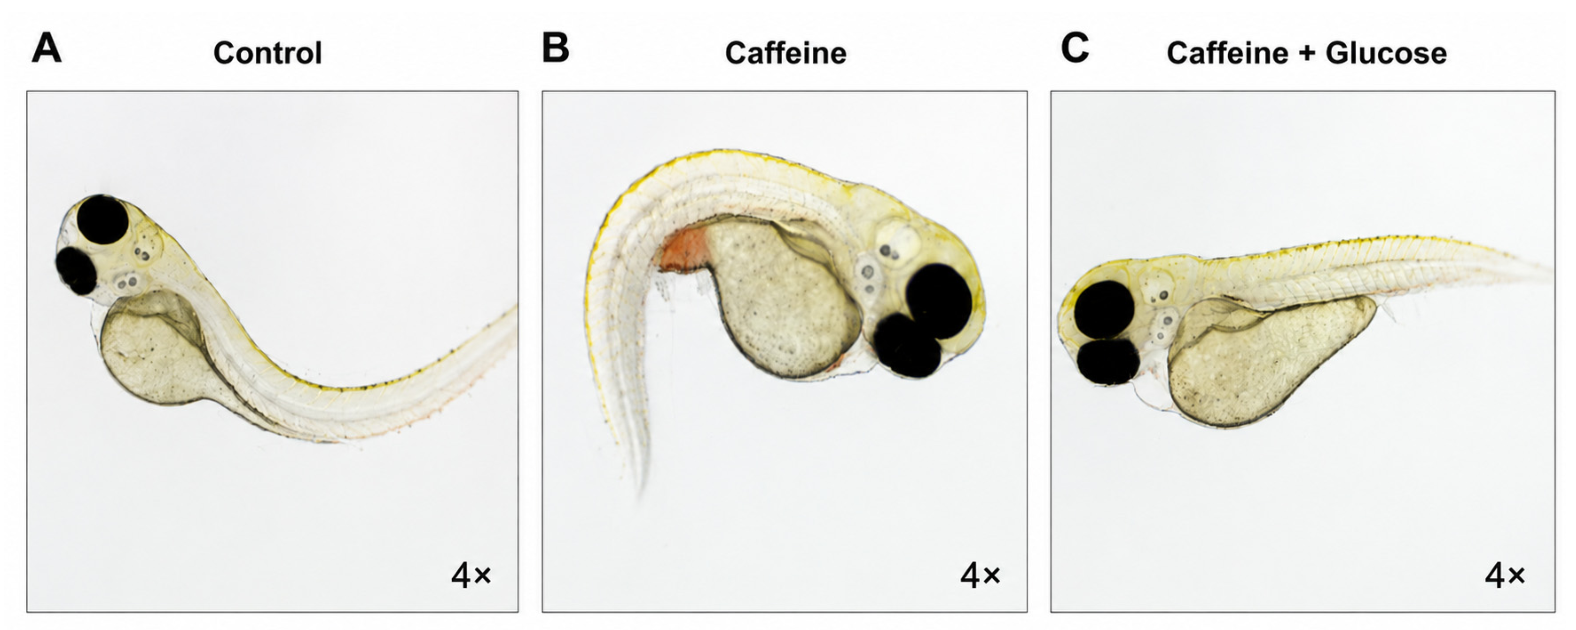
Figure 2.
Effect of caffeine and glucose treatments on zebrafish embryonic development. (A) Hatch rate of zebrafish embryos in the control, caffeine-treated, and caffeine plus glucose co-treatment groups at different developmental time points. (B) Heart rate of zebrafish embryos in the control, caffeine-treated, and caffeine plus glucose co-treatment groups measured at different developmental stages. * indicates statistically significant difference compared to the control group (p < 0.05). Data are presented as mean ± SD from biological triplicates.
Figure 2.
Effect of caffeine and glucose treatments on zebrafish embryonic development. (A) Hatch rate of zebrafish embryos in the control, caffeine-treated, and caffeine plus glucose co-treatment groups at different developmental time points. (B) Heart rate of zebrafish embryos in the control, caffeine-treated, and caffeine plus glucose co-treatment groups measured at different developmental stages. * indicates statistically significant difference compared to the control group (p < 0.05). Data are presented as mean ± SD from biological triplicates.
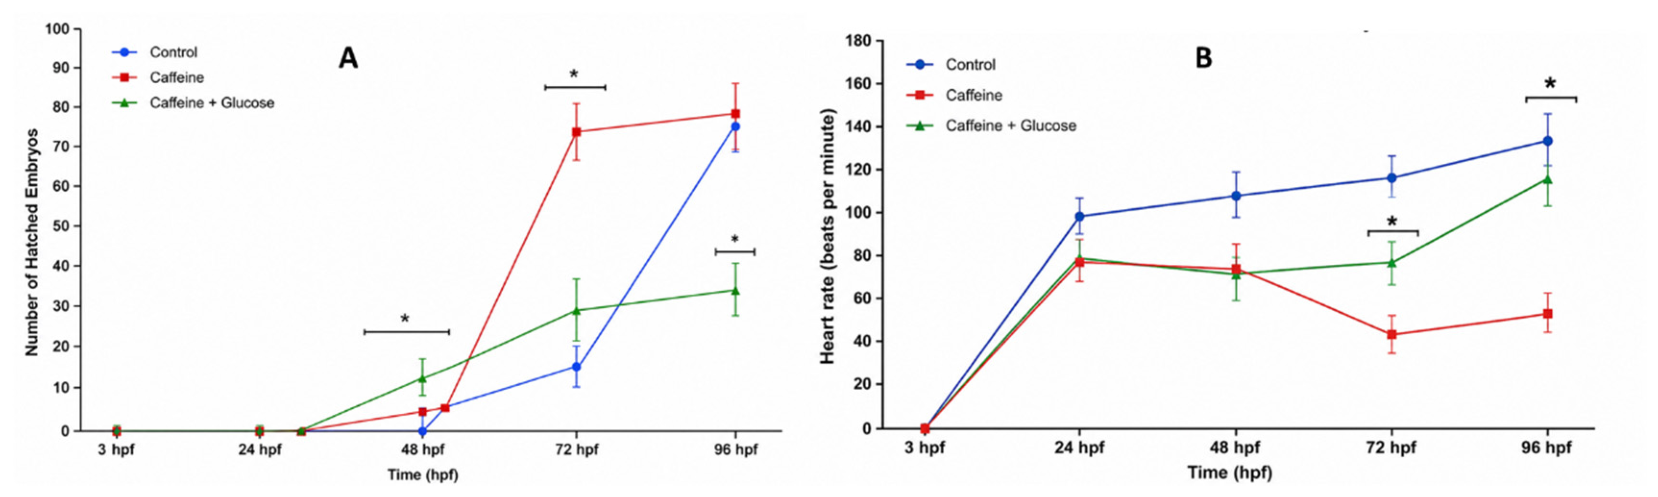
Figure 3.
Pearson correlation and hierarchical clustering heatmap of RNA-seq samples. (A) Pearson correlation analysis among samples. CA represents the caffeine-treated group, C represents the control group, and CG represents the caffeine plus glucose co-treatment group. (B) Hierarchical clustering heatmap showing the biological triplicates among the three experimental groups. CaffGlu represents the caffeine plus glucose co-treatment group.
Figure 3.
Pearson correlation and hierarchical clustering heatmap of RNA-seq samples. (A) Pearson correlation analysis among samples. CA represents the caffeine-treated group, C represents the control group, and CG represents the caffeine plus glucose co-treatment group. (B) Hierarchical clustering heatmap showing the biological triplicates among the three experimental groups. CaffGlu represents the caffeine plus glucose co-treatment group.
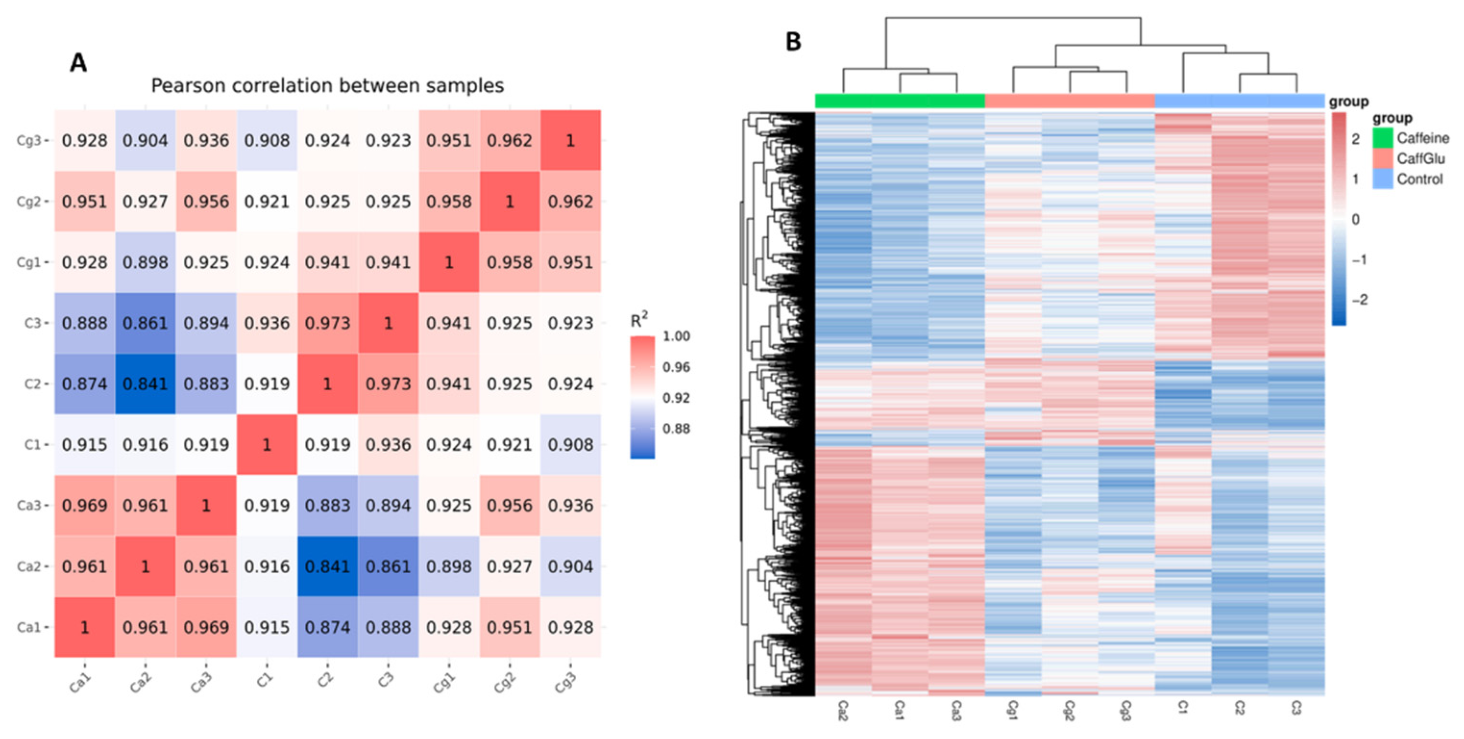
Figure 4.
Volcano plots showing significantly upregulated and downregulated genes identified by RNA-seq analysis. (A) Caffeine-treated group versus control group. (B) Caffeine plus glucose co-treatment group versus control group. (C) Caffeine plus glucose co-treatment group versus caffeine-treated group. Red dots represent significantly upregulated genes, while blue dots represent significantly downregulated genes. (D) Number of significantly differentially expressed genes identified in the three comparison groups.
Figure 4.
Volcano plots showing significantly upregulated and downregulated genes identified by RNA-seq analysis. (A) Caffeine-treated group versus control group. (B) Caffeine plus glucose co-treatment group versus control group. (C) Caffeine plus glucose co-treatment group versus caffeine-treated group. Red dots represent significantly upregulated genes, while blue dots represent significantly downregulated genes. (D) Number of significantly differentially expressed genes identified in the three comparison groups.
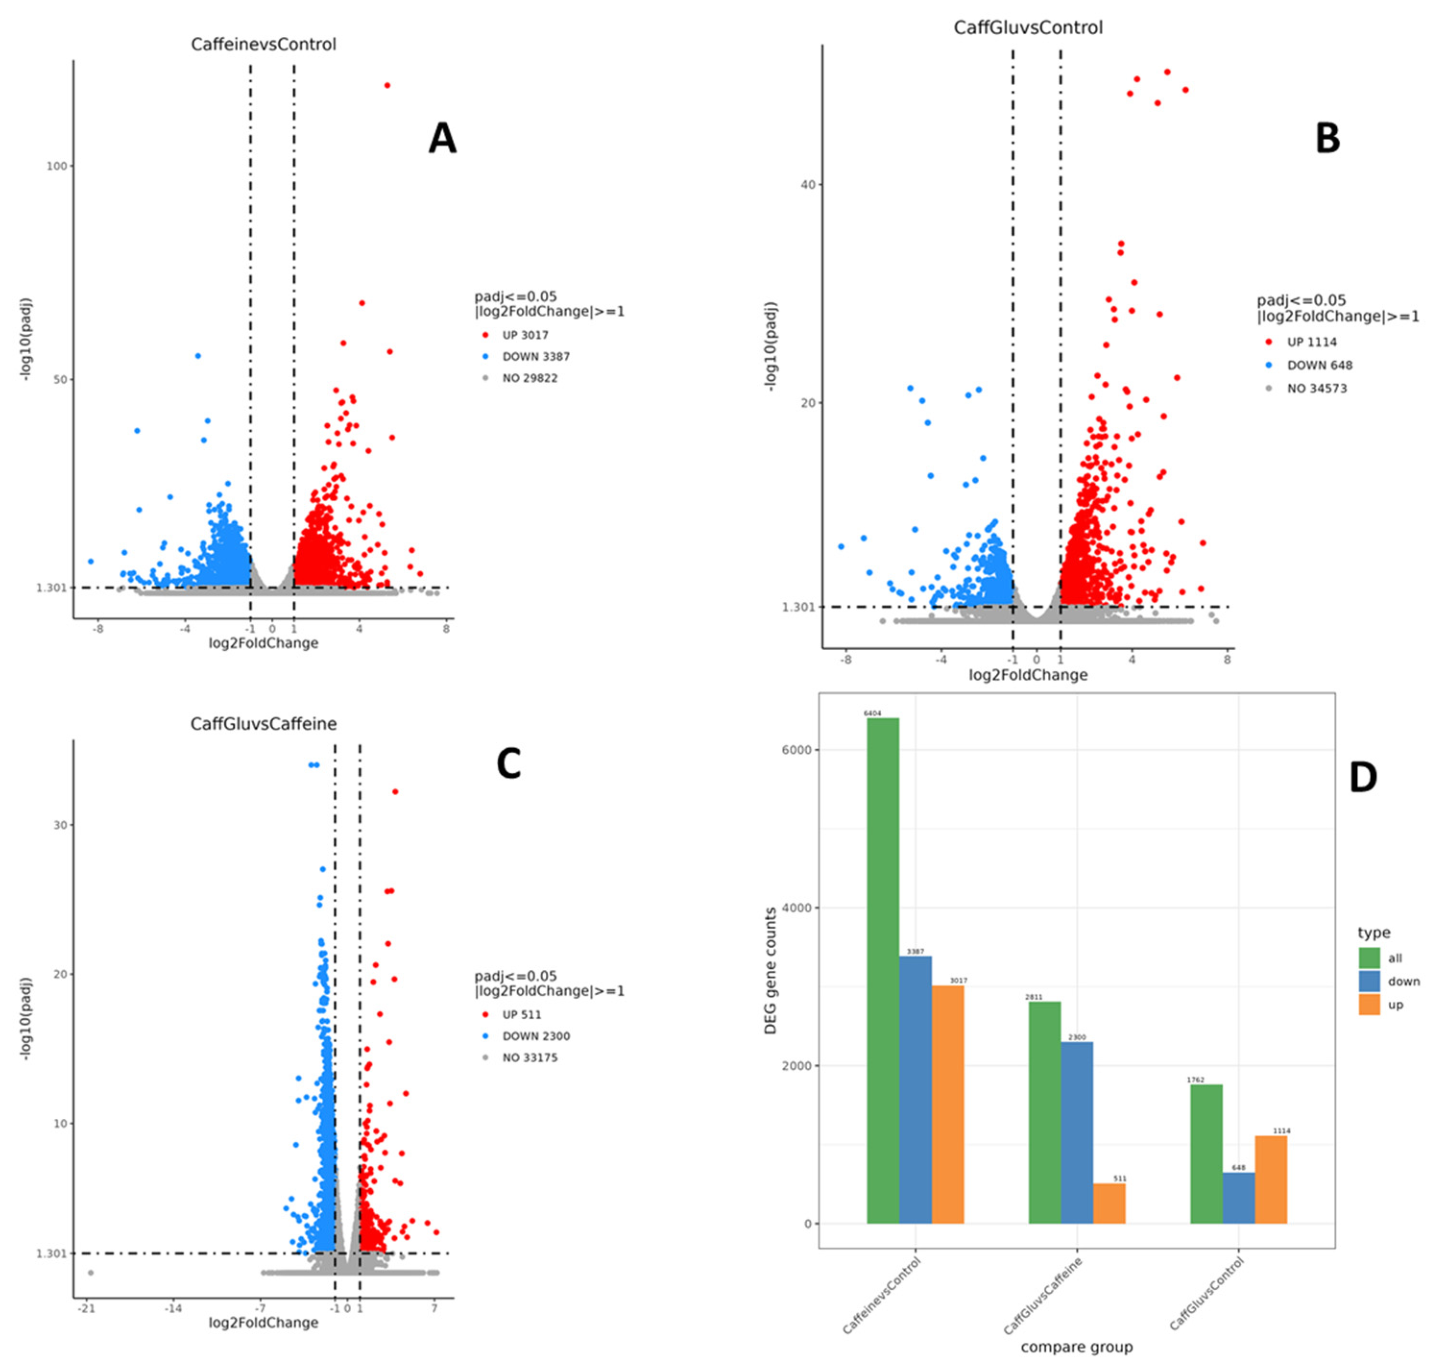
Figure 5.
Venn diagrams showing the overlap and unique differentially expressed genes (DEGs) identified among the RNA-seq comparison groups. (A) Caffeine-treated group versus control group. (B) Caffeine plus glucose co-treatment group versus caffeine-treated group. (C) Caffeine plus glucose co-treatment group versus control group. (D) Overlap of DEGs among the control, caffeine-treated, and caffeine plus glucose co-treatment groups. The diagrams demonstrate both shared and treatment-specific transcriptomic responses during zebrafish embryonic development.
Figure 5.
Venn diagrams showing the overlap and unique differentially expressed genes (DEGs) identified among the RNA-seq comparison groups. (A) Caffeine-treated group versus control group. (B) Caffeine plus glucose co-treatment group versus caffeine-treated group. (C) Caffeine plus glucose co-treatment group versus control group. (D) Overlap of DEGs among the control, caffeine-treated, and caffeine plus glucose co-treatment groups. The diagrams demonstrate both shared and treatment-specific transcriptomic responses during zebrafish embryonic development.
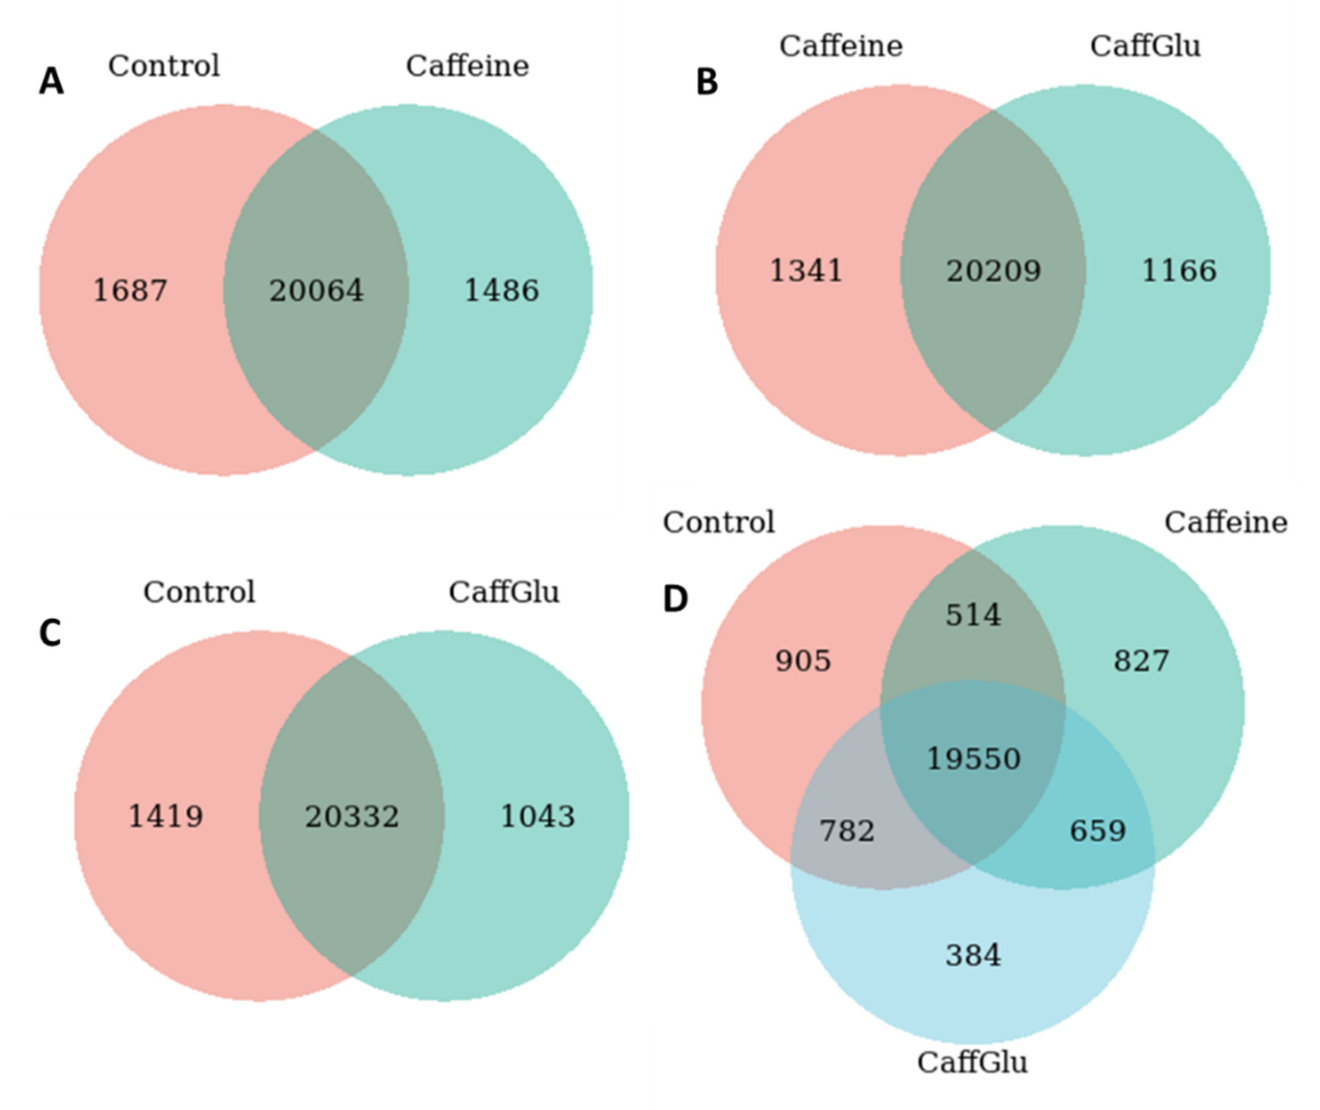
Figure 6.
Gene Ontology (GO) enrichment analysis of differentially expressed genes (DEGs) identified by RNA-seq. (A) GO enrichment analysis of the caffeine-treated group versus control group. (B) GO enrichment analysis of the caffeine plus glucose co-treatment group versus control group. (C) GO enrichment analysis of the caffeine plus glucose co-treatment group versus caffeine-treated group. The analysis highlights significantly enriched biological processes, molecular functions, and cellular components associated with transcriptomic alterations during zebrafish embryonic development.
Figure 6.
Gene Ontology (GO) enrichment analysis of differentially expressed genes (DEGs) identified by RNA-seq. (A) GO enrichment analysis of the caffeine-treated group versus control group. (B) GO enrichment analysis of the caffeine plus glucose co-treatment group versus control group. (C) GO enrichment analysis of the caffeine plus glucose co-treatment group versus caffeine-treated group. The analysis highlights significantly enriched biological processes, molecular functions, and cellular components associated with transcriptomic alterations during zebrafish embryonic development.
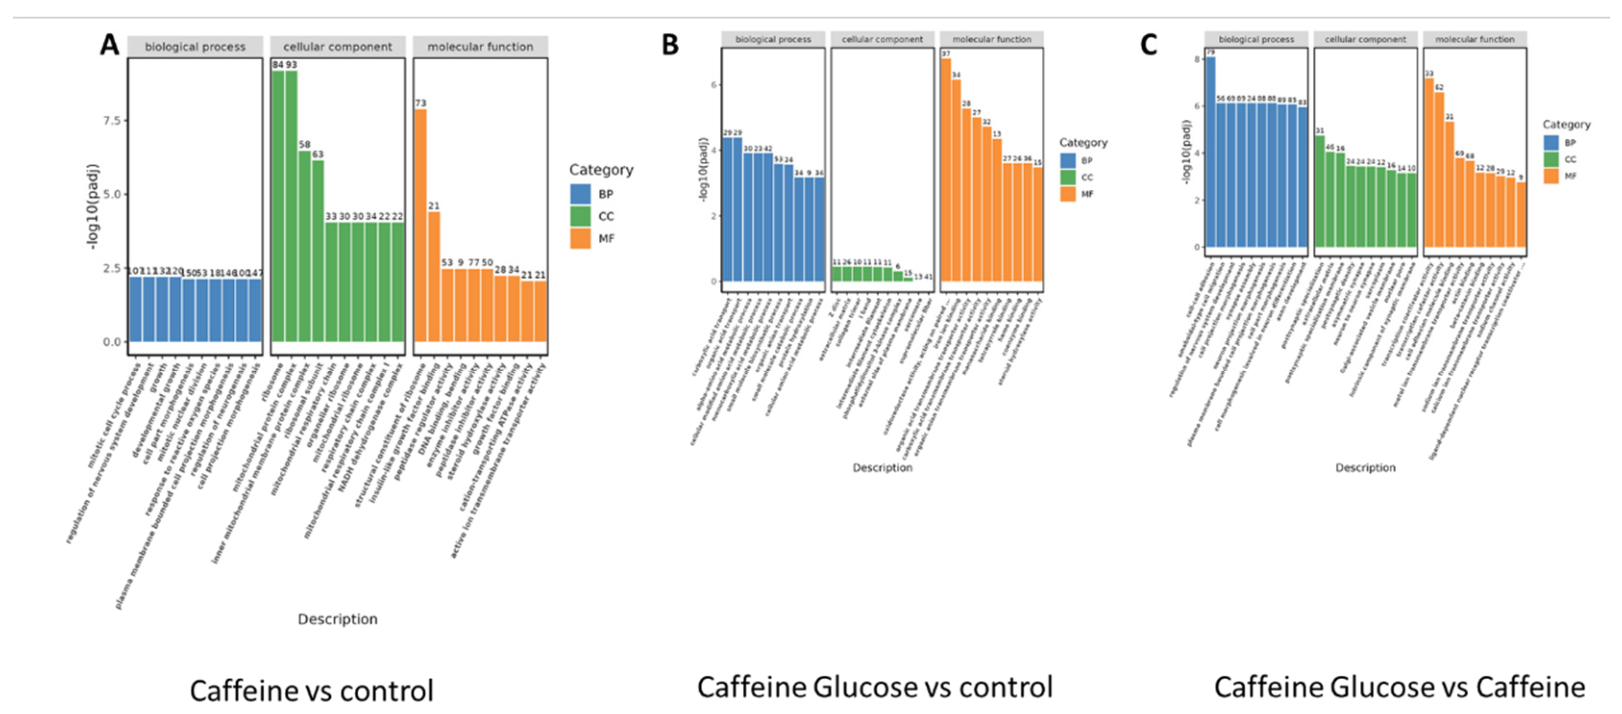
Figure 7.
KEGG pathway enrichment dot plot analysis showing significantly altered pathways identified by RNA-seq analysis. (A) Caffeine-treated group versus control group. (B) Caffeine plus glucose co-treatment group versus control group. (C) Caffeine plus glucose co-treatment group versus caffeine-treated group. The dot plots illustrate the significantly enriched signaling and metabolic pathways associated with transcriptomic changes during zebrafish embryonic development.
Figure 7.
KEGG pathway enrichment dot plot analysis showing significantly altered pathways identified by RNA-seq analysis. (A) Caffeine-treated group versus control group. (B) Caffeine plus glucose co-treatment group versus control group. (C) Caffeine plus glucose co-treatment group versus caffeine-treated group. The dot plots illustrate the significantly enriched signaling and metabolic pathways associated with transcriptomic changes during zebrafish embryonic development.
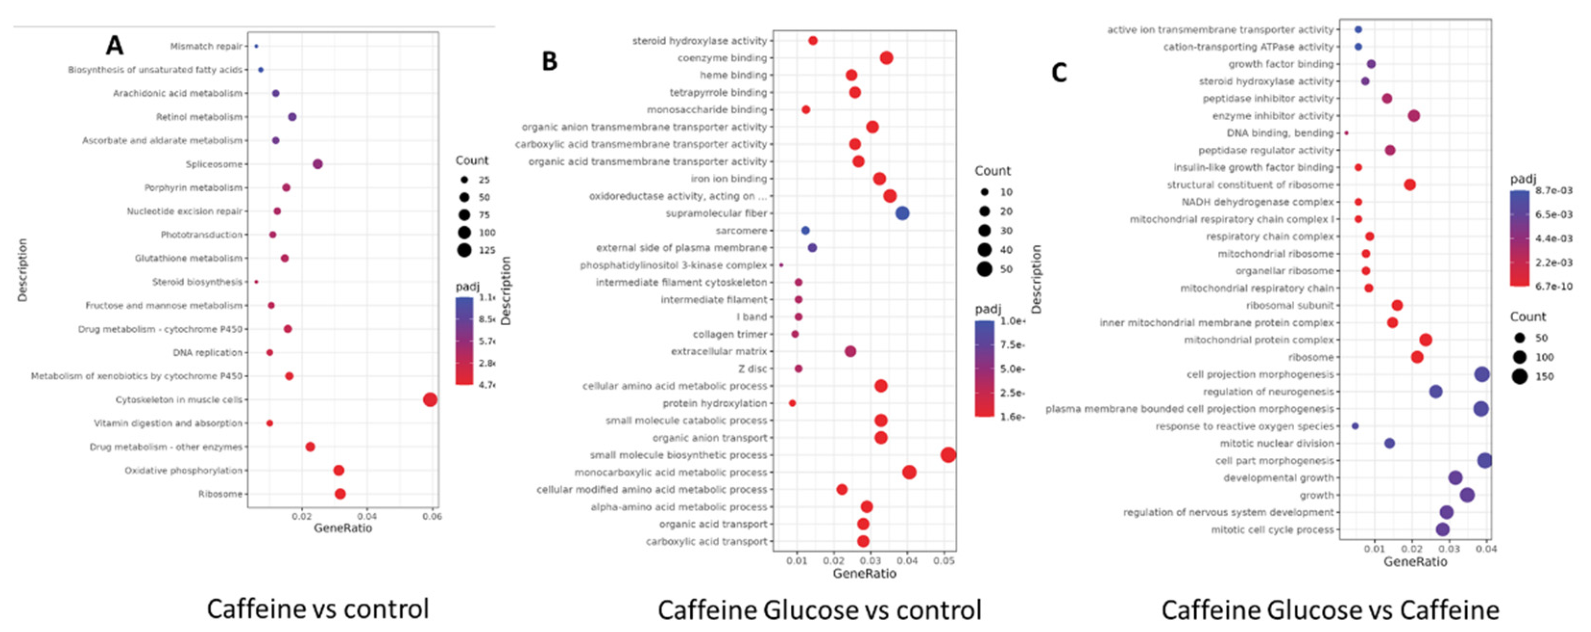
Figure 8.
Alternative splicing (AS) analysis of RNA-seq data among the treatment groups. (A) Distribution of alternative splicing events, including alternative 3′ splice site (A3SS), alternative 5′ splice site (A5SS), mutually exclusive exons (MXE), retained introns (RI), and skipped exons (SE), identified in the three comparison groups. (B) Heatmap showing the expression patterns of 20 genes associated with developmental pathways among the three comparison groups. (C) Visualization of the ATP2a2a gene exhibiting an A3SS event in the caffeine plus glucose co-treatment group versus the control group, where red represents the treatment group and orange represents the control group.
Figure 8.
Alternative splicing (AS) analysis of RNA-seq data among the treatment groups. (A) Distribution of alternative splicing events, including alternative 3′ splice site (A3SS), alternative 5′ splice site (A5SS), mutually exclusive exons (MXE), retained introns (RI), and skipped exons (SE), identified in the three comparison groups. (B) Heatmap showing the expression patterns of 20 genes associated with developmental pathways among the three comparison groups. (C) Visualization of the ATP2a2a gene exhibiting an A3SS event in the caffeine plus glucose co-treatment group versus the control group, where red represents the treatment group and orange represents the control group.
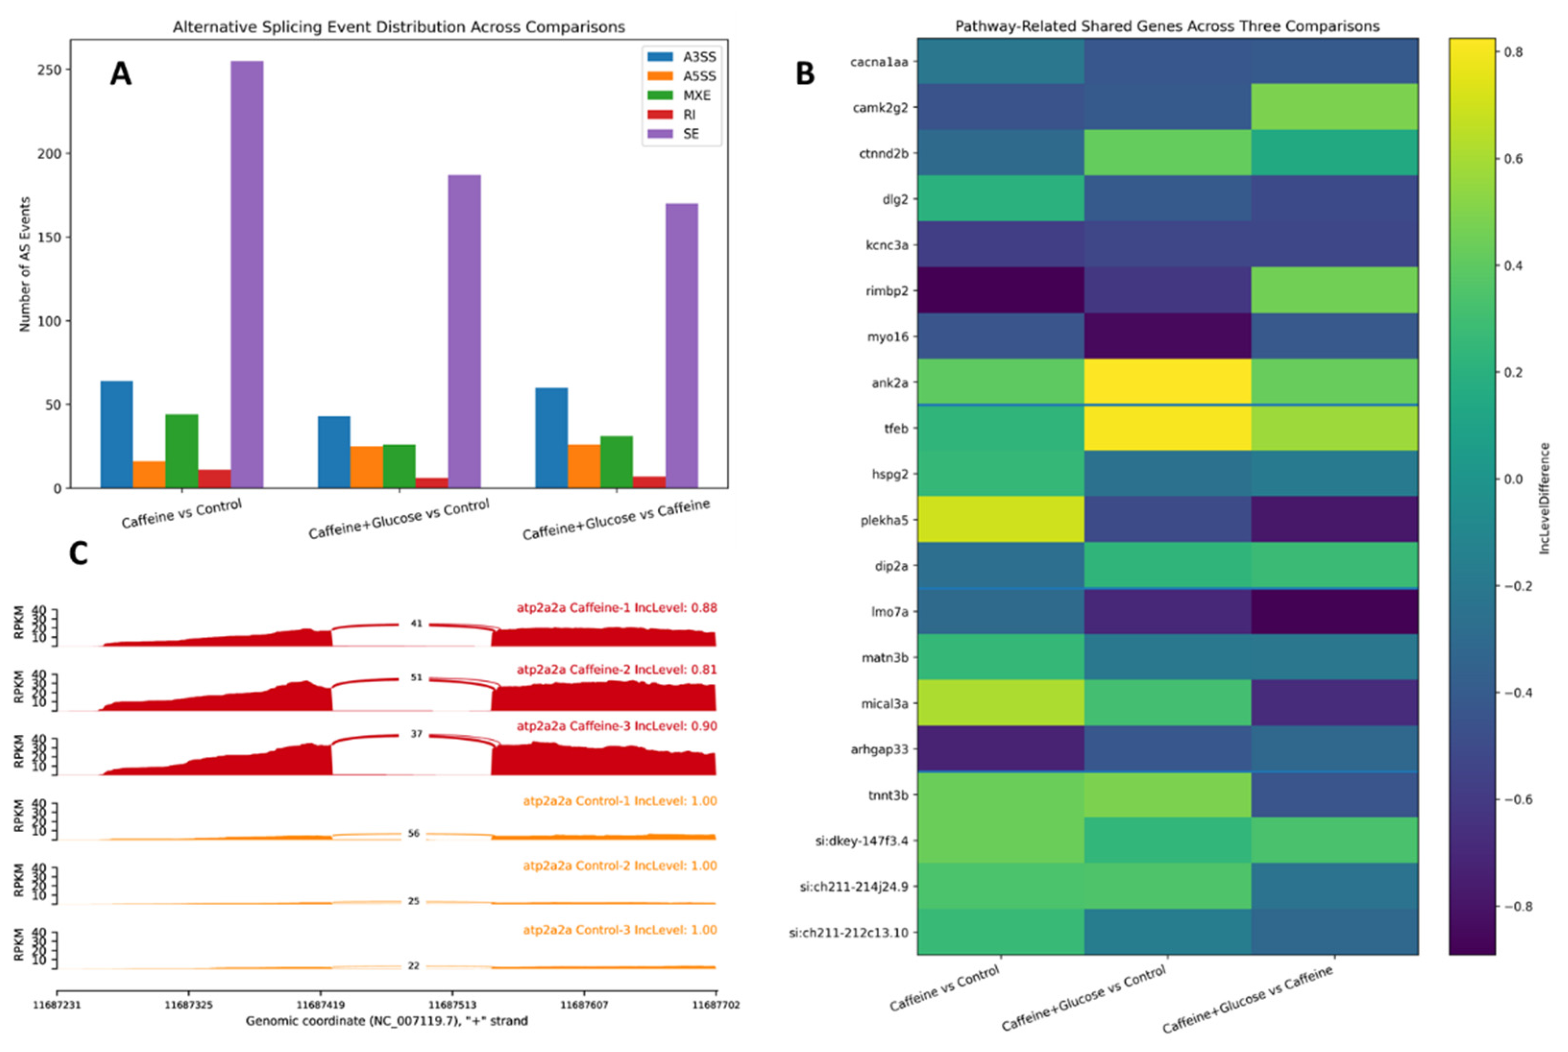

Table 1.
Functional Transcriptomic Alterations and Biological Interpretation of Representative Differentially Expressed Genes among Caffeine and Glucose Treatment Groups.
Table 1.
Functional Transcriptomic Alterations and Biological Interpretation of Representative Differentially Expressed Genes among Caffeine and Glucose Treatment Groups.
|
Disclaimer/Publisher’s Note: The statements, opinions and data contained in all publications are solely those of the individual author(s) and contributor(s) and not of MDPI and/or the editor(s). MDPI and/or the editor(s) disclaim responsibility for any injury to people or property resulting from any ideas, methods, instructions or products referred to in the content. |
© 2026 by the authors. Licensee MDPI, Basel, Switzerland. This article is an open access article distributed under the terms and conditions of the Creative Commons Attribution (CC BY) license (http://creativecommons.org/licenses/by/4.0/).
Copyright: This open access article is published under a Creative Commons CC BY 4.0 license, which permit the free download, distribution, and reuse, provided that the author and preprint are cited in any reuse.


