

Submitted:
13 July 2026
Posted:
15 July 2026
You are already at the latest version
Abstract
Economic emission dispatch (EED) and combined economic emission dispatch (CEED) are multi-objective power-system optimization problems in which Pareto-front quality must be interpreted together with physically feasible power balance. Conventional feasibility repair can keep final populations feasible under a loose tolerance, but residual power-balance errors may remain large enough to weaken engineering credibility. This paper proposes a precision-controlled conservative repair (PCR) mechanism for loss-constrained EED/CEED. PCR preserves a capacity-margin repair direction as the default correction path, tightens the final loss-coupled balance residual through an iterative precision loop, and retains a lazy recovery safeguard for difficult residual cases. The method is evaluated as a repair component across NSGA-II, MOEA/D, and MOPSO-CD on two audited benchmarks: the IEEE 30-bus 6-unit EED case and a SAGE/Basu 10-unit CEED case. Each condition is run for 30 independent seeds, and the formal protocol reports HV, IGD, feasibility, balance mismatch, physical objective summaries, runtime, and Mann–Whitney/Cliff’s-delta statistics. Relative to the current repair baseline, PCR produces a positive multi-metric transfer classification for all three algorithms on both benchmarks. Median IGD improves for all six benchmark–algorithm pairs, and mean absolute balance mismatch is reduced from loose-feasible 10−3–10−1 MW scale to approximately 10−5 MW scale. This stricter residual control introduces a significant runtime overhead, which is reported as an explicit engineering tradeoff. The resulting claim is intentionally bounded: PCR is not a new general optimizer, but a reproducible conservative repair refinement for loss-constrained dispatch studies where physical feasibility quality matters.
Keywords:
economic emission dispatch
; combined economic emission dispatch
; feasibility repair
; constraint handling
; power balance
; multi-objective optimization
; NSGA-II
; MOEA/D
; MOPSO-CD
1. Introduction
Economic emission dispatch (EED) balances generation cost and environmental impact while satisfying generator limits and the power-balance equation [1,2,3,4]. In its multi-objective form, EED returns a set of cost–emission tradeoffs rather than a single scalar optimum. This makes the quality of the approximation set important, but an apparently strong approximate Pareto front is not useful for operation if the dispatch vectors do not satisfy physical feasibility with sufficient numerical precision. This requirement is especially important when transmission losses are included, because the equality constraint depends on the decision vector itself rather than on a fixed demand term alone.
Multi-objective evolutionary algorithms (MOEAs), including NSGA-II, MOEA/D, and multi-objective particle swarm optimization, are common search backbones for EED and related dispatch problems [5,6,7,8]. Their performance in dispatch studies depends not only on selection and variation, but also on constraint handling. Penalty functions, feasibility rules, decoders, projection procedures, and repair operators can all change the effective search landscape [9]. In loss-constrained EED/CEED, repair is particularly important because the active equality constraint contains the transmission-loss term; a small change in generation can affect both the total output and the loss term. A dispatch study that reports only nondominated objective values, without showing the quality of this equality repair, can therefore conflate optimizer behavior with repair behavior.
The practical difficulty is that conventional repair can be “feasible” under a reporting tolerance while still leaving residual mismatch that is unnecessarily large. In the formal baseline used in this study, feasibility rates are one for the reported current-repair and PCR conditions, but the mean absolute balance mismatch can remain at – MW scale on the larger CEED case. This creates a methodological gap for engineering dispatch papers: a repair operator should preserve approximate Pareto-front quality while also delivering physically tight final dispatches. Binary feasibility alone is too coarse for this purpose. Residual mismatch, repair iterations, and runtime must be reported together.
This paper addresses that gap with a precision-controlled conservative repair (PCR) mechanism. PCR is intentionally modest. It is not presented as a new MOEA or as a universal dispatch optimizer. Instead, it is a repair component that keeps the stable capacity-margin correction direction, tightens the final loss-coupled balance residual, and uses a conservative fallback policy to avoid aggressive over-correction. The host optimizer still performs its own mating, decomposition, swarm update, archive maintenance, nondominated sorting, or selection. PCR replaces only the loss-coupled repair layer between candidate generation and objective evaluation.
This positioning prevents overclaiming. The contribution is not that a renamed optimizer dominates all dispatch methods. The contribution is that a small and auditable repair layer can materially change the quality of the dispatch vectors delivered by established MOEA backbones. The evaluation is therefore organized around paired host-optimizer comparisons: the same NSGA-II, MOEA/D, or MOPSO-CD search process is run with the current repair baseline and with PCR. This isolates the effect of stricter residual control from the broader behavior of the optimizer.
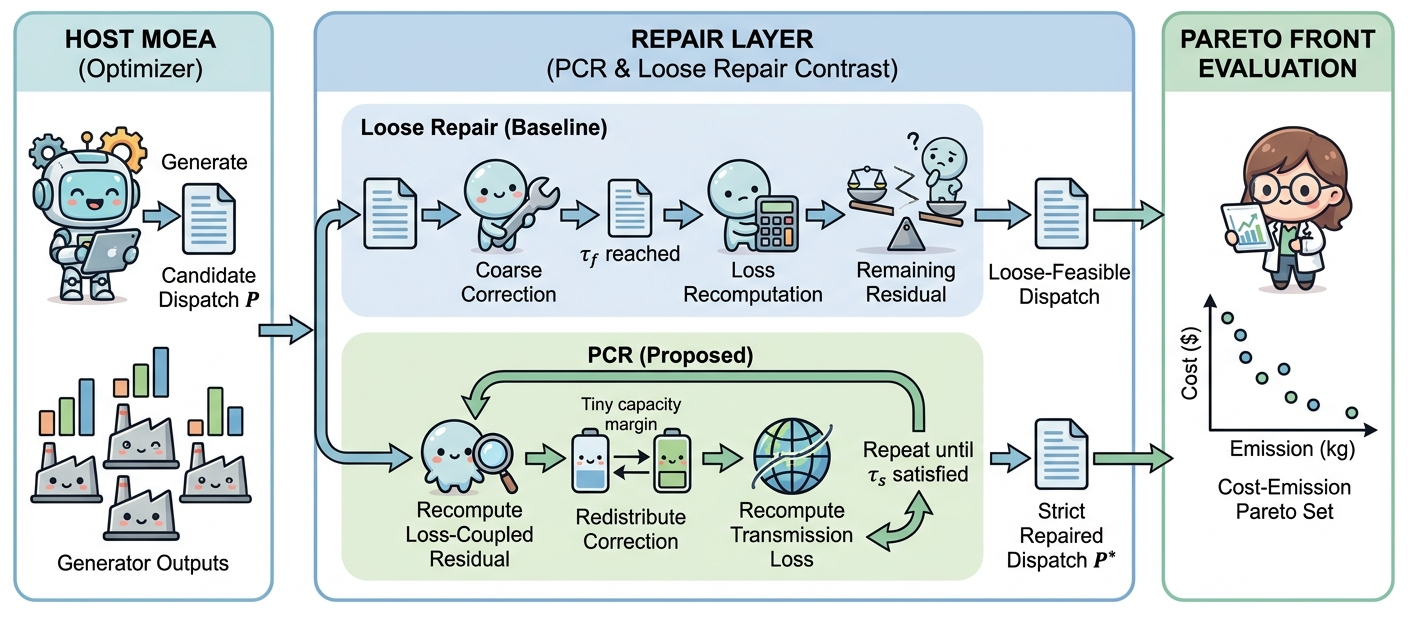
Figure 1 gives the central intuition: when a loose feasibility threshold hides residual mismatch, Pareto-front indicators should be interpreted together with the precision of the repaired physical balance.
The paper makes four bounded contributions. First, it formulates PCR as a conservative repair refinement for loss-constrained EED/CEED that tightens the final power-balance residual while preserving a capacity-margin correction path. Second, it evaluates the same repair component across three MOEA backbones, NSGA-II, MOEA/D, and MOPSO-CD, instead of tying the contribution to one optimizer. Third, it strengthens the experimental basis by using two audited benchmarks, IEEE 30-bus 6-unit EED and SAGE/Basu 10-unit CEED, with 30 independent seeds per condition and frozen HV/IGD reference construction. Fourth, it reports optimizer metrics and engineering quantities together, including feasibility, balance mismatch, physical objective summaries, runtime, and nonparametric effect statistics, so that the runtime cost of stricter residual control is visible rather than hidden.
The remainder of the paper is organized as follows. Section 2 reviews dispatch optimization and constraint handling. Section 3 defines the problem, PCR mechanism, benchmarks, and protocol. Section 4 reports the formal results. Section 5 interprets the engineering tradeoff and claim boundary. Section 6 concludes the paper.
2. Related Work
2.1. Economic Emission Dispatch
Classical economic dispatch minimizes generation cost subject to demand balance and generator operating limits. EED extends this setting by adding emission objectives or emission-related constraints [1,2,4]. Multi-objective EED is attractive because it preserves the tradeoff between economic and environmental objectives instead of requiring a single fixed weight [3]. Later dispatch studies broadened the setting to dynamic dispatch, renewable resources, wind power, electric vehicles, and combined heat-and-power systems [10,11,12,13,14,15,16]. The present work is narrower: it focuses on feasibility repair quality for loss-constrained EED/CEED benchmarks.
2.2. MOEA Backbones for Dispatch
NSGA-II is widely used because nondominated sorting and crowding distance provide a practical balance between convergence and diversity [5]. MOEA/D decomposes the multi-objective problem into scalar subproblems and can show different behavior on structured Pareto fronts [6]. Multi-objective particle swarm methods provide another search dynamic based on swarm movement and leader selection [7]. These algorithm families are used here as carriers for the repair operator. This design helps separate the repair contribution from the behavior of a single optimizer backbone.
2.3. Constraint Handling and Repair
Constraint handling in evolutionary optimization includes penalty functions, feasibility rules, decoders, and repair operators [8,9]. Recent dispatch studies continue to treat constraint handling as a substantive algorithmic component rather than a minor coding detail [17]. For EED/CEED, repair is especially natural because the final dispatch should satisfy a physical balance relation. However, a repair that merely crosses a loose feasibility threshold may not be sufficient for engineering reporting. PCR therefore focuses on residual precision while keeping the correction conservative.
3. Materials and Methods
3.1. Problem Formulation
For a system with n generation units, the decision vector is
where each unit satisfies
The two objective functions are fuel cost and emission :
For the CEED benchmark, the executable formulation includes valve-point cost and exponential emission terms where specified by the audited benchmark constants. The loss-coupled balance residual is
where is demand and is the transmission loss computed from the benchmark loss coefficients. A dispatch is considered feasible when is below the formal feasibility tolerance, but PCR optimizes for a stricter residual tolerance during repair.
3.2. Precision-Controlled Conservative Repair
The current repair baseline uses capacity margins to redistribute the balance mismatch while respecting generator bounds. PCR keeps this conservative correction direction but changes the stopping criterion. Instead of stopping once a loose feasibility tolerance is reached, PCR iterates until a stricter residual threshold is met or the repair limit is reached. Let denote the formal feasibility tolerance and denote the stricter repair tolerance, with . In the formal experiments, MW, MW, and the strict repair cap is 50 iterations.
PCR is formulated as a constrained local correction around a candidate dispatch. For a candidate generated by the host optimizer, the repair seeks a small correction such that
while
The correction is conservative in two senses. It is bounded by the available upward or downward margin of each generator, and it is used only to repair the equality residual before the dispatch is evaluated. It does not introduce a new scalarized objective, penalty coefficient, leader archive, or selection rule.
For a candidate dispatch, PCR uses the same capacity-margin direction as the current repair but applies it to the stricter tolerance. At iteration k, the clipped dispatch is and the residual is . If , generation is excessive and the active units are those with downward margin . If , generation is insufficient and the active units are those with upward margin . The correction assigned to each active unit is proportional to its available margin:
where is the active set in the needed correction direction and is the corresponding upward or downward margin. Units with no margin in the required direction are excluded from . The residual is recomputed after every correction because changes with the dispatch vector.

Table 1.
PCR pseudocode used in the formal experiments.
| Input: candidate dispatch P, bounds , loss model , , , maximum strict iterations . |
| Step 1: Clip to generator bounds. |
| Step 2: Recompute . If , return . |
| Step 3: Build the active set from units with downward margin when and upward margin when . Stop if no useful active margin remains. |
| Step 4: Redistribute r over the active units in proportion to the available margin, clip to bounds, and recompute r. |
| Step 5: Repeat Steps 3–4 until or is reached. If the strict path still fails, a loss-sensitivity recovery candidate may be evaluated, but diagnostics show this path was not triggered in the reported runs. |
| Output: repaired dispatch vector used for objective evaluation and final reporting. |
The iterative form is needed because depends on the repaired dispatch. A one-shot redistribution can reduce the mismatch computed at the old point but leave a residual after losses are recomputed. PCR therefore recomputes the residual after each conservative correction and continues until the stricter tolerance is achieved. This is the main difference from the current repair baseline: both repairs use the same broad physical direction, but PCR applies a stricter residual target and a repeated loss-coupled correction.
The implementation also contains a lazy recovery safeguard for cases in which the strict conservative repair cannot reduce the residual sufficiently. Formal diagnostics show that this safeguard was not triggered in the reported runs. Therefore, the empirical method claim in this manuscript is limited to precision-controlled conservative repair, not to recovery-path superiority. This distinction prevents a misleading mechanism claim: the reported gains are attributed to stricter conservative residual control and its interaction with the host MOEA, not to a dormant fallback path.
Figure 2 summarizes the implementation architecture and the evidence-supported claim boundary.
3.3. Integration with Host Optimizers
PCR is inserted at the same location for all three host optimizers. Each host first generates candidate dispatch vectors according to its own search rule. NSGA-II uses its population variation and nondominated sorting logic; MOEA/D uses decomposition-based neighborhood search; MOPSO-CD uses particle movement and archive selection. PCR is then applied to each candidate before fuel cost, emission, balance residual, feasibility, and Pareto-quality metrics are recorded. The repaired candidate, not the unrepaired one, is the effective dispatch passed to objective evaluation.
This integration choice is deliberately conservative. The study does not retune the host optimizers to favor PCR, and it does not compare different optimizers as if they were the proposed method. Each main comparison keeps the benchmark and host optimizer fixed and changes only the repair layer. The experimental question is therefore: when the same multi-objective search backbone is used, does stricter conservative repair improve residual precision and front quality relative to the current repair baseline?
The answer is evaluated at the population-output level rather than by a single dispatch point. For each seed, the final nondominated set is summarized by HV, IGD, feasibility, residual mismatch, physical cost and emission representatives, and runtime. This is appropriate for EED/CEED because the output of interest is an approximate tradeoff set. However, PCR is still a repair operator, not a preference articulation method; it does not decide which point on the cost–emission tradeoff should be selected by an operator.
3.4. Benchmark Audit and Benchmark Definitions
Two benchmark systems are used:
- IEEE30 6-unit EED: a 6-unit loss-constrained EED benchmark used as the small-system case.
- SAGE/Basu 10-unit CEED: a 10-unit CEED benchmark with 2000 MW demand, valve-point effects, quadratic plus exponential emission, and a loss matrix. This benchmark is used as the larger audited case.
Both benchmark definitions are implemented in the reproducible experiment package. During the refinement process, candidate datasets with incomplete or malformed parameters were excluded. The manuscript uses only benchmark constants that passed formula–code consistency checks.
The IEEE30 case has six thermal units, MW, nonzero transmission-loss coefficients, generator lower bounds of MW, and upper bounds of MW. The SAGE/Basu case has ten units, MW, lower bounds of MW, and upper bounds of MW. The latter case includes the matrix loss model with zero and terms, quadratic fuel coefficients, valve-point coefficients, quadratic emission coefficients, and exponential emission coefficients. The executable audit verified that the implemented emission formula is
with for the IEEE30 case and nonzero exponential terms for the 10-unit CEED case.
This audit is important because larger EED/CEED benchmarks are easy to misuse when source tables contain scaled loss matrices, fixed-output units, or missing exponential-emission terms. The 10-unit case was retained only after the source parameter extraction, loss-matrix scaling, fixed unit boundary, and formula behavior were checked against the executable code. These checks do not replace formal experiments, but they ensure that the reported larger benchmark is not an artifact of an incomplete dataset transcription.
3.5. Experimental Protocol
PCR is evaluated against the current repair baseline across three algorithm families: NSGA-II, MOEA/D, and MOPSO-CD. For each benchmark–algorithm–method condition, 30 independent seeds are run with population size 100 and 300 generations. The formal outputs are stored in the reproducible experiment package and assembled into combined outputs for statistics.
The reported metrics are:
- hypervolume (HV), where higher is better;
- inverted generational distance (IGD), where lower is better;
- feasibility rate and absolute balance mismatch;
- physical cost and emission summaries;
- wall-clock runtime;
- Mann–Whitney U tests and Cliff’s delta for repair comparisons.
Reference sets for HV and IGD are frozen by the reproducible summary pipeline before statistical comparison. For each benchmark, the pipeline merges the raw physical final fronts from all reported conditions, takes the nondominated union as the IGD reference front, and sets the HV reference point to the componentwise maximum plus 10% of the observed objective span. The indicators are computed in the original physical objective units without additional objective normalization. This convention makes the reported values directly tied to cost and emission scales, but it also means that HV and IGD should be interpreted within a benchmark rather than compared across benchmarks.
The primary comparison in this manuscript is PCR versus the current repair baseline. To calibrate whether the observed gains are merely an artifact of asking for a smaller tolerance, an additional first-order projection baseline is reported as a compact secondary comparison. This projection baseline uses the local loss-coupled balance gradient to form a bounded equality correction under the same strict residual target. Other intermediate or exploratory variants were used during method selection, but they are not presented as the proposed method because they did not provide a stronger final evidence boundary than PCR. This keeps the paper aligned with its evidence: the retained method is the simpler precision-controlled conservative repair layer whose effect is reproducible across the two benchmarks and three host optimizers.
3.6. Reproducibility and Reporting Safeguards
The formal experiment package stores raw JSON outputs, frozen reference artifacts, aggregate tables, repair diagnostics, and the scripts used to regenerate the manuscript tables and figures. To avoid overstating the result, the manuscript reports both search-quality metrics and repair-quality diagnostics. Feasibility rate is included, but it is not used as the headline result because it is saturated at for the reported current-repair and PCR conditions. The more informative feasibility-quality measure is the mean absolute balance mismatch.
Runtime is also treated as part of the result rather than as a nuisance variable. PCR asks the repair loop to meet a stricter residual tolerance, so a runtime increase is expected. A method that improves balance precision by silently increasing repair work would be incomplete from an engineering perspective. The reported runtime columns and repair-call diagnostics make this tradeoff explicit.
4. Results
4.1. Main Formal Results
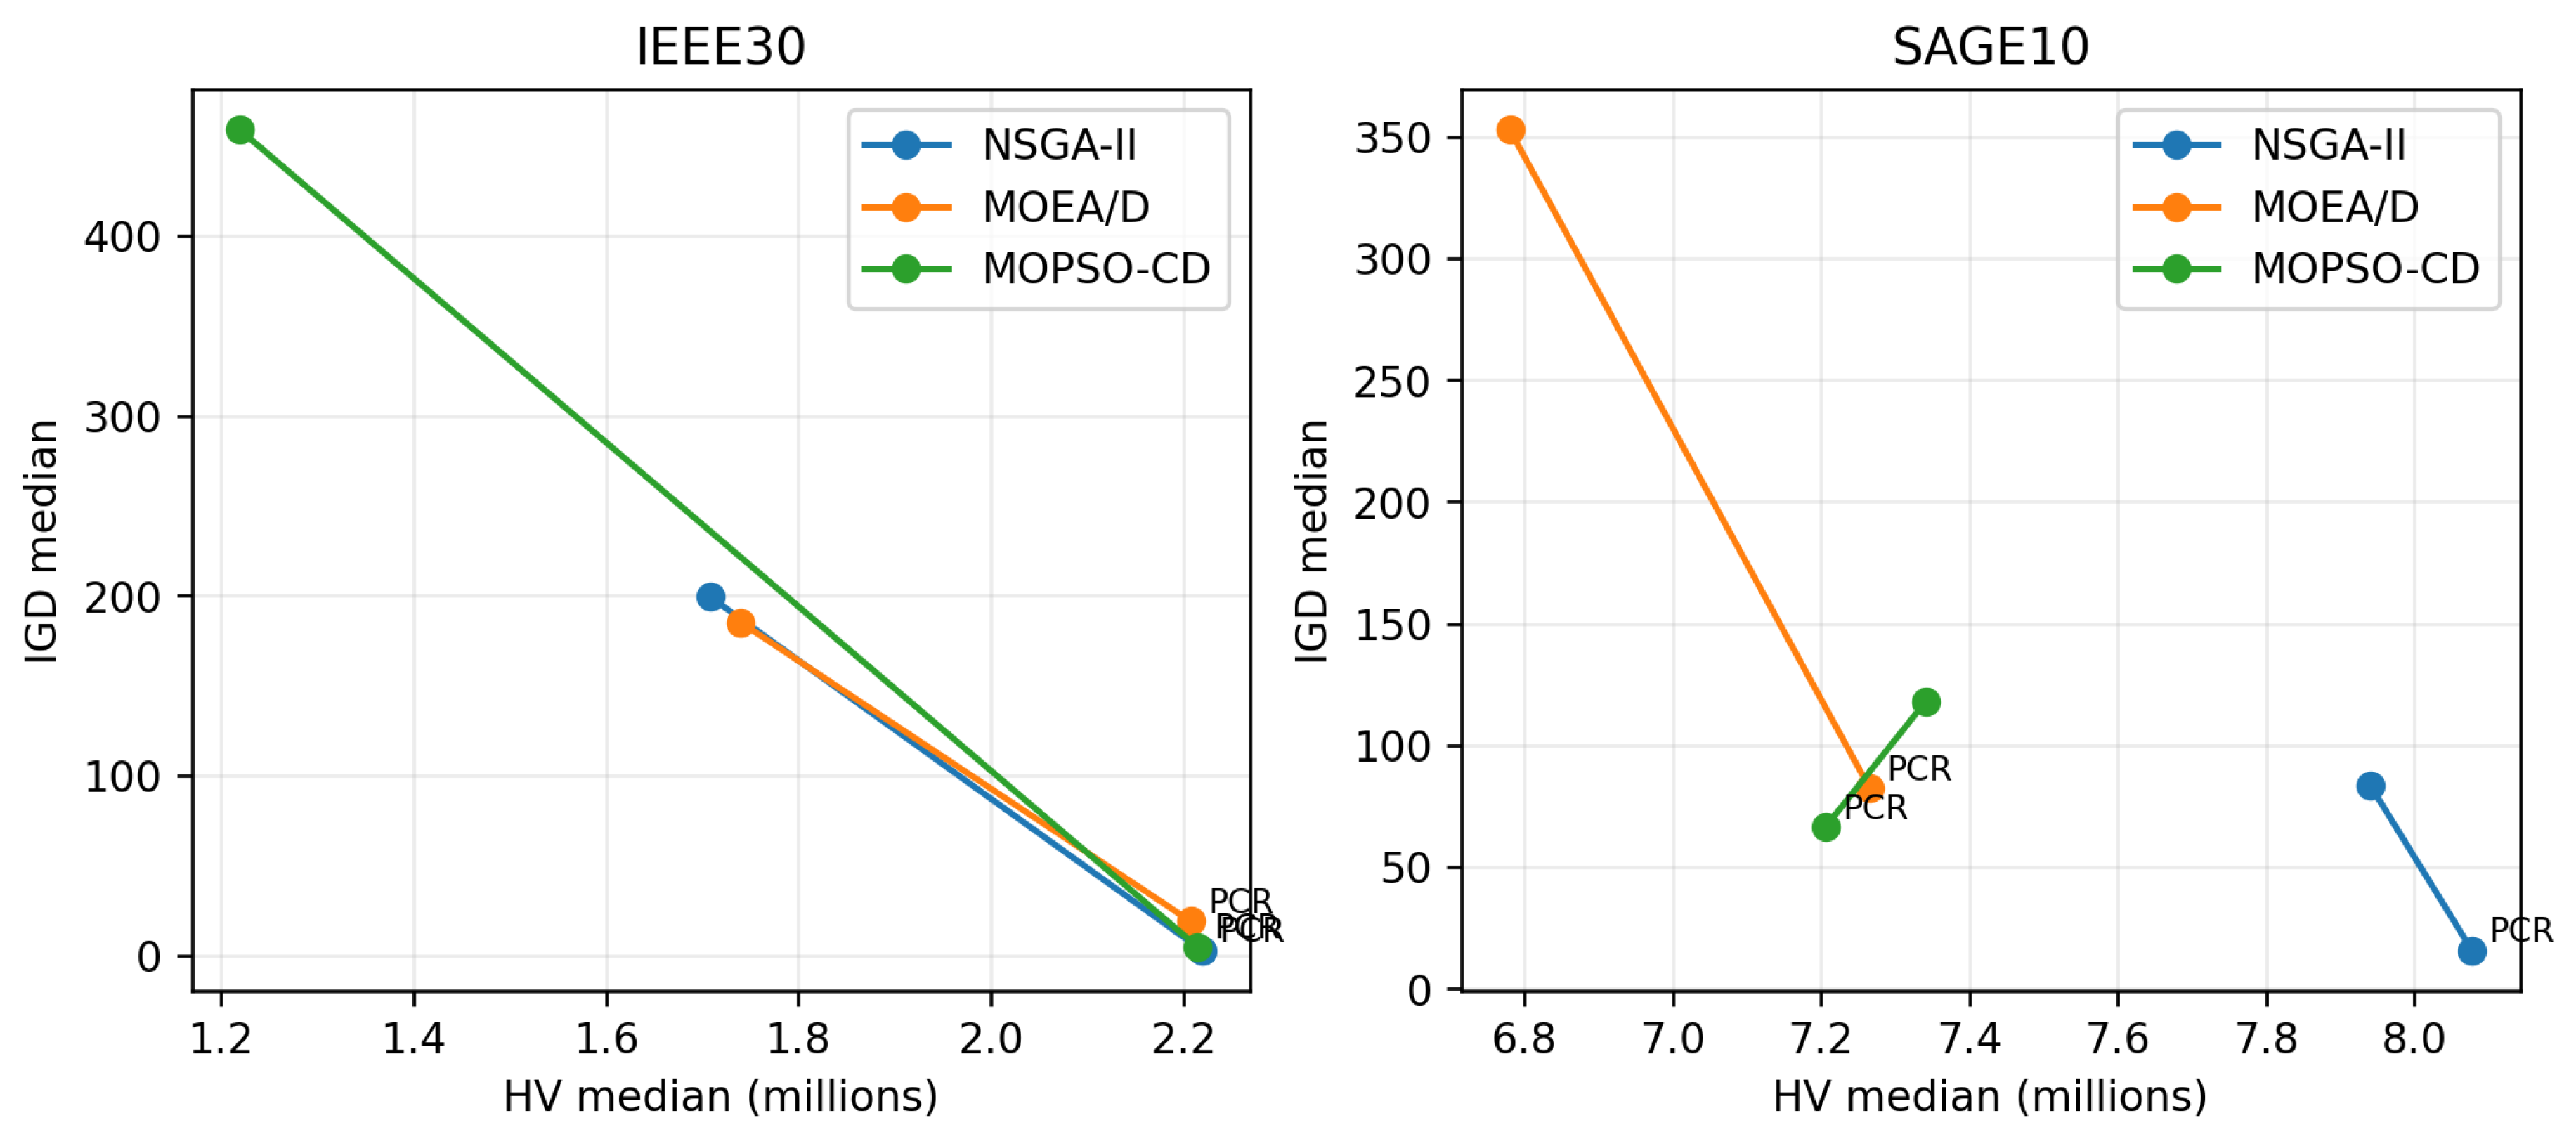
Table 2 reports the formal paired results for the current repair baseline and PCR. PCR improves median IGD for all six benchmark–algorithm pairs. It also improves median HV for five of the six pairs; the only exception is MOPSO-CD on the SAGE/Basu benchmark, where HV is slightly lower while IGD and balance residual improve substantially.
The most consistent engineering effect is the reduction in balance mismatch. On the SAGE/Basu benchmark, the current repair conditions have mean absolute mismatch around to MW, whereas PCR reduces the mismatch to approximately MW. On IEEE30, PCR also reduces mismatch to approximately MW.
The magnitude of this reduction is more informative than the feasibility-rate column alone. All reported current-repair and PCR conditions have a mean feasibility rate of under the formal feasibility tolerance, so a binary feasible/infeasible endpoint would imply that no repair-quality difference exists. The residual metric shows the opposite: the current repair can satisfy the reporting threshold while still leaving a larger loss-coupled imbalance. PCR turns this saturated feasibility setting into a measurable engineering improvement by controlling the residual itself.
The Pareto metrics indicate that stricter repair did not merely improve feasibility quality by damaging the search output. Median IGD decreases in every benchmark–algorithm pair, with particularly large changes for NSGA-II and MOPSO-CD on IEEE30. Median HV also increases in five of six cases. The single HV exception, SAGE/Basu with MOPSO-CD, is not hidden; it is reported as a lower observed HV together with improved IGD and residual precision. This mixed metric behavior is plausible because HV is sensitive to reference-point scaling and extreme points, whereas IGD captures a different aspect of front approximation. The result therefore supports a bounded claim: PCR improves residual precision and generally improves front quality, but it should not be described as uniformly improving every Pareto indicator in every host.
4.2. Statistical Repair Comparison
Table 3 summarizes the statistical comparisons of PCR against current repair. All six benchmark–algorithm pairs are classified as strong positive transfer by the formal statistics pipeline. The MOPSO-CD result on SAGE/Basu is deliberately interpreted with care: the HV delta is negative, but IGD and mismatch improve, and the overall classification remains positive.
The statistical table uses benefit-coded deltas, so positive IGD and mismatch deltas mean that PCR improves the metric even though the raw metric itself is minimized. Runtime deltas are negative because PCR is slower. This convention makes the tradeoff visible in one row: the proposed repair improves residual precision and distance-to-reference-front metrics, while requiring additional repair work. Because all six rows have negative runtime deltas, runtime should be treated as a stable cost of the method rather than as an implementation accident.
4.3. Projection Baseline
Table 4 reports the secondary first-order projection baseline. On IEEE30, projection and PCR are close, and projection is slightly better on several indicators. On the larger SAGE/Basu CEED case, however, projection is clearly weaker than PCR in HV, IGD, and residual precision across all three host optimizers. This supports the choice of PCR as the main method: a local gradient projection can be competitive on the smaller case, but the conservative capacity-margin residual loop transfers more reliably to the larger audited case.
Figure 3.
Pareto-metric benefit of PCR over current repair. PCR improves IGD for all benchmark–algorithm pairs and improves HV for five of six pairs.
Figure 3.
Pareto-metric benefit of PCR over current repair. PCR improves IGD for all benchmark–algorithm pairs and improves HV for five of six pairs.
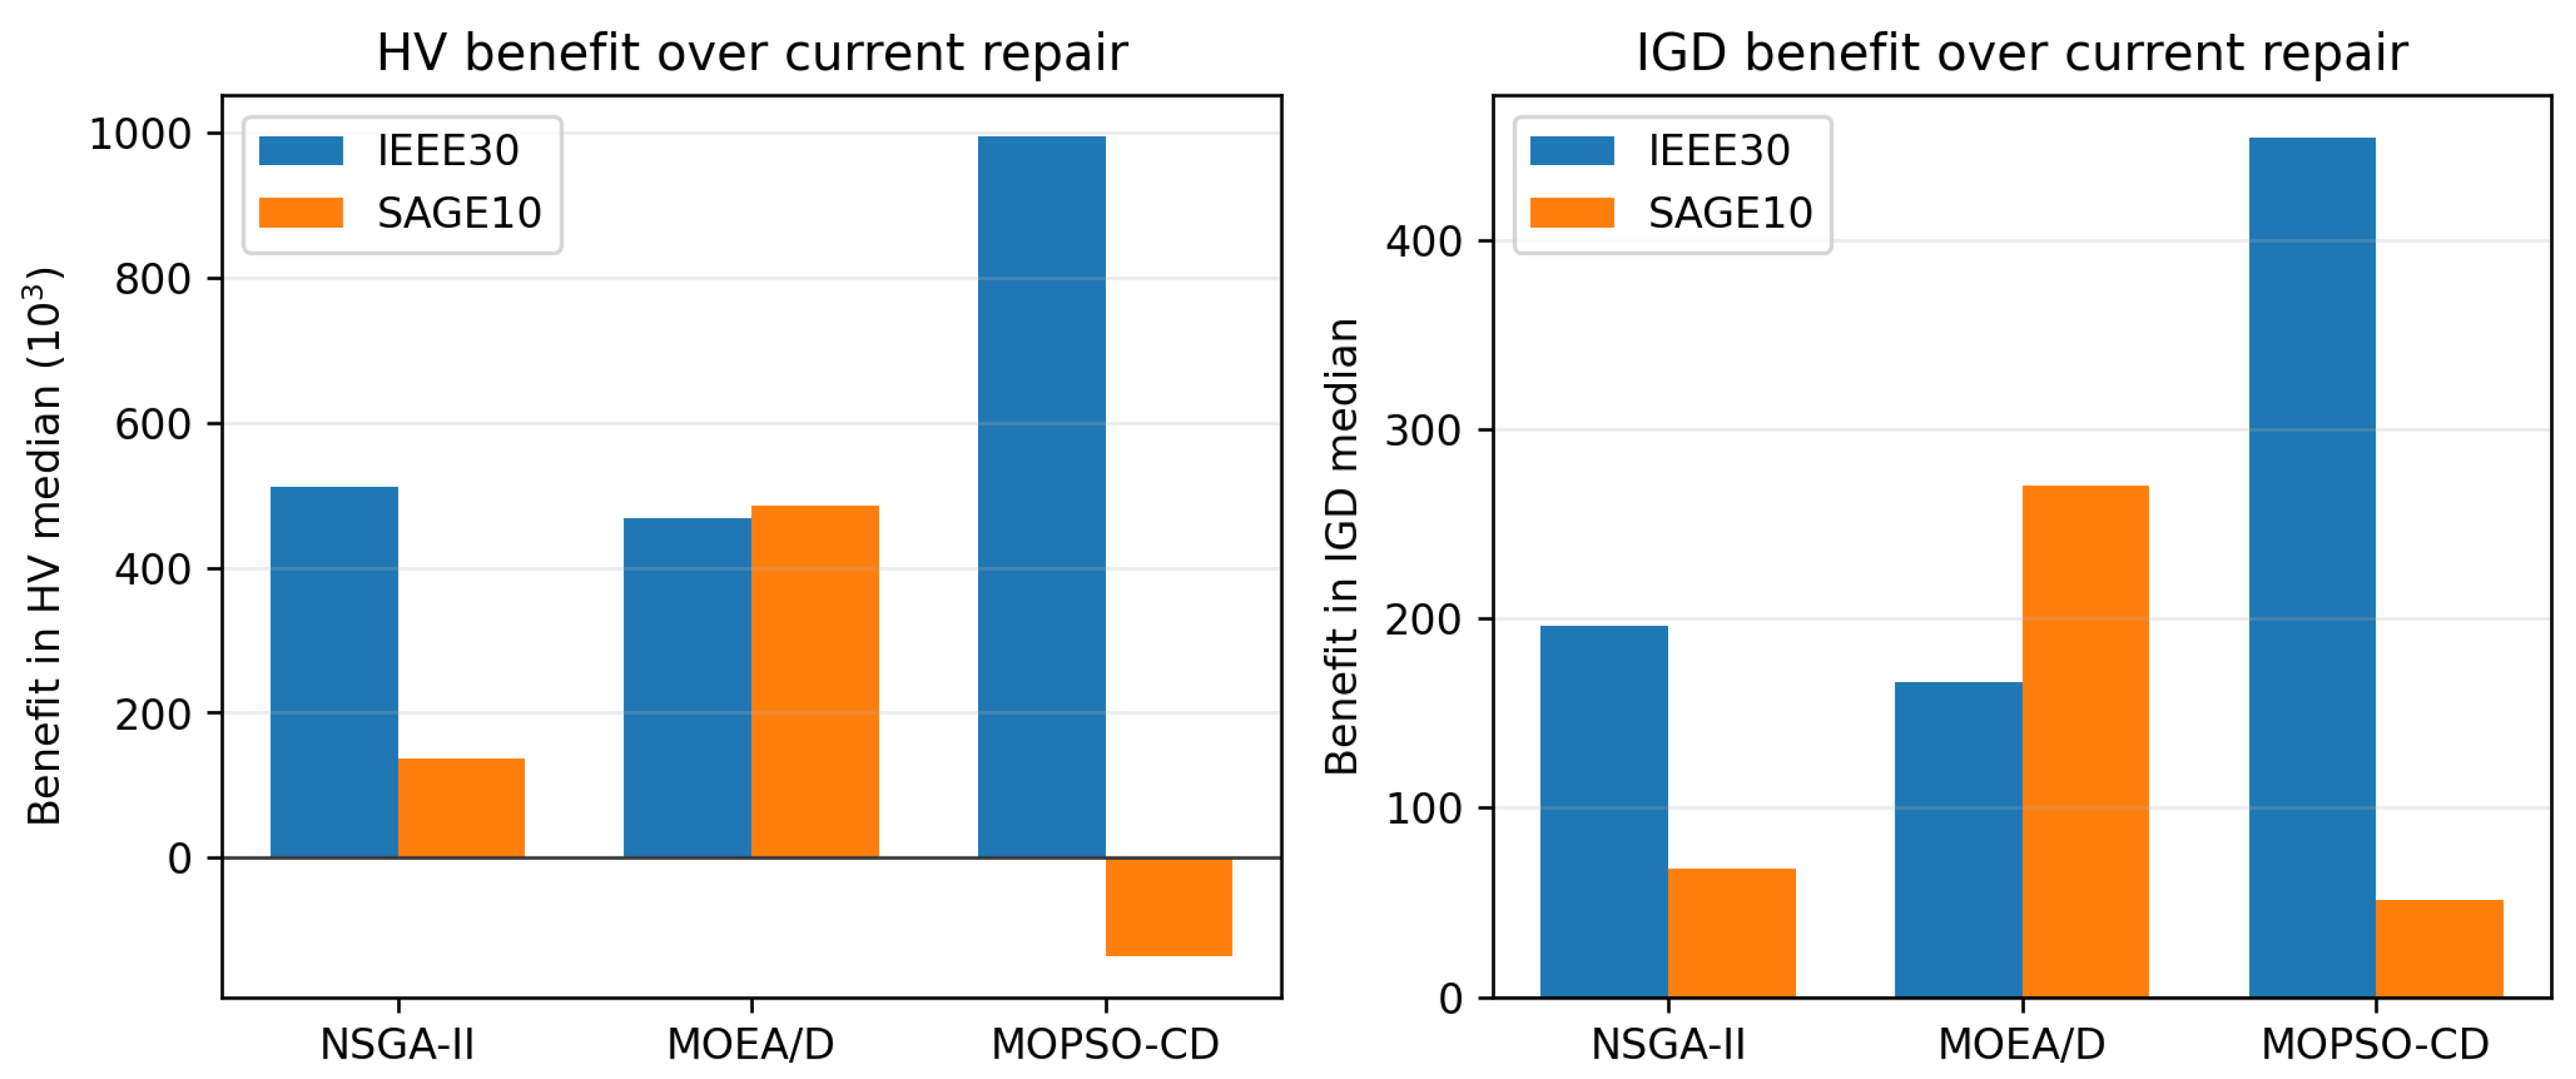
Figure 4.
Shift in median HV–IGD summaries from current repair to PCR. The desired movement is toward higher HV and lower IGD.
Figure 4.
Shift in median HV–IGD summaries from current repair to PCR. The desired movement is toward higher HV and lower IGD.
4.4. Residual Precision and Runtime Tradeoff
Figure 5 shows the main engineering tradeoff. PCR greatly reduces the balance residual, but the stricter repair loop increases runtime. Runtime overhead is statistically significant for all six comparisons. This cost is not hidden: it is the price of moving from loose feasibility repair to stricter residual-controlled dispatch reporting.
4.5. Sensitivity to the Strict Residual Tolerance
Table 5 calibrates the strict tolerance for NSGA-II on both benchmarks. Reducing from to monotonically tightens the achieved mean balance mismatch. The Pareto indicators stay in the same range, while runtime increases modestly relative to the looser setting. The formal paper setting, , is therefore a balanced choice: it reaches the MW residual scale in the final populations without paying for the most aggressive tolerance.
4.6. Repair Diagnostics
Table 6 reports repair diagnostics. Across all formal runs, the strict conservative repair candidate is selected, with approximately seven strict repair iterations on average. The lazy physics-recovery path is not triggered in the reported formal runs. This diagnostic result is important because it prevents overclaiming: the measured gains should be attributed to precision-controlled conservative repair rather than to physics-informed recovery.
The diagnostics also explain why PCR is slower. The repair is applied many times during population evolution, and the strict path typically requires repeated residual recomputation. The average strict iteration count is close to seven across both benchmarks and all three hosts. In contrast, the current repair baseline performs a looser correction and terminates earlier. The runtime overhead is therefore mechanically tied to the stricter residual requirement, which is why the method is best suited to offline planning studies, benchmark comparisons, and studies where final dispatch feasibility quality is more important than the fastest possible repair pass.
5. Discussion
5.1. What the Evidence Supports
The evidence supports PCR as a bounded engineering repair refinement. Across two benchmarks and three algorithm families, PCR improves the final residual precision and generally improves Pareto indicators relative to the current repair baseline. This directly addresses a practical weakness in repair-based EED/CEED experiments: feasible final populations can still carry unnecessarily large balance residuals.
The result also changes how the repair contribution should be described. A weak version of the story would be “repair only,” which sounds like a final clean-up step after optimization. The formal design is stronger than that: PCR is embedded in candidate evaluation during the search, so repaired dispatch vectors influence the objective values and nondominated comparisons seen by the host optimizer. At the same time, the method remains a repair component rather than a new optimizer. This middle position is the defensible contribution: a search-integrated feasibility-quality layer that can be attached to multiple MOEA backbones.
From a dispatch perspective, the main advantage is not simply that the final numbers look cleaner. Loss-coupled power balance is part of the physical model. If two approximate Pareto fronts are compared while carrying different residual-mismatch levels, the comparison is partly confounded by feasibility quality. PCR reduces this confounding by making the repaired dispatches satisfy a stricter equality residual before objective summaries are interpreted. That makes the reported cost–emission front more credible as a dispatch result.
5.2. What the Evidence Does not Support
The results do not support a broad claim that PCR is a universally superior optimizer. PCR is a repair component, not a replacement for NSGA-II, MOEA/D, or MOPSO-CD. The results also do not support claiming that physics-informed recovery drives the gains, because the formal diagnostics show zero physics-recovery calls in the reported runs. This limitation is a useful guardrail against overstating the mechanism.
The evidence also does not support claiming that feasibility rate itself is improved, because the current-repair baseline already reaches a feasibility rate of one in the reported comparisons. The improvement is in residual precision under a stricter tolerance, not in crossing the coarse feasibility threshold. Likewise, the SAGE/Basu MOPSO-CD case prevents a blanket claim that HV always improves. The appropriate interpretation is that PCR gives consistent residual and IGD benefits, mostly positive HV behavior, and a consistent runtime penalty.
5.3. Runtime as an Engineering Tradeoff
PCR increases runtime because it asks the repair loop to meet a stricter residual threshold. The overhead is significant in all comparisons, but the median increase is measured in seconds rather than orders of magnitude under the formal settings. Whether this overhead is acceptable depends on the application. For offline planning studies and reproducible benchmark comparisons, stricter residual reporting may be worth the cost. For real-time dispatch, adaptive tolerances or stopping rules would be needed.
This tradeoff also suggests a practical selection rule. If a study is primarily concerned with fast approximate exploration, the current repair may be acceptable when the formal feasibility tolerance is loose and residual mismatch is not central to the claim. If the study reports detailed physical dispatch values, compares Pareto fronts across methods, or uses a larger loss-constrained CEED case, PCR provides a more conservative reporting standard. The additional seconds measured here are therefore not an accidental drawback; they are the computational price of a stricter engineering guarantee.
5.4. Limitations
The study has several limitations. First, only two benchmarks are used, although the second benchmark is larger and includes CEED features. Second, the proposed repair is tested across three MOEA backbones but not across every possible optimizer or constraint-handling method. Third, the work does not model renewable uncertainty, electric vehicles, or dynamic time-coupled dispatch, which are important in recent energy-system studies [12,13,15,16]. Finally, PCR improves feasibility precision with a runtime cost, and future work should study adaptive residual tolerances.
Another limitation is that the method is evaluated as an engineering repair layer rather than as a theoretical projection operator with a proof of optimality. The conservative redistribution rule is designed to be stable, bounded, and easy to audit, not to solve a global minimum-distance projection problem at every repair call. This is acceptable for the present contribution, but future work could compare PCR with exact or quasi-Newton equality projection methods under matched runtime budgets. The present evidence should therefore be read as empirical repair evidence for loss-constrained EED/CEED benchmarks, not as a general theorem about equality-constrained multiobjective optimization.
6. Conclusions
This paper presented PCR, a precision-controlled conservative repair mechanism for loss-constrained EED/CEED. PCR keeps a conservative capacity-margin correction direction but tightens the final loss-coupled power-balance residual before repaired dispatch vectors are evaluated by the host optimizer. The method is deliberately framed as a repair-layer contribution rather than as a new multiobjective optimizer. This boundary is important: the evidence supports improving the feasibility-quality layer attached to NSGA-II, MOEA/D, and MOPSO-CD, not replacing those optimizers.
In formal experiments on IEEE30 6-unit EED and SAGE/Basu 10-unit CEED, PCR achieved strong positive transfer over the current repair baseline for all three host optimizers. It reduced mean absolute balance mismatch to approximately MW scale and improved IGD for every benchmark–algorithm pair. HV improved in five of six comparisons, while the SAGE/Basu MOPSO-CD case showed lower observed HV but better IGD and residual precision. This is a useful and honest outcome: PCR does not improve every indicator in every setting, but it consistently strengthens the physical feasibility quality of the reported dispatch fronts.
The method also introduced significant runtime overhead, which should be treated as an explicit engineering tradeoff rather than ignored. For offline planning, reproducible benchmark studies, and dispatch papers where equality-residual credibility matters, the additional repair cost may be justified. For real-time operation, adaptive precision thresholds, early stopping, or hybrid repair schedules should be studied before deployment. Future work should also evaluate additional verified large-scale benchmarks, uncertainty-aware dispatch, renewable and electric-vehicle scenarios, and exact projection baselines under matched runtime budgets.
Supplementary Materials
The supplementary archive supplied with this submission contains the formal raw outputs, frozen reference artifacts, summary tables, manuscript-generation scripts, figures, tables, and traceability notes supporting the reported PCR results.
Author Contributions
Conceptualization, B.C. and H.F.; methodology, H.F.; software, H.F.; validation, B.C., Z.L., B.L., H.F. and Y.Y.; formal analysis, H.F.; writing–original draft preparation, H.F.; writing–review and editing, B.C., Z.L., B.L., H.F. and Y.Y. All authors have read and agreed to the published version of the manuscript.
Funding
This research was funded by the State Grid Corporation of China project “Research and Application of Key Technologies for Intelligent Assisted Decision-Making in Dispatching Services Driven by Bidirectional Knowledge and Model Integration”, grant number 521300250006.
Institutional Review Board Statement
Not applicable.
Informed Consent Statement
Not applicable.
Data Availability Statement
The formal raw outputs, frozen reference artifacts, summary tables, manuscript-generation scripts, and supporting traceability notes are provided in the supplementary archive accompanying this article.
Conflicts of Interest
The authors declare no conflicts of interest. The funder had no role in the design of the study; in the collection, analyses, or interpretation of data; in the writing of the manuscript; or in the decision to publish the results.
References
- El-Keib, A.A.; Ma, H.; Hart, J.L. Environmentally constrained economic dispatch using the Lagrangian relaxation method. IEEE Trans. Power Syst. 1994, 9, 1723–1729. [Google Scholar] [CrossRef]
- Talaq, J.H.; El-Hawary, F.; El-Hawary, M.E. A summary of environmental/economic dispatch algorithms. IEEE Trans. Power Syst. 1994, 9, 1508–1516. [Google Scholar] [CrossRef]
- Abido, M.A. Environmental/economic power dispatch using multiobjective evolutionary algorithms. IEEE Trans. Power Syst. 2003, 18, 1529–1537. [Google Scholar] [CrossRef]
- Wood, A.J.; Wollenberg, B.F.; Sheble, G.B. Power Generation, Operation, and Control, 3rd ed.; Wiley: Hoboken, NJ, USA, 2014. [Google Scholar]
- Deb, K.; Pratap, A.; Agarwal, S.; Meyarivan, T. A fast and elitist multiobjective genetic algorithm: NSGA-II. IEEE Trans. Evol. Comput. 2002, 6, 182–197. [Google Scholar] [CrossRef]
- Zhang, Q.; Li, H. MOEA/D: A multiobjective evolutionary algorithm based on decomposition. IEEE Trans. Evol. Comput. 2007, 11, 712–731. [Google Scholar] [CrossRef]
- Coello Coello, C.A.; Pulido, G.T.; Lechuga, M.S. Handling multiple objectives with particle swarm optimization. IEEE Trans. Evol. Comput. 2004, 8, 256–279. [Google Scholar] [CrossRef]
- Coello Coello, C.A.; Lamont, G.B.; Van Veldhuizen, D.A. Evolutionary Algorithms for Solving Multi-Objective Problems, 2nd ed.; Springer: New York, NY, USA, 2007. [Google Scholar]
- Deb, K. An efficient constraint handling method for genetic algorithms. Comput. Methods Appl. Mech. Eng. 2000, 186, 311–338. [Google Scholar] [CrossRef]
- Basu, M. Dynamic economic emission dispatch using nondominated sorting genetic algorithm-II. Int. J. Electr. Power Energy Syst. 2008, 30, 140–149. [Google Scholar] [CrossRef]
- Mei, P.; Wu, L.; Zhang, H.; Liu, Z. A Hybrid Multi-Objective Crisscross Optimization for Dynamic Economic/Emission Dispatch Considering Plug-In Electric Vehicles Penetration. Energies 2019, 12, 3847. [Google Scholar] [CrossRef]
- Chen, M.R.; Zeng, G.Q.; Lu, K.D. Constrained multi-objective population extremal optimization based economic-emission dispatch incorporating renewable energy resources. Renew. Energy 2019, 143, 277–294. [Google Scholar] [CrossRef]
- Qiao, B.; Liu, J. Multi-objective dynamic economic emission dispatch based on electric vehicles and wind power integrated system using differential evolution algorithm. Renew. Energy 2020, 154, 316–336. [Google Scholar] [CrossRef]
- Xiong, G.; Shuai, M.; Hu, X. Combined heat and power economic emission dispatch using improved bare-bone multi-objective particle swarm optimization. Energy 2022, 244, 123108. [Google Scholar] [CrossRef]
- Nourianfar, H.; Abdi, H. Economic emission dispatch considering electric vehicles and wind power using enhanced multi-objective exchange market algorithm. J. Clean. Prod. 2023, 415, 137805. [Google Scholar] [CrossRef]
- Zou, D.; Ma, L.; Li, C.; Ouyang, H. Integration of the wind and solar power for the dynamic economic emission dispatch with the charging and discharging of plug-in electric vehicles. Eng. Appl. Artif. Intell. 2024, 138, 109293. [Google Scholar] [CrossRef]
- Qiao, B.; Liu, J.; Hao, X. A multi-objective differential evolution algorithm and a constraint handling mechanism based on variables proportion for dynamic economic emission dispatch problems. Appl. Soft Comput. 2021, 108, 107419. [Google Scholar] [CrossRef]
Figure 1.
Teaser summary of the paper. Conventional repair can produce dispatch vectors that are feasible under a loose reporting tolerance while still carrying visible loss-coupled balance residual. PCR tightens the residual through a conservative repair layer before front-quality claims are interpreted, while reporting the runtime cost of this stricter repair.
Figure 1.
Teaser summary of the paper. Conventional repair can produce dispatch vectors that are feasible under a loose reporting tolerance while still carrying visible loss-coupled balance residual. PCR tightens the residual through a conservative repair layer before front-quality claims are interpreted, while reporting the runtime cost of this stricter repair.
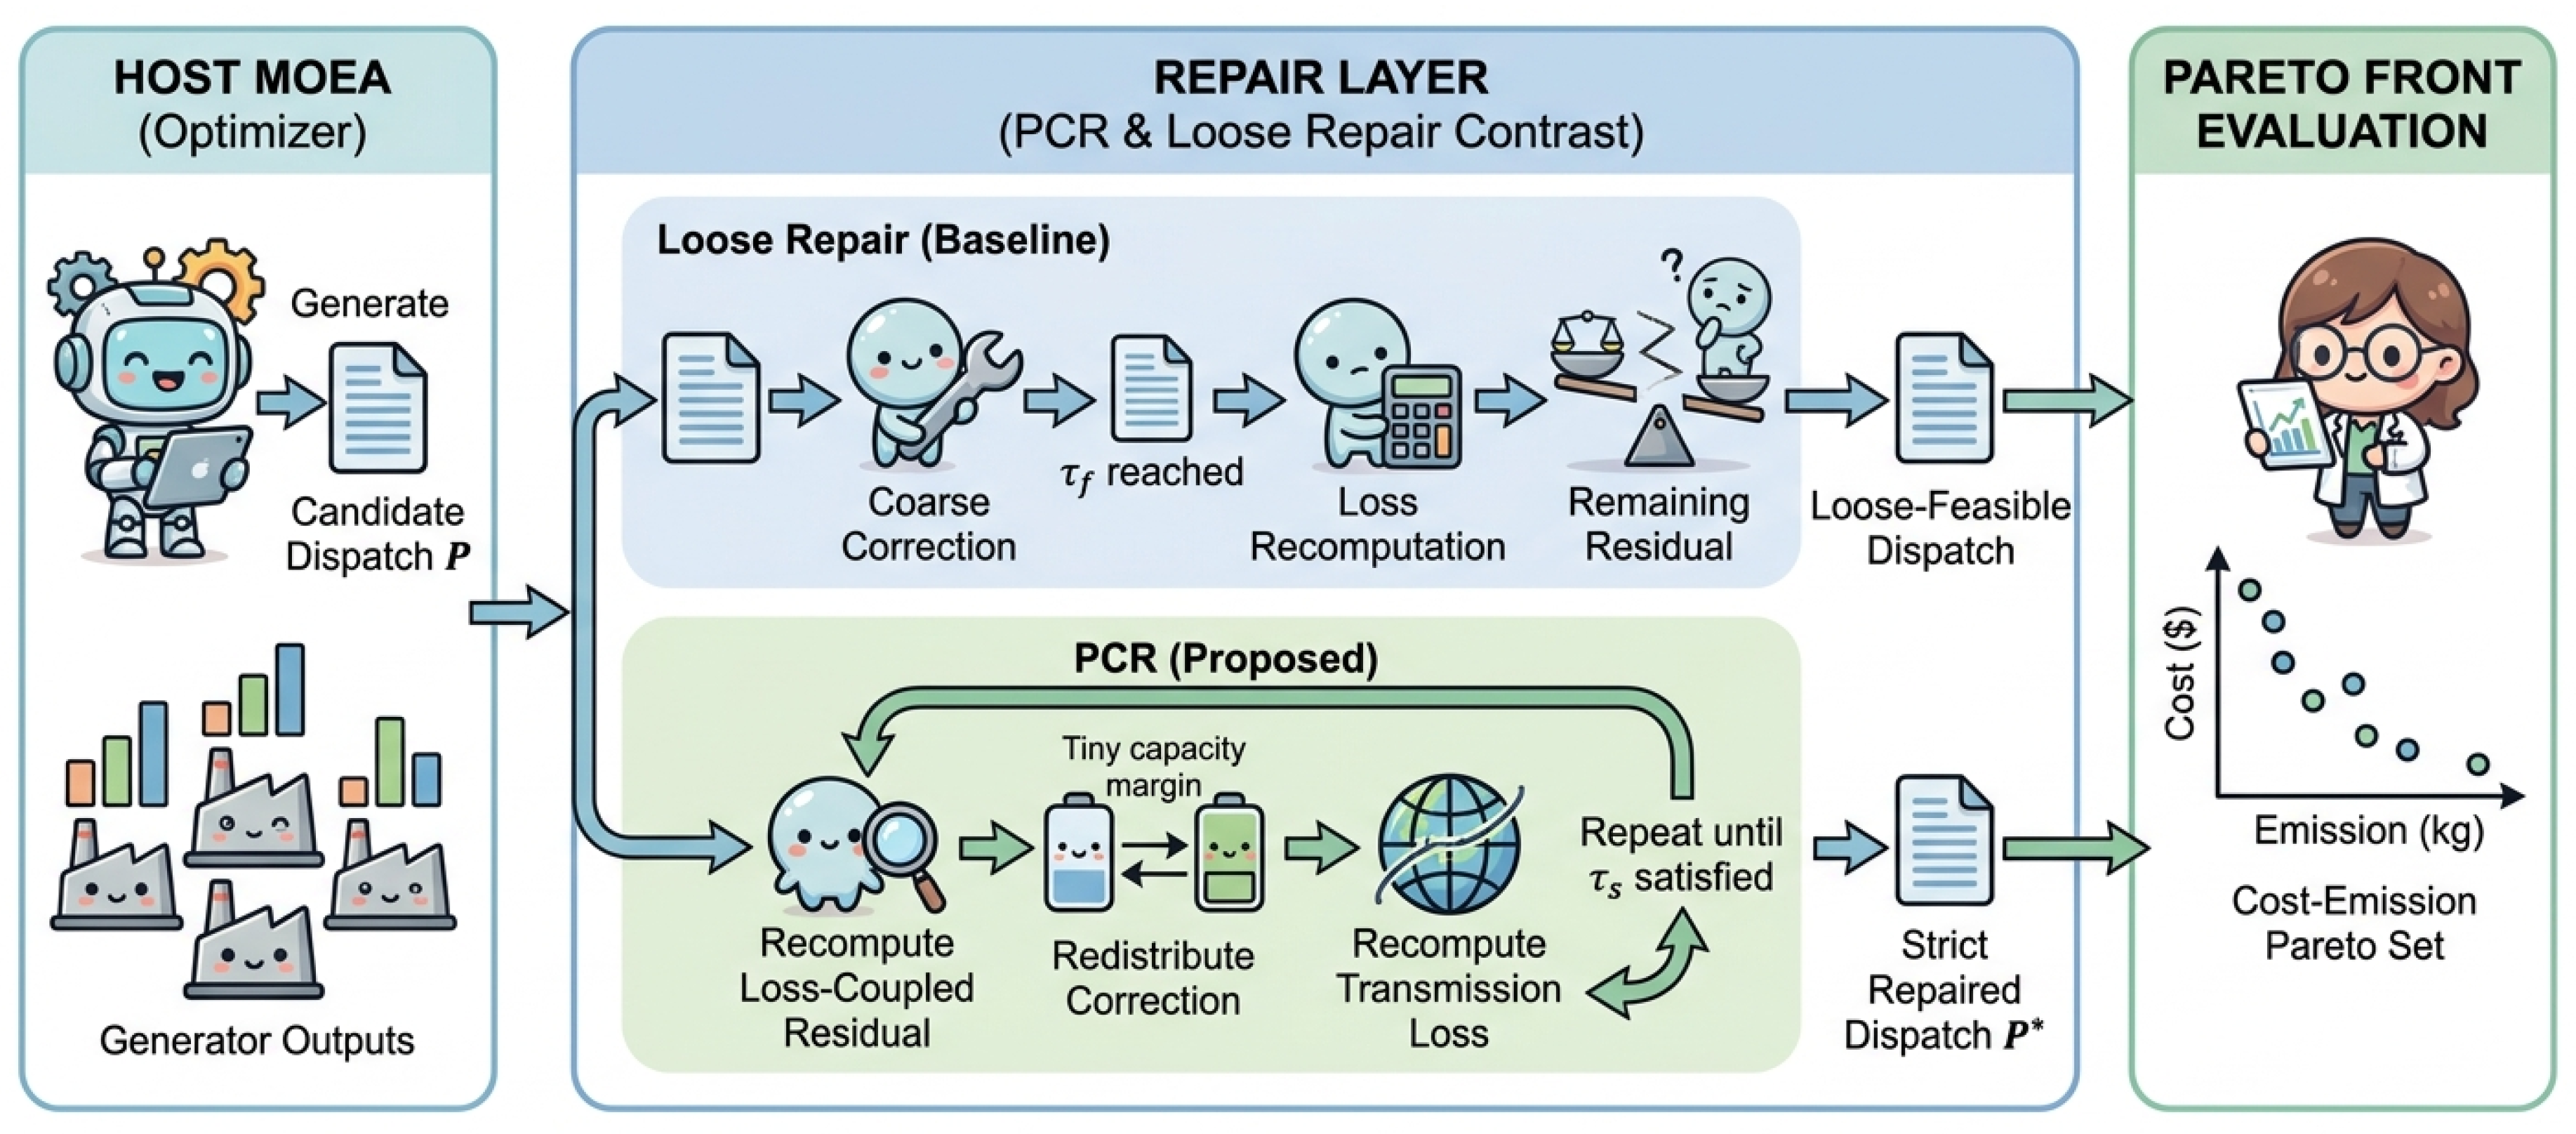
Figure 2.
PCR method architecture. Candidate dispatch vectors from the host MOEA are checked against the loss-coupled power-balance residual, corrected through conservative capacity-margin redistribution, tightened in a precision residual loop, and then returned to objective evaluation and Pareto selection. PCR changes the repair layer, not the search backbone.
Figure 2.
PCR method architecture. Candidate dispatch vectors from the host MOEA are checked against the loss-coupled power-balance residual, corrected through conservative capacity-margin redistribution, tightened in a precision residual loop, and then returned to objective evaluation and Pareto selection. PCR changes the repair layer, not the search backbone.
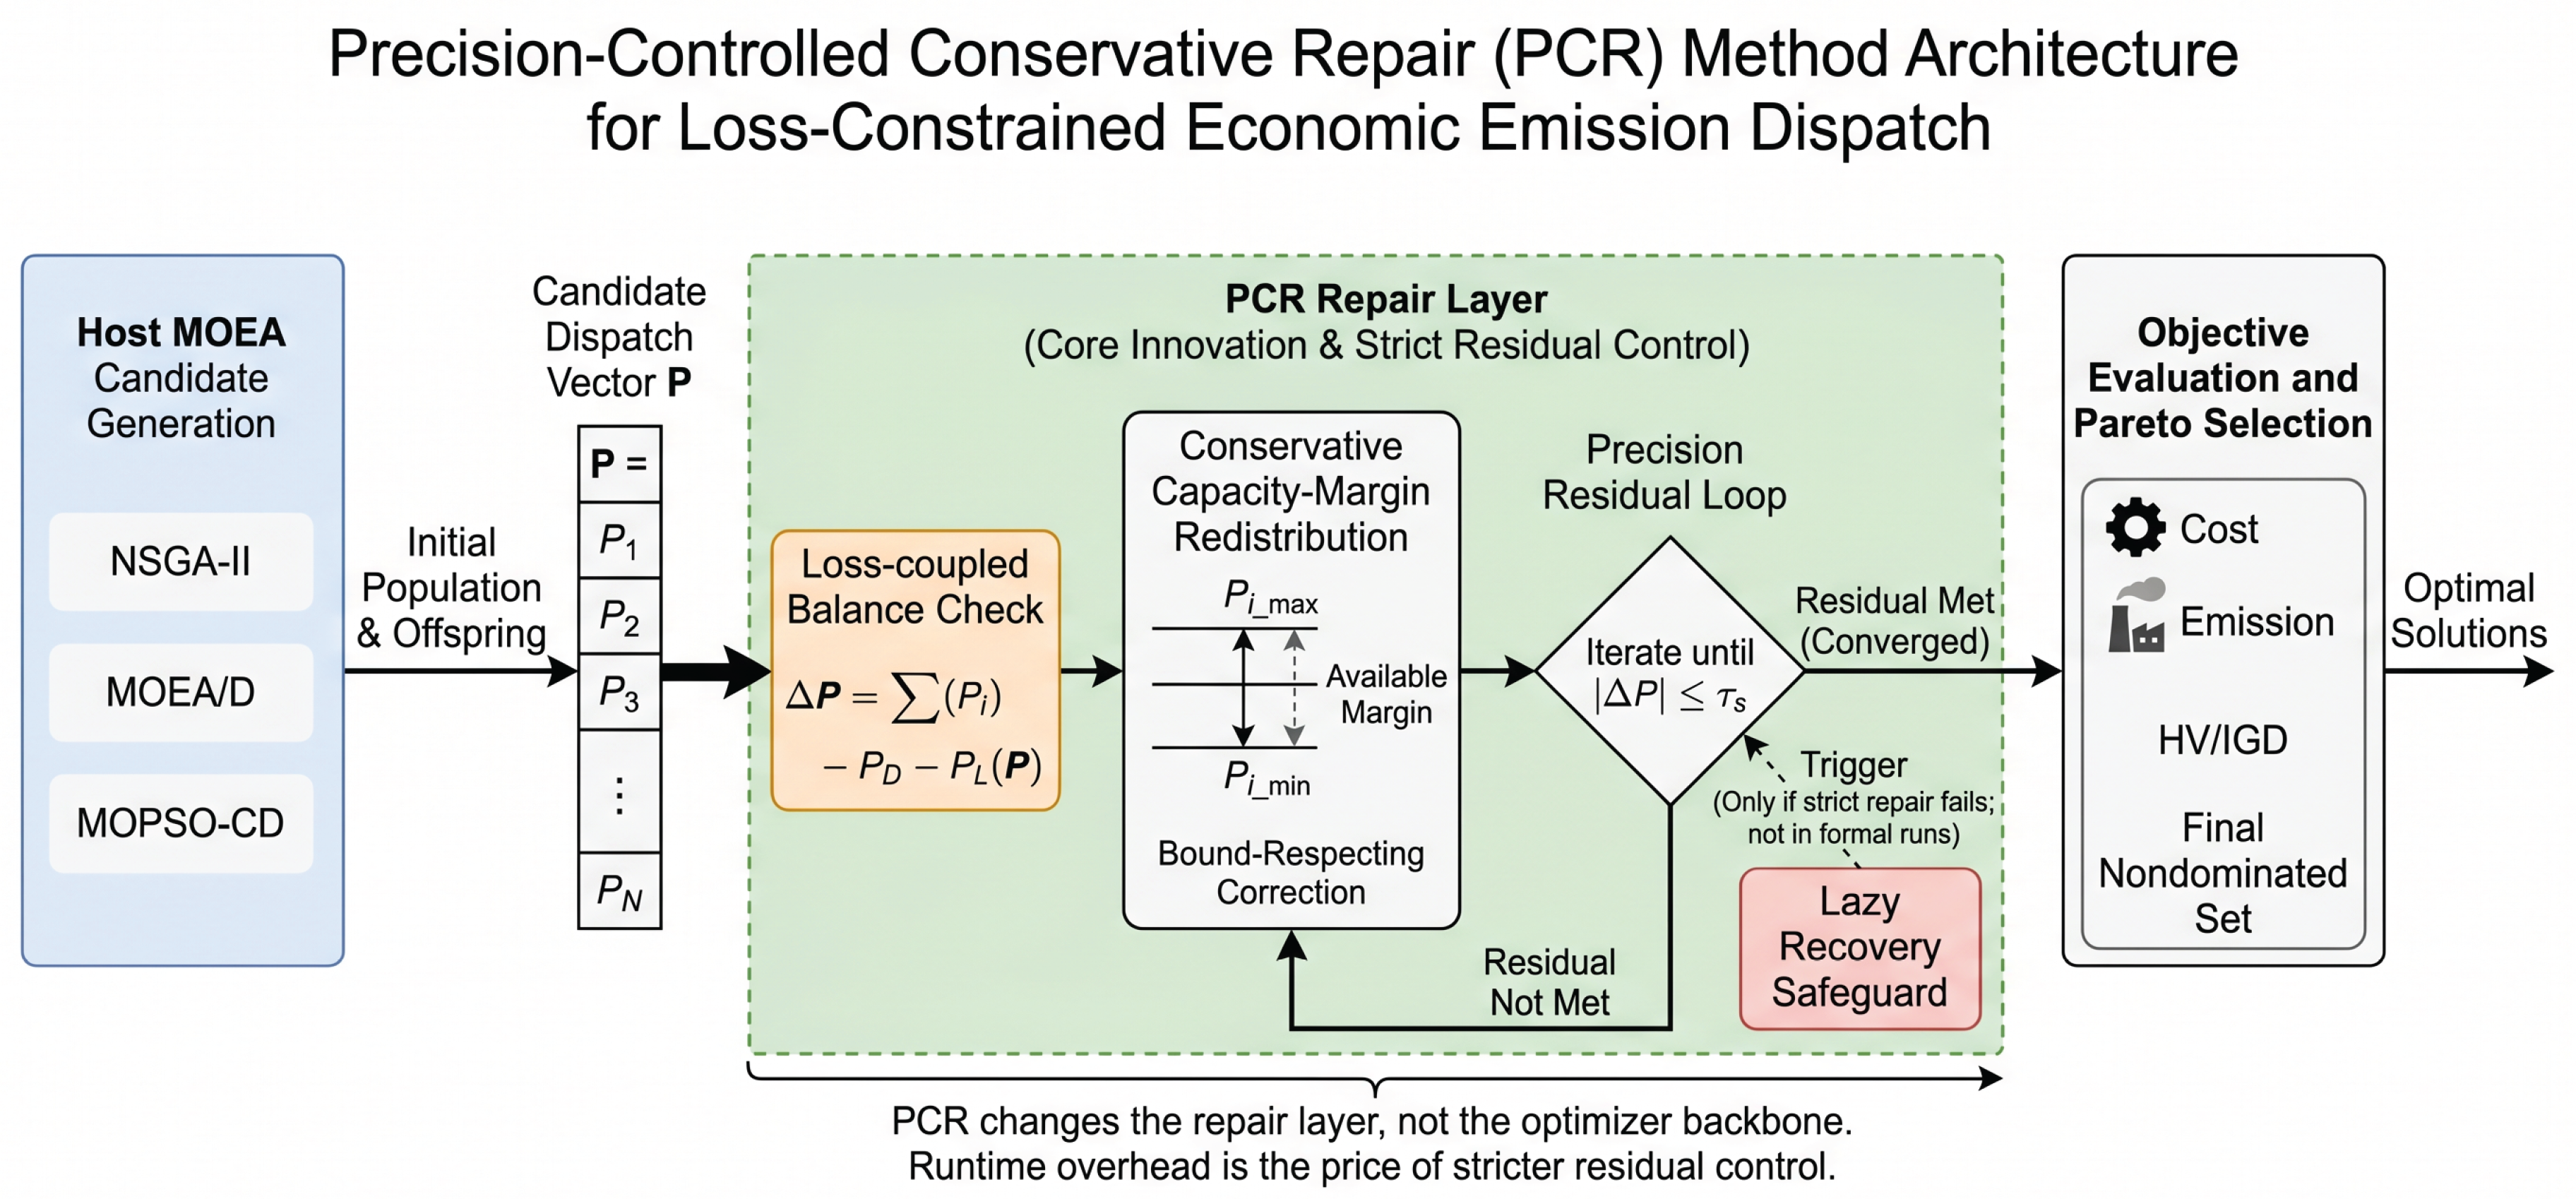
Figure 5.
Balance-residual improvement and runtime overhead of PCR relative to current repair. Runtime overhead is reported as part of the engineering tradeoff.
Figure 5.
Balance-residual improvement and runtime overhead of PCR relative to current repair. Runtime overhead is reported as part of the engineering tradeoff.
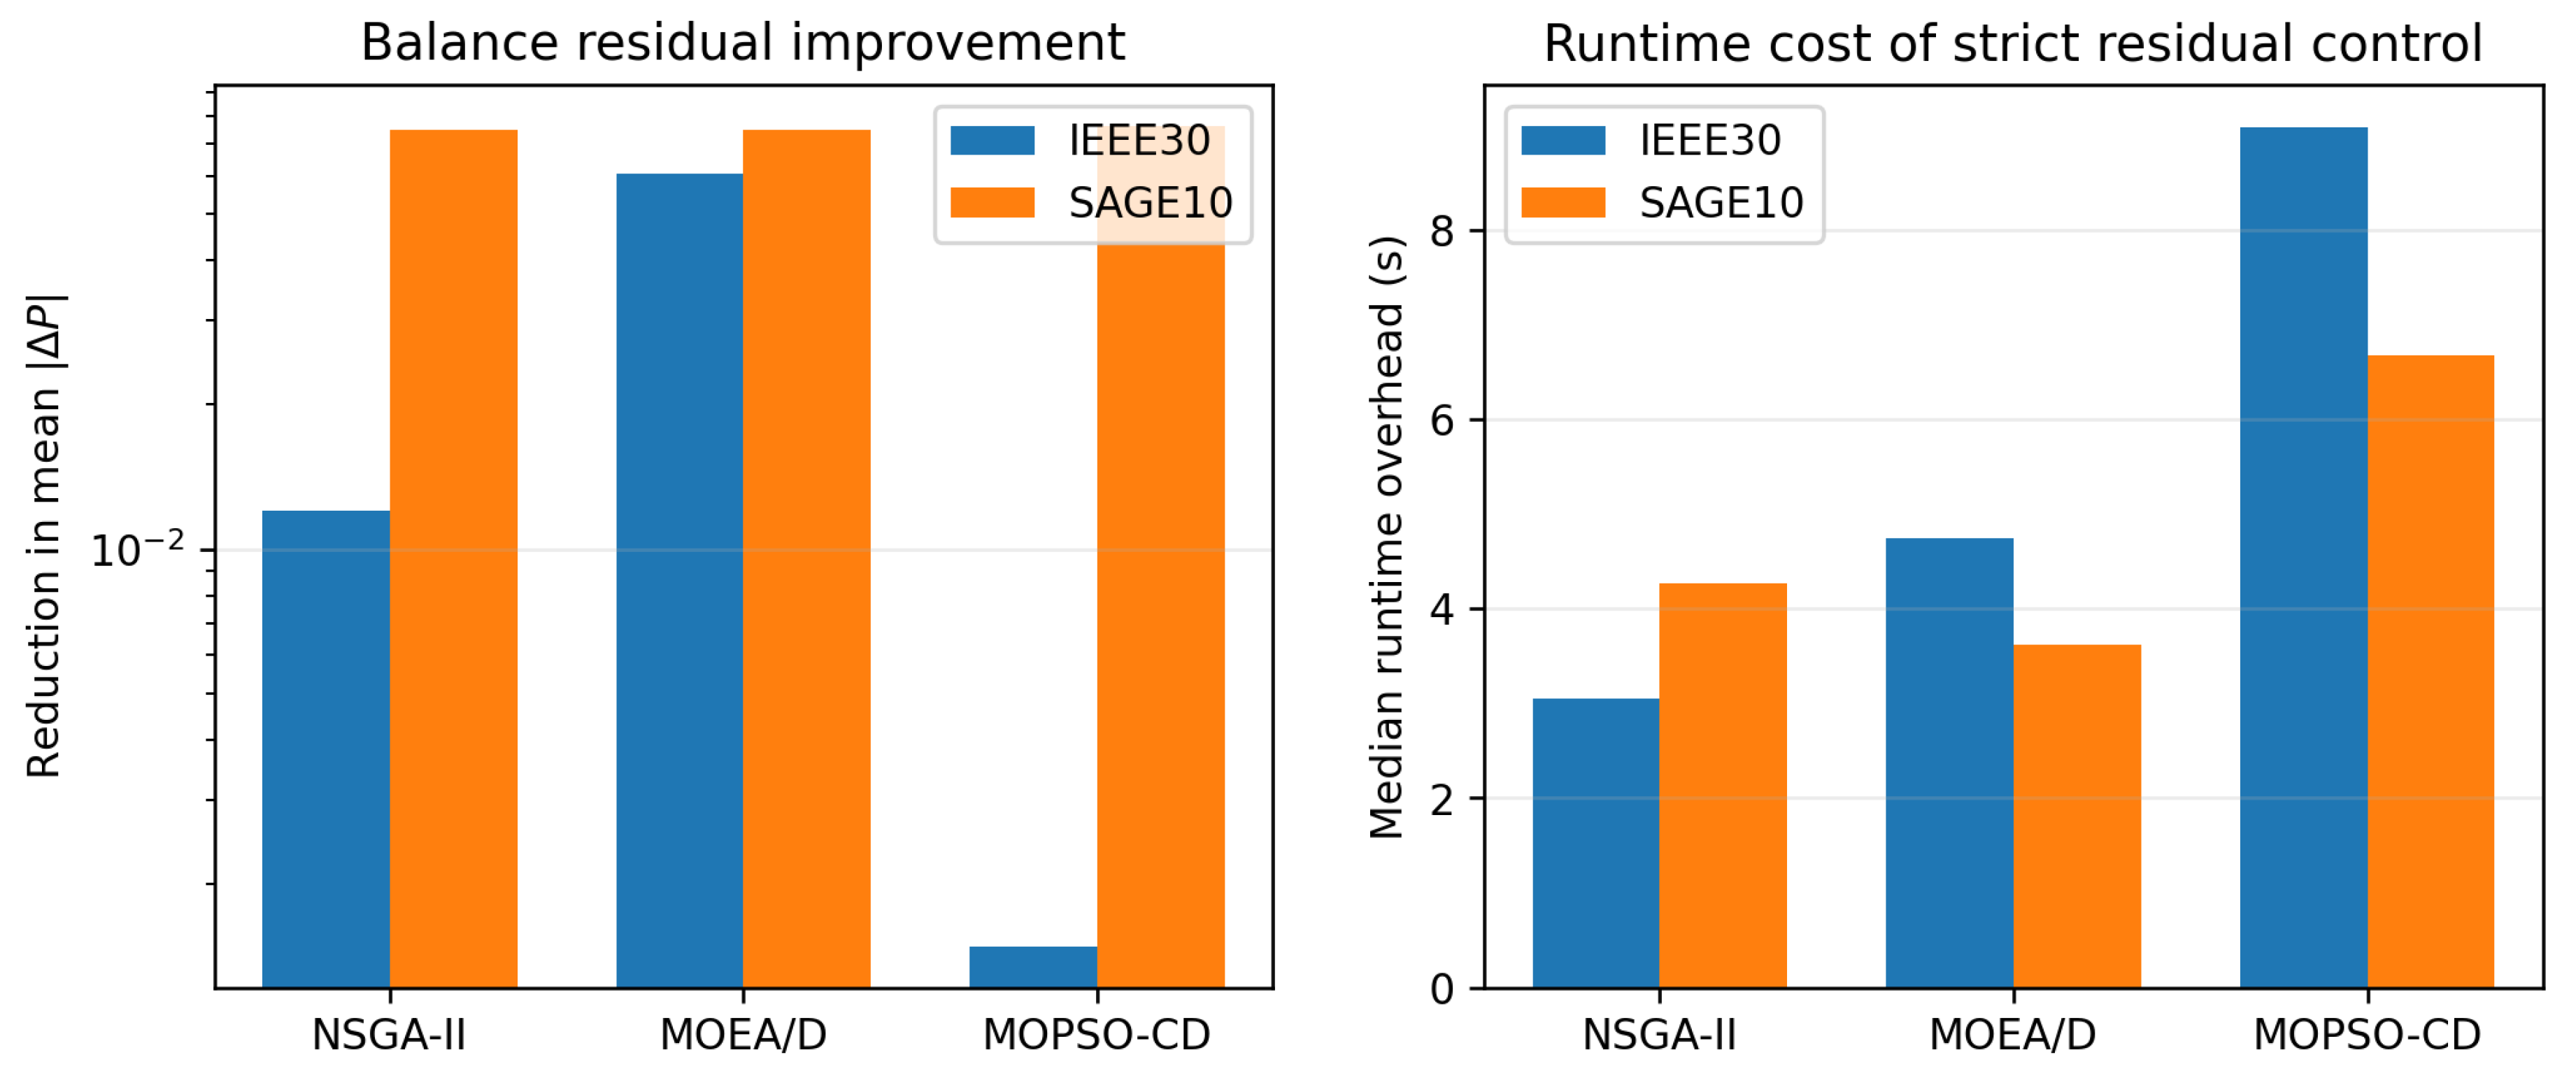
Table 2.
Formal Task 8 results for the current repair baseline and the proposed precision-controlled repair (PCR). Medians are reported for HV and IGD over 30 runs; mean absolute balance mismatch and runtime are run means. Higher HV is better; lower IGD, mismatch, and runtime are better.
Table 2.
Formal Task 8 results for the current repair baseline and the proposed precision-controlled repair (PCR). Medians are reported for HV and IGD over 30 runs; mean absolute balance mismatch and runtime are run means. Higher HV is better; lower IGD, mismatch, and runtime are better.
| Benchmark | Algorithm | Method | HV median | IGD median | Mean | Runtime (s) |
|---|---|---|---|---|---|---|
| IEEE30 6-unit EED | NSGA-II | Current repair | 1,708,123 | 199.23 | 2.16e-02 | 6.38 |
| IEEE30 6-unit EED | NSGA-II | PCR | 2,219,163 | 2.89 | 1.86e-05 | 9.48 |
| IEEE30 6-unit EED | MOEA/D | Current repair | 1,739,679 | 185.15 | 4.86e-02 | 30.05 |
| IEEE30 6-unit EED | MOEA/D | PCR | 2,207,514 | 19.00 | 1.96e-05 | 35.07 |
| IEEE30 6-unit EED | MOPSO-CD | Current repair | 1,219,336 | 458.71 | 7.77e-03 | 7.96 |
| IEEE30 6-unit EED | MOPSO-CD | PCR | 2,214,460 | 4.87 | 3.27e-05 | 17.00 |
| SAGE/Basu 10-unit CEED | NSGA-II | Current repair | 7,940,619 | 83.38 | 7.50e-02 | 6.96 |
| SAGE/Basu 10-unit CEED | NSGA-II | PCR | 8,077,380 | 15.79 | 4.87e-05 | 11.66 |
| SAGE/Basu 10-unit CEED | MOEA/D | Current repair | 6,779,987 | 352.85 | 7.50e-02 | 31.45 |
| SAGE/Basu 10-unit CEED | MOEA/D | PCR | 7,265,104 | 82.53 | 5.12e-05 | 35.29 |
| SAGE/Basu 10-unit CEED | MOPSO-CD | Current repair | 7,341,130 | 118.01 | 7.32e-02 | 9.59 |
| SAGE/Basu 10-unit CEED | MOPSO-CD | PCR | 7,205,659 | 66.37 | 5.86e-05 | 16.59 |
Table 3.
Statistical comparison of PCR against the current repair baseline. Positive HV, IGD, and mismatch deltas indicate benefit under the benefit coding used by the reproducible statistics pipeline; runtime deltas are negative when PCR is slower.
Table 3.
Statistical comparison of PCR against the current repair baseline. Positive HV, IGD, and mismatch deltas indicate benefit under the benefit coding used by the reproducible statistics pipeline; runtime deltas are negative when PCR is slower.
| Benchmark | Algorithm | Effect | Strength | HV | IGD | t (s) | |
|---|---|---|---|---|---|---|---|
| IEEE30 6-unit EED | MOEA/D | positive transfer | strong | 467,834 | 166.15 | 6.08e-02 | -4.74 |
| IEEE30 6-unit EED | MOPSO-CD | positive transfer | strong | 995,124 | 453.84 | 1.48e-03 | -9.08 |
| IEEE30 6-unit EED | NSGA-II | positive transfer | strong | 511,040 | 196.34 | 1.20e-02 | -3.05 |
| SAGE/Basu 10-unit CEED | MOEA/D | positive transfer | strong | 485,116 | 270.32 | 7.50e-02 | -3.62 |
| SAGE/Basu 10-unit CEED | MOPSO-CD | positive transfer | strong | -135,471 | 51.64 | 7.65e-02 | -6.67 |
| SAGE/Basu 10-unit CEED | NSGA-II | positive transfer | strong | 136,761 | 67.59 | 7.51e-02 | -4.26 |
Table 4.
Secondary comparison against a first-order loss-sensitivity projection repair. PCR is the proposed conservative repair; projection uses the local balance gradient under the same strict residual target.
Table 4.
Secondary comparison against a first-order loss-sensitivity projection repair. PCR is the proposed conservative repair; projection uses the local balance gradient under the same strict residual target.
| Benchmark | Algorithm | PCR HV | Projection HV | PCR IGD | Projection IGD | PCR | Projection |
|---|---|---|---|---|---|---|---|
| IEEE30 6-unit EED | NSGA-II | 2,219,163 | 2,219,290 | 2.89 | 2.86 | 1.86e-05 | 5.03e-06 |
| IEEE30 6-unit EED | MOEA/D | 2,207,514 | 2,209,836 | 19.00 | 19.35 | 1.96e-05 | 9.16e-06 |
| IEEE30 6-unit EED | MOPSO-CD | 2,214,460 | 2,216,772 | 4.87 | 3.50 | 3.27e-05 | 3.12e-06 |
| SAGE/Basu 10-unit CEED | NSGA-II | 8,077,380 | 6,876,264 | 15.79 | 99.81 | 4.87e-05 | 1.08e-04 |
| SAGE/Basu 10-unit CEED | MOEA/D | 7,265,104 | 6,850,255 | 82.53 | 114.47 | 5.12e-05 | 9.05e-05 |
| SAGE/Basu 10-unit CEED | MOPSO-CD | 7,205,659 | 6,636,345 | 66.37 | 139.05 | 5.86e-05 | 3.75e-04 |
Table 5.
Sensitivity of NSGA-II PCR to the strict residual tolerance . Smaller tightens the residual further and modestly increases runtime; Pareto indicators remain in the same range.
Table 5.
Sensitivity of NSGA-II PCR to the strict residual tolerance . Smaller tightens the residual further and modestly increases runtime; Pareto indicators remain in the same range.
| Benchmark | HV median | IGD median | Mean | Runtime (s) | |
|---|---|---|---|---|---|
| IEEE30 6-unit EED | 2,218,623 | 2.93 | 1.10e-04 | 8.82 | |
| IEEE30 6-unit EED | 2,219,163 | 2.89 | 1.86e-05 | 9.78 | |
| IEEE30 6-unit EED | 2,219,287 | 2.89 | 3.02e-06 | 10.26 | |
| SAGE/Basu 10-unit CEED | 8,084,634 | 15.41 | 5.13e-04 | 9.37 | |
| SAGE/Basu 10-unit CEED | 8,077,380 | 15.79 | 4.87e-05 | 10.65 | |
| SAGE/Basu 10-unit CEED | 8,073,185 | 15.03 | 3.69e-06 | 10.60 |
Table 6.
PCR repair diagnostics. The formal runs used the strict conservative repair candidate; the lazy physics-recovery path was available but not triggered in the reported runs.
Table 6.
PCR repair diagnostics. The formal runs used the strict conservative repair candidate; the lazy physics-recovery path was available but not triggered in the reported runs.
| Benchmark | Algorithm | Calls | Strict iter. | Strict selected | Physics calls | Final |
|---|---|---|---|---|---|---|
| IEEE30 6-unit EED | NSGA-II | 30,100.0 | 7.34 | 1.00 | 0.0 | 3.20e-05 |
| IEEE30 6-unit EED | MOEA/D | 30,100.0 | 6.97 | 1.00 | 0.0 | 2.47e-05 |
| IEEE30 6-unit EED | MOPSO-CD | 30,226.0 | 7.78 | 1.00 | 0.0 | 3.96e-05 |
| SAGE/Basu 10-unit CEED | NSGA-II | 30,100.0 | 7.02 | 1.00 | 0.0 | 5.07e-05 |
| SAGE/Basu 10-unit CEED | MOEA/D | 30,097.8 | 7.05 | 1.00 | 0.0 | 5.32e-05 |
| SAGE/Basu 10-unit CEED | MOPSO-CD | 30,243.9 | 7.05 | 1.00 | 0.0 | 5.48e-05 |
Disclaimer/Publisher’s Note: The statements, opinions and data contained in all publications are solely those of the individual author(s) and contributor(s) and not of MDPI and/or the editor(s). MDPI and/or the editor(s) disclaim responsibility for any injury to people or property resulting from any ideas, methods, instructions or products referred to in the content. |
© 2026 by the authors. Licensee MDPI, Basel, Switzerland. This article is an open access article distributed under the terms and conditions of the Creative Commons Attribution (CC BY) license (http://creativecommons.org/licenses/by/4.0/).
Copyright: This open access article is published under a Creative Commons CC BY 4.0 license, which permit the free download, distribution, and reuse, provided that the author and preprint are cited in any reuse.