

Submitted:
13 July 2026
Posted:
15 July 2026
You are already at the latest version
Abstract
The purpose of this study is to validate the identified dimensions of visitor satisfaction and assess their potential as indicators of sustainable event management in the context of Expo Cebú Chone 2024 in Ecuador. The research design is quantitative, cross-sectional, and empirical, based on a Likert-scale questionnaire regarding visitor experience and satisfaction. A total of 962 valid responses were collected and analyzed; exploratory and confirmatory factor analysis was applied to 356 of them. The results highlight the two-dimensional nature of satisfaction—across both the event’s main activities and complementary services—grounded in the visitor experience, emphasizing the construct's multidimensionality and its use as an indicator of sustainable event management. It is concluded that the creation of positive experiences constitutes a central component of visitor satisfaction and, in turn, an indirect measure of sustainable event management and the capacity to generate economic, social, and experiential value. This contribution to the literature emphasizes a visitor-centered approach to event sustainability, with practical implications for improving event management in rural livestock-raising areas.
Keywords:
livestock events
; visitor experience
; visitor satisfaction
; sustainable event management
; factor analysis
; Ecuador
1. Introduction
Sustainability in tourism remains relevant and is gaining importance in event management, as it drives comprehensive development by balancing economic, social, and environmental factors. For regional development, events are strategic alternatives, especially in rural areas, where they help revitalize the economy and promote culture. Chiya (2024) points out that in rural areas, events generate positive sociocultural impacts related to social sustainability, such as community cohesion, resilience, group and family unity, socialization, cultural preservation, and residents’ well-being, as well as a wide range of economic benefits for communities [1] .
A key indicator of an event’s success is visitor satisfaction, as it reflects the quality of the experience and influences visitors’ intention to return and recommend the event. Research has shown that satisfaction is influenced by multiple factors, including the quality of the event, the services offered, and the visitor experience [2,3]. Therefore, there is a need to develop a systematic method for evaluating events, to improve their quality, provide value to customers, and generate more positive and fewer negative impacts on the environment [3,4,5,6,7]
A thorough understanding of visitors' perceptions is necessary to improve the sustainability of future festivals [8]. Can be assessed indirectly through visitor-focused indicators, such as experience and satisfaction, as these reflect the event’s ability to generate long-term value and gain stakeholder acceptance. Visitor satisfaction is the most important outcome that event organizers should evaluate [2]. It is assumed that visitor satisfaction serves as an indicator of the event's sustainable performance.
Surveys of event participants provide more relevant, accessible, reliable, and actionable information than those targeting business owners. Key factors include interest in the event, spending habits, behaviors, expectations, perceptions, and demographic data that inform the initial assessment of the event’s benefits for the destination [4]. Despite growing interest in event sustainability, there is limited empirical evidence from rural areas in emerging economies and from livestock fairs. The case of the Cebú Chone Expo fair in Ecuador provides an excellent opportunity to analyze visitor satisfaction as a reflection of event management and related services.
Considering the above, the objective of this research is to validate the identified dimensions of visitor satisfaction and assess their potential as indicators of sustainable event management in the context of Expo Cebú Chone 2024 in Ecuador.
This study proposes an exploratory and confirmatory factor analysis of visitor satisfaction constructs with respect to the main activities and complementary services. It also discusses other indicators that reflect the visitor experience, the evaluation of the destination’s tourism services, and recommendations regarding the livestock fair. The research provides empirical evidence that contributes to both theoretical development and the practical management of sustainable events.
The quality of services, the organization of the event, and the overall experience all influence visitor satisfaction and the decision to return; therefore, sustainable event management is not reflected solely by environmental practices. Accordingly, indicators are developed to measure these aspects; the research question is as follows: How is visitor satisfaction structured at a rural livestock event, and to what extent can it be considered an indicator of the event’s sustainable management?
The empirical approach of this research is based on collecting and analyzing data directly from attendees at the 2024 Expo Cebú Chone fair. The use of surveys, along with exploratory and confirmatory factor analysis, facilitates the assessment of satisfaction with the event’s activities and services. Conclusions are drawn from observable and verifiable evidence, enabling a quantitative explanation of the visitor experience and its relationship to the event’s sustainability.
The structure of this paper includes: a theoretical overview of the key terms addressed, the methodology applied with consideration of crucial aspects, evidence of the results obtained, and a discussion of the findings in comparison with other authors.
2. Theoretical Framework
2.1. Sustainable Event Management
Sustainability involves balancing economic performance with social equity and environmental responsibility under the triple bottom line paradigm [9]. In this regard, sustainable event management has emerged as a key approach in tourism and event planning, integrating economic, social, and environmental dimensions [2,6]. Although there has been an increase in the literature examining the sustainability of events, this remains an understudied area [3,6,7,8].
In the events sector, sustainability is not limited to eco-friendly practices; it also encompasses organizational quality, operational efficiency, and the creation of value for stakeholders, including visitors [7,10]. For example, the event organizers need to be aware of the direct impact on the community [2,4]. Sustainable event management involves designing experiences that meet the public's expectations while minimizing negative impacts and maximizing social and economic well-being [11].
The Bio-Circular-Green (BCG) model is a transformative framework for sustainable tourism in the context of food festivals because it involves local artisans, farmers, and culinary experts in the planning and implementation, fostering socioeconomic benefits rather than immediate tourism revenue [12]. This applies to rural livestock events, such as Expo Cebú Chone, where Manabí cuisine—typical of the area—is a major attraction.
Event management is becoming increasingly popular in rural areas to revitalize local economies and attract visitors to seasonal tourist destinations [4]. At rural and livestock events, such as agricultural fairs, the focus on sustainability takes on special significance, as it contributes to local development, strengthens production chains, and promotes cultural identity [13]. Therefore, sustainability can be understood indirectly through perceived quality, event organization, and the visitor experience.
The long-term potential of events to boost local businesses and jobs—as well as the ripple effect they have on communities and societies is often overlooked [14]. Events attract visitors, increase visibility, diversify the market, and generate revenue, among other benefits [2,3,6]. Food festivals, like other events, benefit the local economy and improve the quality of life in communities. They facilitate connections and sociocultural exchanges, which are crucial to the viability and sustainability of events [12]. These positive effects are maximized if there is continuous quality improvement.
There is a holistic, four-stage conceptual model for festival management: strategic planning, production and consumption, post-festival activities, and lessons learned [12]. Evaluating the successes and shortcomings in the second and third stages is crucial for continuous improvement.
2.2. Visitor Satisfaction
Satisfaction results from comparing prior expectations with the perceived performance of the service; this is known as the theory of expectation confirmation [15]. Visitor satisfaction is one of the most widely studied concepts in tourism marketing. About events, this aspect has been identified as a key indicator of success, as it influences perceptions of value, loyalty, and word-of-mouth recommendations [16]. The literature suggests that it is determined by multiple factors, such as the quality of the event, the experience, and the services offered at the destination [2,3,12]. Visitor satisfaction is closely linked to sustainability, as events that generate high levels of satisfaction tend to become established over time and contribute to the destination’s economic and social development. Visitor loyalty—defined as the intention to return or recommend the event—is a direct result of satisfaction [17]. In this scenario, loyalty is primarily demonstrated through positive word-of-mouth and the intention to repeat the experience [3,16,18,19,20,21,22,23,24]. Satisfaction is one of the most robust predictors of loyalty [20]. In this regard, promoting visitor satisfaction not only enhances the individual experience but also contributes to the event’s sustainability by creating future demand.
The quality of an event is one of the most important factors determining visitor satisfaction. From a service marketing perspective, perceived quality is defined as the overall evaluation of service performance in relation to user expectations [25]. For this reason, evaluating an event is essential both to ensure its quality and to manage its execution. It provides advertising material and helps attract new participants, while also enabling continuous improvement and enhancing the reputation and credibility of the company and its professionals [5]. A high level of service quality leads to satisfied visitors, who are more likely to recommend the event through word of mouth and to return [18].
In the field of events, quality has been conceptualized as a multidimensional construct that includes organization, activity planning, infrastructure, and the services provided [11]. Previous studies have shown that both the quality of activities and services significantly impact on the overall perception of the event [21]. Modern tourists, influenced by globalized tastes and preferences, tend to prioritize sustainability and quality over a strong sense of local identity [12].
A central concept in contemporary marketing and tourism literature is the visitor experience. According to Pine and Gilmore, these are memorable events that engage the individual emotionally, physically, and intellectually [26]. At the heart of these events, the visitor experience is shaped by the interaction among the activities, services, and surroundings [27]. This experience depends not only on tangible factors but also on subjective and emotional perceptions.
The visitor's experience is shaped by their participation in the event: their experiences, preferences, and dissatisfactions. Individual perceptions influence behavior; the interaction between motivation and sustainability practices can increase satisfaction [3]. Tourists can become repeat visitors and advocates for the destination based on the cognitive and emotional perceptions derived from their experiences [12].
It is necessary to investigate aspects of attendees' behavior, motivations, interest in environmental issues, expectations, and satisfaction with current offerings [13]. Motivations for acquiring knowledge, recognition of areas for improvement, willingness to pay, and contributions to promotion align with sustainability values because they generate both instrumental and symbolic benefits. If they're proud of their experiences, they recommend them [3]. Various studies have shown that the quality of an event directly influences the visitor's experience, which, in turn, is a key mediator of satisfaction [18]. Understanding the visitor experience is essential to explaining the mechanisms through which quality affects event satisfaction outcomes.
The literature suggests that the perceived quality of events can be analyzed along two complementary dimensions. The first relates to the quality of the activities or the core service, which involves the programming, performances, and experiences that are the main reason for attending [18,19,23,28]. The second concerns the quality of support or ancillary services, including functional aspects such as organization, cleanliness, safety, accessibility, and food offerings [11,25,29,30]. A positive perception of these dimensions is associated with overall visitor satisfaction, a favorable evaluation of the event, and future intentions to participate [31].
2.3. Visitor Satisfaction as an Indicator of Sustainability
Events do not operate in isolation but are part of a broader tourism system. In this regard, the destination’s tourism services—such as lodging, transportation, and dining—play a key role in the visitor’s overall assessment [32]. The quality of these complementary services influences the overall perception of the event and can significantly affect visitor satisfaction [20]. In emerging or rural destinations, the availability and quality of tourism infrastructure can be the key to success. Therefore, the integration of event management and destination quality is a key element of the sustainability approach, as it contributes to regional development and tourism competitiveness [2,7].
The relationship between visitor satisfaction and sustainability has been widely discussed in recent literature. Creating long-term value for stakeholders is essential to sustainable event management, which requires satisfying experiences for visitors [10]. Recent research suggests that visitor satisfaction can be considered an indirect indicator of sustainability at events—not only from an environmental perspective—as it reveals organizational efficiency, management quality, and the ability to create social and economic value [11].
Key factors, such as the quality of the food, the level of service, the range of activities offered, and ease of access, play a crucial role in visitor satisfaction [12]. In this regard, sustainability depends not only on eco-friendly practices but also on the event’s ability to deliver high-quality experiences that meet public expectations.
Attendees not only consume products or services but also participate in holistic experiences whose evaluation influences their overall perception of the event [24,26,27,33]. Consequently, satisfaction can be understood as the result of comparing visitors’ prior expectations with their actual experience [23,34]. Satisfaction is closely linked to the creation of perceived value, the intention to recommend, and loyalty to the event or destination [3,20,21,22,23]. In this context, satisfied visitors develop favorable attitudes, are more likely to return, and help spread positive word-of-mouth about the event through personal recommendations and digital media [3,16,19,23,24]. Therefore, satisfaction reflects the event’s ability to generate benefits for attendees, organizers, and the host community—criteria associated with sustainability.
From a sustainability perspective, satisfaction takes on added significance as it serves as a mechanism for the event’s social acceptance. The continuity and consolidation of events depend not only on their economic viability but also on visitors’ positive perceptions and their contribution to the well-being of the host communities [1,2]. In this regard, satisfaction can be interpreted as a reflection of the event’s ability to meet participants’ expectations and create experiences consistent with the principles of sustainable development.
Creating value for attendees is a necessary condition for achieving sustainable long-term results [3,6,10]. Contemporary models of sustainable management emphasize the need to integrate economic, social, and environmental dimensions into the planning and evaluation of events [5,7,9]. From this perspective, visitor satisfaction can be considered an indirect indicator of sustainable management, as it reflects the quality of the experience offered, the adequacy of the services, and the event’s ability to generate value without compromising its future viability.
2.4. Formulation of hypotheses
Figure 1 presents a conceptual model for analyzing visitor satisfaction and its relationship to sustainable event management. The logic suggests that visitor satisfaction is a multidimensional construct, comprising dimensions that contribute to the overall experience of satisfaction. Three hypotheses are proposed that point toward a theoretical implication:
H1. Visitor satisfaction is a multidimensional construct comprising satisfaction with the main activities and with the complementary services.
About events and festivals, satisfaction is conceived as a multidimensional construct that arises from a comprehensive evaluation of attendees’ experiences. Various studies have shown that the visitor experience is shaped by interactions among main activities, complementary activities, support services, and the emotional and relational elements associated with the event [18,21,23,24,33,35].
H2. Satisfaction with the event’s main activities contributes to the overall construct of visitor satisfaction.
The main activities are the core theme of the event and the primary reason for attendance, significantly influencing participants’ perceptions of quality, value, and overall satisfaction. [23]. Livestock fairs include livestock exhibitions, specialized competitions, auctions, technical demonstrations, and other activities directly related to livestock farming, which play a fundamental role in fostering learning, social interaction, and the strengthening of rural identity [33,35,36,37].
H3. Satisfaction with the event's ancillary services contributes to the overall construct of visitor satisfaction.
In addition, complementary activities and services include elements that enrich the visitor's overall experience, such as cultural performances, dining, shopping areas, family activities, educational exhibits, and recreational areas [24,28,29,35]. Although these activities are not always the main reason for attending, they contribute significantly to overall satisfaction by expanding opportunities for interaction, strengthening attendees’ emotional engagement, and diversifying the event’s value proposition [23,24,33]. These encourage visitors to stay longer at the venue and help attract a more diverse audience, which benefits both the organizers and the host community [1,38].
Theoretical implication: Visitor satisfaction has the potential to be used as an indicator of sustainable event management.
Taking these theoretical contributions into account, this study assumes that visitor satisfaction at Expo Cebú Chone 2024 can be explained by a combined assessment of the main activities and complementary services that make up the fair experience. Satisfaction is not only an indicator of the event’s perceived quality; it is also a key factor in understanding the promotion of identity, the contribution to social and rural cohesion, the strengthening of the region, and, consequently, sustainable development [7,12,39]. Therefore, high levels of satisfaction should be interpreted as an indirect indication of the event’s ability to generate economic, social, and cultural value in a sustainable manner, thereby strengthening its legitimacy and ensuring its continuity over time [3,7].
3. Materials and Methods
3.1. Background of the Study
Expo Cebú Chone is a livestock fair held in the canton of the same name, located in the northeastern part of the coastal province of Manabí, in Ecuador. Given its long tradition of livestock farming, this region has organized Expo Cebú since 2022, and the event has gradually established itself as one of the country’s most important livestock events and as a benchmark for promoting livestock farming, trade, and tourism in the province of Manabí [40]. The 2024 event brought together approximately 1,000 heads of high-quality livestock, featured the participation of ranches and national and international delegations, and was expected to attract more than 200,000 visitors, with an estimated economic impact of USD 10 million on the local economy [41,42]. In addition to livestock-related activities, the program included shopping, dining, cultural, and entertainment offerings, which broadened the event’s appeal to a diverse range of visitors [43].
The 2024 Expo Cebú Chone event stood out for its significant media coverage, an increase in visitor attendance, and its contribution to the event’s national and international visibility [43]. The variety of experiences offered to attendees and the event's scale make it a case study for analyzing visitor satisfaction as an indicator of sustainable event management.
3.2. Research Design
The research is characterized by a quantitative, empirical, cross-sectional approach with a non-experimental design. The primary method is a survey, using a structured questionnaire consisting mainly of closed-ended questions and a Likert scale. Exploratory factor analysis (EFA) and confirmatory factor analysis (CFA) were used to evaluate the instrument's factor structure, reliability, and validity. The research process was part of the substantive function of engaging with society carried out by ten students in the bachelor’s program in Tourism at the Universidad Laica Eloy Alfaro de Manabí, under the guidance of the faculty authors of this article and at the express request of the event’s chief organizer.
3.3. Population and Sample
The study population consisted of visitors to the 2024 Cebú Chone Expo. Due to the lack of a complete attendee record, the population was treated as infinite for sample size calculation. Non-probabilistic convenience sampling was used, accounting for sociodemographic quotas and the fairgrounds' spatial coverage. The ten interviewers were distributed evenly throughout the fairgrounds and were asked to ensure a balance between men and women, as well as among different age groups. After data collection and cleaning, 962 valid questionnaires were obtained for analysis.
The sample size corresponds to a 97% confidence level and an approximate margin of error of 3.5%, assuming a binomial distribution (p = q = 0.5) in an infinite population, which is statistically correct. A slightly larger study may provide a more complete picture, particularly if the event is held in a very small town [4].
Data collection was conducted through in-person surveys; it began on the second day of the 2024 Cebú Chone Expo (October 24–26), with the aim of ensuring that visitors had already participated in the event’s main activities and, therefore, had sufficient experience to evaluate their level of satisfaction with both the activities and the services offered.
Training interviewers is a key factor in improving data quality and encouraging participant cooperation, thereby increasing the response rate and the representativeness of the results [4]. For this reason, prior to the fieldwork, the interviewers received training on administering the questionnaire in a standardized manner, covering aspects of interpersonal communication, building trust, and interacting appropriately with visitors, thereby fostering a friendly and respectful atmosphere when requesting their participation.
To conduct exploratory factor analysis (EFA) and confirmatory factor analysis (CFA), a subset of 356 surveys from visitors who participated in all the main activities and used the complementary services was evaluated at Expo Cebú Chone 2024. This means that records with a response code of “0”—indicating “did not participate or did not use the service”—were excluded. These cases were excluded because these visitors had not experienced certain activities or services and, consequently, could not provide a valid satisfaction rating for those aspects. This data cleaning ensured a complete and conceptually consistent data matrix for identifying and validating the instrument’s factor structure.
3.4. Data Collection Tool
The information was collected using a structured questionnaire specifically designed to assess visitor satisfaction at the 2024 Cebu Chone Expo Fair. The questionnaire included sociodemographic questions about satisfaction following the experience with regard to: the rodeo and livestock exhibition, the livestock auction, Cebu Avenue, concerts and shows, food and beverage offerings, product sales, and children’s activities. Satisfaction was measured using a Likert scale, where 1 indicated “Very dissatisfied” and 5 indicated “Very satisfied.” For items related to the cleanliness and organization of the fairgrounds and the quality of tourist services in Chone, 1 represented “Terrible” and 5 represented “Excellent.”
The attributes evaluated were based on the literature on event management, visitor satisfaction, and agricultural and livestock fairs. Previous studies highlight that the event’s core activities are one of the main determinants of attendees’ experience and satisfaction [11,19]. In livestock fairs, animal exhibits and exhibition spaces are at the heart of the visitor experience and among the event’s main attractions [35,36]. Specialized activities associated with the event's identity, such as livestock auctions, play important commercial and symbolic roles at livestock fairs [11,44]. Similarly, exhibition spaces and areas for interaction with exhibits and exhibitors—such as Cebu Avenue—foster contact between visitors and producers, enriching the event experience [16,19,35].
The literature also indicates that other activities contribute to visitor satisfaction. Among these, shows and recreational activities stand out [18,28], the gastronomic offer [19,29], commercial activities [21] and activities geared toward families, such as children's activities [19]. At today's agricultural fairs, these elements complement the main experience and broaden the event's appeal to various visitor segments [35].
Furthermore, the quality of the infrastructure and support services is a key factor in the overall assessment of the event. Aspects such as rest areas and sanitation facilities influence attendees' perceived quality and overall satisfaction [25,34]. Finally, livestock fairs can go beyond their traditional productive role and become venues that bring together economic, social, cultural, and tourism activities, contributing to the sustainable development of the regions where they are held [45].
Based on this background and considering the specific characteristics of Expo Cebú Chone 2024, the attributes most representative of the visitor experience were selected. The survey is concise, incorporating only the essential aspects of the event to reduce the response burden on participants and ensure the quality of the information collected. To identify and validate the underlying dimensions of visitor satisfaction, the survey was analyzed using exploratory factor analysis (EFA) and confirmatory factor analysis (CFA).
3.5. Data Analysis
Cronbach’s alpha and descriptive statistics were computed for the initial sample (n = 962) to assess the overall experience of the surveyed visitors. The data analysis was designed with psychometric rigor, prioritizing construct validation. The instrument’s items, derived from a comprehensive review of scientific literature and adapted to the study's context, were empirically validated through factor analysis. The results confirm that the instrument’s structure is appropriate, aligns with the proposed theoretical dimensions, and reduces the need for traditional content validation, as supported by the multivariate statistical results from the analyzed sample (n = 356). Cronbach’s alpha was also used to verify internal consistency and robust reliability across all factors.
Responses to the open-ended questions from 962 participants were analyzed using textual content analysis. An in-depth analysis of visitors’ priorities was conducted using the absolute frequencies of keywords and their thematic categorization.
The Kaiser-Meyer-Olkin (KMO) sample adequacy test and Bartlett’s sphericity test were applied to confirm the suitability of the data matrix for factor analysis. Factor extraction was performed using the principal components method with Varimax rotation, which allowed us to identify a robust structure and optimize the conceptual clarity of the dimensions in an exploratory factor analysis (EFA).
Subsequently, a confirmatory factor analysis (CFA) was conducted using AMOS-SPSS software to validate the proposed model. Model fit was evaluated using indices such as χ²/gl (CMIN/DF), RMSEA, CFI, SRMR, TLI, and PCLOSE, among others, in accordance with criteria recommended by recognized authors [46,47,48,49,50], which are consistent with standard guidelines in the structural equation modeling literature. Finally, the model's convergent validity was assessed using Composite Reliability (CR) and Average Variance Extracted (AVE).
4. Results
During the instrument's implementation, a pilot test was conducted with 30 participants to assess its ease of use. Over the three days of the event and considering the considerations outlined in the methodology section, it was found that the questionnaire was easy for participants to complete; the average time to complete it was 3 minutes. The majority of those who asked for their opinions participated enthusiastically and attentively.
The entire database (n = 962) has a Cronbach’s alpha of 0.810, although it includes 0 values corresponding to “did not participate” or “did not use the service”; this indicates good internal consistency and high reliability.
4.1. Sociodemographic Profile of the Sample
Creating attendee profiles is useful for market segmentation and for helping event organizers more effectively meet attendees' needs and desires [13].
Most respondents reported having completed middle school, high school, or higher levels of education; by gender, participation was balanced. To study the perceptions of different visitor segments, the sample was distributed proportionally according to demographic data. The sample consisted of domestic visitors, with a predominance of participants from the Costa region. Through scientific observation, it was possible to accurately verify the aspects shown in Table 1 regarding the sample structure characterizing Expo Cebú Chone 2024 in Manabí, Ecuador.
In summary, the profile essentially consists of young adults with an average age of 36.8 years and a college education, primarily from Manabí and the Chone canton itself, with a slightly higher proportion of women. This description is further illustrated by the notable presence of family members, children, and seniors.
Regarding the number of people who attended the event with companions, groups averaging 5 people were the most common. However, some groups numbered as many as 125 people, and 15 people attended unaccompanied.
4.2. Descriptive Statistics
The main sources through which respondents learned about the 2024 Cebú Chone Expo Fair in Ecuador were social media (53.5%) and family and friends (27.5%). Of the 962 respondents, 32% participated in the three fairs held consecutively through 2024.
The results show high levels of satisfaction across all evaluated activities and services (Figure 2). The highest ratings were given to the Rodeo and Livestock Exhibition and the Livestock Auction, where the “satisfied” and “very satisfied” categories were by far the most common. Furthermore, the food and beverage offerings, product sales, and rest and hygiene facilities received favorable feedback from attendees. Responses indicating dissatisfaction were lower in all cases, suggesting an overall positive experience. The findings suggest that visitors perceive both the main activities and the fair’s complementary services as an integrated whole, which contributes to their satisfaction with the event.
An analysis of the average satisfaction scores reveals that, across all indicators, the scores are above 4.5, and those exceeding 4.60 correspond, in order, to the rodeo and livestock exhibition, the livestock auction, food and beverage offerings, and children’s activities. It can be interpreted that these activities constitute the fair’s raison d’être and that participants—primarily families—seek the livestock fair as another form of entertainment and recreation.
Regarding what visitors liked most about the fair, the ranking of the selected options was as follows: Rodeo and Livestock Exhibition (421; 43.8%), Livestock Auction (137; 14.2%), and Cebu Avenue (102; 10.6%)—activities that constitute the core and the fundamental reason for the event. Next was the Food and Beverage Selection (97; 10.1%), a feature that stems from the distinctive character of Manabí cuisine and the social tradition of eating in public spaces with family and friends.
Regarding their assessment of the cleanliness and organization of the Expo Cebu Chone 2024 fairgrounds, the largest percentage of respondents rated them as good (525; 54.6%) and excellent (343; 35.7%). Even so, 919 respondents suggested areas for improvement for future editions; the areas cited were: Road infrastructure and grounds (276), Basic restroom facilities and cleanliness (165), organization and logistics (113), offerings, activities, and prices (99), wayfinding, signage, and comfort (96), accessibility and parking (91), security and surveillance (60), and electrical infrastructure and lighting (19).
However, upon reviewing the initial statistics, 119 responses indicated a high level of satisfaction, with respondents stating they had “no complaints.” In addition, 99% said they would recommend the Cebú Chone Expo Fair.
Regarding tourism services in the canton and city of Chone, 80.9% of respondents rated them as good or excellent. The remaining participants expressed reservations about this aspect and, consequently, some dissatisfaction with the services they received, which warrants further investigation.
3.3. Exploratory Factor Analysis
The internal consistency analysis of 356 cases with no missing data yielded a Cronbach’s alpha of 0.901 for the instrument's eight items, exceeding the 0.700 threshold. Analysis of the individual items confirms the instrument’s coherence and stability, as all items show correlations ranging from 0.618 to 0.772, and each contributes significantly to measuring the overall construct of satisfaction. Removing any single item would not substantially increase the instrument's overall reliability. The individual Cronbach’s alpha values range from 0.882 to 0.896, reinforcing the scale’s robustness. These data demonstrate that the instrument is highly reliable and consistent and accurately measures visitors’ satisfaction with the fair’s activities and services.
Although the initial exploratory analysis suggested a unidimensional structure, a two-factor forced rotation was chosen based on the literature review in Section 2: Theoretical Framework. The Kaiser-Meyer-Olkin (KMO) sample adequacy test (0.894) and Bartlett’s sphericity test (p < .001) confirm that the data matrix is highly suitable for factor analysis.
The Varimax-rotated principal components method identified a two-component structure that explains 68.9% of the total variance, distinguishing between core activities (primarily in the livestock sector) and complementary services. The results in Table 2 confirm that the measurement instrument comprises two dimensions and indicate that visitors have favorable perceptions.
EFA allows us to identify the instrument's dimensions, especially in new contexts. Combining it with descriptive statistics makes it easier to observe general trends and the consistency of responses, which provides a more rigorous analysis and a better understanding of the data.
Descriptively, the means for all items fall at the upper end of the scale, ranging from 4.56 to 4.71. The highest-rated item is “Rodeo and Livestock Show” (M = 4.71), followed by “Livestock Auction” (M = 4.65), indicating that the fair’s main theme met visitors’ expectations. The high scores could be attributed both to the high level of satisfaction with the main activities and complementary services and to the enthusiasm of attendees who were motivated to complete the questionnaire. Standard deviations remained low (between 0.484 and 0.643), indicating a high degree of consensus and homogeneity in the sample’s responses.
The factor structure and construct validity describe the two factors as shown below:
Factor 1. Main Activities: These encompass the central elements of the event. The item “Cebu Avenue” stands out for having the highest factor loading (0.910) and the highest communality (0.850), indicating that this factor explains 85% of the item’s variance. All items in this dimension exceed the recommended threshold for factor loadings (> 0.50), ensuring their relevance to the construct.
Factor 2. Complementary services: These services reinforce the logistical and support aspects of the event. “Food and beverage” is the strongest indicator in this dimension, with a factor loading of 0.850. The communalities (ranging from 0.648 to 0.747) confirm that the variance in these support services is adequately represented by the extracted factor.
In conclusion, the rotated matrix shows a clean and consistent factorial solution without problematic cross-loadings, thereby justifying moving on to confirmatory model validation.
3.3. Confirmatory factor analysis
The confirmatory factor analysis model confirmed that the event’s main activities are: “Rodeo and livestock exhibition,” “Livestock auction,” “Cebu Avenue,” “Concerts and shows,” and “Children’s activities.” Complementary services include: “Food and beverages,” “Trade of various products,” and “Areas for rest and personal hygiene” with adequate fit indices (Figure 3).
There is a very high positive correlation (r = 0.89) between the two factors; this result suggests that visitors are satisfied with both the event’s main activities and its complementary services.
The comparison with a one-factor model showed a poor fit (CMIN/DF = 4.150; RMSEA = 0.094), while the two-factor model showed an adequate fit (CMIN/DF = 2.660). The chi-square difference test confirmed that the two-factor structure fit significantly better than the unidimensional model (Δχ² = 27.98; Δgl = 1; p < 0.001). These results provide evidence to distinguish between “Main activities” and “Complementary services,” revealing the complexity of visitor satisfaction.
The Evaluation confirmatory factor analysis model showed an adequate fit to the empirical data. The indices obtained met the recommended criteria (χ²/df = 2.660; CFI = 0.983; SRMR = 0.030; RMSEA = 0.068; PCLOSE = 0.102), which supports the proposed structure of visitor satisfaction. In particular, the high CFI and low SRMR indicate an adequate fit between the specified model and the observed data. The PCLOSE value indicated that we failed to reject the close-fit hypothesis (Table 3). Taken together, the results provide evidence of a multidimensional structure comprising satisfaction with the main activities and complementary services.
Both constructs exhibit satisfactory levels of convergent validity (AVE > 0.50) and composite reliability (CR > 0.70), confirming that the indicators adequately represent the proposed latent variables (Table 4).
The strong correlation observed between the dimensions of satisfaction with the main activities and with the complementary services supported the integration of both into a higher-order construct called overall visitor satisfaction. Based on this empirical evidence, satisfaction was interpreted as a useful indicator for evaluating the sustainable management of the event, insofar as it reflects Expo Cebu Chone's ability to generate positive experiences, social acceptance, and value for attendees.
3.4. Hypothesis Testing
The results of the confirmatory factor analysis support the multidimensional structure of visitor satisfaction proposed in this study. The sustainability of the event depends simultaneously on both the activities that constitute its main attraction and the complementary services that ensure a satisfying experience for visitors.
H1. Visitor satisfaction is a multidimensional construct.
This hypothesis was confirmed. The factor model confirmed the existence of two correlated dimensions of visitor satisfaction: satisfaction with the main activities and satisfaction with complementary services. The high fit indices and the scale's internal consistency (α = 0.901) support the construct's multidimensional nature.
H2. Satisfaction with the main activities is a significant aspect of visitor satisfaction.
This hypothesis was confirmed. The indicators associated with the main activities had satisfactory standardized factor loadings (REG = 0.83; SG = 0.81; AC = 0.62; CE = 0.66; AN = 0.77), indicating that this dimension contributes significantly to the visitor satisfaction construct.
H3. Satisfaction with complementary services is a significant aspect of visitor satisfaction.
This hypothesis was confirmed. The indicators associated with complementary services showed adequate factor loadings (OAB = 0.82; CDP = 0.73; EDH = 0.74), demonstrating that this dimension constitutes a significant component of overall visitor satisfaction.
Overall, the results confirm that visitor satisfaction at the 2024 Cebu Chone Expo was based on an assessment of the main activities and complementary services—closely related factors that help explain attendees' overall experience. The high levels of satisfaction observed may have helped strengthen the image and positioning of Expo Cebú Chone, consistent with the growth and consolidation evident in subsequent editions of the event [51].
5. Discussion
Findings on visitor satisfaction at rural livestock events—using the 2024 Chone Cebu Expo Fair in Manabí, Ecuador, as a case study—highlight that visitor perception is a multidimensional construct centered on two fundamental axes: Main activities and Complementary services. Several authors refer to this structure, emphasizing that these two elements are intertwined. [31,52,53] or emphasize the assessment of different aspects of participation [54].
The factor model was supported by measures of internal consistency (α = 0.901) and a structural validation process that included an exploratory factor analysis to identify the instrument's underlying structure, followed by a confirmatory factor analysis to assess the fit of the two-factor model. An adequate fit was found between the specified model and the observed data (CFI = 0.983; TLI = 0.970; RMSEA = 0.068), and the specified model showed a significantly better fit (Δχ² = 27.98; Δgl = 1; p < 0.001) than the unidimensional model.
The strong empirical association between the two extracted dimensions (r = 0.890) is consistent with theoretical approaches to multidimensional consumer satisfaction [22,31,53]. The statistical comparison of models confirmed the distinction between the two dimensions, and recent studies in event tourism highlight the need to consider both the main offering and complementary services together to understand overall visitor satisfaction. The holistic nature of the experience and its relationship to satisfaction mean that visitors do not view their enjoyment of the main offering in isolation from the supporting services. The two factors are harmoniously linked and are expressed as overall satisfaction.
The factorial model presented here is explicit, as the main activities in categories such as “Rodeo and livestock exhibition” and “Cebu Avenue” are primary attractions that create an experience of entertainment and excitement. Complementary services related to the categories of “Food and Beverage” and “Areas for rest and personal hygiene” contribute to an experience of comfort and well-being. The combination of such positive components and interactions at the venue resulted in extremely high satisfaction scores (above 4.5) and a nearly 100% recommendation rate for the Cebú Chone Expo Fair. Studies that used factor analysis concluded that the results could predict event performance and identify factors contributing to success and continuity [12,30,31].
Accordingly, one of the most significant findings is the confirmation of the mediating role of the visitor’s experience in the relationship between satisfaction and the visitor's experience. This result supports the theoretical approach that views experience as a central element in value creation and a key mechanism through which the attributes of activities and services translate into affective outcomes, such as satisfaction [26]. If the experience is positive and visitors are satisfied, they recommend the event—as was the case at the 2024 Cebú Chone Expo Fair, where nearly all attendees responded affirmatively. Several studies identify experience as a central product or element [55,56,57]. Others emphasize satisfaction arising from various components of the experience [54] or the event's benefits [53,58].
In particular, the findings show that satisfaction with the main activities and complementary services stems from the visitor experience, which is derived from the event’s content and programming—the core of perceived value [18]. Aspects such as the culinary offerings and the sale of local products [13] and the organization also plays a significant role in the experience, underscoring the importance of the functional elements to the overall satisfaction with the event.
Creating positive experiences is the primary factor driving visitor satisfaction. According to tourism theorists, visitors do not buy “tickets” or “services”; they buy memorable experiences [26,53,54,55]. When a visitor interacts with their surroundings—for example, by watching a rodeo, participating in an auction, or enjoying the local cuisine (Expo Cebú Chone 2024)—they evaluate that interaction from both a cognitive and emotional perspective. Since the evaluation met their expectations, a “positive experience” was created during the visitor's process at that moment. In line with other authors, satisfaction is the result of that process and a predictor of future intentions [54].
This approach, which focuses on visitor satisfaction at the trade show, contributes to sustainability [3,59,60], because it stems from the experience of participating in activities related to livestock farming, local cuisine, the handicraft trade, and the enjoyment of community culture, which translates into sociocultural recognition and a financial contribution when visitors pay for an offering or a service. In addition, as other studies have confirmed, communicating with others to encourage participation and return [31,54] translates into social, cultural, relational, and economic value for rural livestock-raising regions.
Focusing management efforts on visitor satisfaction as a key indicator not only improves the event's performance but also ensures its continuity and sustainability over time [3,31,59]. Events can serve as tools for sustainable development at the regional level [1,60] because visitor feedback reveals the improvements needed [31]. It encourages managers to plan for the maintenance of road infrastructure and basic services, to foster coordination between events and tourist destinations, and to promote quality standards in various areas, among other aspects, as this research has shown.
Future lines of research stem from the study’s limitations, which are associated with the use of non-probability sampling, thereby limiting the generalizability of the results. Furthermore, the cross-sectional nature of the study precludes observing changes over time across editions. Additionally, the indirect measurement of sustainability requires social, environmental, and economic indicators.
Supplementary Materials
The following supporting information can be downloaded at the website of this paper posted on Preprints.org.
Author Contributions
Conceptualization, M.F.A, N.P.D.R and E.V.M.; methodology, M.F.A, and N.P.D.R; software, M.F.A; validation, M.F.A, N.P.D.R and E.V.M.; formal analysis, M.F.A.; investigation, M.F.A, N.P.D.R and E.V.M..; resources, E.V.M..; data curation, M.F.A; writing—original draft preparation, M.F.A, N.P.D.R and E.V.M; writing—review and editing, M.F.A.; visualization, E.V.M.; supervision, M.F.A.; project administration, M.F.A.; funding acquisition, N.P.D.R and E.V.M. All authors have read and agreed to the published version of the manuscript.
Funding
This research was funded by the Universidad Laica Eloy Alfaro in Manabí, Ecuador. The study is the result of the institutional research project “Activating community heritage for sustainable local tourism development.”
Institutional Review Board Statement
“Not applicable”
Informed Consent Statement
“Not applicable.”
Data Availability Statement
Encuesta de satisfacción Feria Expo Cebú Chone – Ecuador 2024: Resultados
Acknowledgments
To the Decentralized Autonomous Government of Chone and the organizers of Expo Cebú 2024 for providing the space needed to carry out this research. To the Eloy Alfaro Secular University of Manabí for its logistical support. To the Offices of Community Engagement, Transportation, and Research.
Conflicts of Interest
The authors declare no conflicts of interest.
References
- Chiya, A. The Role of Rural Music Festivals in Community Resilience, Resourcefulness, and Well-Being. Int. J. Sustain. Econ. Soc. Cult. Context 2024, 21, 25–50. [Google Scholar] [CrossRef]
- Maguire, K.; McLoughlin, E. An Evidence Informed Approach to Planning for Event Management in Ireland: An Examination of the European Tourism Indicator System. J. Place Manag. Dev. 2020, 13, 47–72. [Google Scholar] [CrossRef]
- Choi, H.; Kim, M.J.; Chung, N.; Olya, H. Promoting Sustainable Events Engagement: A Cross-Country Analysis. Asia Pac. J. Tour. Res. 2025, 1–18. [CrossRef]
- Janeczko, Ben.; Mules, T.J.; Ritchie, Brent. Estimating the Economic Impacts of Festivals and Events : A Research Guide; Sustainable Tourism Pty Ltd.; CRC for Sustainable Tourism, 2002; ISSN 1876685352. [Google Scholar]
- Menezes, A.; Lima, R.M.; Aquere, A.L.; Amorim, M. An Adaptation of Servqual for Events Evaluation: An Environmental Sustainability Addon. Sustainability 2020, 12. [Google Scholar] [CrossRef]
- Higgins-Desbiolles, F.; Monga, M. Transformative Change through Events Business: A Feminist Ethic of Care Analysis of Building the Purpose Economy. J. Sustain. Tour. 2021, 29, 1989–2007. [Google Scholar] [CrossRef]
- Feirud, L. Introducing a Holistic Four-Stage Model of Sustainable Festival Management. In Services, Experiences, and Sustainability; Routledge, 2026; pp. 127–141. [Google Scholar]
- Collins, A.; Potoglou, D. Factors Influencing Visitor Travel to Festivals: Challenges in Encouraging Sustainable Travel. J. Sustain. Tour. 2019, 27, 668–688. [Google Scholar] [CrossRef]
- Elkington, J. Cannibals with Forks: The Triple Bottom Line of 21st Century Business; Capstone: Oxford, 1997; ISBN 1-900961-27-X. [Google Scholar]
- Mair, J.; Jago, L. The Development of a Conceptual Model of Greening in the Business Events Tourism Sector. J. Sustain. Tour. 2010, 18, 77–94. [Google Scholar] [CrossRef]
- Routledge (Ed.) Getz & Page Event Studies; Theory, Research and Policy for Planned Events, Fourth edition.; New York, 2020; ISBN 9780367085629. [Google Scholar]
- Suvittawat, A.; Janchai, N.; Seepho, S.; Nonthachai, J.; Nonthachai, I. Sustainable Food Festival Tourism: Integrating the Bio-Circular-Green (BCG) Model for Cultural and Environmental Resilience in Thailand. Sustainability 2025, 17. [Google Scholar] [CrossRef]
- Laing, J.; Frost, W. How Green Was My Festival: Exploring Challenges and Opportunities Associated with Staging Green Events. Int. J. Hosp. Manag. 2010, 29, 261–267. [Google Scholar] [CrossRef]
- Mair, J. Rethinking Event Sustainability. A Research Agenda for Event Management; Edward Elgar Publishing, 2019; ISBN 9781788114356. [Google Scholar]
- Oliver, R.L. A Cognitive Model of the Antecedents and Consequences of Satisfaction Decisions. J. Mark. Res. 1980, 17, 460–469. [Google Scholar] [CrossRef]
- Yoon, Y.S.; Lee, J.S.; Lee, C.K. Measuring Festival Quality and Value Affecting Visitors’ Satisfaction and Loyalty Using a Structural Approach. Int. J. Hosp. Manag. 2010, 29, 335–342. [Google Scholar] [CrossRef]
- Zeithaml, V.A.; Berry, L.L.; Parasuraman, A. The Behavioral Consequences of Service Quality. J. Mark. 1996, 60, 31–46. [Google Scholar] [CrossRef]
- Cole, S.T.; Illum, S.F. Examining the Mediating Role of Festival Visitors’ Satisfaction in the Relationship between Service Quality and Behavioral Intentions. J. Vacat. Mark. 2006, 12, 160–173. [Google Scholar] [CrossRef]
- Lee, Y.K.; Lee, C.K.; Lee, S.K.; Babin, B.J. Festivalscapes and Patrons’ Emotions, Satisfaction, and Loyalty. J. Bus. Res. 2008, 61, 56–64. [Google Scholar] [CrossRef]
- Chi, C.G.Q.; Qu, H. Examining the Structural Relationships of Destination Image, Tourist Satisfaction and Destination Loyalty: An Integrated Approach. Tour. Manag. 2008, 29, 624–636. [Google Scholar] [CrossRef]
- Cole, S.T.; Chancellor, H.C. Examining the Festival Attributes That Impact Visitor Experience, Satisfaction and Re-Visit Intention. J. Vacat. Mark. 2009, 15, 323–333. [Google Scholar] [CrossRef]
- Theodorakis, N.D.; Alexandris, K.; Tsigilis, N.; Karvounis, S. Predicting Spectators’ Behavioural Intentions in Professional Football: The Role of Satisfaction and Service Quality. Sport Manag. Rev. 2013, 16, 85–96. [Google Scholar] [CrossRef]
- Armbrecht, J. Event Quality, Perceived Value, Satisfaction and Behavioural Intentions in an Event Context. Scand. J. Hosp. Tour. 2021, 21. [Google Scholar] [CrossRef]
- Altschwager, T.; Conduit, J.; Karpen, I.O.; Goodman, S. Event Engagement: Using Event Experiences to Build Brands. Australas. Mark. J. 2024, 32. [Google Scholar] [CrossRef]
- Parasuraman, A.; Z.V.A., B.L.L. SERVQUAL: A Multiple-Item Scale for Measuring Consumer Perceptions of Service Quality. J. Retail. 1988, 64, 12–40. [Google Scholar]
- Pine, B.; Gilmore, J. The Experience Economy: Work Is Theatre and Every Business a Stage; Harvard Business School Press, 1999; pp. 45–67. [Google Scholar]
- Walls, A.; Okumus, F.; Wang, Y.; Kwun, D.J.W. Understanding the Consumer Experience: An Exploratory Study of Luxury Hotels. J. Hosp. Mark. Manag. 2011, 20, 166–197. [Google Scholar] [CrossRef]
- Crompton, J.L.; McKay John Howard Society, S.L. Motives of Visitors Attending Festival Events; 1997; Vol. 24, pp. 425–435. [Google Scholar]
- Mason, M.C.; Paggiaro, A. Investigating the Role of Festivalscape in Culinary Tourism: The Case of Food and Wine Events. Tour. Manag. 2012, 33, 1329–1336. [Google Scholar] [CrossRef]
- Pai, C.K.; Lee, T.; Kang, S. Examining the Role of Service Quality, Perceived Values, and Trust in Macau Food Festival. Int. J. Environ. Res. Public Health 2021, 18. [Google Scholar] [CrossRef] [PubMed]
- Jacinto, M.; Margarido, C.; Sousa, M.; Marques, J.; Varela, J.; Amaro, N.; Morquecho Sánchez, R.; Couto, N.; Matos, R.; Monteiro, D.; et al. Perceived Quality, Overall Service Quality, Overall Service Satisfaction, Perceived Service Value and Future Intentions of a Sport Event: Portuguese Triathlete Perceptions 2025, Vol. 25, 14–29.
- Buhalis, D. Marketing the Competitive Destination of the Future. Tour. Manag. 2000, 21, 97–116. [Google Scholar] [CrossRef]
- Gibbeson, C.; Westwood, C. Agricultural Shows: Connecting People, Place and Emotions. J. Rural Stud. 2025, 119. [Google Scholar] [CrossRef]
- Baker, D.A.; Crompton, J.L. Quality, Satisfaction and Behavioral Intentions. Ann. Tour. Res. 2000, 27, 785–804. [Google Scholar] [CrossRef]
- Westwood, C.; Schofield, P.; Berridge, G. Agricultural Shows: Visitor Motivation, Experience and Behavioural Intention. Int. J. Event Festiv. Manag. 2018, 9, 147–165. [Google Scholar] [CrossRef]
- Busick, B.; Leggette, H.; Briers, G.E.; Whitaker, H.; Parrella, J.A. Great Yorkshire Livestock Show Attendees’ Attitudes about Agriculture. J. Appl. Commun. 2023, 107. [Google Scholar] [CrossRef]
- Bosworth, G.; Price, L.; Ardley, B.; Westwood, C. Examining the Need for Organizational Learning and Entrepreneurialism to Meet the Changing Roles and Expectations of Rural and Agricultural Shows in the UK. J. Rural Stud. 2024, 106. [Google Scholar] [CrossRef]
- Bosworth, G.; Ardley, B.; Gerlach, S. Innovation in Agricultural and County Shows: Conceptualising the e-Eventscape. Int. J. Event Festiv. Manag. 2021, 12. [Google Scholar] [CrossRef]
- Mair, J.; Smith, A. Events and Sustainability: Why Making Events More Sustainable Is Not Enough. J. Sustain. Tour. 2021, 29. [Google Scholar] [CrossRef]
- Gobierno Provincial de Manabí Portoviejo June 20, 2026. Available online: https://www.eluniverso.com/noticias/ecuador/chone-espera-recibir-a-200000-visitantes-y-mover-10-millones-en-el-expocebu-nota/.
- Redacción El Universo. Chone June 20 2026, El Universo Programa EbA LAC en Ecuador participa con stand en feria ExpoCebú Chone 2024.
- Programa Escalando Medidas de Adaptación basada en Ecosistemas en América Latina (EbA LAC). Available online: https://ebalac.com/es/noticias/56-noticias/434-programa-eba-lac-en-ecuador-participa-con-stand-en-feria-expocebu-chone-2024 (accessed on 20 June 2026).
- Zambrano, L. Expreso. Chone October 24 2024. Available online: https://www.expreso.ec/actualidad/economia/manabi-encuentro-internacional-jueces-razas-cebu-expocebu-218018.
- da Silva Filho, J.A.; Santos, F.R.N. The Practice of the Auction as an Efficient Market Proposal for the Cattle Fair: The Case of Alagoas. Rev. De Econ. E Sociol. Rural 2020, 58. [Google Scholar] [CrossRef]
- Genovese, D.; Culasso, F.; Giacosa, E.; Battaglini, L.M. Can Livestock Farming and Tourism Coexist in Mountain Regions? A New Business Model for Sustainability. Sustainability 2017, 9, 2021. [Google Scholar] [CrossRef]
- Hu, L.T.; Bentler, P.M. Cutoff Criteria for Fit Indexes in Covariance Structure Analysis: Conventional Criteria versus New Alternatives. Struct. Equ. Model. 1999, 6, 1–55. [Google Scholar] [CrossRef]
- Kline, R.B. Principles and Practice of Structural Equation Modeling; Guilford Press., 2016; ISBN 978-1-4625-2335-1. [Google Scholar]
- Byrne, B.M. Structural Equation Modeling with AMOS : Basic Concepts, Applications, and Programming; Routledge/Taylor & Francis Group, 2016; ISBN 9781138797031. [Google Scholar]
- Gaskin, J.; Lim, J. “Model Fit Measures”, AMOS Plugin. [CrossRef] [PubMed]
- Doral Fábregas, F.; R.A.I., A.M.A. Modelos de Ecuaciones Estructurales En Investigaciones de Ciencias Sociales: Experiencia de Uso En Facebook. Rev. Cienc. Soc. 2018, XXIV, 22–40. [Google Scholar] [CrossRef]
- Gobierno Autónomo Descentralizado Municipal del cantón Chone Chone. 2026.
- Barbosa, F.S.; Scavarda, A.J. Value Chain of Mega Events: A Case Study of an Agricultural Trade Fair. Gest. E Prod. 2018, 25, 626–644. [Google Scholar] [CrossRef]
- Vodanović Lukić, I. I Feel at Home: Visitors’ Perspective of Arts Festivals in Croatia. Eur. Countrys. 2025, 17, 153–171. [Google Scholar] [CrossRef]
- Ferreira, S.; Batista, P.; Sánchez-Sáez, J.A.; Sánchez-Sánchez, J.; Carvalho, M.J. Road Racing Event Management Satisfaction: A Scoping Review of the Literature in Different Populations. Sustainability 2023, 15. [Google Scholar] [CrossRef]
- Silva Barbosa, F.; Scavarda, A.J. Value Chain of Mega Events: A Case Study of an Agricultural Trade Fair. Gest. E Prod. 2018, 25, 626–644. [Google Scholar] [CrossRef]
- Le, T.H.; Abreu Novais, M.; Arcodia, C.; Berchtenbreiter, R.; Humpe, A.; Nguyen, N. How Authenticity in Events Fosters Social Sustainability: Towards an Authenticity Ecosystem and Implications for Destination Management. Tour. Manag. Perspect. 2024, 51. [Google Scholar] [CrossRef]
- Raspor Janković, S.; Marković, S.; Drpić, D. What Enhances Event Experience Satisfaction? Examining the Role of Event Experience Quality Dimensions. Zb. Veleučilišta U Rijeci 2025, 13, 149–170. [Google Scholar] [CrossRef]
- Du, J.; Kennedy, H.; James, J.D.; Funk, D.C. Leveraging Event Participation Benefits beyond the Running Course: Deciphering the Motivational Basis of Event Satisfaction. J. Sport Manag. 2020, 34, 435–446. [Google Scholar] [CrossRef]
- Alsiehemy, A. Events-Based Service Quality and Tourism Sustainability: The Mediating and Moderating Role of Value-Based Tourist Behavior. Sustainability 2023, 15, 5303. [Google Scholar] [CrossRef]
- Mair, J.; Wood, E.; Quinn, B. Social Sustainability in Event Management: A Critical Commentary. Event Manag. 2024, 28, 1101–1108. [Google Scholar] [CrossRef]
Figure 1.
Conceptual model of visitor satisfaction and sustainable event management.
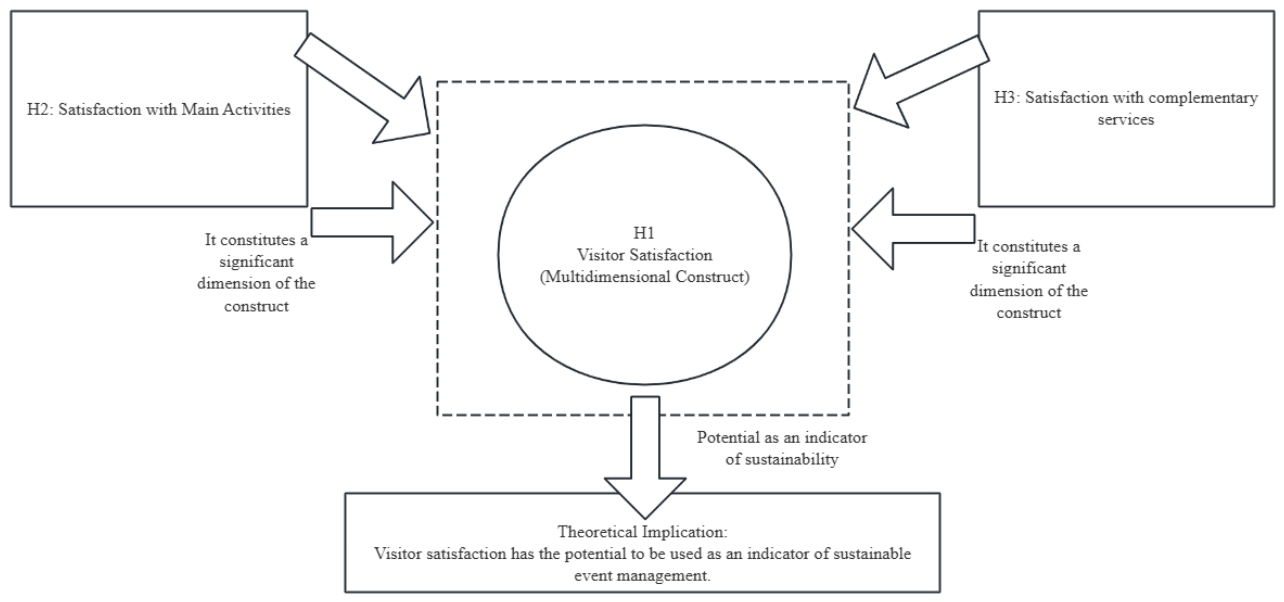
Figure 2.
Level of satisfaction with the activities and services at Expo Cebu Chone 2024.
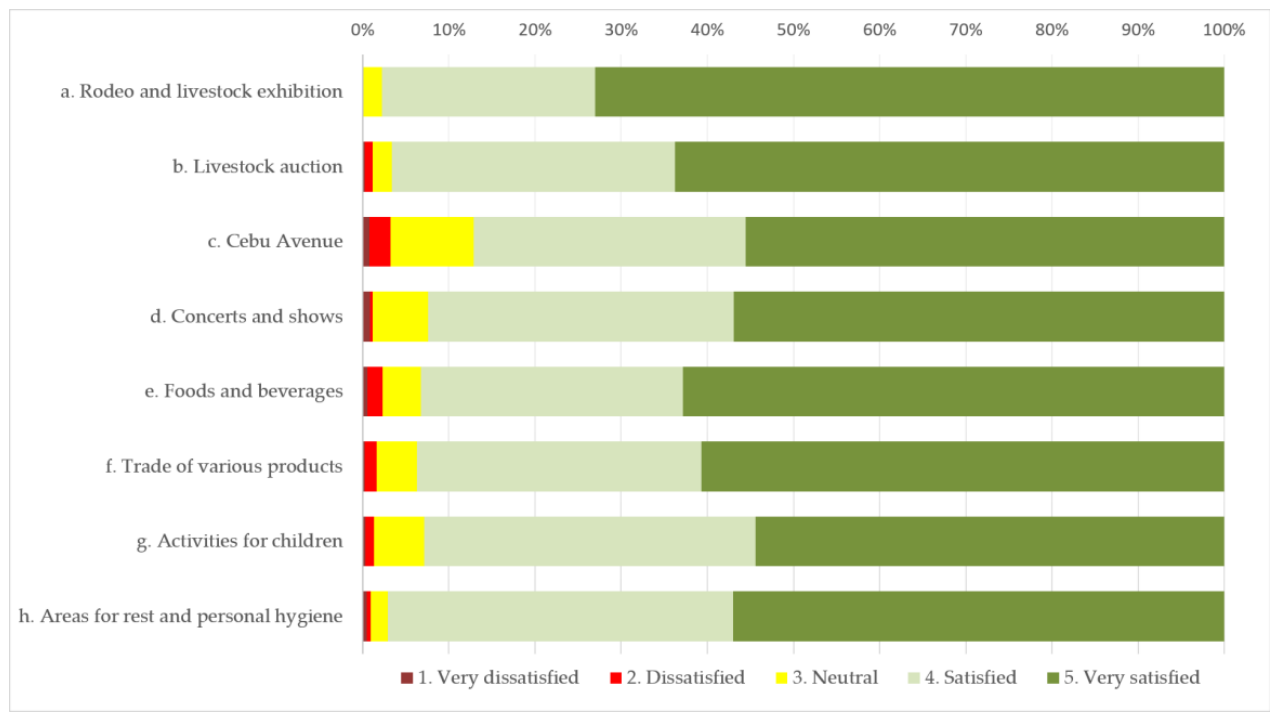
Figure 3.
Two-dimensional confirmatory factor model of visitor satisfaction.
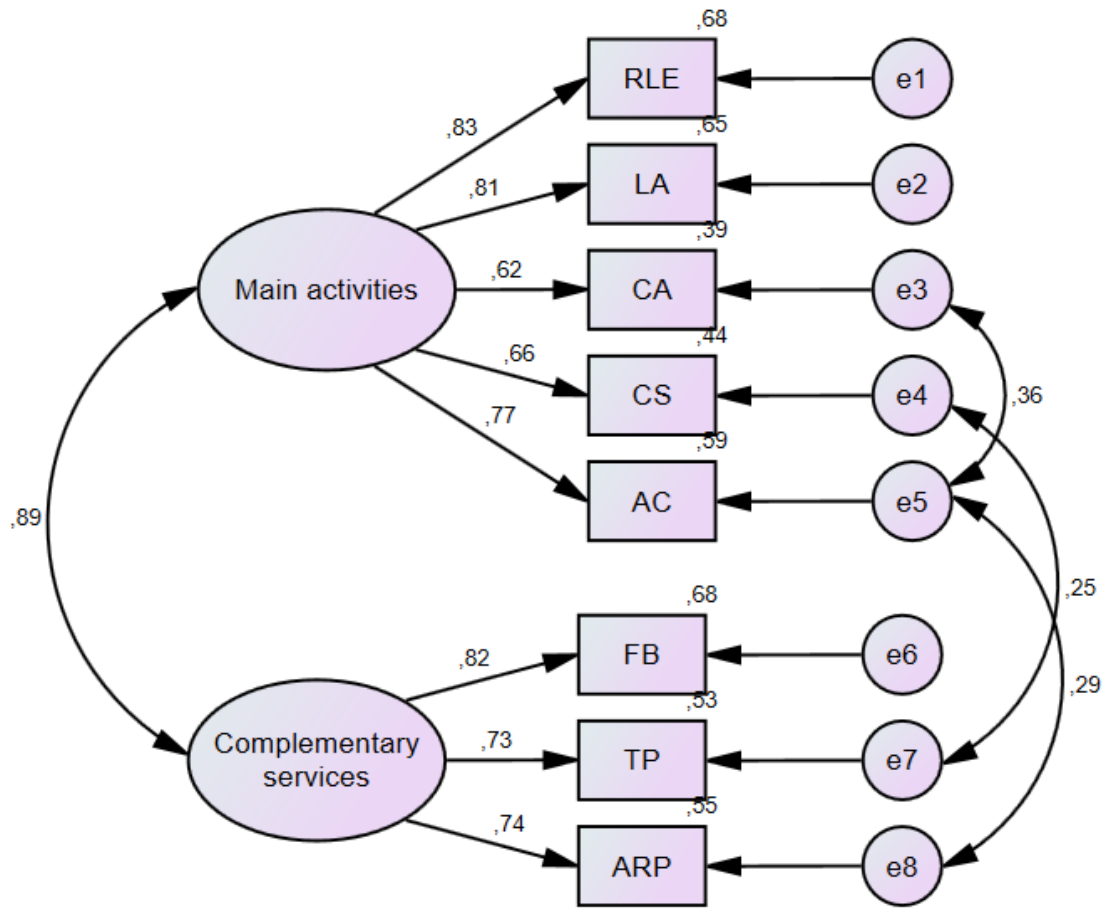

Table 1.
Sociodemographic characteristics of the sample.
| Features | Frequency | % | |
|---|---|---|---|
| Gender | Male | 449 | 46,7 |
| Female | 493 | 51,2 | |
| Other | 20 | 2,1 | |
| Age group | 18-24 | 21 | 2,2 |
| 25–34 | 201 | 20,9 | |
| 35–44 | 289 | 30 | |
| 45–54 | 229 | 23 | |
| 55–64 +65 |
127 103 |
13,2 10,7 |
|
| Education | None | 5 | 0,5 |
| Primary | 30 | 3.1 | |
| Secondary or Baccalaureate | 284 | 29,5 | |
| University | 643 | 66,8 | |
| Place of residence | Foreign | 20 | 2,1 |
| Sierra | 47 | 4,9 | |
| Galapagos | 2 | 0,2 | |
| Amazon | 5 | 0,5 | |
| Costa No Manabí | 101 | 10,5 | |
| Manabí | 342 | 35,6 | |
| Chone | 445 | 46,3 | |
Table 2.
Rotated component matrix and descriptive statistics (AFE).
| Breakdown of Factors |
Commonalities |
Factor Loading | Mean | Standard Deviation |
|---|---|---|---|---|
|
Factor 1. Main activities RLE – a. Rodeo and livestock exhibition |
0,662 | 0,509 | 4,71 | 0,484 |
| LA – b. Livestock auction | 0,632 | 0,564 | 4,65 | 0,528 |
| CA – c. Cebu Avenue | 0,850 | 0,910 | 4,58 | 0,643 |
| CS – d. Concerts and shows | 0,531 | 0,563 | 4,56 | 0,595 |
| AC – g. Activities for children | 0,749 | 0,717 | 4,60 | 0,539 |
| Factor 2. Complementary Services | ||||
| FB – e. Foods and beverages | 0,694 | 0,850 | 4,61 | 0,621 |
| TP – f. Trade of various products | 0,747 | 0,761 | 4,57 | 0,603 |
| ARP – h. Areas for rest and personal hygiene | 0,648 | 0,726 | 4,58 | 0,598 |
| Extraction method: principal component analysis. Rotation method: Varimax with Kaiser normalization. | ||||
Table 3.
Goodness-of-fit indices and recommended thresholds.
| Type of fit | Fit index | Abbreviation | Criterion | Value | Evaluation |
|---|---|---|---|---|---|
| Absolute fit |
Chi-Square divided by Degrees of Freedom | χ²/gl (CMIN/DF) | < 3 | 2.660 | Meets criterion |
| Standardized Root Mean Square Residual | SRMR | < 0.08 | 0.030 | ||
| Root Mean Square Residual | RMR | < 0.05 | 0.0268 | ||
| Goodness-of-Fit Index | GFI | > 0.90 | 0.971 | ||
| Adjusted Goodness-of-Fit Index | AGFI | > 0.90 | 0.935 | ||
| Root Mean Square Error of Approximation | RMSEA | < 0.08 | 0.068 | ||
| Probability of Close Fit | PCLOSE | > 0.05 | 0.102 | Close fit not rejected | |
| Incremental fit |
Normed Fit Index | NFI | > 0.90 | 0.973 | Meets criterion |
| Relative Fit Index | RFI | > 0.90 | 0.952 | ||
| Incremental Fit Index | IFI | > 0.90 | 0.983 | ||
| Tucker-Lewis Index | TLI | > 0.90 | 0.970 | ||
| Comparative Fit Index | CFI | > 0.95 | 0.983 | ||
| Parsimonious fit | Parsimony Ratio | PRATIO | > 0.50 | 0.571 | Meets criterion |
| Parsimony Normed Fit Index | PNFI | > 0.50 | 0.556 | ||
| Parsimony Comparative Fit Index | PCFI | > 0.50 | 0.562 |
Table 4.
Levels of convergent validity (AVE) and composite reliability (CR).
| Construct | AVE ≥ 0.50 | CR ≥ 0.70 | Result |
|---|---|---|---|
| Factor 1. Main Activities | 0.552 | 0.859 | Meets requirements |
| Factor 2. Complementary Services | 0.584 | 0.808 | Meets requirements |
Disclaimer/Publisher’s Note: The statements, opinions and data contained in all publications are solely those of the individual author(s) and contributor(s) and not of MDPI and/or the editor(s). MDPI and/or the editor(s) disclaim responsibility for any injury to people or property resulting from any ideas, methods, instructions or products referred to in the content. |
© 2026 by the authors. Licensee MDPI, Basel, Switzerland. This article is an open access article distributed under the terms and conditions of the Creative Commons Attribution (CC BY) license (http://creativecommons.org/licenses/by/4.0/).
Copyright: This open access article is published under a Creative Commons CC BY 4.0 license, which permit the free download, distribution, and reuse, provided that the author and preprint are cited in any reuse.